Flooding Stress and High-Pressure Treatment Enhance the GABA Content of the Vegetable Soybean (Glycine max Merr.)


Department of Horticulture and Landscape Architecture, National Taiwan University, No. 1, Section 4, Roosevelt Road, Taipei 10617, Taiwan
*
Author to whom correspondence should be addressed.
Agriculture 2020, 10(5), 175; https://doi.org/10.3390/agriculture10050175
Submission received: 6 April 2020
/
Revised: 13 May 2020
/
Accepted: 14 May 2020
/
Published: 15 May 2020
(This article belongs to the Special Issue Innovative Cultivation Techniques to Improve the Nutritional Quality of Vegetables)
Abstract
:γ-aminobutyric acid (GABA) is the chief inhibitory neurotransmitter in the central nervous system and of substantial physiological significance to mammals. The GABA content of plants is generally low; however, it increases significantly when plants encounter stress. The present study investigates the effects of flooding stress and high-pressure processing on GABA content enrichment in the vegetable soybean (Glycine max Merr.) cultivar Kaohsiung No. 9 and potential mechanisms. Results indicate that flooding stress increased the GABA content of vegetable soybean kernels, with the possible mechanism involving the upregulation of glutamic acid decarboxylase 5 (GAD5) and aminoaldehyde dehydrogenase (AMADH) and downregulation of succinate semialdehyde dehydrogenase (SSADH). High-pressure treatment increased the GABA content through increased GAD activity. A specific combination of flooding stress, high-pressure treatment, and storage treatment enhanced vegetable soybean GABA content up to 696.6 ± 65.7 mg/100 g. Flooding treatment prior to harvesting did not cause differences in consumption quality. These results show that flooding stress and high pressure treatment can increase GABA content and enhance the functional value of the vegetable soybean cultivar Kaohsiung No. 9.
1. Introduction
γ-aminobutyric acid (GABA) is a four-carbon non-protein amino acid widely found in plants, animals, and microorganisms. It was first isolated from potato tubers and subsequently discovered in animal brain extracts during the mid-20th century [1,2,3,4]. GABA is an inhibitory neurotransmitter that binds to receptor sites in the central nervous system of vertebrates; it is known that at least 40% of inhibitory synaptic processing in the mammalian brain uses GABA [5]. With its multiple health-promoting effects such as the alleviation of anxiety and depression, lowering of blood pressure, improvement of sleep, immunoregulation, alleviation of hangover symptoms, diuresis, improvement of kidney function, enhancement of cognitive abilities, and promotion of growth hormone secretion, GABA possesses great potential in the prevention and treatment of brain disorders such as Parkinson's disease, epilepsy, Alzheimer's disease, and depression [6,7,8,9,10,11,12,13]. Therefore, research on GABA has become increasingly popular. Under normal circumstances, the endogenous levels of GABA in plant tissues are extremely low, ranging from 0.03–32.5 μmol/g fresh weight [14]. In the presence of environmental stimuli or stresses, response mechanisms and signal transmission are induced, leading to the accumulation of GABA [15,16].
In plants and animals, there are two major pathways for the biosynthesis of GABA. The first is a short biochemical pathway known as the GABA shunt, which is mainly composed of three enzymes: glutamate decarboxylase (GAD; EC 4.1.1.15), GABA transaminase (GABA-T; EC 2.6.1.19), and succinic semialdehyde dehydrogenase (SSADH; EC 1.2.1.16). In particular, GAD, which catalyzes the conversion of L-glutamate to GABA and CO2, is the rate-limiting enzyme of GABA synthesis. Maximum GAD activity is achieved at pH 5.8, and GAD, which directly influences GABA content, is regulated by calcium ion concentration, calmodulin, and pyridoxal phosphate in cells [17,18,19,20]. Under appropriate stress conditions, plant cells experience a decrease in intracellular pH and a change in calcium ion concentration, forming a favorable reaction environment which increases GAD activity and results in GABA accumulation [18,19]. Under the catalysis of GABA-T, GABA can be converted to succinic semialdehyde (SSA), which is either oxidized to succinate by SSADH and enters the citric acid cycle (TCA) or reduced to γ-hydroxybutyrate by SSA reductase (SSAR) [15].
The second pathway for GABA biosynthesis is the polyamine degradation pathway. Ornithine and arginine are respectively converted by ornithine decarboxylase (ODC) and arginine decarboxylase (ADC) into putrescine (Put), which is in turn oxidized to γ-aminobutyraldehyde by diamine oxidase (DAO; EC 1.4.3.6) and subsequently converted to GABA by aminoaldehyde dehydrogenase (AMADH) [21]. Put can also be converted by spermidine synthase (SPDS) and spermine synthase (SPMS) into spermidine (Spd) and spermine (Spm), respectively; the former is subsequently converted to GABA by polyamine oxidase (PAO) [22].
With climate change and global warming, flood events have become potential high-risk natural disasters and flood frequency is expected to increase [23]. Studies conducted by Mittler [24] and Valliyodan et al. [25] have indicated that flooding ranks second among abiotic stresses that cause severe economic losses in soybean. Therefore, the influence of flooding on plants and the relevant regulatory mechanisms deserve research attention. Flooding usually imposes stress upon terrestrial plants due to the limited solubility and slow diffusion of oxygen in water. This leads to hypoxia in cells, which results in an insufficient supply of nutrients and the production of ethanol and CO2. With long-term hypoxia, excessive ethanol accumulation occurs in plant tissues, which causes structural damage to cell and organelle membranes [26]. In addition, the excessive production of CO2 also reduces cytoplasmic pH and affects cellular functions. Hypoxia promotes the activation of enzymes related to the interconversion of pyruvate, alanine, and GABA, and increases the content of the GABA precursors L-glutamate and polyamines, resulting in an increase in alanine and GABA content. Such amino acid interconversions can reduce the extent of cytoplasmic pH reduction, alleviate carbon losses caused by the conversion of pyruvate to lactate and ethanol, and decrease ethanol toxicity [27,28]. From the physiological mechanisms of Arabidopsis subjected to low-oxygen stress, it has been deduced that increase in GABA is most likely regulated by post-translational mechanisms [29].
High-pressure processing (HPP) refers to the application of a high level of isostatic pressure (100–1000 MPa) to food products. This results in the disruption of non-covalent bonds in macromolecules at a relatively low temperature, thereby achieving inhibition of microbial growth, reduction or conversion of enzymatic activity, and promotion of component extraction. HPP is a relatively new food processing method which can retard food spoilage, extend shelf life, and maintain the quality, hygiene, and safety of food products while retaining their nutritional value [30,31]. A study by Serment-Moreno et al. [32] reported that pressure levels under 100 MPa appear to induce oxidative stress in plant tissue, leading to the synthesis of secondary metabolites; pressures of 150–200 MPa result in cellular membrane rupture, increased cell wall permeability, and nearly complete cell viability loss while metabolic activity gradually ceases at higher pressure; pressures of 200–400 MPa cause damage to cellular structures, leading to the release of carotenoids entrapped inside cellular organelles into the cytoplasm and resulting in increased electrical conductivity and reduced pH, which enhances the enzymatic activity of GAD and consequently increases the GABA content of downstream metabolites.
The vegetable soybean (Glycine max (L.) Merr.) is a species belonging to the family Fabaceae and genus Glycine. Fresh vegetable soybean pods are usually harvested upon development to 80% plumpness; at this stage, pods exhibit a green appearance and are not yet fully mature. Vegetable soybean is rich in various nutrients, including proteins, lipids, carbohydrates, fibers, ash, minerals, and vitamins, and has a relatively high GABA content compared with other common bean species [33]. At present, studies on GABA in vegetable soybean are relatively scarce. Takahashi et al. [34] found that the expression levels of the GABA downstream enzymes GABA-T and SSADH in vegetable soybean decreased during the processes of heating and drying, resulting in GABA accumulation. However, studies on the influence of flooding stress and HPP on the GABA content of vegetable soybean have not yet been reported. In the present study, the vegetable soybean cultivar Kaohsiung No. 9 was subjected to different flooding stress conditions and HPP, and the GABA contents of various vegetable soybean parts were measured during different days of storage to determine the optimum conditions for GABA enrichment. Subsequently, the expression of GABA-related genes and GAD activity were investigated to elucidate the possible GABA enrichment and regulatory mechanisms.
2. Materials and Methods
2.1. Materials
Plants of the vegetable soybean cultivar Kaohsiung No. 9 were planted in Cishan District, Kaohsiung City, Taiwan. Four days prior to harvesting, flooding treatment that lasted for 4 consecutive days was performed (flooding treatment: irrigation water is injected into the farmland so that the water surface is 2 cm above the medium to produce a flooded environment, and the normal irrigation plants are used as the control group) and vegetable soybeans were harvested from 100 plants of the flooding group and 100 plants of the control group after each day of flooding. Vegetable soybean samples subjected to different flooding treatments were washed and pat dry, and 20 g each of whole vegetable soybeans, pods, and kernels were randomly selected, weighed, respectively placed in polyethylene (PE) bags and vacuum-sealed, and subjected to HPP at 200 MPa and 300 MPa for 10 min. After HPP (600 MPa 6 L, Bao Tou KeFa High Pressure Technology Co. Ltd, Inner Mongolia, China), the samples were stored in a 4 °C refrigerator for 0, 3, and 5 days prior to the measurement of GABA content. The control group consisted of samples that were treated using the processes described above with the exception of HPP. GABA (99% purity, CAS No. 56-12-2) was purchased from Sigma-Aldrich Co. Ltd. (St. Louis, MO, USA).
2.2. Analysis of GABA Content
In the present study, pre-column derivatization with phenyl isothiocyanate (PITC) and high-performance liquid chromatography (HPLC)-ultraviolet (UV) detection were adopted for the analysis of GABA content. Vegetable soybean samples were subjected to a two-stage oscillation extraction process using 70% ethanol, which was modified from the cold ethanol extraction method reported by Rozan et al. [35] and Chen et al. [33]. Powdered sample (0.5 g) was added to 5 mL of 70% ethanol, the resultant mixture was placed on an oscillator for oscillation extraction at 1350 rpm for 1 h and centrifuged at 34,800× g for 10 min at 4 °C, and the supernatant was collected. The residue was redissolved in 4 mL of 70% ethanol, the mixture was subjected to oscillation extraction at 1350 rpm for 1 h followed by centrifugation under the same conditions described above, and the supernatant was collected. The supernatants collected after the two centrifugation processes were regarded as crude GABA extracts and stored at −20 °C. GABA derivatization was performed with PITC as the derivatization agent using a method modified from those reported by Rozan et al. [35]. An appropriate amount of the sample extract or standard solution was vacuum dried (37 °C, 20 mmHg), 20 μL of a coupling reagent (methanol:water:triethylamine 2:2:1, v/v/v) were added, and the mixture was vacuum dried again after adequate mixing. Then, 30 μL of PITC reagent (methanol:water:trimethylamine:PITC: 7:1:1:1, v/v/v/v) were added, and the mixture was set aside for reaction at room temperature for 20 min. After reaction, the resultant mixture was vacuum dried for the complete removal of PITC. The PITC derivatives were redissolved in 1000 μL of solvent A (containing 11.45 g CH3COONa per L of solution; 0.5 mL of triethylamine (TEA), 65 mL of acetonitrile and 1.07 mL 0.1% ethylenediaminetetraacetic acid (EDTA) were added, and the pH of the solution was adjusted to 5.3 using acetic acid) and subjected to HPLC analysis.
The HPLC analysis method used in the present study was modified from the methods reported by Cohen and Strydom [36]. In a C18 reversed-phase column (Alltima C18 5U, 250 × 4.6 nm, 40 °C), the two mobile phases, solvent A and solvent B (60% (v/v) acetonitrile/H2O) were mixed in different proportions to enable the extraction of GABA. First, solvent A was passed through the column until 0.5 min, after which replacement with solvent B was started until a complete switch to solvent B at a flow rate of 1.5 mL/min was achieved at 10.5 min. At 29.0 min, solvent A was passed through the column at a flow rate of 1.0 mL/min, and detection was performed at a wavelength of 254 nm. A 0.5 mg/mL GABA stock solution was diluted to solutions with eight different concentrations (0.00625, 0.0125, 0.025, 0.05, 0.1, 0.2, 0.3, and 0.4 mg/mL). The standard curve was prepared by the internal standard method for calibration and determination of the accuracy of the retention time. The standard curve was drawn, and the regression equation calculated as the concentration ratio of each control sample to the internal standard solution (0.1 mg/mL) as the horizontal coordinate, and the peak area ratio as the vertical coordinate. The GABA internal standard regression equation: y = 0.0412x + 0.0538 (R2 = 0.9999). The obtained solutions were subjected to HPLC analysis after derivatization. By plotting the concentrations of the GABA standard on the X axis and the integral peak areas of the GABA standard on the Y axis, the calibration curve was constructed to form the basis of the quantitative analysis of samples.
2.3. Determination of Vegetable Soybean Quality
Common quality indicators used for vegetable soybean were adopted for the determination of vegetable soybean quality in the present study.
- (1)
- The total number of pods and number of poor-quality pods of each plant were counted and recorded with 100 replicates.
- (2)
- Number of qualified pods per 500 g of pods (pod/500 g): 500 g of pods were randomly selected and weighed for the calculation of the number of qualified pods per 500 g of pods, with three replicates. Subsequently, the qualified pods and off-grade pods were separated.
- (3)
- Color measurement: Thirty whole vegetable soybeans were randomly selected from the qualified pods, and the color of the pods was measured in terms of L, a, and b values using a NE4000 color meter (Nippon Denshoku Industries Co. Ltd., Tokyo, Japan) and expressed as hue angle.
- (4)
- Hundred-kernel weight (g): Kernels were separated from a portion of qualified pods, and 100 kernels were randomly selected and weighed to obtain the hundred-kernel weight with three replicates.
- (5)
- Pod and kernel dimensions (mm): Thirty whole vegetable soybeans and 30 kernels were randomly selected for the measurement of pod and kernel dimensions.
- (6)
- Hardness and brittleness (g·sec): 30 kernels were randomly selected for the measurement of hardness and brittleness using a TA.XTplus Texture Analyser (Stable Micro Systems, Godalming, UK). After the investigation of vegetable soybean quality, the different vegetable soybean parts, including roots, stems, leaves, whole vegetable soybeans, pods, and kernels, were separately stored in PE bags for subsequent GABA content measurement.
2.4. Consumer Evaluation of Vegetable Soybean Samples
Consumer acceptance testing was adopted for the consumer evaluation of vegetable soybeans. A 9-point interval scale was used, with one evaluation form used for the evaluation of a single sample. The consumer evaluation process was performed in an odor-free, noise-free, and distraction-free space with good ventilation. Evaluators were asked to indicate their overall liking for each sample and the degrees of preference for sample appearance, aroma, flavor, taste, and aftertaste on a 9-point continuous scale. In addition, to determine the differences in evaluation characteristics between samples, a certain number of checkboxes describing the product characteristics of appearance, aroma, flavor, taste, and aftertaste were provided in the evaluation forms for checking by the evaluators. More than 60 evaluators participated in the present study. All evaluators were non-professional evaluators aged 20–45 years without sensory defects, oral or gum discomfort, or allergy to vegetable soybean.
Vegetable soybeans in one of the most common forms of consumption were used for evaluation. Kaohsiung No. 9 vegetable soybeans subjected to different flooding treatments were washed and patted dry, and 150 qualified plump vegetable soybeans with largely similar appearances and morphologies (e.g., bright green color with no yellowing and spotting) and containing at least 2 kernels per pod were manually selected. The vegetable soybeans were cooked in saltwater and subsequently cooled at 4 °C for 1 day. Evaluators were asked to evaluate the vegetable soybeans. Each group of evaluation samples consisted of 2 pods, and a total of 8 treatment groups were established, namely 1–4 days of flooding treatment and control groups of corresponding durations (1–4 days). All samples were evaluated by at least 60 evaluators.
2.5. Analysis of mRNA Expression of GABA-Related Enzymes
The experiment was conducted using the Maxwell RSC Plant RNA Kit (Promega, Madison, WI, USA) in accordance with the manufacturer’s instructions. Total RNA was extracted using the Maxwell® RSC Instrument (Promega, Madison, WI, USA), and reverse transcription was performed using the GoScriptTM Reverse Transcription Mix and Oligo (dT) (Promega, Madison, WI, USA) in accordance with the manufacturer’s instructions. Then, 10 μL of reverse transcription mix (containing 4 μL of nuclease-free water, 4 μL of reaction buffer (dT), and 2 μL of enzyme mix) were added to 2 μL of RNA sample and 8 μL of nuclease-free water on ice, forming a reaction system with a total volume of 20 μL. The mixture was gently mixed and reacted for 5 min at 25 °C for primer annealing, heated to 42 °C and reacted for 1 h to achieve extension, and finally heated to 70 °C for 15 min to inhibit the activity of reverse transcriptase. PCR was performed with 0.5 μL of cDNA, 2 μL of forward primer, 2 μL of reverse primer (Table 1) [21,34,37], 3.5 μL of GoTaq Green Master Mix (Promega, Madison, WI, USA), and 4.5 μL of sterile water (total volume of 12.5 μL) using a Veriti 96 well thermal cycler (Applied Biosystems, Foster city, CA, USA) under the following conditions: 1 cycle of 95 °C for 10 m; 40 cycles of 95 °C for 15 s, 55 °C for 30 s, 72 °C for 20 s; and 1 cycle of 72 °C for 15 s. The sizes of the PCR products were determined via electrophoresis using a 2% agarose gel, and the mRNA expression levels of GABA-related enzymes were measured by comparing the relative brightness of the bands.
2.6. Analysis of GAD Activity
The method for analyzing GAD activity was from Bai et al. [38] and Yang et al [28]. First, 5 mL of potassium phosphate buffer (70 mM, pH 5.8) containing 2 mM 2-mercaptoethanol, 2 mM EDTA, and 0.2 mM pyridoxal phosphate (PLP) was added to 1 g of powdered vegetable soybean sample on ice. The mixture was centrifuged at 30,000× g for 20 min at 4 °C, and the supernatant was collected and named as the enzyme extract. Then, 200 μL of the enzyme extract were mixed with 100 μL of substrate (1% L-glutamic acid, pH 5.8) to form the reaction solution and reacted at 40 °C for 1 h, followed by heating to 90 °C for 5 min to terminate the enzymatic reaction. The solution was then centrifuged at 14,800× g for 10 min, and the supernatant was collected for GAD testing. Using the Bradford protein assay [39], total soluble protein was determined by measuring absorbance at 595 nm. GAD activity was expressed in U, with 1 U representing the GAD activity required for the production of 1 μmol of GABA per hour from 1 mg of total soluble protein (μmol h−1 mg protein−1).
2.7. Statistical Analysis
Analysis of variance (ANOVA) was performed using XLSTAT software (Addinsoft, Long Island city, NY, USA). Tukey’s honestly significant difference test (Tukey’s HSD) was used to test the differences between means for the two types of treatments, and the significance level (α) was set as 0.05. Results of statistical analysis were denoted by uppercase and lowercase letters next to the data, with different letters indicating significant differences.
3. Results and Discussion
3.1. Influence of Flooding Stress and Storage on the GABA Content of Various Vegetable Soybean Parts of Kaohsiung No. 9
Table 2 shows that among the three tested vegetable soybean parts of Kaohsiung No. 9, kernels had a high GABA content and pods had a relatively low GABA content. Among the samples that did not undergo storage treatment, the GABA content of kernels subjected to one day of flooding treatment increased significantly, with an approximately 90% increase compared with the non-flooding group. Such decreases in GABA content after four days of flooding may be due to the aggravation of physiological stress. Consequently, to maintain basal metabolism, GABA was converted to the downstream products, which entered the TCA as carbohydrate supplements for respiration [28]. Among the samples subjected to flooding treatment followed by storage treatment, pods subjected to one day of flooding treatment and 3–5 days of storage treatment exhibited significant increases in GABA content, with increases of 266%–392% compared with the non-storage group. In particular, vegetable soybeans subjected to one day of flooding treatment had a significantly higher GABA content after five days of storage compared with the non-flooding group, with the GABA content being 1.4 times that of the non-flooding group. All parts of vegetable soybeans subjected to three days of flooding experienced a significant increase in GABA content during the five-day storage period, with the optimum GABA contents achieved on the third day of storage. Specifically, the enhancement of GABA content was most significant in the kernels, with the GABA content reaching 576.1 ± 53.8 mg/100 g. This was the highest GABA content achieved through flooding and storage treatments, being 130% and 57% higher than the GABA contents of the non-storage and non-stress groups, respectively.
The effects of different stress treatments on the enhancement of GABA content were compared. The free amino acid content in the xylem sap increased from 2.68 to 3.99 mM and the GABA concentration increased by 49% in response to drought treatment through evapotranspiration from soil. In addition, the increase in the GABA content was accompanied by a reduction in the relative water content of the soil, with the GABA content in the leaves and root nodules being higher than that in the roots. The GABA content in soybean leaves and root nodules increased significantly in response to drought treatment with polyethylene glycol (PEG) [40]; the GABA content in sesame increased by 12% and 33% on days 7 and 21 of the treatment, respectively [41]. In a study by Yang et al. [42], soybeans were soaked in distilled water for 6 h to create an anoxic environment and the GABA content measured at 48 h after germination was 2.22 times that of the content at 0 h. The results of the study also proved that storage induces a continuous increase in the GABA content. It was observed that storage at −18 °C for 12 h was optimal for GABA accumulation in soybean sprouts, with the GABA content in the treated soybean sprouts being 7.21 times that of the untreated group. In another study, it was reported that approximately 30% of the hypoxia-induced increase in the GABA content was attributed to polyamine degradation and 70% was induced by the GABA shunt. This indicates that glutamic acid decarboxylase (GAD) is the primary enzyme responsible for GABA production under hypoxic stress [28], which is consistent with the results of the present study. Therefore, flooding stress can enhance the GABA content in soybean. The vital activities in plants can continue and stress signals are transmitted through Ca2+ signaling under low-temperature stress conditions (4 °C), leading to an increase in the GABA content during storage.
3.2. Influence of Flooding Stress on the Quality of Kaohsiung No. 9
Observations of the external appearance of the vegetable soybean plants did not reveal significant differences between the control and flooding stress groups (data not shown). Table 3 shows that the total pod number per plant of the control groups ranged from 7–14, while the flooding stress groups had 13–18 pods per plant. Although the total pod number per plant differed significantly within the same group, the influences of individual differences were minimized by selecting 100 samples for each treatment. Therefore, the results clearly indicated that the total pod number per plant of the flooding treatment group for each duration of flooding treatment was higher than that of the corresponding control group. The number of qualified pods per 500 g of vegetable soybean plants subjected to three days of flooding treatment decreased by 46% compared with the corresponding control group, while no significant differences were identified between the other flooding treatment groups and the corresponding control groups. The color of the pods was also measured to determine the absence or presence of yellowing, with the extent of yellowing expressed as hue angle, which was calculated from the measured L, a, and b values of each pod. From the hue angle results (Table 3), it can be seen that pod color did not differ significantly between the flooding treatment groups and control groups, with hue angles ranging from 103–104. This indicates that flooding stress encountered four days before harvesting did not result in pod color deterioration.
When the dimensions of the pods and kernels of the various groups were compared (Table 3), it was found that kernels subjected to one and two days of flooding were heavier compared with the corresponding control groups, with the hundred-kernel weight being 15.8%–16.8% higher. No significant differences in hundred-kernel weight were found between the groups subjected to three and four days of flooding and the corresponding control groups (p < 0.05). This shows that four days of flooding treatment prior to harvesting did not influence the size of vegetable soybean pods and kernels. The results of the experiment on kernel texture (Table 4) indicated that kernel hardness of the one-day flooding treatment group was higher than that of the corresponding control group, but significant differences in kernel hardness were not found between other flooding stress groups and their corresponding control groups. Kernels of plants subjected to four days of flooding treatment had higher brittleness compared with the corresponding control group, while other flooding stress groups did not show significant differences in brittleness compared with the corresponding control groups. Results of the consumer acceptance evaluation revealed no significant differences between the flooding treatment groups and the corresponding groups for the overall liking of each sample and the degrees of preference for sample appearance, aroma, flavor, taste, and aftertaste.
In a previous study, it was reported that brown rice subjected to HPP at 200 MPa after soaking had a GABA content of 21 mg/100 g and its flavor was enhanced after cooking, compared to that of germinated brown rice [43]. The sensory evaluation results of the present study also indicated that the flooding treatment did not alter the quality of cultivar Kaohsiung No. 9. Therefore, under the premise that the commercial value of vegetable soybean is maintained, the GABA content can be increased to enhance the added value and functional effects in vegetable soybean.
3.3. Influence of Flooding Treatment with Subsequent HPP and Storage on the GABA Content of Kaohsiung No. 9
Table 5 shows the influences of different flooding treatments coupled with different HPP treatments and different storage durations on the GABA content of Kaohsiung No. 9. From the changes in GABA content of the various parts of Kaohsiung No. 9 plants subjected to different flooding treatments (1–4 days), different HPP treatments (200 MPa and 300 MPa), and 0 days of storage, it was found that HPP could increase the GABA content of the Kaohsiung No.9 vegetable soybean by approximately 33%–208%. The influence of HPP at 200 MPa was greater than that of HPP at 300 MPa, with the effects being most pronounced in the kernels. However, the GABA content of pods subjected to four days of flooding treatment decreased significantly by 45% after HPP at 300 MPa. The GABA content of whole vegetable soybeans subjected to one day of flooding treatment increased to 420.0 ± 39.6 mg/100 g after HPP at 200 MPa, which was a 35% increase compared with the corresponding non-flooding control group. This indicates that HPP produced a more significant influence on the GABA content of Kaohsiung No. 9 compared with flooding stress.
From the changes in GABA content of the various parts of Kaohsiung No. 9 plants subjected to different flooding treatments, different HPP treatments, and three days of storage (Table 5), it was found that HPP and three days of storage treatment increased GABA content by 30%–306% compared with the corresponding non-HPP groups. Among the groups subjected to HPP at 200 MPa, five groups had a GABA content of more than 500 mg/100 g, with the GABA content of one group reaching 696.6 ± 65.7 mg/100 g. In general, the GABA enrichment effects were most prominent in the kernels. The GABA content of whole vegetable soybeans subjected to three days of flooding followed by HPP at 200 MPa and three days of storage reached 518.3 ± 48.5 mg/100 g, which was 1.38 times the GABA content of the non-flooding group and 1.27 times the GABA content of the non-HPP group. Three days of flooding followed by HPP at 300 MPa and three days of storage increased the GABA content of kernels to 589.5 ± 55.3 mg/100 g, which was a 38% increase compared with the corresponding non-flooding group. This indicates that flooding, HPP, and storage treatments exerted synergistic effects in the enhancement of the GABA content of Kaohsiung No. 9. Under the same high-pressure conditions, the flooding treatment groups experienced a 30%–40% increase in GABA content compared with the corresponding control groups; however, the GABA content of all vegetable soybean parts subjected to four days of flooding treatment decreased significantly after HPP at 200 MPa, followed by three days of storage, with decreases of 37%, 35%, and 32% for whole vegetable soybeans, pods, and kernels, respectively. By contrast, only the GABA content of pods decreased by 62% after HPP at 300 MPa, while the GABA content of whole vegetable soybeans and kernels did not decrease. Therefore, it can be deduced that HPP is not a suitable auxiliary treatment after four days of flooding treatment as it results in decreased GABA content. From the changes in GABA content of the various parts of Kaohsiung No. 9 plants subjected to different flooding treatments, different HPP treatments, and five days of storage, it was found that HPP treatment followed by five days of storage increased the GABA content of Kaohsiung No. 9 by 33%–194% compared with the corresponding non-HPP groups. In particular, the eight treatment groups of whole vegetable soybeans experienced a significant increase in GABA after HPP, with the effects of 200 MPa being more significant than that of 300 MPa. The optimum enhancement was achieved in the whole vegetable soybean group subjected to four days of flooding treatment, and the GABA content of the 200 MPa HPP group increased by 79% compared with the corresponding non-HPP group. Kernels subjected to one day of flooding treatment and the corresponding control group experienced increases in GABA content after five days of storage, with the increases being 26%–120% and 8%–37% compared with the non-storage and three-day storage groups, respectively, and the highest GABA content being 661.0 ± 69.6 mg/100 g.
A previous study showed that HPP at 200 MPa may induce protein aggregation and disrupt protein secondary structure. Puppo et al. [44] reported a reduction in the free sulfhydryl content and total denaturation in proteins subjected to HPP at 400 and 600 MPa. However, a similar reduction was not observed at 200 MPa, indicating that the secondary structure and activity of soybean protein can be maintained at this pressure. In a study on soaked soybeans, Ueno et al. [45] did not observe a significant difference in the free amino acid concentration and GABA content on day 0 of storage between samples subjected to HPP at 200 MPa and untreated soybeans. After three days of storage, the amino acid concentration in the pressure-treated soybeans increased, the glutamate and glutamine levels reduced, and the GABA content also increased from 1.61 μmol/g to 2.32 μmol/g. When the results described above are compared with the results of the present study, it can be deduced that HPP at 200 MPa induces a significant increase in the GABA content of vegetable soybean subjected to flood treatment, possibly through the α-decarboxylation of glutamate catalyzed by glutamate decarboxylase.
The results described above demonstrate that HPP effectively increased the GABA content of Kaohsiung No. 9, with HPP at 200 MPa providing the optimum GABA enrichment effects. GABA content was increased further with subsequent storage for 3–5 days. Among the various vegetable soybean parts of Kaohsiung No. 9, kernels had the highest GABA content and experienced the most significant GABA enrichment effects. Flooding treatment followed by appropriate auxiliary HPP and storage treatments could provide synergistic effects and enhance the enrichment of GABA content. However, the use of HPP as an auxiliary treatment after four days of flooding was found to be counterproductive. The optimum GABA enrichment conditions determined in the present study were three days of flooding followed by HPP for 10 minutes at 200 MPa and storage for three days; the maximum GABA content obtained under such conditions was 696.6 ± 65.7 mg/100 g.
3.4. mRNA Expression Levels of GABA-Related Enzymes in Kaohsiung No. 9 Kernels Under Flooding Stress
GAD is a key enzyme for GABA biosynthesis. Five isoforms of GAD, namely GAD1, GAD2, GAD3, GAD4, and GAD5, have been isolated from soybean. From the mRNA expression levels of the vegetable soybean samples (Figure 1), it can be observed that GAD5 had the highest expression levels among the various GAD genes, and the mRNA expression level of the one-day flooding treatment group was higher than that of the control group. This indicated that GAD5 may be the key GAD enzyme influencing GABA content when flooding stress was experienced for one day. The investigation of the mRNA expression levels of enzymes related to the polyamine degradation pathway revealed that another GABA synthesis-related enzyme AMADH had a high mRNA expression level, which was higher than that of the upstream enzyme DAO. In addition, the AMADH mRNA expression level of the one-day treatment group was also higher than that of the control group, indicating that one day of flooding stress enabled the activation of the polyamine degradation pathway, which may have promoted an increase in GABA content through the upregulation of AMADH mRNA expression.
The gene expression levels of the GABA downstream enzymes were also investigated, and the results are shown in Figure 1. It can be seen that GABA-T and SSADH had relatively high mRNA expression levels. In particular, the GABA-T mRNA expression level of the one-day flooding treatment group was higher than that of the control group. Although GABA-T catalyzes the conversion of GABA to SSA, the catalytic reaction is reversible. Therefore, an increase in expression level may also cause GABA accumulation. The SSADH enzyme further converts SSA to succinic acid, which subsequently enters the TCA cycle. Figure 1 shows that the SSADH mRNA expression level of the one-day flooding treatment group was lower than that of the control group. This may be due to the fact that one day of flooding was not sufficient to activate the emergency energy regulation mechanism of the plants, which converts proteins for the provision of supplementary metabolites to the TCA cycle, so as to maintain the respiratory function of plants [46]. Therefore, one day of flooding only triggered a mild stress response in plants, which led to the accumulation of GABA content to maintain osmoregulation and ion channel regulation functions. This could be the reason for the decrease in SSADH gene expression level.
In summary, the mRNA expression levels of GAD5, AMADH, GABA-T, and SSADH in Kaohsiung No. 9 kernels were higher than that of genes encoding other enzymes. One day of flooding treatment upregulated the mRNA expression of GAD5, AMADH, and GABA-T, and downregulated the expression of GAD3 and SSADH. Therefore, it can be deduced that the changes in gene expression levels of GAD5, AMADH, and SSADH could be the reason for the increased GABA content of the kernels of Kaohsiung No. 9 after one day of flooding treatment.
Xing et al. [47] investigated the influence of polyamines in soybean on GABA accumulation under salt stress. The results indicated that the levels of putrescine (Put), cadaverine (Cad), and spermidine (Spd) reduced significantly with increasing salt concentrations as salt stress promoted diamine oxidase (DAO) activity to induce polyamine degradation to GABA. Compared to the control group, plants subjected to salt stress exhibit an 11- to 17-fold increase in GABA content. Treatment of soybeans using the DAO inhibitor aminoguanidine (AG) increased the endogenous polyamine content to the same level as that in the control group and a 39% reduction in GABA content compared to that in samples that did not receive AG treatment, suggesting that polyamine degradation may be the primary mechanism underlying GABA formation under salt stress. In another study, it was observed that Ca2+ increased GABA content significantly by enhancing glutamate decarboxylase (GAD) gene expression and its activity under hypoxia-NaCl stress [48]. These results indicate that the influence of stress treatments on enzyme expression may manifest in the form of increased GAD expression in the GABA shunt and increased DAO and AMADH expression in the polyamine degradation pathway, which subsequently leads to increased GABA content through the interaction of the two pathways.
3.5. Influence of HPP on GAD Activity in Kaohsiung No. 9
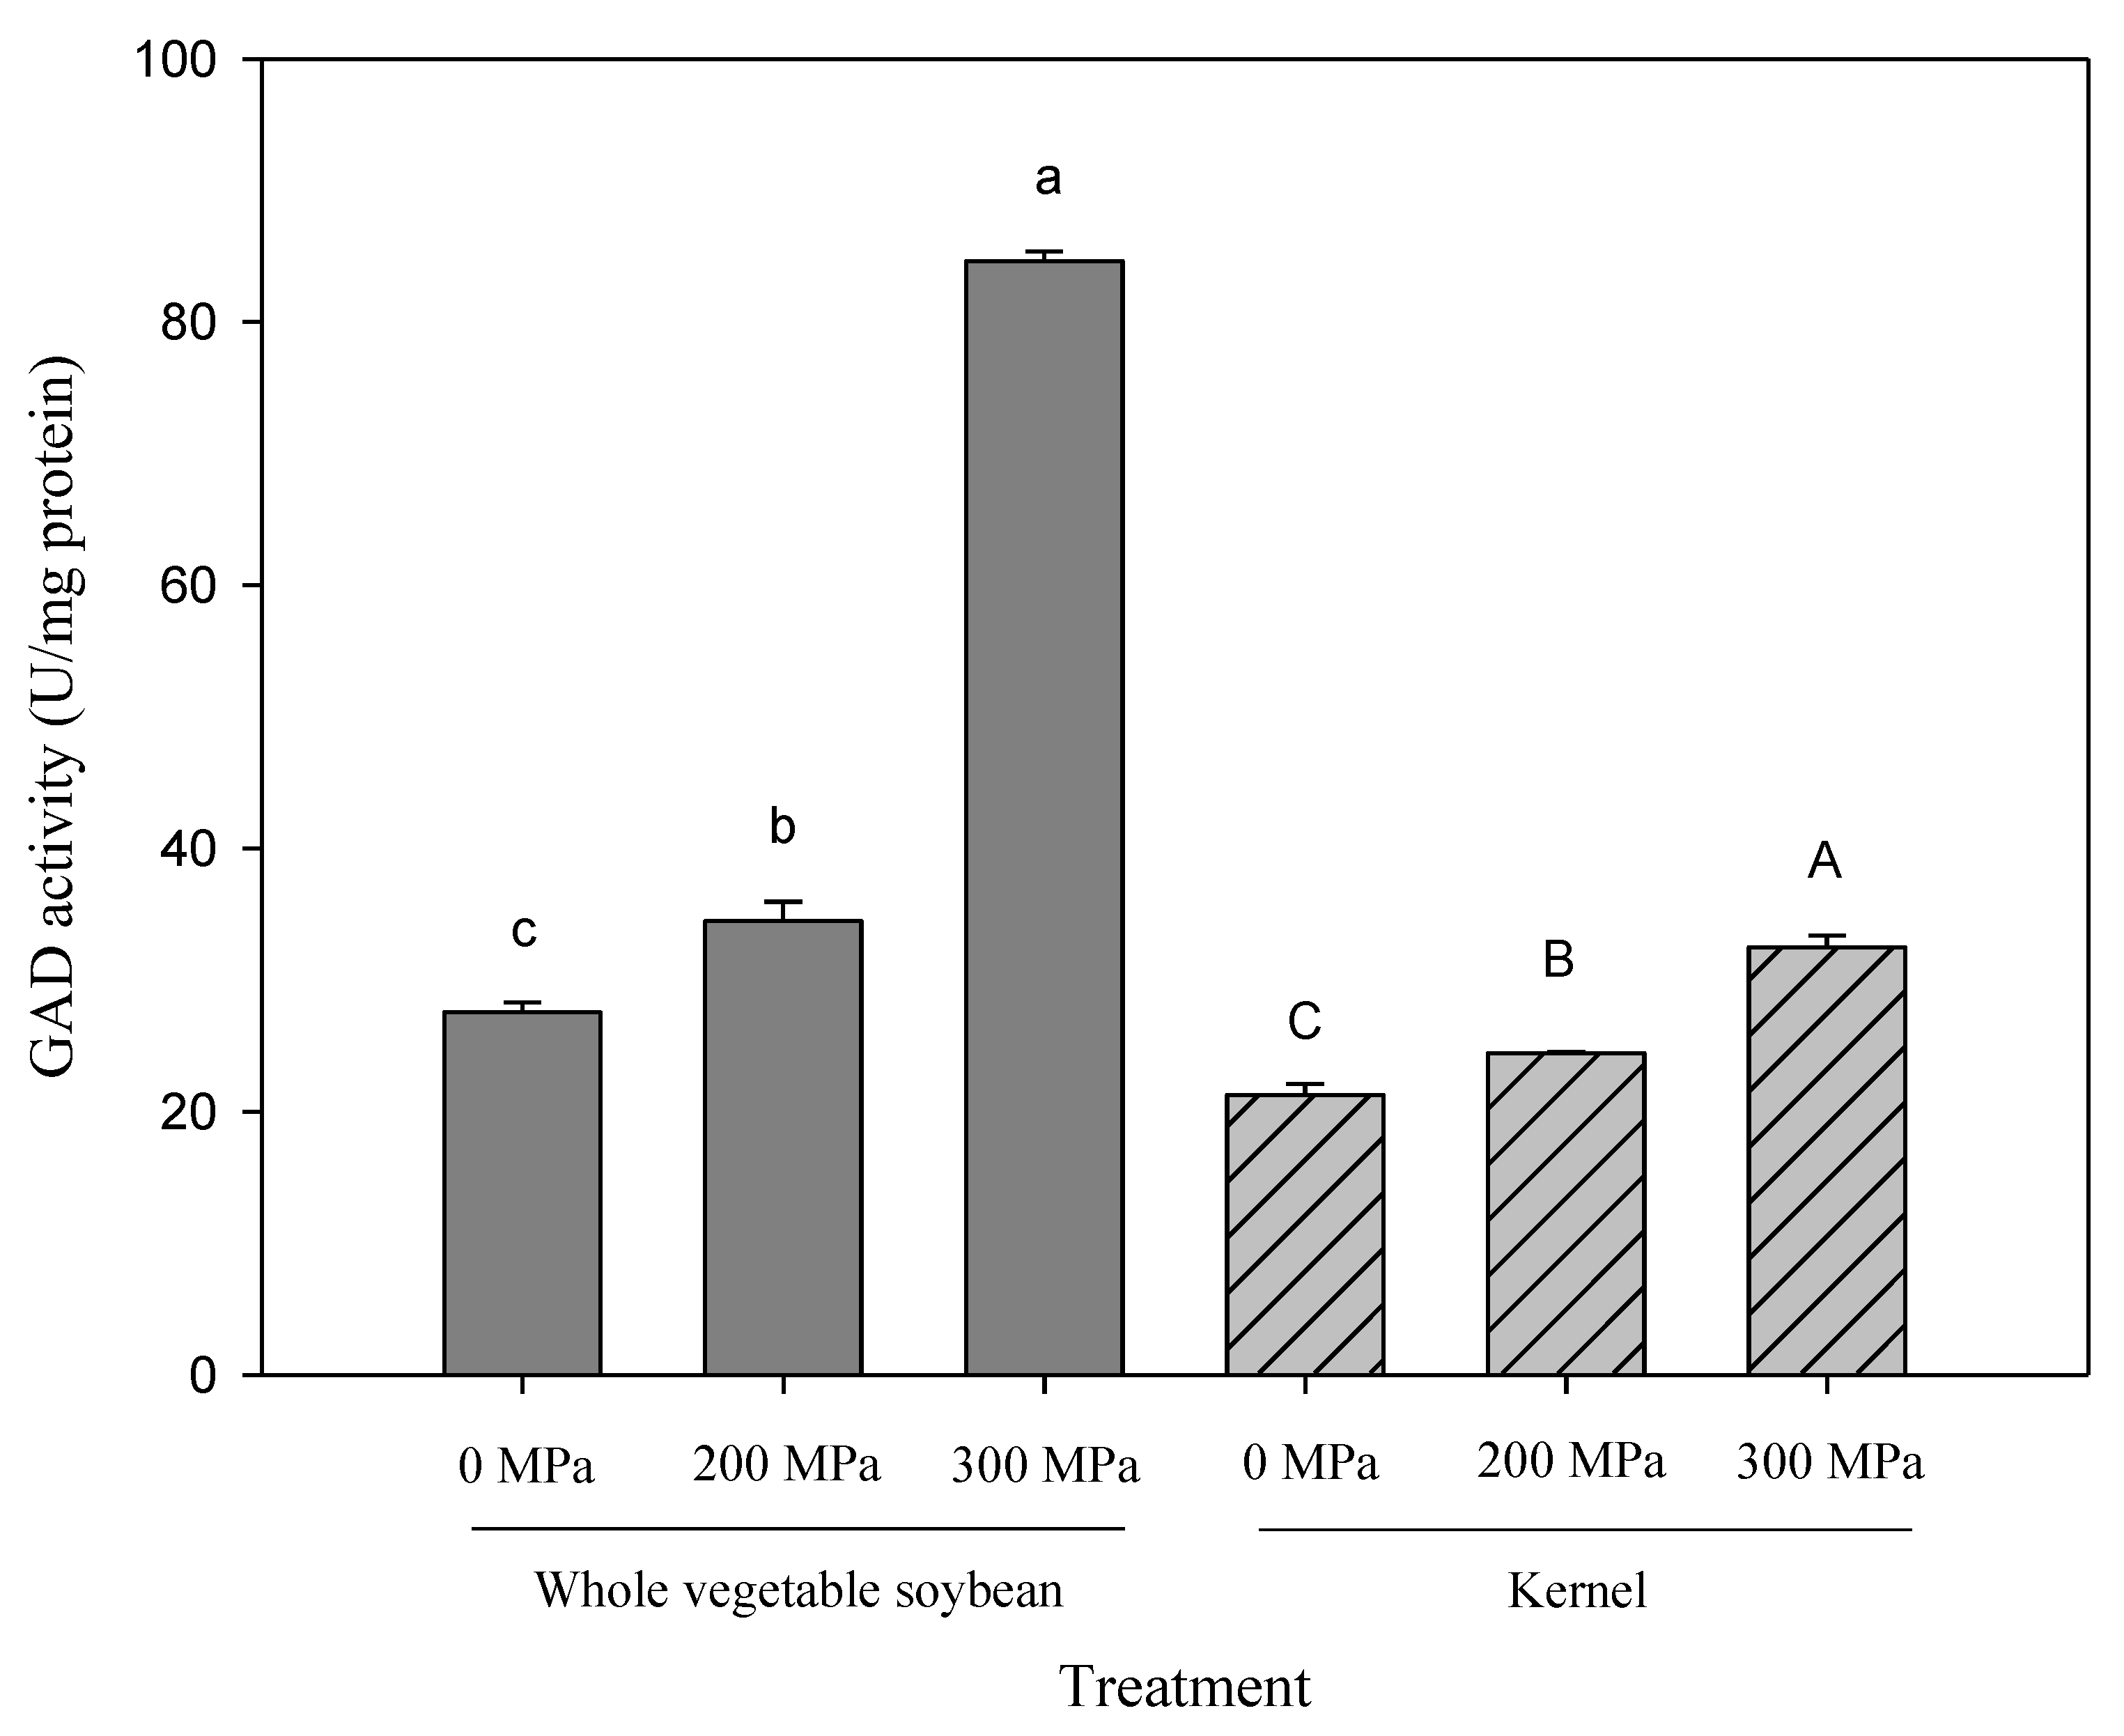
In the present study, changes in GAD activity under different pressures were investigated in whole vegetable soybeans and kernels, and the results are shown in Figure 2. Similar trends were observed in both vegetable soybean parts: GAD activity was significantly higher after HPP and the extent of increase was greater in the 300 MPa groups than in the 200 MPa groups. The optimum GAD activity of 84.62 ± 0.75 U/mg protein was achieved in whole vegetable soybeans subjected to HPP at 300 MPa, which was increased by 207.3% and 145.6% compared with the control and 200 MPa groups, respectively. For the kernels of the 300 MPa group, the GAD activity was 32.48 ± 0.90 U/mg protein, which was 32.9% higher than that of the 200 MPa group; this is consistent with results reported in previous literature [32]. The higher destructive power of HPP at 300 MPa compared with HPP at 200 MPa may be the reason for its greater influence on GAD activity. Therefore, it can be deduced that HPP can increase the GABA content of Kaohsiung No. 9 through the enhancement of GAD activity.
A study by Hao et al. revealed that the treatment of germinating buckwheat seeds with slightly acidic electrolyzed water (SAEW) (pH 5.83, 1-aminocyclopropane-1-carboxylic acid (ACC) of 20.3 mg/L) for 2 h significantly increased GAD activity and increased the GABA content to 143.20 mg/100 g [49]. In another study, brown rice was germinated for 72 h in different soaking solutions, and the GABA content was enhanced in all the germinated brown rice groups compared to that in the non-germinated brown rice. In particular, brown rice that had been soaked with 50 ppm chitosan in 5 mM glutamic acid had the highest GABA content, which was 13 times higher than that of the control group. The soluble calcium content and GAD activity were also higher compared to that in groups treated with other soaking solutions. The researchers deduced that chitosan provided a source of calcium, which stimulated the activity of calmodulin and increased the GAD activity by approximately 3.6-fold [50].
4. Conclusions
Flooding stress significantly increased the GABA content of vegetable soybean kernels without influencing color, size, qualified pod rate, kernel plumpness, kernel hardness, and consumer acceptance, with the possible mechanism being the upregulation of GAD5 and AMADH gene expression and downregulation of SSADH gene expression. High-pressure treatment at 200 MPa or 300 MPa significantly increased the GABA content of Kaohsiung No. 9 through the enhancement of GAD activity. By combining flooding stress, HPP, and storage treatment, it was found that three days of flooding stress followed by HPP at 200 MPa and three days of storage were the optimum GABA enrichment conditions which achieved an enhanced vegetable soybean GABA content of up to 696.6 ± 65.7 mg/100 g. These results show that flooding stress and HPP combined with different storage durations can increase GABA content and thereby enhance the functional value of Kaohsiung No. 9. Therefore, such treatment methods can be applied to enhance the value of fresh vegetable soybean products. To our knowledge, this study is the first to apply physiological adversity on the vegetable soybean field and processing practice. This innovative pre-harvest flooding is a simple field operation and has no negative impact on the yield and sensory indexes of soybeans’ commodity value. Coupled with the subsequent high-pressure treatment, a significant increase in functional components GABA can be obtained.
Author Contributions
Conceptualization, Y.-T.S., S.-J.W.; methodology, Y.-T.S., S.-J.W.; validation, M.-S.S., Y.-T.S. and S.-J.W.; formal analysis, M.-S.S., S.-J.W.; investigation, M.-S.S., Y.-T.S. and S.-J.W.; resources, Y.-T.S., S.-J.W.; data curation, M.-S.S., Y.-T.S. and S.-J.W.; writing—original draft preparation, M.-S.S., S.-J.W.; writing—review and editing, S.-J.W.; visualization, M.-S.S., S.-J.W.; supervision, Y.-T.S., S.-J.W.; project administration, Y.-T.S., S.-J.W.; funding acquisition, Y.-T.S., S.-J.W. All authors have read and agree to the published version of the manuscript.
Funding
This research was funded by the Council of Agriculture, Taiwan, ROC, grant number 107AS-13.4.1-ST-a5.
Acknowledgments
The authors would like to thank Chen Yung Memorial Foundation for their support on parts of the funding for this research.
Conflicts of Interest
This manuscript has not been published or presented elsewhere in part or in entirety and is not under consideration by another journal. All the authors have approved the manuscript and agree with submission to your esteemed journal. The authors declare no conflicts of interest.
References
- Awapara, J.; Landua, A.J.; Fuerst, R.; Seale, B. Free gamma-aminobutyric acid in brain. J. Biol. Chem. 1950, 187, 35–39. [Google Scholar] [PubMed]
- Roberts, E.; Frankel, S. gamma-Aminobutyric acid in brain: Its formation from glutamic acid. J. Biol. Chem. 1950, 187, 55–63. [Google Scholar] [PubMed]
- Steward, F.C.; Thompson, J.F.; Dent, C.E. γ-Aminobutyric Acid: A Constituent of the Potato Tuber? Science. 1949, 110, 439–440. [Google Scholar]
- Udenfriend, S. Identification of gamma-aminobutyric acid in brain by the isotope derivative method. J. Biol. Chem. 1950, 187, 65–69. [Google Scholar] [PubMed]
- Bowery, N.G.; Smart, T.G. GABA and glycine as neurotransmitters: A brief history. Br. J. Pharmacol. 2006, 147, S109–S119. [Google Scholar] [CrossRef] [PubMed] [Green Version]
- Abdou, A.M.; Higashiguchi, S.; Horie, K.; Kim, M.; Hatta, H.; Yokogoshi, H. Relaxation and immunity enhancement effects of γ-Aminobutyric acid GABA administration in humans. BioFactors 2008, 26, 201–208. [Google Scholar] [CrossRef]
- Calvo-Flores Guzmán, B.; Vinnakota, C.; Govindpan, K.; Waldvogel, H.J.; Faull, R.L.M.; Kwakowsky, A. The GABAergic System as a Therapeutic Target for Alzheimer’s Disease. J. Neurochem. 2018, 146, 649–669. [Google Scholar] [CrossRef] [Green Version]
- Hamed, S.A. The effect of epilepsy and antiepileptic drugs on sexual, reproductive and gonadal health of adults with epilepsy. Expert Rev. Clin. Pharmacol. 2006, 9, 807–819. [Google Scholar] [CrossRef]
- Kasagi, M.; Motegi, T.; Narita, K.; Fujihara, K.; Suzuki, Y.; Tagawa, M.; Ujita, K.; Shimada, H.; Fukuda, M. γ-Aminobutyric acid type A receptor binding affinity in the right inferior frontal gyrus at resting state predicts the performance of healthy elderly people in the visual sustained attention test. Int. Psychogeriatr. 2008, 30, 1385–1391. [Google Scholar] [CrossRef]
- Porges, E.C.; Woods, A.J.; Edden, R.A.; Puts, N.A.; Harris, A.D.; Chen, H.; Garcia, A.M.; Seider, T.R.; Lamb, D.G.; Williamson, J.B.; et al. Frontal Gamma-Aminobutyric Acid Concentrations Are Associated With Cognitive Performance in Older Adults. Biol. Psychiatry Cogn. Neurosci. Neuroimaging 2017, 2, 38–44. [Google Scholar] [CrossRef] [PubMed] [Green Version]
- Pytka, K.; Dziubina, A.; Młynie, C.K.; Dziedziczak, A.; Żmudzka, E.; Furgała, A.; Olczyk, A.; Sapa, J.; Filipek, B. The role of glutamatergic, GABA-ergic, and cholinergic receptors in depression and antidepressant-like effect. Pharmacol. Rep. 2016, 68, 443–450. [Google Scholar] [CrossRef] [PubMed]
- Salminen, A.; Jouhten, P.; Sarajärvi, T.; Haapasalo, A.; Hiltunen, M. Hypoxia. GABA shunt activation in the pathogenesis of Alzheimer’s disease. Neurochem. Int. 2016, 92, 13–24. [Google Scholar] [CrossRef] [PubMed]
- Shetty, A.K.; Upadhya, D. GABA-ergic cell therapy for epilepsy: Advances, limitations & challenges. Neurosci. Biobehav. Rev. 2016, 62, 35–47. [Google Scholar] [PubMed] [Green Version]
- Kathiresan, A.; Tung, P.; Chinnappa, C.C.; Reid, D.M. Gamma-Aminobutyric acid stimulates ethylene biosynthesis in sunflower. Plant Physiol. 1997, 115, 129–135. [Google Scholar] [CrossRef] [PubMed] [Green Version]
- Bouché, N.; Fromm, H. GABA in plants: Just a metabolite? Trends Plant Sci. 2004, 9, 110–115. [Google Scholar] [CrossRef]
- Shelp, B.J.; Bown, A.W.; Mclean, M.D. Metabolism and functions of gamma-aminobutyric acid. Trends Plant Sci. 1999, 4, 446–452. [Google Scholar] [CrossRef]
- Fait, A.; Fromm, H.; Walter, D.; Galili, G.; Fernie, A.R. Highway or byway: The metabolic role of the GABA shunt in plants. Trends Plant Sci. 2008, 13, 14–19. [Google Scholar] [CrossRef]
- Kisaka, H.; Hiroaki, T.; Miwa, T. Antisense suppression of glutamate decarboxylase in tomato (Lycopersicon esculentum L.) results in accumulation of glutamate in transgenic tomato fruits. Plant Biotechnol. 2006, 23, 267–274. [Google Scholar] [CrossRef]
- Shelp, B.J.; Bozzo, G.G.; Trobacher, C.P.; Chiu, G.; Bajwa, V.S. Strategies and tools for studying the metabolism and function of γ-aminobutyrate in plants. I. Pathway structure. Botany 2012, 90, 651–668. [Google Scholar] [CrossRef]
- Yang, R.; Yin, Y.; Guo, Q.; Gu, Z. Purification, properties and cDNA cloning of glutamate decarboxylase in germinated faba bean (Vicia faba L.). Food Chem. 2013b, 138, 1945–1951. [Google Scholar] [CrossRef]
- Yin, Y.R.; Yang, R.; Guo, Q.; Gu, Z. Nacl stree and supplemental CaCl2 regulating GABA metabolism pathways in germinating soybean. Eur. Food Res. Technol. 2014, 238, 781–788. [Google Scholar] [CrossRef]
- Wang, C.; Fan, L.; Gao, H.; Wu, X.; Li, J.; Lv, G.; Gong, B. Polyamine biosynthesis and degradation are modulated by exogenous gamma-aminobutyric acid in root-zone hypoxia-stressed melon roots. Plant Physiol. Biochem. 2017, 82, 17–26. [Google Scholar] [CrossRef] [PubMed]
- Hirabayashi, Y.; Mahendran, R.; Koirala, S.; Konoshima, L.; Yamazaki, D.; Watanabe, S.; Kim, H.; Kanae, S. Global flood risk under climate change. Nat. Clim. Chang. 2013, 3, 816. [Google Scholar] [CrossRef]
- Mittler, R. Abiotic stress, the field environment and stress combination. Trends Plant Sci. 2006, 11, 15–19. [Google Scholar] [CrossRef] [PubMed]
- Valliyodan, B.; Van Toai, T.T.; Alves, J.D.; Goulart Patricia de Fátima, P.; Lee, J.D.; Fritschi, F.B.; Rahman, M.A.; Islam, R.; Shannon, J.G.; Nguyen, H.T. Expression of Root-Related Transcription Factors Associated with Flooding Tolerance of Soybean (Glycine max). Int. J. Mol. Sci. 2014, 15, 17622–17643. [Google Scholar] [CrossRef] [Green Version]
- Sasidharan, R.; Laurentius, A.C.J.V. Ethylene-Mediated Acclimations to Flooding Stress. Plant Physiol. 2015, 169, 3. [Google Scholar] [CrossRef] [Green Version]
- Bailey-Serres, J.; Voesenek, L.A. Flooding Stress: Acclimations and genetic diversity. Annu. Rev. Plant Biol. 2008, 59, 313–339. [Google Scholar] [CrossRef] [Green Version]
- Yang, R.; Guo, Q.; Gu, Z. GABA shunt and polyamine degradation pathway on γ-aminobutyric acid accumulation in germinating fava bean (Vicia faba L.) under hypoxia. Food Chem. 2013a, 136, 152–159. [Google Scholar] [CrossRef]
- Mustroph, A.; Barding, G.A.J.R.; Kaiser, K.A.; Larive, C.K.; Bailey-serres, J. Characterization of distinct root and shoot responses to low-oxygen stress in Arabidopsis with a focus on primary C- and N-metabolism. Plant Cell Environ. 2014, 37, 2366–2380. [Google Scholar] [CrossRef]
- Rodrigo, D.; Sampedro, F.; Silva, A.; Palop, A.; Martínez, A. New food processing technologies as a paradigm of safety and quality. Br. Food J. 2010, 112, 467–475. [Google Scholar] [CrossRef]
- Rendueles, E.; Omer, M.K.; Alvseike, O.; Alonso-Calleja, C.; Capita, R.; Prieto, M. Microbiological food safety assessment of high hydrostatic pressure processing: A review. LWT Food Sci. Technol. 2011, 44, 1251–1260. [Google Scholar] [CrossRef]
- Serment-Moreno, V.; Jacobo-Velázquez, D.A.; Torres, J.A.; Welti-Chanes, J. Microstructural and Physiological Changes in Plant Cell Induced by Pressure: Their Role on the Availability and Pressure-Temperature Stability of Phytochemicals. Food Eng. Rev. 2017, 9, 314–334. [Google Scholar] [CrossRef]
- Chen, K.Y. Using High Pressure Process and Other Enrichment Treatments to Increase γ-Aminobutyric Acid Contents in Legume Beans. Master’s Thesis, Department of Horticulture and Landscape Architecture, National Taiwan University Taipei, Taipei, Taiwan, 2015. [Google Scholar]
- Takahashi, Y.; Sasanuma, T.; Abe, T. Accumulation of gamma-aminobutyrate (GABA) caused by heat-drying and expression of related genes in immature vegetable soybean (edamame). Breed. Sci. 2013, 63, 205–210. [Google Scholar] [CrossRef] [PubMed] [Green Version]
- Rozan, P.; Kuo, Y.H.; Lambein, F. Free Amino Acids Present in Commercially Available Seedlings Sold for Human Consumption. A Potential Hazard for Consumers. J. Agric. Food Chem. 2000, 48, 716–723. [Google Scholar] [CrossRef] [PubMed]
- Cohen, S.A.; Strydom, D.J. Amino acid analysis utilizing phenylisothiocyanate derivatives. Anal. Biochem. 1988, 174, 1–16. [Google Scholar] [CrossRef]
- Hyun, T.K.; Eom, S.H.; Han, X.; Kim, J.S. Evolution and expression analysis of the soybean glutamate decarboxylase gene family. J. Biosci. 2014, 39, 899–907. [Google Scholar] [CrossRef]
- Bai, Q.; Chai, M.; Gu, Z.; Cao, X.; Li, Y.; Liu, K. Effects of components in culture medium on glutamate decarboxylase activity and γ-aminobutyric acid accumulation in foxtail millet (Setaria italica L.) during germination. Food Chem. 2009, 116, 152–157. [Google Scholar] [CrossRef]
- Bradford, M.M. A rapid and sensitive method for the quantitation of microgram quantities of protein utilizing the principle of protein-dye binding. Anal. Biochem. 1976, 72, 248–254. [Google Scholar] [CrossRef]
- Serraj, R.; Shelp, B.J.; Sinclair, T.R. Accumulation of γ-aminobutyric acid in nodulated soybean in response to drought stress. Physiol. Plant 1998, 102, 79–86. [Google Scholar] [CrossRef]
- Bor, M.; Seckin, B.; Ozgur, R.; Ylmaz, O.; Ozdemir, F.; Turkan, I. Comparative effects of drought, salt, heavy metal and heat stresses on gamma-aminobutryric acid levels of sesame (Sesamum indicum L.). Acta Physiol. Plant 2009, 31, 655–659. [Google Scholar] [CrossRef]
- Yang, R.; Hui, Q.; Gu, Z. Effects of ABA and CaCl2 on GABA accumulation in fava bean germinating under hypoxia-NaCl stress. Biosci. Biotechnol. Biochem. 2016, 80, 540–546. [Google Scholar] [CrossRef] [Green Version]
- Sasagawa, A.; Naiki, Y.; Nagashima, S.; Yamakura, M.; Yamazaki, A.; Yamada, A. Process for producing brown rice with increased accumulation of gaba using high-pressure treatment and properties of gaba-increased brown rice. J. Appl. Glyc. 2006, 53, 27–33. [Google Scholar] [CrossRef]
- Puppo, C.; Chapleau, N.; Speroni, F.; Lamballerie-Anton, M.; Michel, F.; Añón, C.; Anton, M. Physicochemical modifications of high-pressure-treated soybean protein isolates. J. Agri. Food Chem. 2004, 52, 1564–1571. [Google Scholar] [CrossRef] [PubMed]
- Ueno, S.; Shigematsu, T.; Watanabe, T.; Nakajima, K.; Murakami, M.; Hayashi, M.; Fujii, T. Generation of free amino acids and γ-aminobutyric acid in water-soaked soybean by high-hydrostatic pressure processing. J. Agric. Food Chem. 2010, 58, 1208–1213. [Google Scholar] [CrossRef]
- Ahmed, F.; Rafii, M.Y.; Ismail, M.R.; Juraimi, A.S.; Rahim, H.A.; Asfaliza, R.; Latif, M.A. Waterlogging Tolerance of Crops: Breeding, Mechanism of Tolerance, Molecular Approaches, and Future Prospects. BioMed Res. Int. 2013, 2013, 963525. [Google Scholar] [CrossRef]
- Xing, S.G.; Jun, Y.B.; Hau, Z.W.; Liang, L.Y. Higher accumulation of γ-aminobutyric acid induced by salt stress through stimulating the activity of diamine oxidases in Glycine max (L.) Merr. roots. Plant Physiol. Biochem. 2007, 45, 560–566. [Google Scholar] [CrossRef]
- Yang, R.; Guo, Y.; Wang, S.; Gu, Z. Ca2+ and aminoguanidine on γ-aminobutyric acid accumulation in germinating soybean under hypoxia–NaCl stress. J. Food Drug Anal. 2015, 23, 287–293. [Google Scholar] [CrossRef] [PubMed] [Green Version]
- Hao, J.; Wu, T.; Li, H.; Wang, W.; Liu, H. Dual effects of slightly acidic electrolyzed water (SAEW) treatment on the accumulation of γ-aminobutyric acid (GABA) and rutin in germinated buckwheat. Food Chem. 2016, 201, 87–93. [Google Scholar] [CrossRef] [PubMed]
- Oh, S. Stimulation of gamma-aminobutyric acid synthesis activity in brown rice by a chitosan/glutamic acid germination solution and calcium/ calmodulin. J. Biochem. Mol. Boil. 2003, 36, 319–325. [Google Scholar]
Figure 1.
The mRNA expression of GABA-related enzymes in vegetable soybeans ‘Kaohsiung 9’ kernels with one-day flooding treatment. (a) Electrophoresis of PCR products from GAD1, GAD2, GAD3, and GAD5 expression. (b) Electrophoresis of PCR products from diamine oxidase (DAO), aminoaldehyde dehydrogenase (AMADH), GABA transaminase (GABA-T), and succinate semialdehyde dehydrogenase (SSADH). Densitometry analysis of β-actin relative expression of (c) GAD1, GAD2, GAD3 and GAD5, (d) DAO, AMADH, GABA-T, and SSADH. x Control. y Flooding treatment. * p < 0.05 versus CK, using Tukey’s test.

Figure 2.
The effects of high pressure treatment on GAD activity in ‘Kaohsiung 9’ whole vegetable soybeans and kernels. The data were shown as mean ± SD of two dilution multiples, and each multiple is repeated three times. Different small letters indicate significant statistical differences among treatments of whole vegetable soybeans; different capital letters indicate significant statistical differences among treatments of kernels; p < 0.05, using Tukey’s test.


Table 1.
Primer sequences of γ-aminobutyric acid (GABA)-related enzymes.
| Primers | Sequences | Amplicon Size (bp) | Reference |
|---|---|---|---|
| GAD1-F GAD1-R | 5’-AGCAGGTGAAGAAAATGACGA-3’ 5’-TCTTCTTCCTGTCCATCACAAA-3’ | 109 | Hyun et al. [37] |
| GAD2-F GAD2-R | 5’-CCACTCACCCAGATGAAAAAG-3’ 5’-AGCTGCATCCTTTGGTATTGA-3’ | About 100 | |
| GAD3-F GAD3-R | 5’-TTCCTGTGTGAGTACGTGTGC-3’ 5’-CATCATTGCGCTCATAATCCT-3’ | 272 | |
| GAD4-F GAD4-R | 5’-GGTGAGAAGATTAAGAAAGCTGC-3’ 5’-GGTAAGCCTAGCATGCTCCA-3’ | 101 | |
| GAD5-F GAD5-R | 5’-CTCAGTGCAGAAGAAAATGGC-3’ 5’-ACACCCCCTTGAAGCTAACAC-3’ | 156 | |
| GABA-T-F GABA-T-R | 5’-CCTCCTGAATGGGGAGTAGG-3’ 5’-GCCTAAGCTACTTGCGCTGA-3’ | About 200 | Takahashi et al. [34] |
| SSADH-F SSADH-R | 5’-CTTAGCTGCAGCGGAACTC-3’ 5’-GCTGAACCAGCCATCAATTT-3’ | About 160 | |
| DAO-F DAO-R | 5’-CCGACAACACTGAATACCGC-3’ 5’-TTTGGAAGCCTGGACCCTG-3’ | 103 | Yin et al. [21] |
| AMADH-F AMADH-R | 5’-GCTCTGTTCGTGCTCGCTAT-3’ 5’-ATCCAGGTCTGCCAGTGCTT-3’ | About 110 | |
| Actin-F Actin-R | 5’-TCCGAGAGAAAGTTCGGTGT-3’ 5’-CAATTGATGGTCCAGACTCG-3’ | About 110 | Takahashi et al. [34] |
Table 2.
Influence of flooding treatment and cold storage on GABA content in different parts of vegetable soybeans ‘Kaohsiung 9’.
Table 2.
Influence of flooding treatment and cold storage on GABA content in different parts of vegetable soybeans ‘Kaohsiung 9’.
| Part | Storage Days | Flooding Treatment (days) z | |||||||
|---|---|---|---|---|---|---|---|---|---|
| CK-1 | FT-1 | CK-2 | FT-2 | CK-3 | FT-3 | CK-4 | FT-4 | ||
| whole | 0 | 433.6 ± 41.9 k | 408.0 ± 38.9 jk | 325.5 ± 30.2 efghij | 295.2 ± 29.2 defg | 174.5 ± 16.3 ab | 143.8 ± 13.6 a | 332.9 ± 32.2 fghij | 243.8 ± 22.9 bcde |
| 3 | 307.9 ± 29.6 efghi | 348.8 ± 33.2 ghijk | 302.7 ± 28.3 efgh | 212.5 ± 19.6 bc | 386.2 ± 37.1 hijk | 403.0 ± 44.4 jk | 303.4 ± 28.4 efgh | 246.9 ± 22.9 bcdef | |
| 5 | 325.1 ± 33.2 efghij | 324.4 ± 30.4 efghij | 278.2 ± 26.0 cdefg | 220.5 ± 23.2 bcd | 287.4 ± 26.9 cdefg | 392.6 ± 36.6 ijk | 325.5 ± 33.2 efghij | 216.7 ± 20.8 bc | |
| pod | 0 | 66.2 ± 5.8 a | 72.2 ± 7.6 a | 204.4 ± 18.8 cde | 216.3 ± 20.2 def | 81.4 ± 7.3 a | 97.5 ± 8.8 a | 216.7 ± 20.1 def | 142.4 ± 13.1 b |
| 3 | 218.6 ± 21.7 def | 264.3 ± 24.6 fgh | 215.2 ± 19.9 def | 158.4 ± 14.8 bc | 277.7 ± 25.8 gh | 300.3 ± 28.0 h | 171.9 ± 16.0 bcd | 148.4 ± 13.8 b | |
| 5 | 254.6 ± 23.8 efgh | 355.1 ± 36.4 i | 212.7 ± 22.5 def | 229.1 ± 21.2 efg | 243.8 ± 23.8 efgh | 269.0 ± 25.8 fgh | 173.2 ± 18.4 bcd | 156.8 ± 15.6 bc | |
| kernel | 0 | 240.6 ± 22.6 a | 456.9 ± 43.4 cd | 502.0 ± 47.9 de | 437.6 ± 45.5 bcd | 227.4 ± 21.1 a | 249.5 ± 23.6 a | 365.1 ± 34.7 b | 355.2 ± 33.1 b |
| 3 | 399.2 ± 37.3 bc | 382.6 ± 35.6 bc | 170.2 ± 15.9 a | 170.5 ± 16.5 a | 365.8 ± 35.1 b | 576.1 ± 53.8 e | 158.7 ± 14.7 a | 238.2 ± 22.0 a | |
| 5 | 529.6 ± 50.1 de | 460.3 ± 43.1 cd | 213.7 ± 19.8 a | 193.9 ± 18.0 a | 348.3 ± 32.4 b | 468.1 ± 43.7 cd | 199.8 ± 20.8 a | 225.7 ± 21.3 a | |
Note: Each value is the mean ± SD (n = 3). z CK: control; FT: flooding treatment; numbers indicate different treatment days. a–h different letters in the same row and column indicate significant statistical differences; p < 0.05, using Tukey’s test.
Table 3.
Pod number and quality per plant, qualified pod number per 500 g pods, hue angle, and kernels and pods size of flooding treated vegetable soybeans ‘Kaohsiung 9’.
Table 3.
Pod number and quality per plant, qualified pod number per 500 g pods, hue angle, and kernels and pods size of flooding treated vegetable soybeans ‘Kaohsiung 9’.
| Treatmentz | per Plant u | per 500 g Pods v | Hue Angle w | Kernel | Pod | |||||
|---|---|---|---|---|---|---|---|---|---|---|
| Pod Number | Poor Quality Pod Ratio | Qualified Pod Number | Length (mm) v | Width (mm) v | Height (mm) v | Hundred Grains Weight (g) w | Length (mm) v | Width (mm) v | ||
| CK-1 | 10.53 ± 5.46 c | 0.40 ± 0.20 bc | 87.33 ± 6.66 a | 103.50 ± 1.32 a | 13.84 ± 1.07 a | 10.18 ± 0.85 bc | 6.32 ± 0.75 c | 47.97 ± 1.27 d | 64.23 ± 6.11 a | 14.14 ± 0.68 ab |
| FT-1 | 13.52 ± 6.52 b | 0.47 ± 0.22 ab | 83.33 ± 2.52 a | 103.22 ± 1.53 a | 14.68 ± 1.74 a | 10.81 ± 0.59 a | 7.55 ± 0.79 a | 56.04 ± 1.34 c | 60.39 ± 6.45 ab | 13.92 ± 0.79 bc |
| CK-2 | 6.96 ± 4.51 d | 0.49 ± 0.25 a | 80.33 ± 5.51 a | 103.60 ± 1.40 a | 13.79 ± 1.31 a | 9.94 ± 0.90 c | 6.20 ± 0.95 c | 56.30 ± 3.84 c | 59.29 ± 5.31 b | 14.50 ± 0.80 a |
| FT-2 | 13.37 ± 4.88 b | 0.33 ± 0.17 cd | 92.00 ± 6.08 a | 103.53 ± 0.94 a | 15.10 ± 0.96 a | 10.64 ± 0.58 ab | 7.22 ± 0.72 a | 65.20 ± 1.16 ab | 61.09 ± 4.52 ab | 13.95 ± 0.51 abc |
| CK-3 | 14.32 ± 4.82 b | 0.34 ± 0.16 cd | 74.00 ± 4.58 a | 103.95 ± 1.28 a | 19.29 ± 24.71 a | 10.43 ± 0.58 abc | 7.00 ± 0.64 ab | 66.38 ± 3.67 a | 57.58 ± 6.22 b | 13.71 ± 0.85 bc |
| FT-3 | 18.89 ± 7.70 a | 0.51 ± 0.20 a | 50.67 ± 14.01 b | 104.17 ± 1.10 a | 14.97 ± 0.99 a | 10.55 ± 0.43 ab | 7.30 ± 0.78 a | 66.63 ± 2.56 a | 57.75 ± 4.83 b | 13.92 ± 0.70 bc |
| CK-4 | 10.81 ± 5.47 c | 0.44 ± 0.24 ab | 87.00 ± 4.00 a | 103.93 ± 1.08 a | 14.12 ± 1.00 a | 10.22 ± 0.79 bc | 6.48 ± 0.68 bc | 59.98 ± 0.80 bc | 58.08 ± 4.59 b | 13.95 ± 0.74 abc |
| FT-4 | 15.37 ± 5.20 b | 0.31 ± 0.14 d | 87.00 ± 4.36 a | 103.61 ± 1.80 a | 14.46 ± 0.99 a | 10.43 ± 0.39 abc | 7.13 ± 0.84 a | 65.68 ± 0.19 ab | 57.33 ± 4.80 b | 13.40 ± 0.60 c |
Note: Each value is the mean ± SD. u n = 100. v n = 3. w n = 30. z CK: control; FT: flooding treatment; numbers indicate different treatment days. Different letters in the same column between different treatments indicate significant statistical differences; p < 0.05, using Tukey’s test.
Table 4.
The hardness, brittleness, and consumer acceptance evaluation of flooding treated vegetable soybeans ‘Kaohsiung 9’.
Table 4.
The hardness, brittleness, and consumer acceptance evaluation of flooding treated vegetable soybeans ‘Kaohsiung 9’.
| Treatment z | Kernels x | Degree of Preference y | ||||||
|---|---|---|---|---|---|---|---|---|
| Hardness (g) | Fracture (mm) | Overall | Appearance | Aroma | Flavor | Taste | Aftertaste | |
| CK-1 | 614.20 ± 69.23 b | 0.79 ± 0.10 b | 5.60 ± 1.74 a | 6.30 ± 1.63 a | 5.75 ± 1.44 a | 5.52 ± 1.65 a | 5.89 ± 1.48 a | 5.36 ± 1.64 a |
| FT-1 | 695.77 ± 75.42 a | 0.75 ± 0.07 b | 5.94 ± 1.42 a | 5.70 ± 1.48 a | 5.86 ± 1.53 a | 6.01 ± 1.38 a | 6.36 ± 1.42 a | 5.89 ± 1.48 a |
| CK-2 | 651.48 ± 45.27 ab | 0.84 ± 0.10 b | 5.89 ± 1.61 a | 5.70 ± 1.15 a | 5.78 ± 1.54 a | 5.97 ± 1.62 a | 6.41 ± 1.38 a | 5.82 ± 1.57 a |
| FT-2 | 622.03 ± 74.08 b | 0.75 ± 0.11 b | 5.98 ± 1.53 a | 6.34 ± 1.32 a | 5.54 ± 1.50 a | 5.78 ± 1.55 a | 6.52 ± 1.23 a | 5.59 ± 1.43 a |
| CK-3 | 675.68 ± 61.45 ab | 0.73 ± 0.09 b | 5.90 ± 1.30 a | 6.00 ± 1.33 a | 5.46 ± 1.36 a | 6.00 ± 1.45 a | 6.08 ± 1.41 a | 5.72 ± 1.46 a |
| FT-3 | 659.22 ± 94.62 ab | 0.68 ± 0.08 b | 5.67 ± 1.48 a | 5.62 ± 1.38 a | 5.28 ± 1.59 a | 5.77 ± 1.63 a | 6.10 ± 1.27 a | 5.58 ± 1.65 a |
| CK-4 | 619.95 ± 64.24 b | 0.88 ± 0.36 b | 6.10 ± 1.42 a | 6.17 ± 1.37 a | 5.75 ± 1.37 a | 6.17 ± 1.54 a | 6.42 ± 1.35 a | 6.08 ± 1.54 a |
| FT-4 | 658.12 ± 121.23 ab | 1.13 ± 0.62 a | 6.06 ± 1.32 a | 5.92 ± 1.57 a | 5.65 ± 1.46 a | 6.18 ± 1.43 a | 6.37 ± 1.44 a | 5.81 ± 1.39 a |
Note: Each value is the mean ± SD. x n = 30. y n = 60. z CK: control; FT: flooding treatment; numbers indicate different treatment days. Different letters in the same column between different treatments indicate significant statistical differences.; p < 0.05, using Tukey’s test.
Table 5.
The impact of flooding treatment with different high-pressure processing (HPP) treatment for 0, 3, 5 days of storage on the GABA content of ‘Kaohsiung 9’ whole vegetable soybeans, pods, and kernels.
Table 5.
The impact of flooding treatment with different high-pressure processing (HPP) treatment for 0, 3, 5 days of storage on the GABA content of ‘Kaohsiung 9’ whole vegetable soybeans, pods, and kernels.
| Part | HPP(MPa) | Flooding Treatment z (days) | ||||||||
|---|---|---|---|---|---|---|---|---|---|---|
| Storage Days | CK-1 | FT-1 | CK-2 | FT-2 | CK-3 | FT-3 | CK-4 | FT-4 | ||
| whole | 200 | 0 | 311.6 ± 30.1 abc | 420.0 ± 39.6 cdefgh | 272.0 ± 28.5 a | 340.5 ± 33.2 abcd | 284.9 ± 27.6 ab | 325.9 ± 32.9 abcd | 316.1 ± 29.9 abc | 268.8 ± 25.9 a |
| 3 | 436.6 ± 40.7 defgh | 399.3 ± 37.6 cdefg | 392.4 ± 41.7 bcdefg | 386.6 ± 36.5bcdef | 375.8 ± 38.4 abcde | 518.3 ± 48.5 gh | 433.6 ± 40.9 defgh | 316.5 ± 39.4 abc | ||
| 5 | 499.1 ± 58.3 fgh | 463.3 ± 49.1 efgh | 461.1 ± 46.5 efgh | 375.0 ± 35.7 abcde | 409.9 ± 41.6 cdefgh | 520.4 ± 54.5 h | 479.7 ± 47.2 efgh | 388.5 ± 36.6 bcdef | ||
| 300 | 0 | 321.3 ± 30.8 abcde | 339.1 ± 31.5 bcde | 235.6 ± 23.2 a | 263.4 ± 24.5 abc | 243.7 ± 22.6 a | 350.5 ± 33.4 bcde | 272.2 ± 25.2 abcd | 256.7 ± 23.8 ab | |
| 3 | 405.4 ± 47.7 e | 366.9 ± 42.9 de | 364.9 ± 35.5 de | 399.1 ± 37.2 e | 344.2 ± 33.9 bcde | 394.8 ± 39.4 e | 416.6 ± 42.8 e | 324.3 ± 31.9 abcde | ||
| 5 | 420.0 ± 47.8 e | 396.7 ± 45.7 e | 378.6 ± 40.4 e | 392.1 ± 41.5 e | 398.0 ± 46.0 e | 373.5 ± 47.8 de | 411.3 ± 40.9 e | 358.0 ± 36.4 cde | ||
| pod | 200 | 0 | 203.7 ± 18.9 abcd | 160.1 ± 14.7 ab | 213.1 ± 20.3 bcd | 184.6 ± 17.0 abc | 163.9 ± 15.9 ab | 149.1 ± 13.7 a | 172.8 ± 17.5 ab | 149.8 ± 13.7 a |
| 3 | 256.4 ± 24.9 def | 277.3 ± 25.7 efg | 239.5 ± 22.3 cde | 236.7 ± 22.1 cde | 291.4 ± 27.1 efg | 309.6 ± 29.1 fg | 288.8 ± 28.1 efg | 214.2 ± 20.0 bcd | ||
| 5 | 289.9 ± 27.9 efg | 332.5 ± 31.4 g | 293.8 ± 27.4 efg | 292.4 ± 27.3 efg | 257.8 ± 25.8 def | 262.8 ± 24.3 def | 232.2 ± 21.6 cde | 180.6 ± 18.1 abc | ||
| 300 | 0 | 146.4 ± 13.4 a | 158.8 ± 15.1 ab | 141.6 ± 13.0 a | 133.5 ± 12.2 a | 141.7 ± 12.9 a | 186.1 ± 17.1 abcd | 193.2 ± 17.8 abcde | 132.9 ± 12.4 a | |
| 3 | 216.3 ± 20.6 bcdef | 186.1 ± 17.3 abcd | 241.3 ± 26.0 defg | 210.4 ± 20.0 bcdef | 248.9 ± 23.2 efg | 280.6 ± 29.6 gh | 266.7 ± 27.8 fg | 165.0 ± 15.2 ab | ||
| 5 | 335.7 ± 33.4 h | 286.2 ± 29.1 gh | 290.8 ± 31.6 gh | 259.5 ± 24.1 fg | 257.3 ± 25.8 fg | 229.9 ± 21.7 cdefg | 245.1 ± 23.8 defg | 178.0 ± 16.8 abc | ||
| kernel | 200 | 0 | 450.2 ± 42.3 bcd | 246.9 ± 24.2 a | 475.3 ±46.0 bcd | 380.1 ± 35.4 b | 454.2 ± 42.4 bcd | 480.1 ± 45.7 bcd | 487.1 ± 48.8 bcd | 383.2 ± 38.7 b |
| 3 | 484.1 ± 53.0 bcd | 500.3 ± 49.8 bcd | 414.8 ± 44.2 bc | 420.6 ± 39.2 bc | 575.1 ± 61.4 defg | 696.6 ± 65.7g | 643.6 ± 64.9 efg | 489.4 ± 46.4 bcd | ||
| 5 | 661.0 ± 69.6 fg | 542.6 ± 66.5 cdef | 486.0 ± 45.4 bcd | 511.7 ± 47.8 bcde | 466.7 ± 57.7 bcd | 515.0 ± 52.4bcde | 435.9 ± 41.8 bcd | 423.1 ± 41.8 bc | ||
| 300 | 0 | 449.8 ± 41.9 bcdefgh | 402.4 ± 38.0 abcdef | 341.4 ± 32.6 ab | 392.7 ± 36.9 abcde | 371.5 ± 34.6 abcd | 475.0 ± 45.2 bcdefgh | 353.6 ± 35.1 abc | 366.8 ± 35.3 abcd | |
| 3 | 518.6 ± 50.1 efgh | 405.6 ± 41.1 abcdef | 401.9 ± 43.3 abcdef | 440.7 ± 43.4 abcdefg | 428.1 ± 46.4 abcdefg | 589.5 ± 55.3 h | 379.0 ± 38.5 abcde | 306.8 ± 31.6 a | ||
| 5 | 564.8 ± 63.0 gh | 520.1 ± 53.6 efgh | 537.6 ± 70.1 fgh | 569.8 ± 68.2 gh | 492.6 ± 53.9 cdefgh | 537.6 ± 65.7 fgh | 502.7 ± 59.9 defgh | 410.5 ± 41.1 abcdef | ||
Note: Each value is the mean ± SD (n = 3). z CK: control; FT: flooding treatment; numbers indicate different treatment days. a–h different letters in the same row indicate significant statistical differences; p < 0.05, using Tukey’s test.
© 2020 by the authors. Licensee MDPI, Basel, Switzerland. This article is an open access article distributed under the terms and conditions of the Creative Commons Attribution (CC BY) license (http://creativecommons.org/licenses/by/4.0/).
Share and Cite
MDPI and ACS Style
Shiu, M.-S.; Shyu, Y.-T.; Wu, S.-J. Flooding Stress and High-Pressure Treatment Enhance the GABA Content of the Vegetable Soybean (Glycine max Merr.). Agriculture 2020, 10, 175. https://doi.org/10.3390/agriculture10050175
AMA Style
Shiu M-S, Shyu Y-T, Wu S-J. Flooding Stress and High-Pressure Treatment Enhance the GABA Content of the Vegetable Soybean (Glycine max Merr.). Agriculture. 2020; 10(5):175. https://doi.org/10.3390/agriculture10050175
Chicago/Turabian StyleShiu, Man-Shin, Yuan-Tay Shyu, and Sz-Jie Wu. 2020. "Flooding Stress and High-Pressure Treatment Enhance the GABA Content of the Vegetable Soybean (Glycine max Merr.)" Agriculture 10, no. 5: 175. https://doi.org/10.3390/agriculture10050175
Note that from the first issue of 2016, this journal uses article numbers instead of page numbers. See further details here.