Assessing the Climate Impact of Formation Flights
by
 , , , , and
Katrin Dahlmann
1,* ,
,
Sigrun Matthes
1,
Hiroshi Yamashita
1,
Simon Unterstrasser
1,
Volker Grewe
1,2 and
and
Tobias Marks
3 1
Deutsches Zentrum für Luft- und Raumfahrt, Institut für Physik der Atmosphäre, 82234 Oberpfaffenhofen, Germany
2
Faculty of Aerospace Engineering, Delft University of Technology, 2629 Delft, The Netherlands
3
German Aerospace Center (DLR), Air Transportation Systems, 21079 Hamburg, Germany
*
Author to whom correspondence should be addressed.
Aerospace 2020, 7(12), 172; https://doi.org/10.3390/aerospace7120172
Submission received: 22 October 2020
/
Revised: 27 November 2020
/
Accepted: 5 December 2020
/
Published: 8 December 2020
(This article belongs to the Special Issue Selected Papers from 3rd ECATS Conference on Making Aviation Environmentally Sustainable)
Abstract
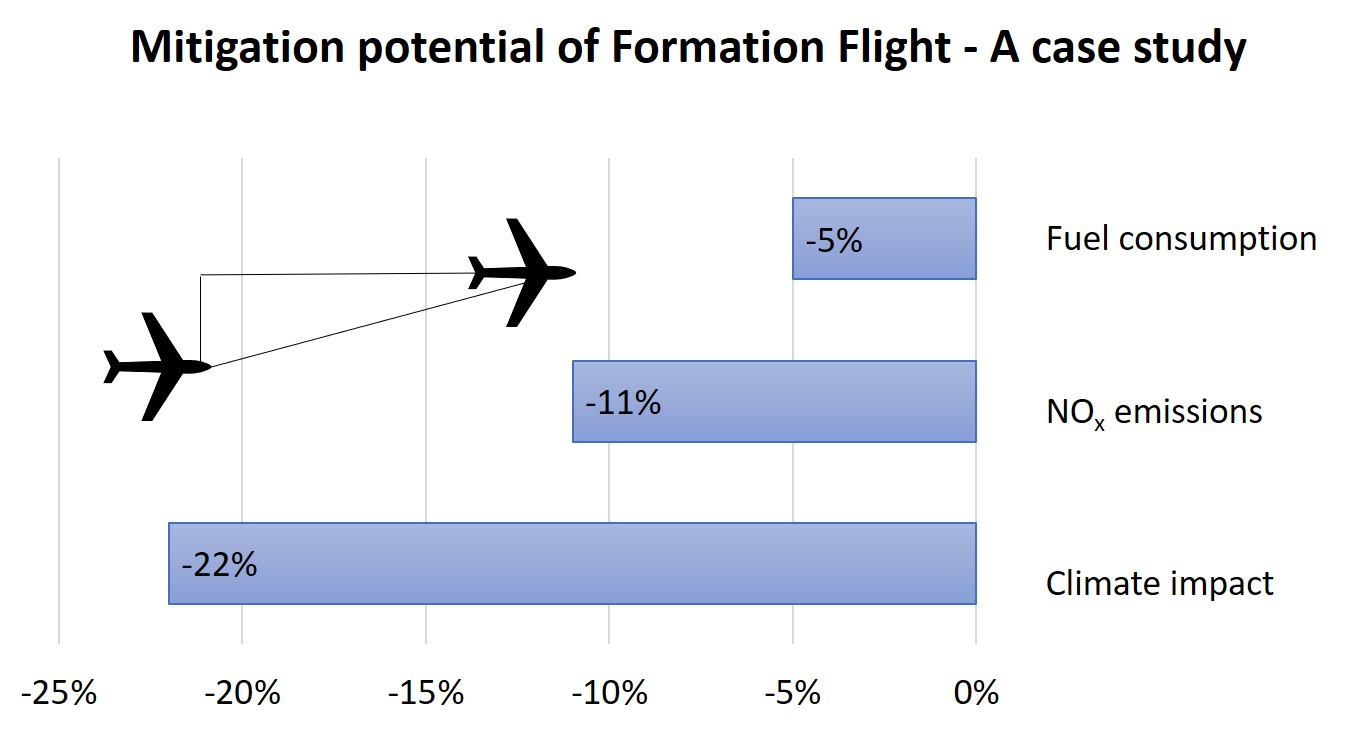
:An operational measure that is inspired by migrant birds aiming toward the mitigation of aviation climate impact is to fly in aerodynamic formation. When this operational measure is adapted to commercial aircraft it saves fuel and is, therefore, expected to reduce the climate impact of aviation. Besides the total emission amount, this mitigation option also changes the location of emissions, impacting the non-CO2 climate effects arising from NOx and H2O emissions and contrails. Here, we assess these non-CO2 climate impacts with a climate response model to assure a benefit for climate not only due to CO2 emission reductions, but also due to reduced non-CO2 effects. Therefore, the climate response model AirClim is used, which includes CO2 effects and also the impact of water vapor and contrail induced cloudiness as well as the impact of nitrogen dioxide emissions on the ozone and methane concentration. For this purpose, AirClim has been adopted to account for saturation effects occurring for formation flight. The results of the case studies show that the implementation of formation flights in the 50 most popular airports for the year 2017 display an average decrease of fuel consumption by 5%. The climate impact, in terms of average near surface temperature change, is estimated to be reduced in average by 24%, with values of individual formations between 13% and 33%.

1. Introduction
There is a large pressure on and interest of the aviation industries to reduce climate impact, while in turn aiming for as little additional cost as possible. Hence, quantitative estimates of the potential reduction in climate change from individual mitigation strategies are required, in order to identify promising mitigation options. Operational measures offer mitigation potentials which are accessible without adapting the aircraft structure, aerodynamics or engine technology, and might be available within shorter time scales than technological measures. A promising operational mitigation strategy is inspired by migrant birds that fly in formation to save energy [1]. The indicated method can be adopted by commercial aviation and leads to substantial fuel savings as the thrust of the trailing aircraft, which is literally surfing on the vortex of the leading aircraft, can be reduced during cruise flight [2]. This procedure can likewise be called aircraft wake-surfing for efficiency (AWSE). This in turn changes the climate effect of aviation as the amount and the location of the emissions change due to the formation flight and the AWSE benefits. The climate benefit is even enlarged, as saturation effects occurring behind the formation can lead to an additional benefit in terms of climate impact.
In AWSE, the aircraft that follows positions itself in the upwash field of the wake vortex of the leading aircraft (leader). The station keeping systems are assumed to maintain a stable controlled position during the AWSE flight segment with the wingtip of the follower about 5% of the wingspan outside of the vortex core of the leader. Relative positioning and additional sensors might be required to fulfil this task. The close proximity of the two aircraft leads to an instantaneous merging of the contrails. This leads to different geometrical, microphysical and optical properties compared to contrails created by a single aircraft [3]. Dedicated contrail-cirrus simulations with the LES (large eddy simulation) model EULAG-LCM show that in formation flight scenarios the total ice mass and the total extinction, which serve as proxies for changes in the contrail radiative forcing, are reduced by 20–60% [4].
In addition to the saturation effects from contrails due to formation flights, saturation effects in NOx photochemistry can occur, affecting aviation-induced ozone. Ozone chemistry in general [5,6,7], as well as aviation related ozone chemistry [8,9], is highly nonlinear, which can lead to saturation effects if instead of two aircraft flying separately, the two aircraft fly in formation and emit in the identical air mass. In most atmospheric areas, the ozone production efficiency increases with increasing NOx up to a specific concentration and surpassing that concentration the net-ozone production decreases. Locally doubling NOx emissions by formation leads to an increase of the net-ozone production, but at a lower rate than emitting the same amount at two different places. Nitrogen oxide emissions from aviation cause formation of ozone, which constitutes an important greenhouse gas in the atmosphere and represent an important contribution to aviation’s climate impact [10]. Formation flight changes the emitted amount and geographic distribution of nitrogen oxides which has the potential to reduce aviation-induced ozone, and hence aviation’s climate impact.
Several studies analyzed the energy and fuel saving effects of formation flights [1,2,11], while the impact on contrails was only studied recently in high resolution models [3,4]. Nevertheless, a comprehensive assessment of the total climate impact of formation flights (from CO2 and non-CO2 effects) and its mitigation potential is currently not available.
The scope of the paper is (1) to analyze the impact of saturation effects of contrail-cirrus and NOx emissions for formations flights and (2) to give a comprehensive assessment of the total climate mitigation potential of AWSE formation flights including the effects of carbon dioxide (CO2), water vapor (H2O), ozone (O3), methane (CH4) and contrail cirrus (CiC) for a set of different flight trajectories. In this paper, we investigate the aviation induced contribution to climate change in terms of an average temperature response (ATR), which is the averaged global near surface temperature change over a specific time horizon, e.g., 50 or 100 years.
2. Methods and Data
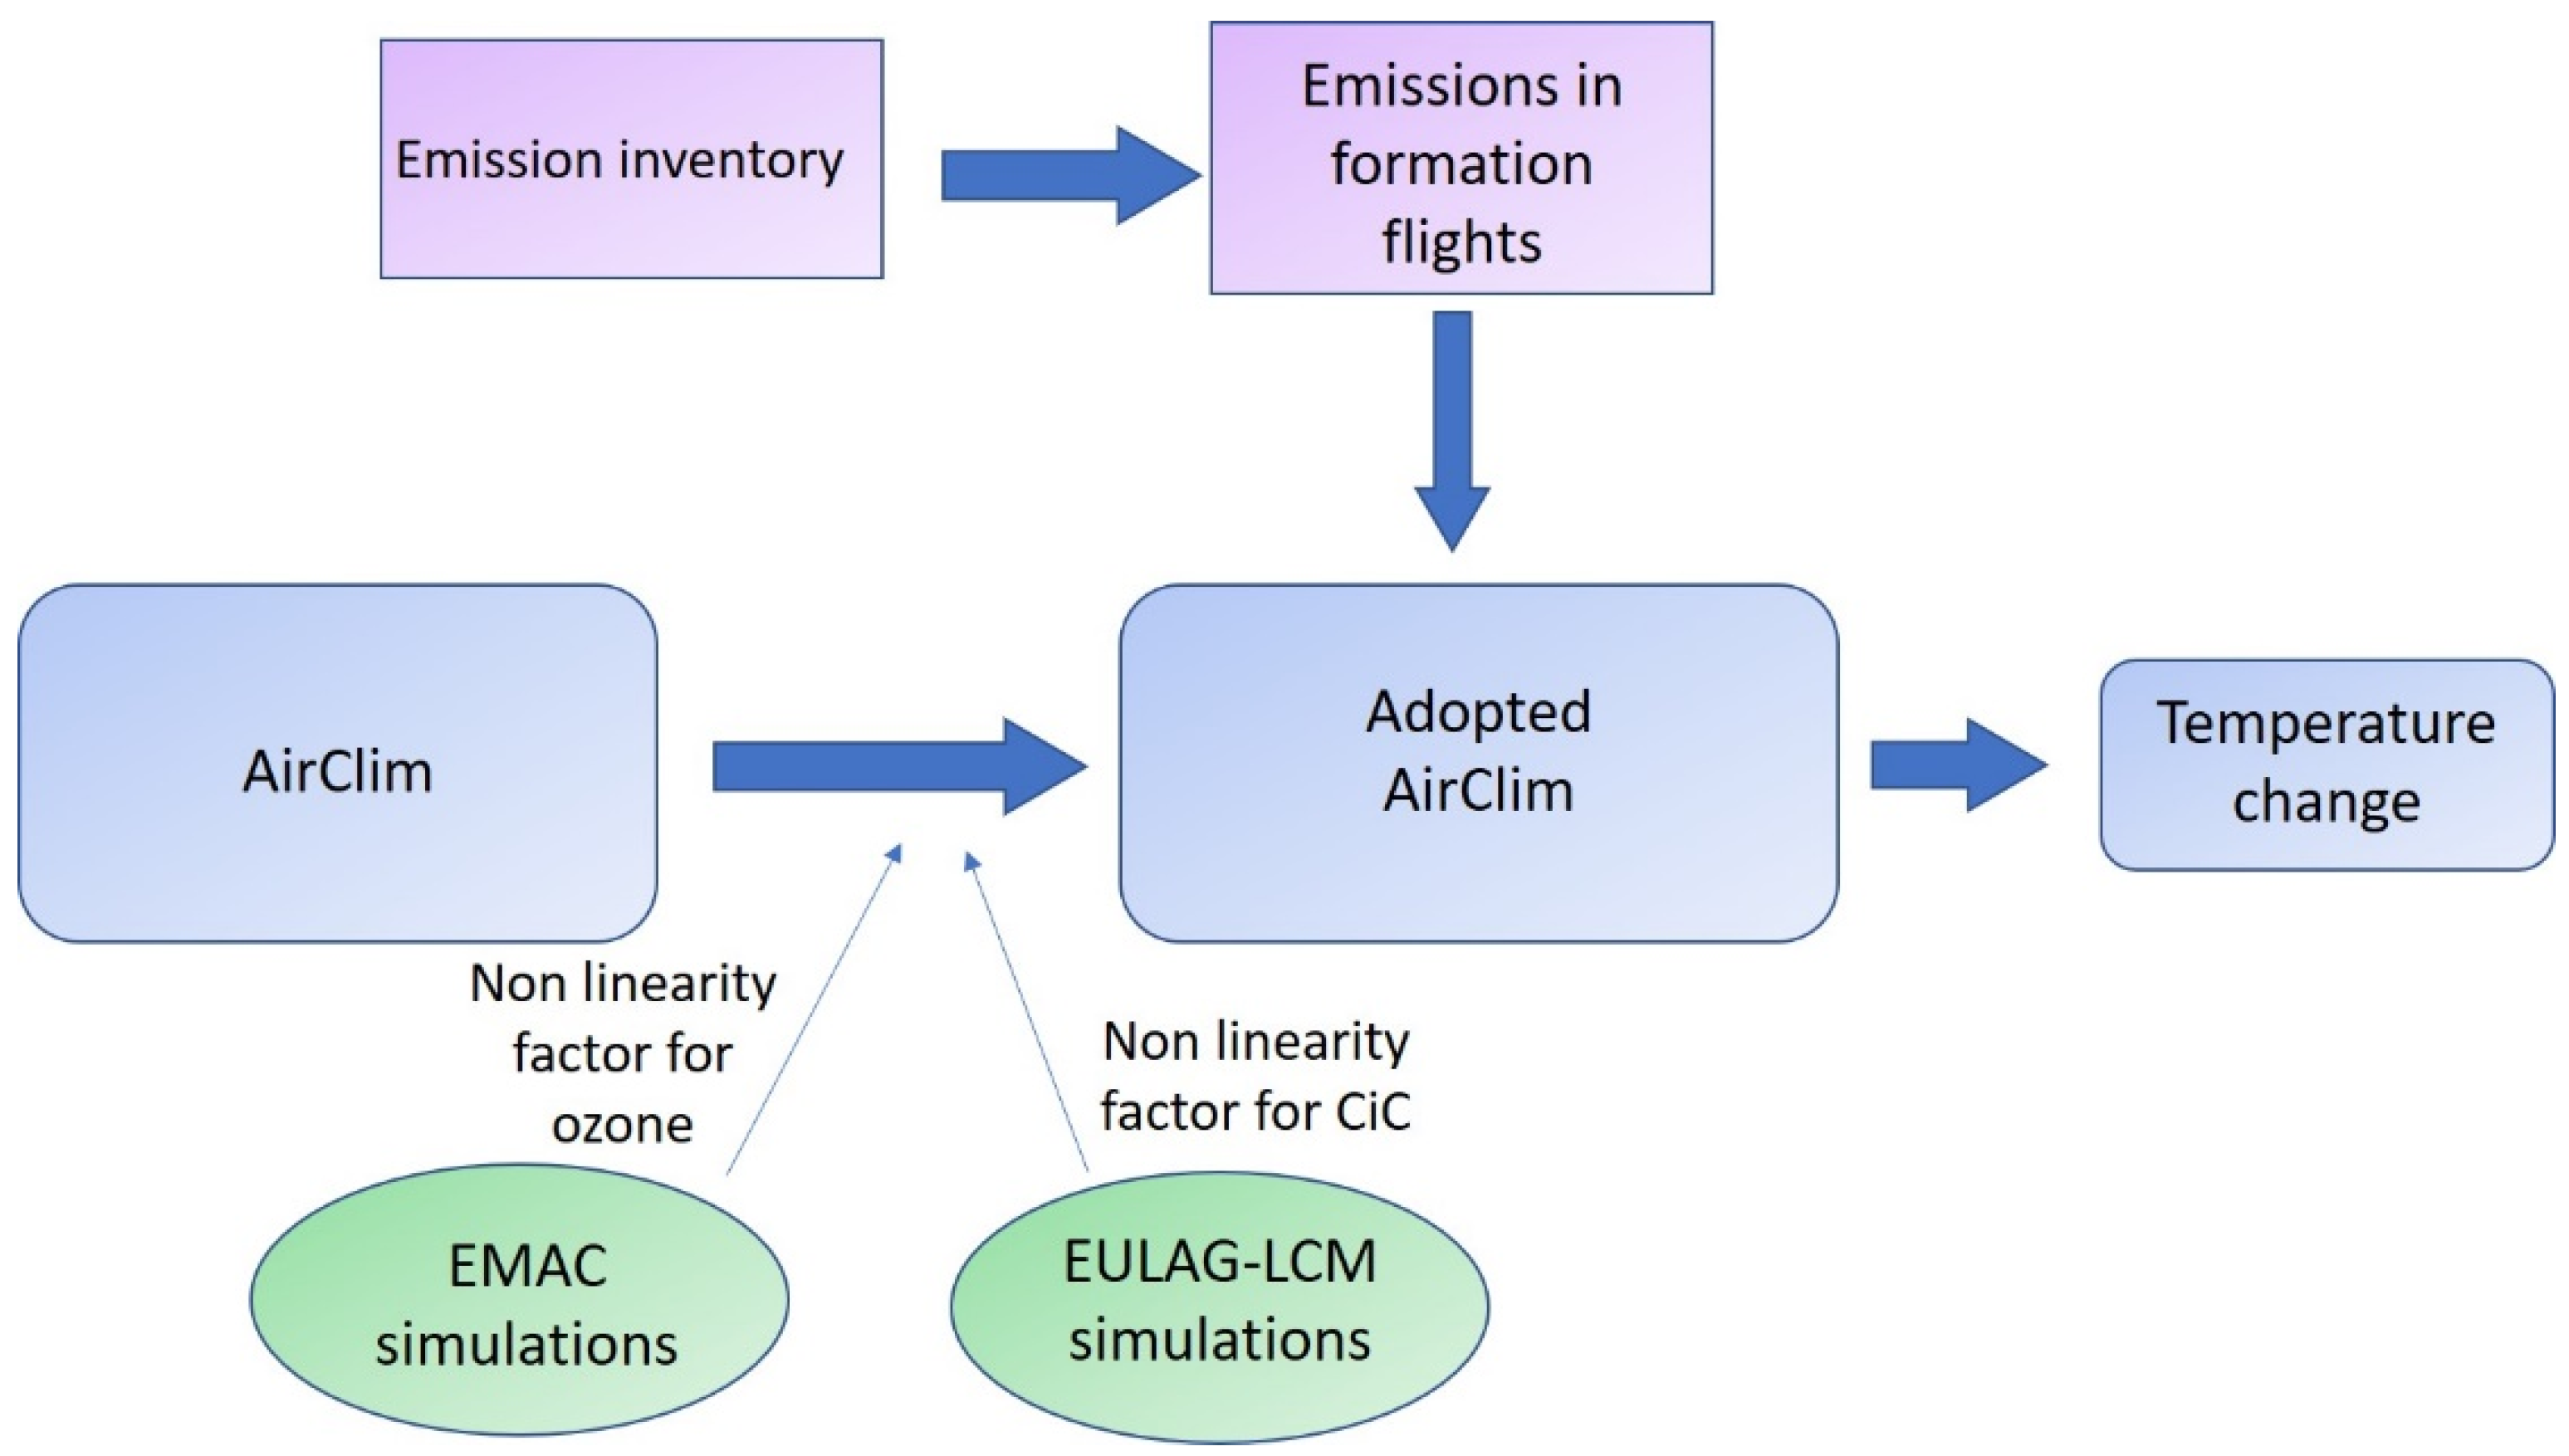
In this study, we use the non-linear climate response model AirClim to provide a quantitative estimate of the mitigation potential from formation flight. Therefore, we first estimate formation flight-specific non-linearity factors for ozone with a complex climate model EMAC and for CiC with the high resolution LES model EULAC-LCM, respectively. Afterwards, we adopt AirClim to account for these formation flight-specific non-linearity effects and simulate the mitigation potential of emissions in formation flight compared to single flights. A schema of this approach is shown in Figure 1.
2.1. Estimating Non-Linearity Factors Required for Non-Linear-Response Model AirClim
In an initial step physical and chemical atmospheric processes that lead to aviation climate impact are studied in terms of how changes due to formation flight change the subsequent process and associated climate impact. To analyze the additional climate benefits from saturation effects of NOx we analyze the production efficiency of two aircraft flying in formation and emitting in the identical air mass, instead of independently in two separate air masses. Therefore, chemistry–climate model simulations with the earth-system model EMAC (ECHAM/MESSy atmospheric chemistry) were performed in order to study non-linearities within the North Atlantic flight corridor (NAFC), comparing impact of emission reduction by 50% and impact of doubling NOx emissions. From comparing changes in atmospheric concentrations and estimating changes in radiative balance, this results in a quantification of the non-linear relationship between changing emissions and changing impacts. For this purpose, three different episodic scenarios are simulated with the global chemistry–climate model EMAC [12,13]. EMAC, containing the submodel MECCA (module efficiently calculating the chemistry of the atmosphere) on photochemistry [14], is well suited to analyze such episodic perturbation simulation sets. In order to construct individual scenarios of aviation NOx emissions in the NAFC, emissions in this geographic region (longitude 10° W–60° W, latitude 35° N–60° N, altitude 8.8–12.5 km) are scaled accordingly. A simulation length of three months is selected. We constructed three sustained emission scenarios: (1) reference “REF” (REACT4C Inventory [15]), (2) Scenario “HalfNAFC” with 50% of the emissions, and (3) scenario “DoubleNAFC” with double the emissions amount in the NAFC, and leave emissions in the rest of the world unchanged.
2.2. Model Study with Non-Linear-Response Model AirClim to Quantify Benefits of Formation Flight
As the climate impact of aviation emissions is strongly dependent on the region and altitude in which the flight is operated, it is necessary to analyze climate impact on specific routes instead of theoretical missions to assess the total climate impact mitigation potential of formation flight. In this paper we use therefore four scenarios with selected sets of origin and destination airports and identify combinations of flights with a possibility for conducting AWSE. The identified flight combinations are assessed concerning their expected fuel saving benefits. Subsequently we apply an expanded AirClim model in order to quantify associated climate impacts from contrail cirrus, carbon dioxide, water vapor, and nitrogen oxide emissions.
The nonlinear climate response model AirClim [19,20] is used to calculate the change in climate impact due to formation flight. AirClim comprises a response function of atmospheric processes to establish a direct link between emissions and near surface temperature change, latter is presumed to be a reasonable indicator for climate change. AirClim has been designed to be applicable to climate assessment of different aircraft technologies and operations [21,22,23]. It includes the climate impacts of the climate agents CO2, H2O, CH4 and O3 (latter two resulting from NOx-emissions) and contrail cirrus (contrail induced cloudiness, CiC). The climate impacts of direct and indirect aerosol effects are not considered here, as the uncertainties are considerably large [24].
The climate response model combines previously calculated atmospheric data, like ice supersaturation or chemical regimes, with aircraft emission data to obtain the temporal evolution of atmospheric concentration changes, radiative forcing and temperature changes.
For the purpose of this study the climate response model AirClim is expanded to additionally account for the saturation effects of NOx and CiC which can occur while flying in formation. In AirClim a reduction of the RF is considered for flight segments in which the aircraft fly in formation. The results in Section 3.1. show a total decrease in the CiC RF of 48% and in ozone RF by 5%, when the aircraft fly in formation. Thereby the mitigation impact of the saturation effects is split evenly between leader and follower. Thus, both aircraft benefit from a 48% reduction in CiC RF and 5% reduction in ozone RF. RF of H2O does not have saturation effects at altitudes where H2O may add significantly to the aviation climate impact. Hence, additional H2O emissions adds linearly to the prevailing background concentration of gaseous H2O [25].
We apply AirClim to analyze the mitigation potential by comparing the climate impact of two distinct emission inventories for a given set of flights, a reference case that represents aircraft using the direct connection between origin and destination and a formation case which assumes aircraft to adapt their routing to fly together in formation with AWSE benefits whenever it is favourable under fuel optimal conditions according to Marks et al. (2020) [26].
The climate impact is calculated as an average global near surface temperature (ATR) over a time horizon H of 50 and 100 years:
where ∆T (in K) is the global average near surface temperature. It is assumed that the aviation emissions follow the historical emissions and increase on future according to the Fa1 scenario as defined in IPCC (1999) [27]. Up to 2009 both scenarios (reference and formation) are equal and implementation of formation flight starts in 2010. The temperature change is analyzed starting in 2010 () until 2059 () and 2109, respectively. For the background concentration of CO2 and CH4, which influence the climate impact of CO2 and CH4 changes, we assume a RCP8.5 scenario [28]. The RCP8.5 scenario assumes increasing CO2 and CH4 concentration what is in line with increasing aviation emission.
As an input AirClim receives gridded emission data. A detailed description on the construction of the emission inventories is provided in Marks et al. (2020) [26]. They analyzed three global scenarios involving all airports (All), the 50 most popular airports by passengers as for the year 2017 (T50, see Appendix A for a list of the T50 airports) and the 30 most popular airports (T30) without impact of winds, and an additional regional scenario, which focuses on the North Atlantic (NAT) and includes the impact of wind on the formation benefits and routing. Here, for the emission inventory all connections of Boeing B777 aircraft with a flight distance larger than 5000 km from the global flight plan were analyzed searching for viable formation candidates based on flight time, location of origin and destination airports and the direction of the particular flight tracks. All remaining formation candidates were subsequently evaluated according to the formation efficiency. The formations with the largest relative benefit are selected to constitute a formation flight plan. The selected formations are subsequently recalculated by the trajectory calculation tool (trajectory calculation module (TCM), [29,30]) using databases to assess the aerodynamic interactions between the formation members to assess emission inventories for the evaluated scenario. We assume a fixed cruise altitude and speed during the formation flight. For the cruise altitude we use two different reference cases. In the one the same fixed cruise altitude (FCA) and formation cruise Mach number (FCM) is used as in the formation flight inventory. In the other one, each flight uses its individual optimal cruise altitude and speed. Using two types of reference case inventories helps disentangling effects from the formation flights itself and the effect due to implicitly changed flight altitudes. For each formation combination gridded emissions are calculated, that contain the amount of emissions (CO2, H2O, NOx) and flown distances in each 3-dimensional grid box (horizontal and vertical).
For the North Atlantic (NAT) study, a special focus is set on the influence of wind, as wind has a strong effect on the optimal routing, achievable benefits and timing [28,31]. Here, for a set of major European (AMS, CDG, AMS) and North American (ATL, JFK, ORD) airports all possible combinations of two-aircraft formations were calculated for eight representative weather patterns characterizing the weather on the North Atlantic according to Irvine et al. (2013) [32]. For each scenario wind optimal formation and reference routes were estimated showing a strong geographic deviation of the routes.
Note, that the mitigation potential that is evaluated here, only applies for those flights (Boeing B777; flight distance larger than 5000 km) that have in accordance to Marks et al. (2020) [26] a potential for formation flight and not for the whole air traffic. For the T50 study about 16% of all analyzed flights could be performed as formation flight (14% for T30 and 20% for All).
3. Results
3.1. Non-Linearity Factors Resulting from CiC and NOx
In general, CiC when they occur have both a cooling effect as they reduce incoming shortwave radiation as well as a warming effect as they reduce outgoing longwave radiation [33]. In the annual global mean, the warming effect dominates and results in a positive RF of 37.5 mW/m2 [34]. In order to account for saturation effects of formation flight scenarios, Unterstrasser [4] performs high-resolution numerical simulations and juxtaposes contrail-cirrus evolutions of single aircraft scenarios and formation flight scenarios for a large variety of prescribed atmospheric conditions. The proxy quantities time-integrated total ice mass I and total extinction E are used to assess the reduction in contrail RF. In a formation of two aircraft, I and E values are smaller by 20% to 60% compared to two contrails that spread independently of each other and depend on the ambient conditions. The contrails of the two aircraft in formation merge soon into a single contrail and it is not possible nor meaningful to single out the contributions of each aircraft on the merged contrail. Hence, the achieved reductions are equally split among the leader and follower. Considering the range of E and I values found in Unterstrasser [4] and the stronger dependence of RF on E than on I, we prescribe an average reduction of 48% in AirClim.
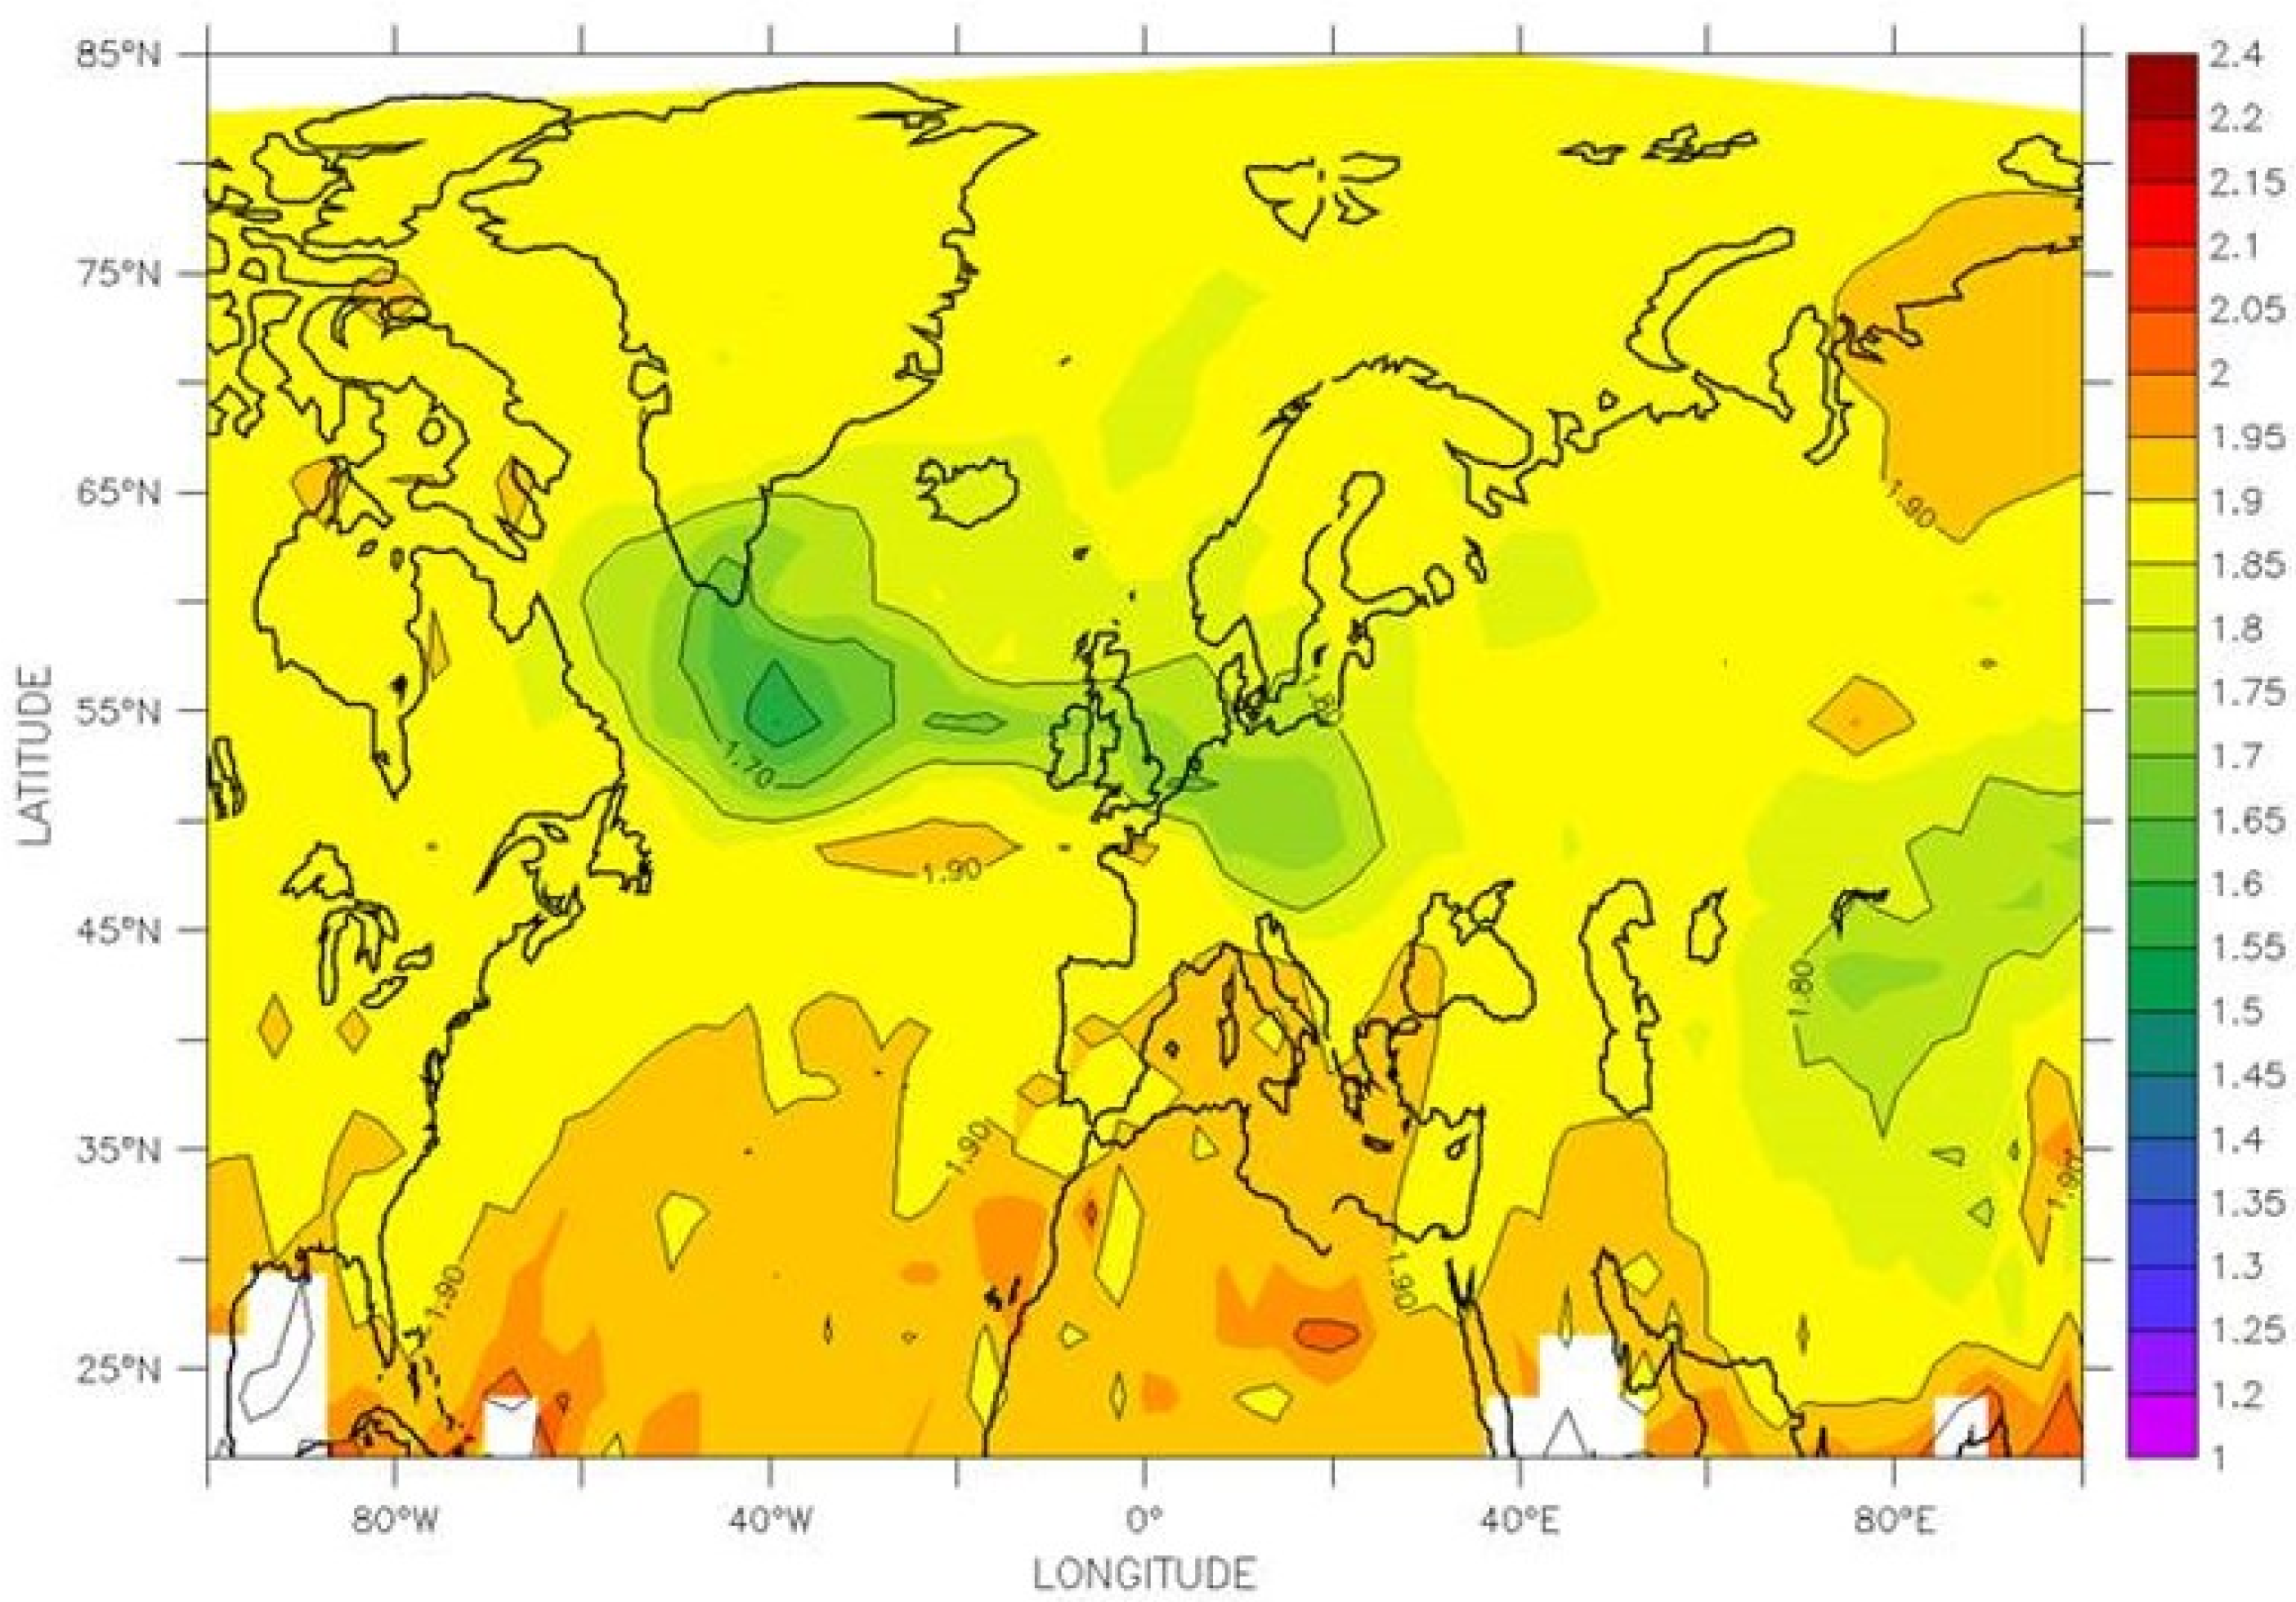
Non-linearity effects from NOx emissions are derived from EMAC model simulations when comparing emission reduction by 50% (halving) with doubling of emissions. The ratio between ozone columns changes associated with doubling of emissions (DoubleNAFC-REF) and halving of emissions (REF-HalfNAFC) are shown in Figure 2. Therefore, a linear behavior is indicated by the value 2. In the Southern part of the NAFC we find a ratio of about 1.9, while in the Northern part of the NAFC a stronger non-linear behaviour becomes evident with values in the order of 1.6. The stronger non-linear behaviour coincides with the central parts of the NAFC, where aviation emissions cause comparably higher nitrogen oxide concentrations which leads to ozone production showing a stronger non-linear behaviour, leading to weaker increase in ozone columns. These results show that a doubling of nitrogen oxide emissions in this regions leads to a comparably lower impact on ozone. From the model simulations we find that efficiency of aviation nitrogen oxide emissions decreases and a non-linearity factor of 0.95 can be estimated. Implementing these non-linearity factors into AirClim enables the non-linear response model to study climate impact of formation flight. Overall results on non‑linearity of aviation induced ozone formation show that if NOx is emitted in the identical air mass, ozone production efficiency decreases by 5%, which causes a lower overall efficiency of emitted NOx emissions, hence leading to a weaker associated climate effect.
3.2. Total Climate Impact: Mitigation Potential of Formation Flight
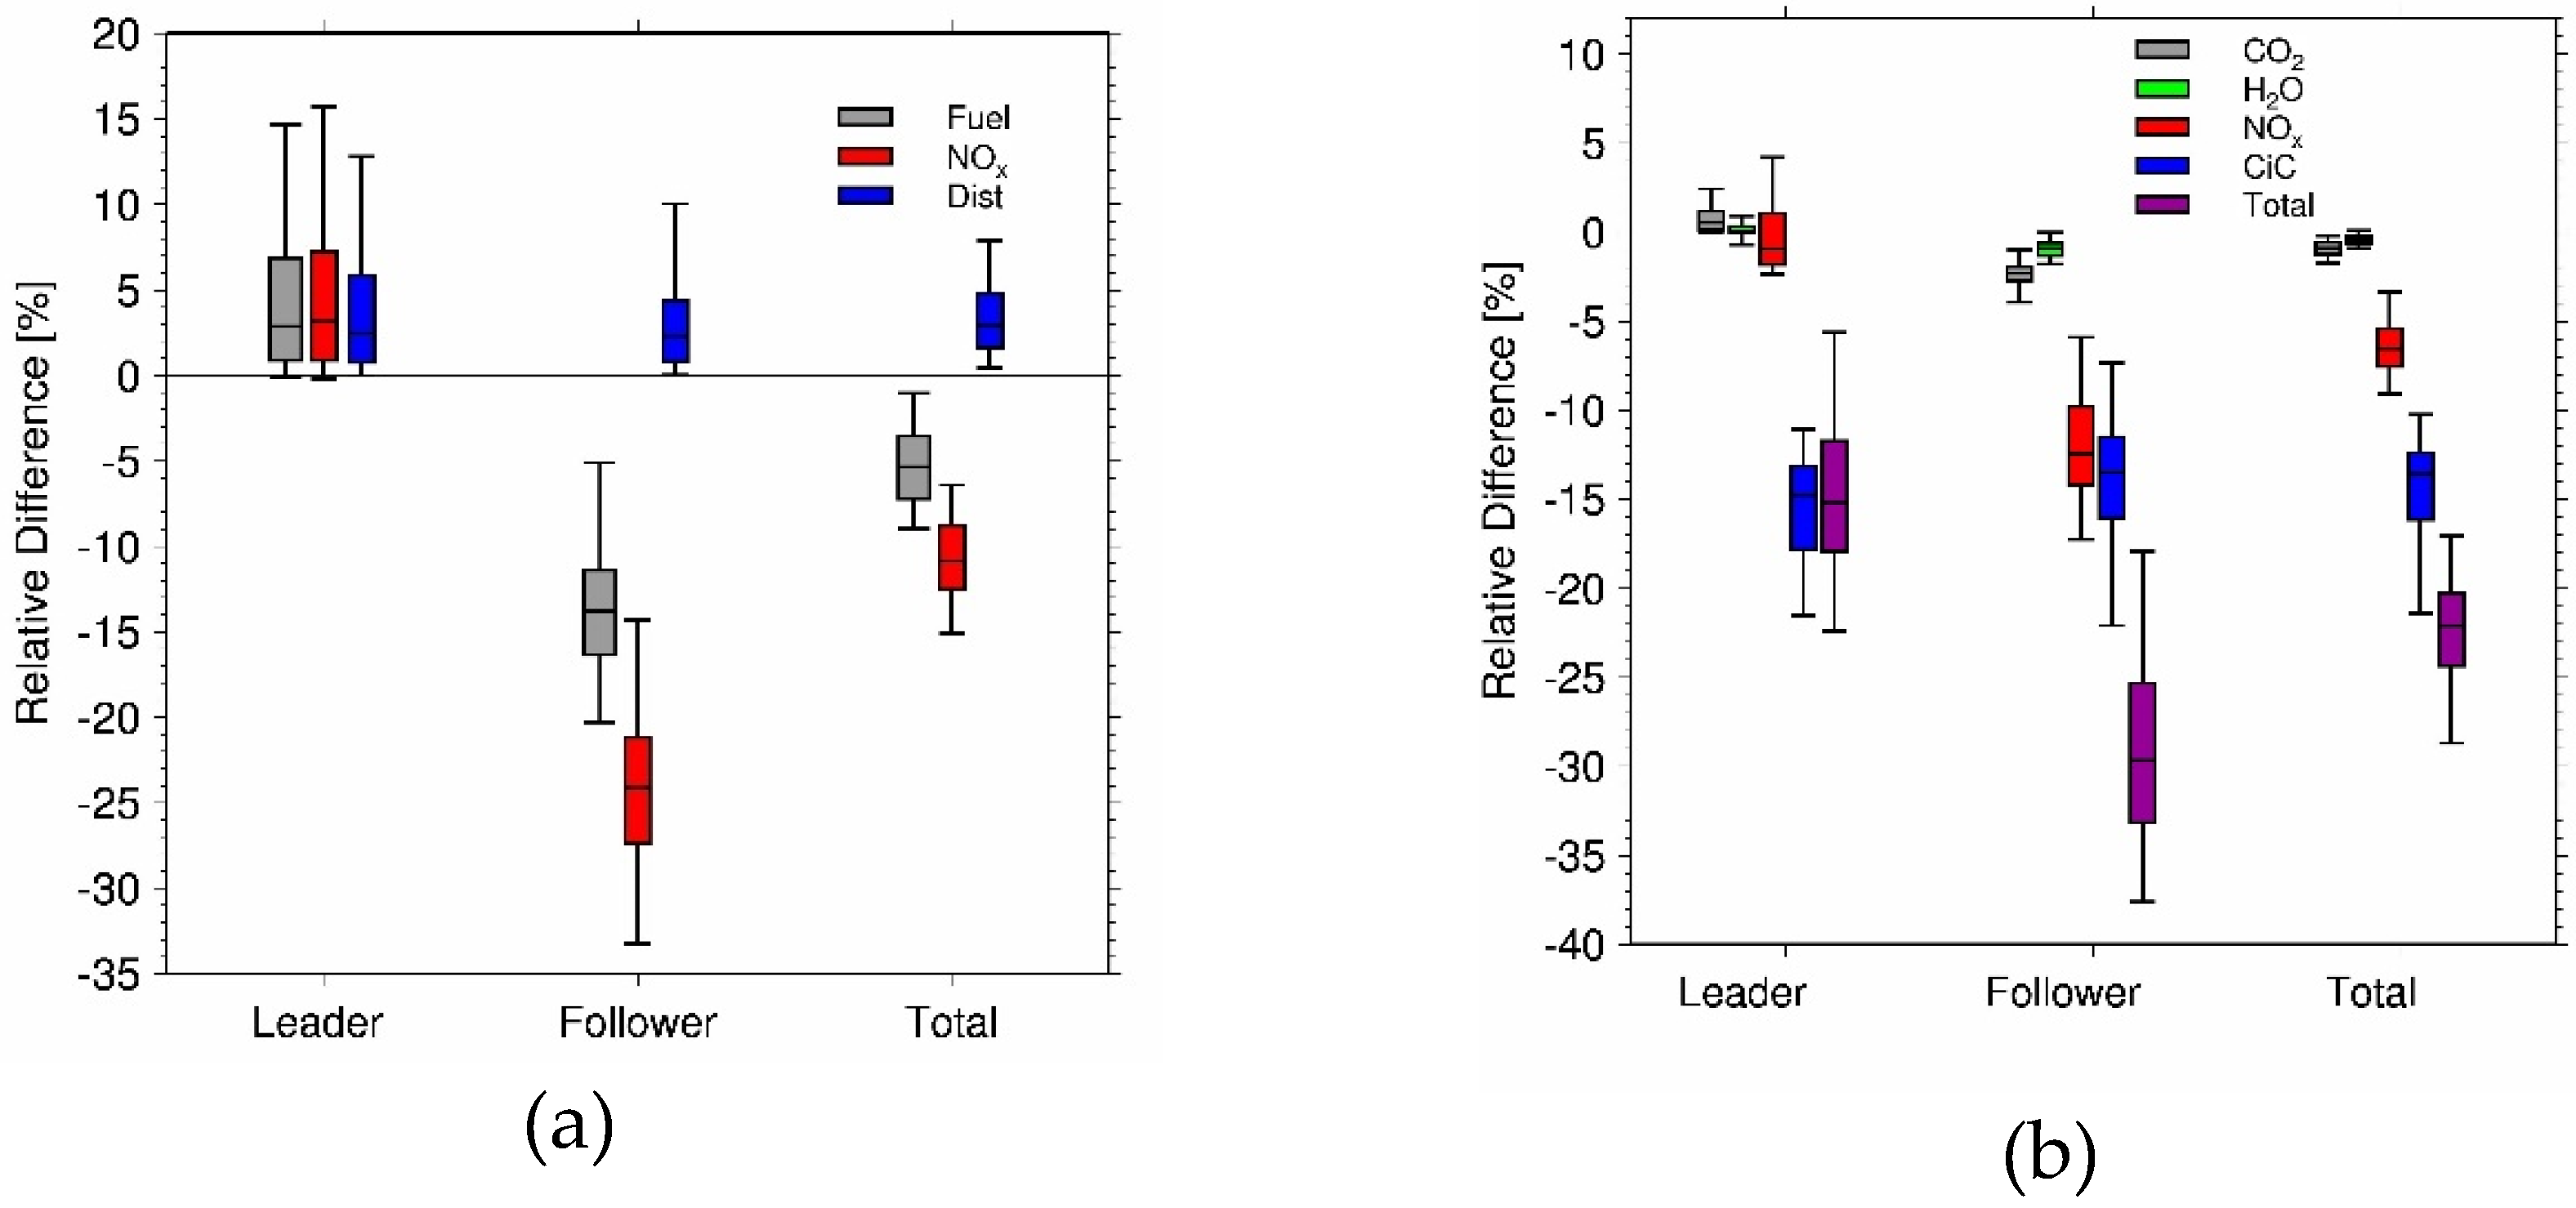
In order to provide a quantitative estimate of the formation flight mitigation potential, we present differences in the climate impact between the formation flight case and a reference case for four distinct scenarios. For the total formation (both aircraft together) fuel consumption as well as NOx emissions decrease by about 5% and 11%, respectively (Figure 3a). Nevertheless flying in formation reduces the fuel consumption and NOx emissions of the following aircraft (follower) by about 14% and 24%, but leads to increased fuel consumption and NOx emissions of the leading aircraft (leader) by 3%. The total flown distance increases by about 3% as both aircraft have to fly detours to the rendezvous points (geographic location where aircraft are scheduled to meet the other aircraft in order to start formation flight with AWSE). On average the aircraft are flying 83% of the total flown distance in formation, which means about 17% of the total flown distance is from origin airport to rendezvous points and from separation point to the destination airport. The decrease in NOx emissions by 24% for the follower is clearly larger than the reduction in fuel consumption by 14%, because the emission index of NOx is not constant but increases with thrust settings. As the follower needs less thrust the NOx emissions decrease more than linearly.
Relative changes in resulting climate impact, indicated as average temperature response (ATR100), for the leading and following aircraft as well as for the total formation for the T50 scenario with constant altitude (FCA) and flight speed (FCM) are presented in Figure 3b. The total climate impact mitigation potential for the total formation (Total) is about 22%, while the climate impact of the leader is reduced by 15% and the climate impact of follower is reduced by 30%. Although the mitigation potential due to saturation effects is evenly split between leader and follower, the total mitigation potential of the leader is smaller than for the follower, as the emission of the leader increases, while the emission of the follower decreases due to formation flight.
Changes in total climate impact originate from individual effects of aircraft emissions, comprising CO2 and non-CO2 effect. We performed a detailed analysis of which individual effects dominate the mitigation potential. The main contributor to the reduced climate impact is the reduced impact of contrail cirrus (CiC) due to the saturation effects described above. This shows a mitigation potential associated with a reduced contrail cirrus effect of about 14% (Figure 3b). Additionally, 7% reduction can be attributed due to reduced NOx emissions, while the impact of CO2 due to reduced fuel consumption amount to only about 1%. Summing up these relative contributions, results in an overall mitigation potential of 22% for the total formation.
Comparing individual impacts between leader and follower shows that while contrail effects are estimated to be reduced by about the same amount for both aircraft, this is not the case for CO2 and NOx. Here stronger differences of reductions between leader and follower become apparent. Change of climate impact of CO2 amounts to +1% versus −2%, comparing leader to follower. This difference can be directly attributed to the changed emissions, as the impact is directly proportional to emitted amounts. Note, that the change in climate impact of the different species is presented relative to the total climate impact, i.e., it is weighted by the contribution of the species to the total climate impact. The relative reduction in H2O emissions is the same as that of CO2, but the impact of H2O is smaller and therefore the relative change is smaller. The NOx climate impact of the leader is reduced by −1% while the climate impact of the follower is reduced by −12%. This difference is partly attributed to changed emissions (reduced by more than 20% for the follower), which additionally have a lower efficiency and hence lower impact, as non-linear photochemical processes drive ozone formation in the atmosphere. On the other hand the leading aircraft emits about 3% more nitrogen oxides, which results in overall benefit of about −1% due to the lower efficiency. Summarizing effects from leader and follower aircraft results in a total climate impact benefit associated to nitrogen oxide emissions of about 7%.
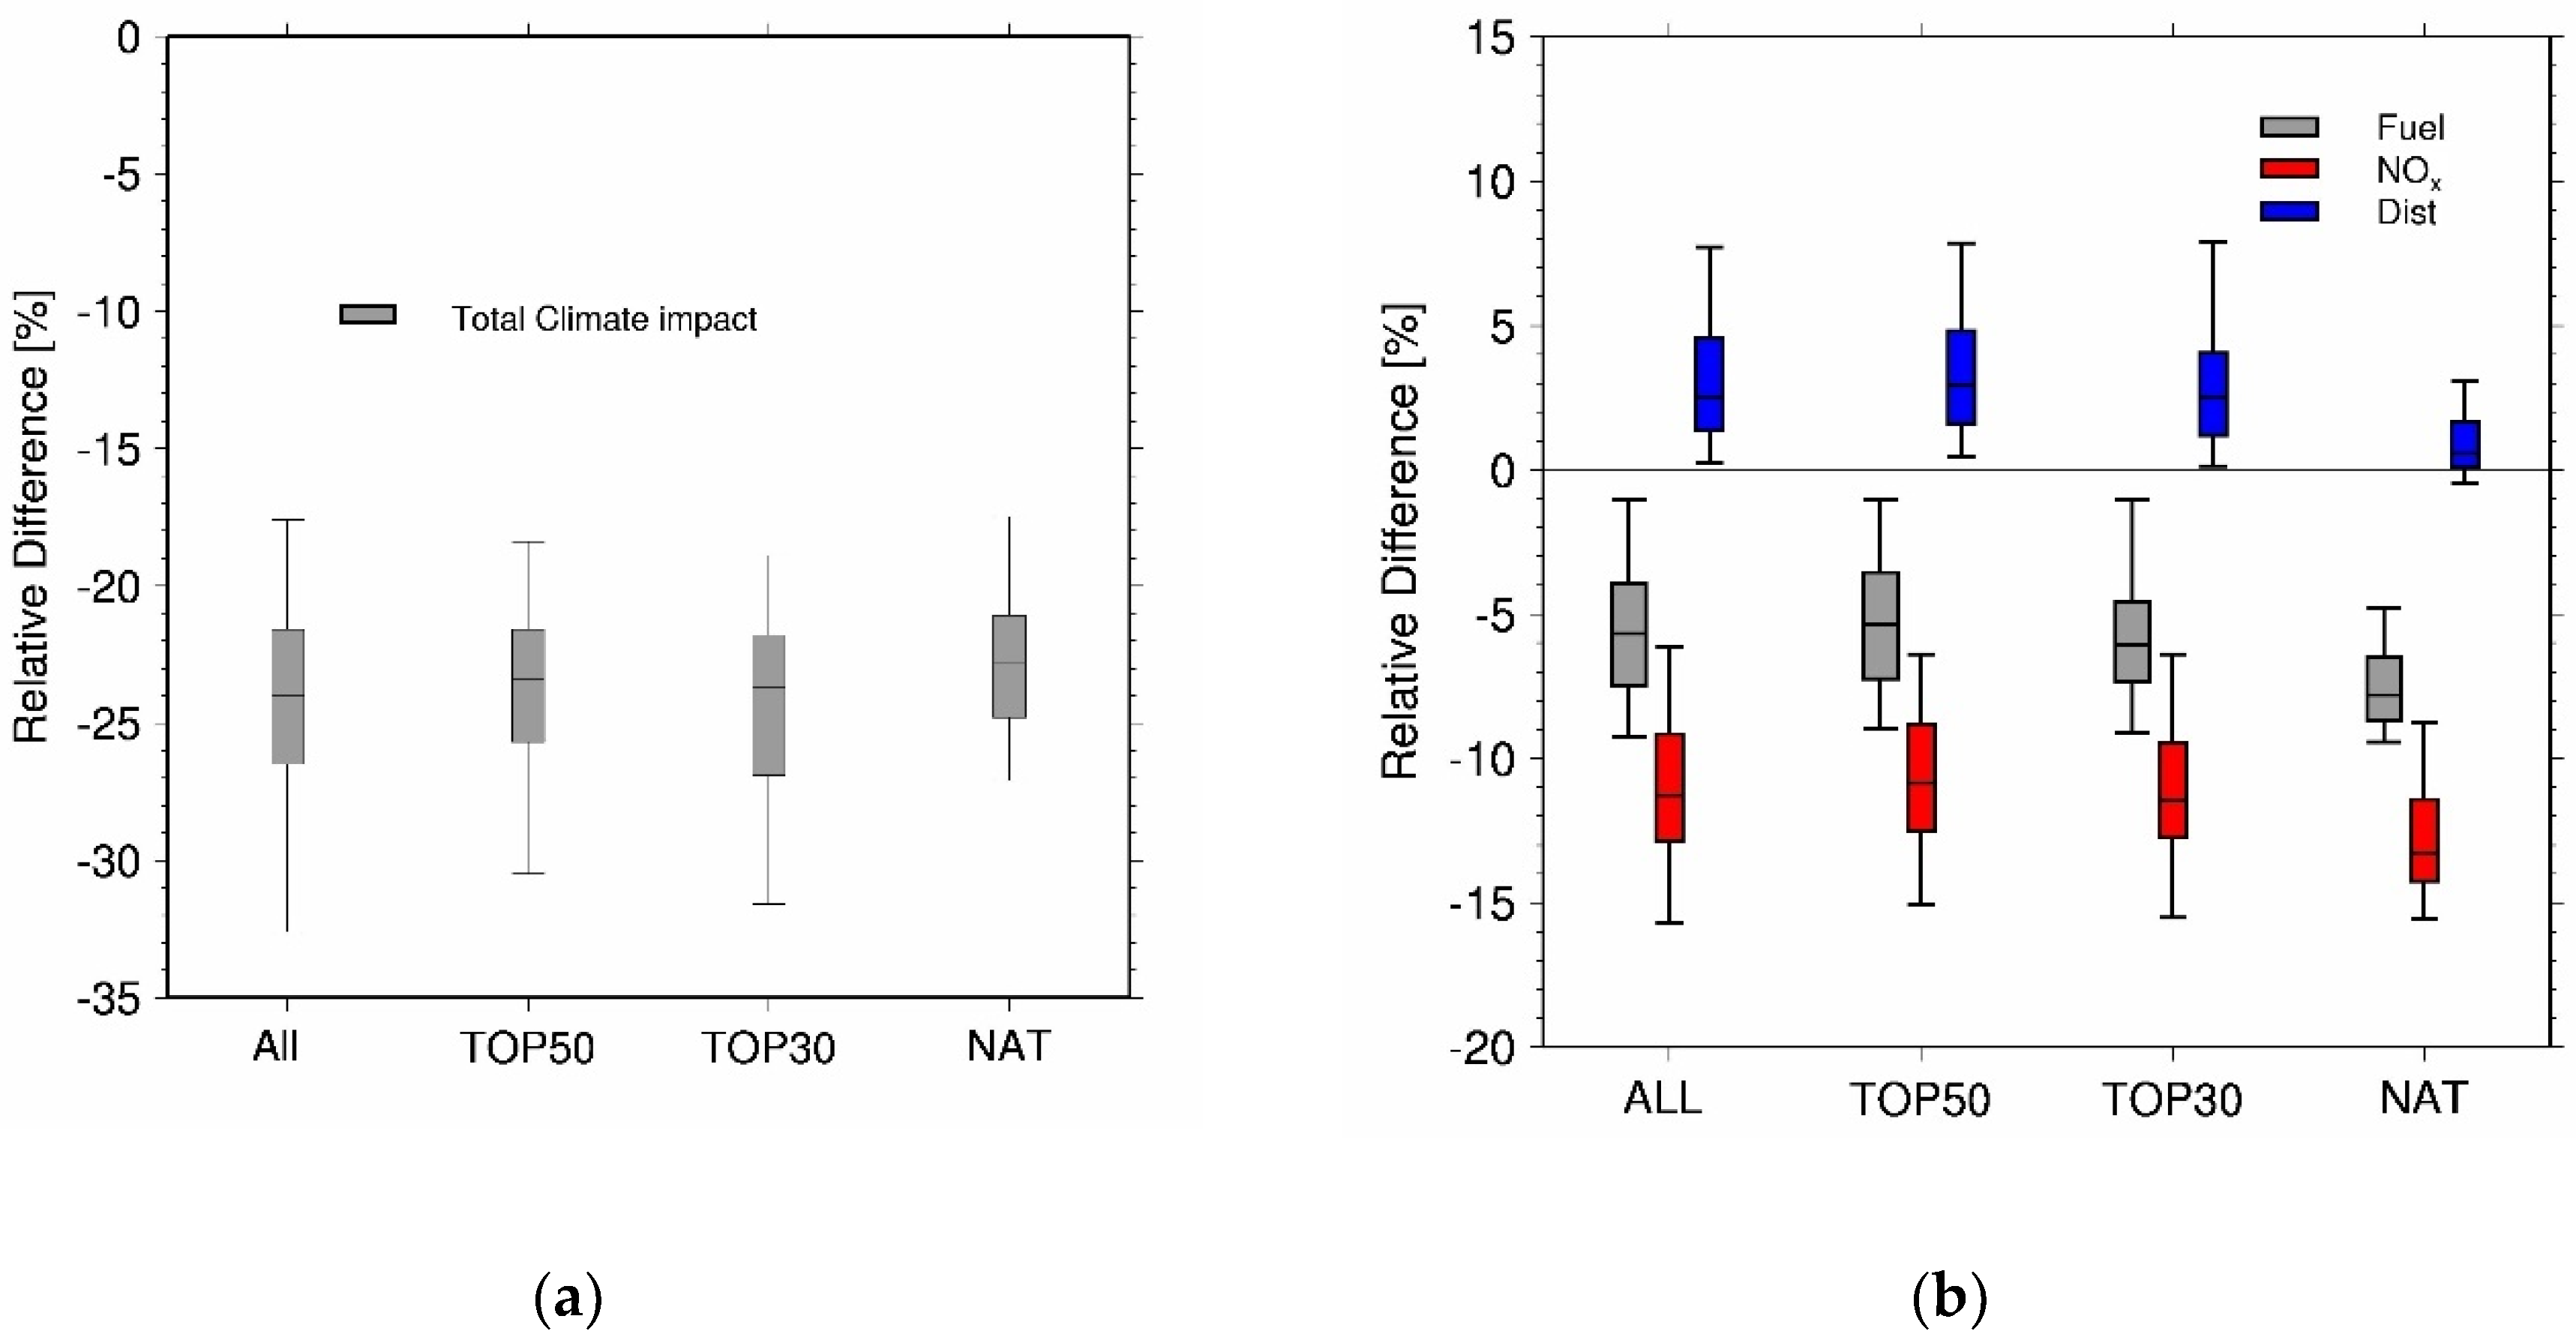
Beside the T50 scenario, climate impact of all three additional cases are analyzed: All, T30 and NAT. Comparing the total mitigation potential of these case studies, shows only a small variation of the median of the estimated mitigation potential between 22% and 23% (Figure 4a). Nevertheless there is a large spread (16 to 30%) in the total impact of the individual formations in the traffic sample (shown by bars and whiskers). Only the NAT study shows slightly reduced spread from 17% to 26% reduction. The fuel consumption and NOx emissions for the formation flights of the global study are reduced by about 6% and 11%, respectively (Figure 4b). In contrast the flown distances are increased by about 3%. For the NAT study the fuel consumption and NOx emissions are reduced by 8% and 13%, respectively, while the flown distance is increased by only 1%. A reason therefore is that the difference of the trajectories between formation flight and reference case without formation is smaller as the airports are closer and the detours are shorter. Nevertheless, the climate mitigation potential is slightly lower than for the global studies. This is due to saturation effects from contrails which already occur in the NAFC as the air traffic is very dense in this region [35]. Comparing the different cases show that the mitigation potential is relatively robust for the different cases.
4. Discussion
Flying in formation as inspired by migrant birds seems to be a promising option to reduce aviation’s climate impact. Our case studies showed reduced emissions of 6% in CO2 and 11% in NOx, although the flown distance increased by 1–3% due to detours to the rendezvous points. The climate impact of the total formation is reduced by about 23%. While one part of this mitigation potential can be attributed to the reduced emissions, a second part can be attributed to changes in the atmospheric processes involved, during contrail processes and formation of aviation–induced ozone in the atmosphere. Therefore, as emissions decrease and non-linear response of non-CO2 aviation impacts further emphasize this decrease, overall change in climate impact is even larger than the reduced emissions would suggest.
However, this mitigation potential was evaluated only for those formations that have a potential for formation flight and which currently (using available flight plans) represent only a small fraction of global flights [26]. By selecting departure time under consideration of AWSE formation flight options a much larger fraction of aircraft pairs could be established and would eventually raise the full climate mitigation potential.
In order to determine the non-linearity factor of nitrogen oxides, we performed a set of sensitivity studies for Spring conditions with strong photochemistry and quantified non-linear response of changes in ozone concentration and associated radiative impacts which are induced by aviation emissions in the North Atlantic flight corridor. The received non-linearity factor of NOx is nevertheless used for the whole world. As the air traffic density as well as the chemical regimes vary, the non-linearity would differ in different regions. Nevertheless, this analysis is a first assessment for the total climate mitigation potential of formation flight. What has been studied in detail was the microphysical processes when two contrails overlay. For the associated effect on climate change proxy quantities had to be used. Combining high-resolution contrail models with a detailed radiative transfer model one could provide RF estimates which would establish a closer link to quantities used in AirClim. Moreover, AirClim used a constant non-linearity parameter for the contrail effect, even though the high-resolution model found the extent of saturation to vary moderately with the atmospheric background. The estimate of the climate impact mitigation potential is done on a climatological base. As the ozone photochemistry as well as the contrail formation depends on the specific weather conditions, the impact and associated mitigation potential on individual days vary strongly. The presented mitigation potential is an annual average on a climatological basis which is important for assessing the overall mitigation potential of formation flight. In order to identify the mitigation potential on a specific day, detailed representation of spatially and temporal dependent atmospheric conditions is required.
The uncertainties in analyzing the climate impact of aviation are partly large. Nevertheless Dahlmann et al. (2016) [20] showed that analyzing relative differences between scenarios as we do in our study tough lead to a reliable assessment of mitigation potentials, as atmospheric uncertainties are often correlated.
Author Contributions
Conceptualization, V.G., T.M. and S.M.; methodology, K.D., S.M. and H.Y.; writing—original draft preparation, K.D.; writing—review and editing, K.D., S.M., H.Y., S.U., V.G. and T.M.; visualization, K.D. and S.M.; project administration, V.G.; funding acquisition, V.G. and T.M. All authors have read and agreed to the published version of the manuscript.
Funding
This research was funded by the German Ministry of Economic Affairs and Energy (BMWi) under the National Aeronautical Research Programme (LuFo) V-2 under the grant agreement no. 20E1508C.
Acknowledgments
Work in this article was supported by DLR project Eco2Fly (2018–2022). High performance supercomputing resources were used from the German DKRZ Deutsches Klimarechenzentrum Hamburg.
Conflicts of Interest
The authors declare no conflict of interest. The funders had no role in the design of the study; in the collection, analyses, or interpretation of data; in the writing of the manuscript, or in the decision to publish the result.
Appendix A

Table A1.
List of airports used in the T50 study.
| IATA Code | City/Airport | Country |
|---|---|---|
| ATL | Atlanta (GA)-Hartsfield Atlanta International Airport | USA |
| PEK | Beijing | China |
| DXB | Dubai-Dubai International Airport | United Arab Emirates |
| HND | Tokyo-Haneda | Japan |
| LAX | Los Angeles (CA)-International | USA |
| ORD | Chicago (IL), O’Hare International Airport | USA |
| LHR | London-Heathrow | United Kingdom |
| HKG | Hong Kong-International Airport (HKIA) | Hong Kong |
| PVG | Shanghai-Pu Dong | China |
| CDG | Paris-Charles de Gaulle | France |
| AMS | Amsterdam-Amsterdam Airport Schiphol | Netherlands |
| DFW | Dallas/Ft. Worth (TX)-Dallas/Fort Worth International | USA |
| CAN | Guangzhou (Canton)-Baiyun International Airport | Guangdong, PR China |
| FRA | Frankfurt/Main-Frankfurt Airport (Rhein-Main-Flughafen) | Germany |
| IST | Istanbul-Istanbul Atatürk Airport | Turkey |
| DEL | Delhi-Indira Gandhi International Airport | India |
| CGK | Jakarta-Soekarno-Hatta International | Indonesia |
| SIN | Singapore-Changi | Singapore |
| ICN | Seoul-Incheon International Airport | Korea South |
| DEN | Denver (CO)-Denver International Airport | USA |
| BKK | Bangkok, Suvarnabhumi International | Thailand |
| JFK | New York-John F. Kennedy (NY) | USA |
| KUL | Kuala Lumpur-International Airport | Malaysia |
| SFO | San Francisco-International Airport, SA | USA |
| MAD | Madrid-Barajas Airport | Spain |
| CTU | Chengdu-Shuangliu | Sichuan, PR China |
| LAS | Las Vegas (NV) | USA |
| BCN | Barcelona | Spain |
| BOM | Bombay (Mumbai)-Chhatrapati Shivaji International | India |
| YYZ | Toronto-Toronto Pearson International Airport | Canada |
| SEA | Seattle/Tacoma (WA) | USA |
| CLT | Charlotte (NC) | USA |
| LGW | London-Gatwick | United Kingdom |
| SZX | Shenzhen-Shenzhen Bao’an International | Guangdong, PR China |
| TPE | Taipei-Chiang Kai Shek | Taiwan |
| MEX | Mexico City-Mexico City International Airport | Mexico |
| KMG | Kunming Changshui International Airport | Yunnan, PR China |
| MUC | Muenchen (Munich)-Franz Josef Strauss | Germany |
| MCO | Orlando-International Airport (FL) | USA |
| MIA | Miami (FL) | USA |
| PHX | Phoenix (AZ)-Sky Harbor International | USA |
| SYD | Sydney-Sydney Airport | Australia |
| EWR | New York-Newark (NJ) | USA |
| MNL | Manila-Ninoy Aquino International | Philippines |
| SHA | Shanghai-Hongqiao | China |
| XIY | Xi’an-Xianyang | Shaanxi, PR China |
| FCO | Rome-Fuimicino | Italy |
| IAH | Houston, TX-George Bush Intercontinental Airport | USA |
| NRT | Tokyo-Narita | Japan |
| SVO | Moscow-Sheremetyevo | Russia |
References
- Weimerskirch, H.; Martin, J.; Clerquin, Y.; Alexandre, P.; Jiraskova, S. Energy saving in flight formation. Nature 2001, 413, 697–698. [Google Scholar] [CrossRef]
- Xu, J.; Ning, A.; Bower, G.; Kroo, I. Aircraft Route Optimization for Formation Flight. J. Aircr. 2014, 51, 490–501. [Google Scholar] [CrossRef] [Green Version]
- Unterstrasser, S.; Stephan, A. Far field wake vortex evolution of two aircraft formation flight and implications on young contrails. Aeronaut. J. 2020, 124, 667–702. [Google Scholar] [CrossRef] [Green Version]
- Unterstrasser, S. The contrail mitigation potential of aircraft formation flight derived from high-resolution simulations. Aerospace 2020, 7, 170. [Google Scholar] [CrossRef]
- Liu, S.C.; Trainer, M.; Fehsenfeld, F.C.; Parrish, D.D.; Williams, E.J.; Fahey, D.W.; Hübler, G.; Murphy, P.C. Ozone production in the rural troposphere and the implications for regional and global ozone distributions. J. Geophys. Res. 1987, 92, e4191–e4207. [Google Scholar] [CrossRef]
- Lin, X.; Trainer, M.; Liu, S.C. On the nonlinearity of the tropospheric ozone production. J. Geophys. Res. 1988, 93, 15879–15888. [Google Scholar] [CrossRef] [Green Version]
- Grooß, J.-U.; Brühl, C.; Peter, T. Impact of aircraft emissions on tropospheric and stratospheric ozone. Part I: Chemistry and 2-D model results. Atmos. Environ. 1998, 32, 3152–3184. [Google Scholar]
- Dahlmann, K.; Grewe, V.; Ponater, M.; Matthes, S. Quantifying the contributions of individual NOx sources to the trend in ozone radiative forcing. Atmos. Environ. 2011, 45, 2860–2868. [Google Scholar] [CrossRef] [Green Version]
- Grewe, V.; Dahlmann, K.; Matthes, S.; und Steinbrecht, W. Attributing ozone to NOx emissions: Implications for climate mitigation measures. Atmos. Environ. [CrossRef] [Green Version]
- Grewe, V.; Matthes, S.; Dahlmann, K. The contribution of aviation NOx emissions to climate change: Are we ignoring methodological flaws? Environ. Res. Lett. 2019, 14, 121003. [Google Scholar] [CrossRef]
- Liu, Y. Investigation on the Benefit and Feasibility of Applying Formation Flight to Civil Transport Aircraft. Ph.D. Thesis, RWTH Aachen, Aachen, Germany, 2016. [Google Scholar]
- Roeckner, E.; Brokopf, R.; Esch, M.; Giorgetta, M.; Hagemann, S.; Kornblueh, L.; Manzini, E.; Schlese, U.; Schulzweida, U. Sensitivity of Simulated Climate to Horizontal and Vertical Resolution in the ECHAM5 Atmosphere Model. J. Clim. 2006, 19, 3771–3791. [Google Scholar] [CrossRef]
- Jöckel, P.; Tost, H.; Pozzer, A.; Kunze, M.; Kirner, O.; Brenninkmeijer, C.A.M.; Brinkop, S.; Cai, D.S.; Dyroff, C.; Eckstein, J.; et al. Earth System Chemistry integrated Modelling (ESCiMo) with the Modular Earth Submodel System (MESSy) version 2.51. Geosci. Model Dev. 2016, 9, 1153–1200. [Google Scholar] [CrossRef] [Green Version]
- Sander, R.; Baumgaertner, A.; Gromov, S.; Harder, H.; Jöckel, P.; Kerkweg, A.; Kubistin, D.; Regelin, E.; Riede, H.; Sandu, A.; et al. The atmospheric chemistry box model CAABA/MECCA-3.0. Geosci. Model Dev. 2011, 4, 373–380. [Google Scholar] [CrossRef]
- Owen, B.; Lim, L.L.; Gray, E.; Lee, D.S. Emission Inventories for Sensitivity Studies, CATE; Data Originators: Lim, Ling (MMU); Manchester Metropolitan University: Manchester, UK, 2011. [Google Scholar]
- Smolarkiewicz, P.K.; Margolin, L.G. On Forward-in-Time Differencing for Fluids; An Eulerian/Semi-Lagrangian Nonhydrostatic Model for Stratified Flows. Atmos. Ocean. 1997, 35, 127–152. [Google Scholar] [CrossRef]
- Sölch, I.; Kärcher, B. A large-eddy model for cirrus clouds with explicit aerosol and ice microphysics and Lagrangian ice particle tracking. Q. J. R. Meteorol. Soc. 2010, 136, 2074–2093. [Google Scholar] [CrossRef] [Green Version]
- Unterstrasser, S.; Gierens, K.; Sölch, I.; Wirth, M. Numerical simulations of homogeneously nucleated natural cirrus and contrail-cirrus. Part 2: Interaction on local scale. Meteorol. Z. 2017, 26, 643–661. [Google Scholar] [CrossRef]
- Grewe, V.; Stenke, A. Airclim: An efficient tool for climate evaluation of aircraft technology. Atmo. Spheric. Chem. Phys. 2008, 8, 4621–4639. [Google Scholar] [CrossRef] [Green Version]
- Dahlmann, K.; Grewe, V.; Frömming, C.; Burkhardt, U. Can we reliably assess climate mitigation options for air traffic scenarios despite large uncertainties in atmospheric processes? Transp. Res. Part D Transp. Environ. 2016, 46, 40–55. [Google Scholar] [CrossRef] [Green Version]
- Grewe, V.; Bock, L.; Burkhardt, U.; Dahlmann, K.; Gierens, K.; Hüttenhofer, L.; Unterstrasser, S.; Gangoli Rao, A.; Bath, A.; Yin, F.; et al. Assessing the climate impact of the AHEAD multi-fuel blended wing body. Meteorol. Z. 2016. [Google Scholar] [CrossRef]
- Grewe, V.; Plohr, M.; Cerino, G.; Di Muzio, M.; Deremaux, Y.; Galerneau, M.; de Staint Martin, P.; Chaika, T.; Hasselrot, A.; Tengzelius, U.; et al. Estimates of the climate impact of future small-scale supersonic transport aircraft–results from the HISAC EU-project. Aeronaut. J. 2010, 114, 199–206. [Google Scholar] [CrossRef] [Green Version]
- Hepting, M.; Pak, H.; Grimme, W.; Dahlmann, K.; Jung, M.; Wilken, D. Climate impact of German air traffic: A scenario approach. Transp. Res. Part D 2020, 85, 102467. [Google Scholar] [CrossRef]
- Lee, D.S.; Fahey, D.W.; Skowron, A.; Allen, M.R.; Burkhardt, U.; Chen, Q.; Doherty, S.J.; Freeman, S.; Forster, P.M.; Fuglestvedt, J.; et al. The contribution of global aviation to anthropogenic climate forcing for 2000 to 2018. Atmos. Environ. 2020. [Google Scholar] [CrossRef] [PubMed]
- Grewe, V.; Dahlmann, K. How ambiguous are climate metrics? And are we prepared to assess and compare the climate impact of new air traffic technologies? Atmos. Environ. 2015, 106, 373–374. [Google Scholar] [CrossRef] [Green Version]
- Marks, T.; Dahlmann, K.; Grewe, V.; Gollnick, V.; Linke, F.; Matthes, S.; Stumpf, E.; Unterstrasser, S.; Yamashita, H.; Zumegen, C. Climate Impact Mitigation Potential of Formation Flight. Aerospace 2020. submitted. [Google Scholar]
- IPCC. ‘Aviation and the Global Atmosphere’ A Special Report of IPCC Working Groups I and III. Intergovernmental Panel on Climate Change; Cambridge University Press: Cambridge, UK; New York, NY, USA, 1999. [Google Scholar]
- Nakicenovic, N.; Alcamo, J.; Davis, G.; de Vries, B.; Fenhann, J.; Gaffin, S.; Gregory, K.; Grubler, A.; Jung, T.Y.; Kram, T.; et al. Special Report on Emissions Scenarios: A special report of Working Group III of the Intergovernmental Panel on Climate Change; Cambridge University Press: New York, NY, USA, 2000. [Google Scholar]
- Linke, F. Ökologische Analyse Operationeller Lufttransportkonzepte. Ph.D. Thesis, Technische Universität Hamburg-Harburg, Hamburg, Germany, 2016. [Google Scholar]
- Lührs, B. Erweiterung eines Trajektorienrechners zur Nutzung Meteorologischer Daten für die Optimierung von Flugzeugtrajektorien. Master’s Thesis, Hamburg University of Technology (TUHH), Hamburg, Germany, 2013. [Google Scholar]
- Marks, T.; Swaid, M.; Lührs, B.; Gollnick, V.; Center, G.A. Identification of optimal rendezvous and separation areas for formation flight under consideration of wind. In Proceedings of the 31st Congress of the International Council of the Aeronautical Sciences, Belo Horizonte, Brasilien, 9–14 September 2018. [Google Scholar]
- Irvine, E.A.; Hoskins, B.J.; Shine, K.P.; Lunnon, R.W.; Froemming, C. Characterizing North Atlantic weather patterns for climate-optimal aircraft routing. Meteorol. Appl. 2013, 20, 80–93. [Google Scholar] [CrossRef] [Green Version]
- Meerkötter, R.; Schumann, U.; Doelling, D.R.; Minnis, P.; Nakajima, T. und Tsushima, Y. Radiative forcing by contrails. Ann. Geophys. 1999, 17, 1080–1094. [Google Scholar] [CrossRef]
- Burkhardt, U.; Kärcher, B. Global radiative forcing from contrail cirrus. Nat. Clim. Chang. 2011, 1, 54–58. [Google Scholar] [CrossRef] [Green Version]
- Dahlmann, K.; Koch, A.; Linke, F.; Lührs, B.; Grewe, V.; Otten, T.; Seider, D.; Gollnick, V.; Schumann, U. Climate-compatible air transport system-climate impact mitigation potential for actual and future aircraft. Aerospace 2016, 3, 38. [Google Scholar] [CrossRef] [Green Version]
- Grewe, V.; Matthes, S.; Frömming, C.; Brinkop, S.; Jöckel, P.; Gierens, K.; Champougny, T.; Fuglestvedt, J.; Haslerud, A.; Irvine, E.; et al. Feasibility of climate-optimized air traffic routing for trans-Atlantic flights. Environ. Res. Lett. 2017, 12, 34003/1–34003/9. [Google Scholar] [CrossRef]
- Matthes, S.; Grewe, V.; Dahlmann, K.; Frömming, C.; und Irvine, E.; Lim, L.; Linke, F.; Lührs, B.; Owen, B.; Shine, K.; et al. A Concept for Multi-Criteria Environmental Assessment of Aircraft Trajectories. Aerospace 2017, 4, 42. [Google Scholar] [CrossRef] [Green Version]
Figure 1.
Schema of methodology.

Figure 2.
Ratio of aviation-induced ozone columns changes comparing the changes of doubling of emissions (DoubleNAFC) with those of halving of emissions (HalfNAFC): (DoubleNAFC-REF)/(REF-HalfNAFC). Values are shown for March. A value of 2 corresponds to linear behaviour of aviation-induced ozone changes.

Figure 3.
(a) Relative change in fuel consumption, NOx emissions and flown distances for leader, follower and the total formation for the Top50 scenario compared to the reference case where both aircraft fly not in formation. (b) Change in total climate impact and climate impact of the different species relative to the change in total climate impact. The bars indicate the 25% and 50% percentile and the whiskers indicate the 95% confidence interval of the different formations in one data set.

Figure 4.
(a) Relative change in total climate impact for the total formation for the T50 scenario in relation to the reference case, where all aircraft fly without formation. (b) Same as (a) but for fuel consumption, NOx emissions and flown distances. The bars indicate the 25% and 50% percentile and the whiskers indicate the 95% confidence interval of the different formations in one data set.

Publisher’s Note: MDPI stays neutral with regard to jurisdictional claims in published maps and institutional affiliations. |
© 2020 by the authors. Licensee MDPI, Basel, Switzerland. This article is an open access article distributed under the terms and conditions of the Creative Commons Attribution (CC BY) license (http://creativecommons.org/licenses/by/4.0/).
Share and Cite
MDPI and ACS Style
Dahlmann, K.; Matthes, S.; Yamashita, H.; Unterstrasser, S.; Grewe, V.; Marks, T. Assessing the Climate Impact of Formation Flights. Aerospace 2020, 7, 172. https://doi.org/10.3390/aerospace7120172
AMA Style
Dahlmann K, Matthes S, Yamashita H, Unterstrasser S, Grewe V, Marks T. Assessing the Climate Impact of Formation Flights. Aerospace. 2020; 7(12):172. https://doi.org/10.3390/aerospace7120172
Chicago/Turabian StyleDahlmann, Katrin, Sigrun Matthes, Hiroshi Yamashita, Simon Unterstrasser, Volker Grewe, and Tobias Marks. 2020. "Assessing the Climate Impact of Formation Flights" Aerospace 7, no. 12: 172. https://doi.org/10.3390/aerospace7120172
Note that from the first issue of 2016, this journal uses article numbers instead of page numbers. See further details here.