Fast Aircraft Turnaround Enabled by Reliable Passenger Boarding


Department of Air Transportation, German Aerospace Center (DLR), Lilienthalplatz 7, 38108 Braunschweig, Germany
Aerospace 2018, 5(1), 8; https://doi.org/10.3390/aerospace5010008
Submission received: 24 November 2017
/
Revised: 31 December 2017
/
Accepted: 9 January 2018
/
Published: 15 January 2018
(This article belongs to the Collection Air Transportation—Operations and Management)
Abstract
:Future 4D aircraft trajectories demand comprehensive consideration of environmental, economic, and operational constraints, as well as reliable prediction of all aircraft-related processes. Mutual interdependencies between airports result in system-wide, far-reaching effects in the air traffic network (reactionary delays). To comply with airline/airport challenges over the day of operations, a change to an air-to-air perspective is necessary, with a specific focus on the aircraft ground operations as major driver for airline punctuality. Aircraft ground trajectories primarily consists of handling processes at the stand (deboarding, catering, fueling, cleaning, boarding, unloading, loading), which are defined as the aircraft turnaround. Turnaround processes are mainly controlled by ground handling, airport, or airline staff, except the aircraft boarding, which is driven by passengers’ experience and willingness/ability to follow the proposed boarding procedures. This paper provides an overview of the research done in the field of aircraft boarding and introduces a reliable, calibrated, and stochastic aircraft boarding model. The stochastic boarding model is implemented in a simulation environment to evaluate specific boarding scenarios using different boarding strategies and innovative technologies. Furthermore, the potential of a connected aircraft cabin as sensor network is emphasized, which could provide information on the current and future status of the boarding process.
1. Introduction
International Civil Aviation Organization (ICAO) provides with the Aviation System Block Upgrades (ASBU) a timeline to implement efficient flight paths by full 4D trajectory-based operations [1]. In the ASBU Block 0 (available), improved airport operation through Airport Collaborative Decision Making (A-CDM [2]) is a mandatory element. The A-CDM concept aims at information-based decision management by online sharing of operational milestones among all stakeholders. It is expected that common awareness will result in improved processes and a balanced utilization of both local and network resources. Thus, the prediction and reliability of the TOBT (Target Off Block Time [3]) are essential to maintaining high arrival punctuality [4]. The next ASBU Block 1 (2018–2023) demands performance improvements through the application of SWIM (System Wide Information Management, see [5]) and increased interoperability through flight and flow information [6]. Since information and data management is becoming more important for the efficiency of the global air traffic management system [7], SWIM is one of the key elements of the U.S. NextGen and Single European Sky initiatives.
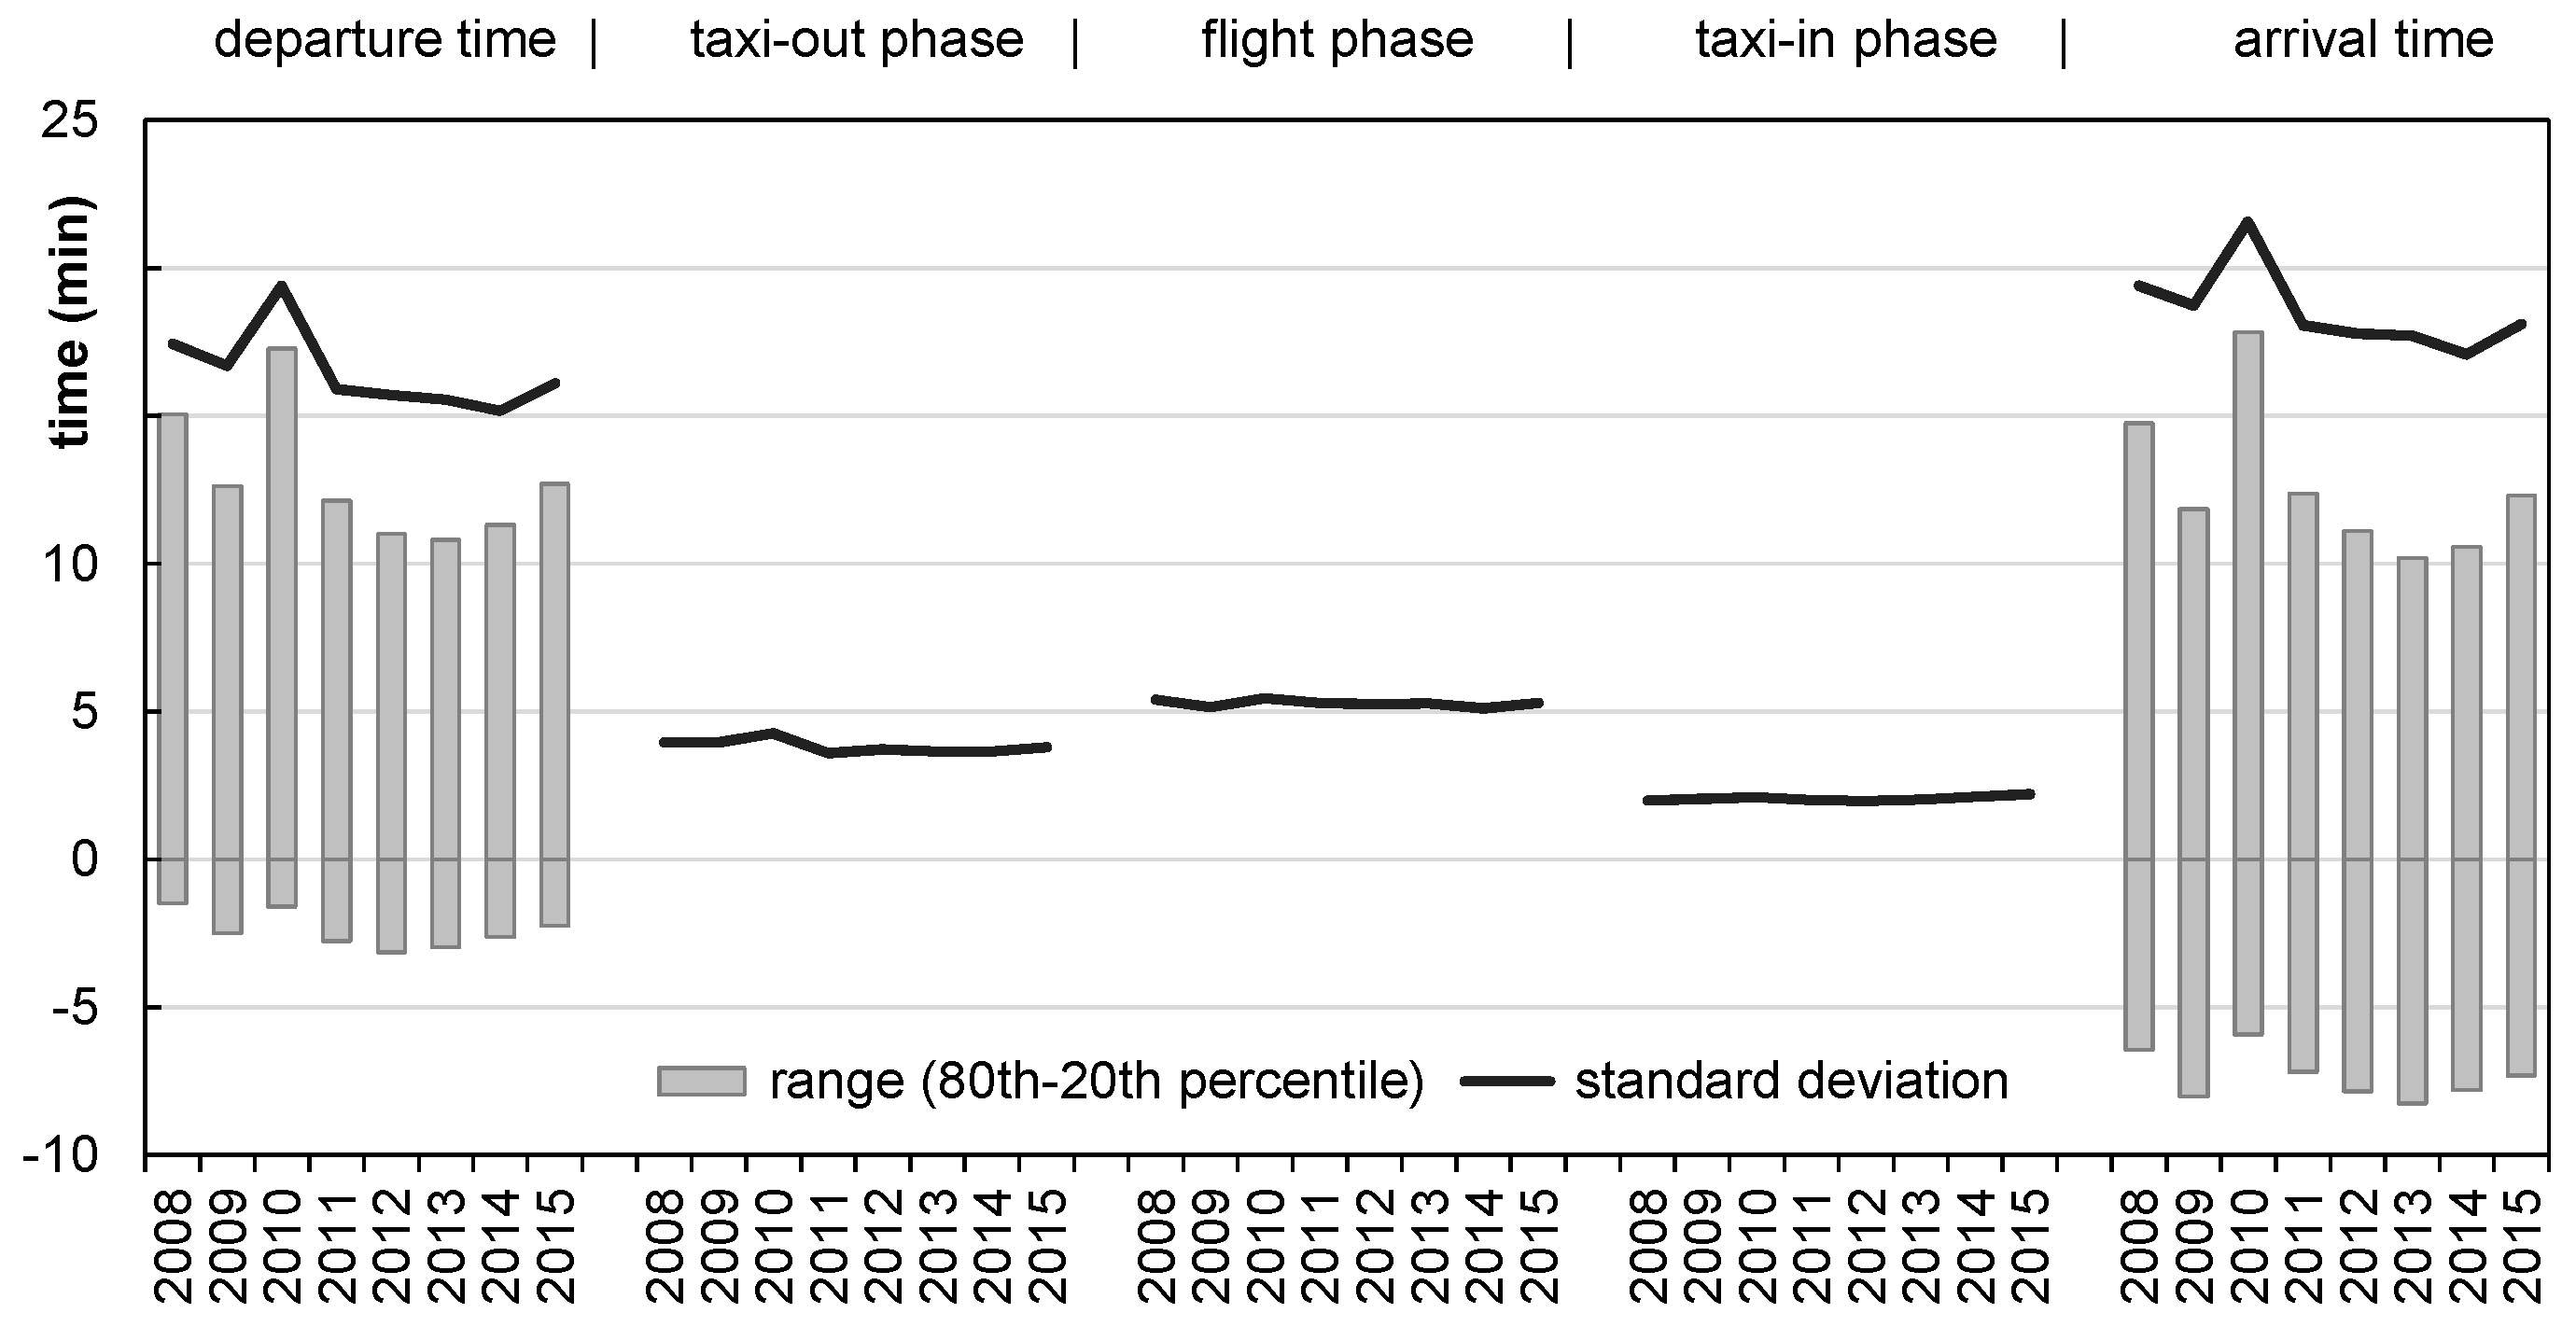
From an air transportation system view, a flight could be seen as a gate-to-gate or an air-to-air process: where gate-to-gate is more focused on the aircraft trajectory flown, the air-to-air process concentrates on the airport ground operations to enable efficient flight operations and reliable departure times. Typical standard deviations for airborne flights are 30 s at 20 min before arrival [8], but could increase to 15 min when the aircraft is still on the ground [9]. As Figure 1 demonstrates, the average time variability (measured as standard deviation) is higher in the flight phase (5.3 min) than in the taxi-out (3.8 min) and taxi-in (2.0 min) phase but significantly lower than the variability of both departure (16.6 min) and arrival (18.6 min) [10]. If the aircraft is departing the airport, changes with regards to the arrival time are comparatively small [11]. Thus, the arrival punctuality is clearly driven by the departure punctuality.
Punctual air traffic operations depend on the performance of all parties involved (airlines, airport, network management, air navigation service provider). To achieve a target value of punctuality, airlines implement time buffers to compensate for deviations at the operational level. In 2016 only 80.5% of the flights were punctual (delay shorter than 15 min)—a decreasing trend since 2013, when there was 84% punctuality [10].
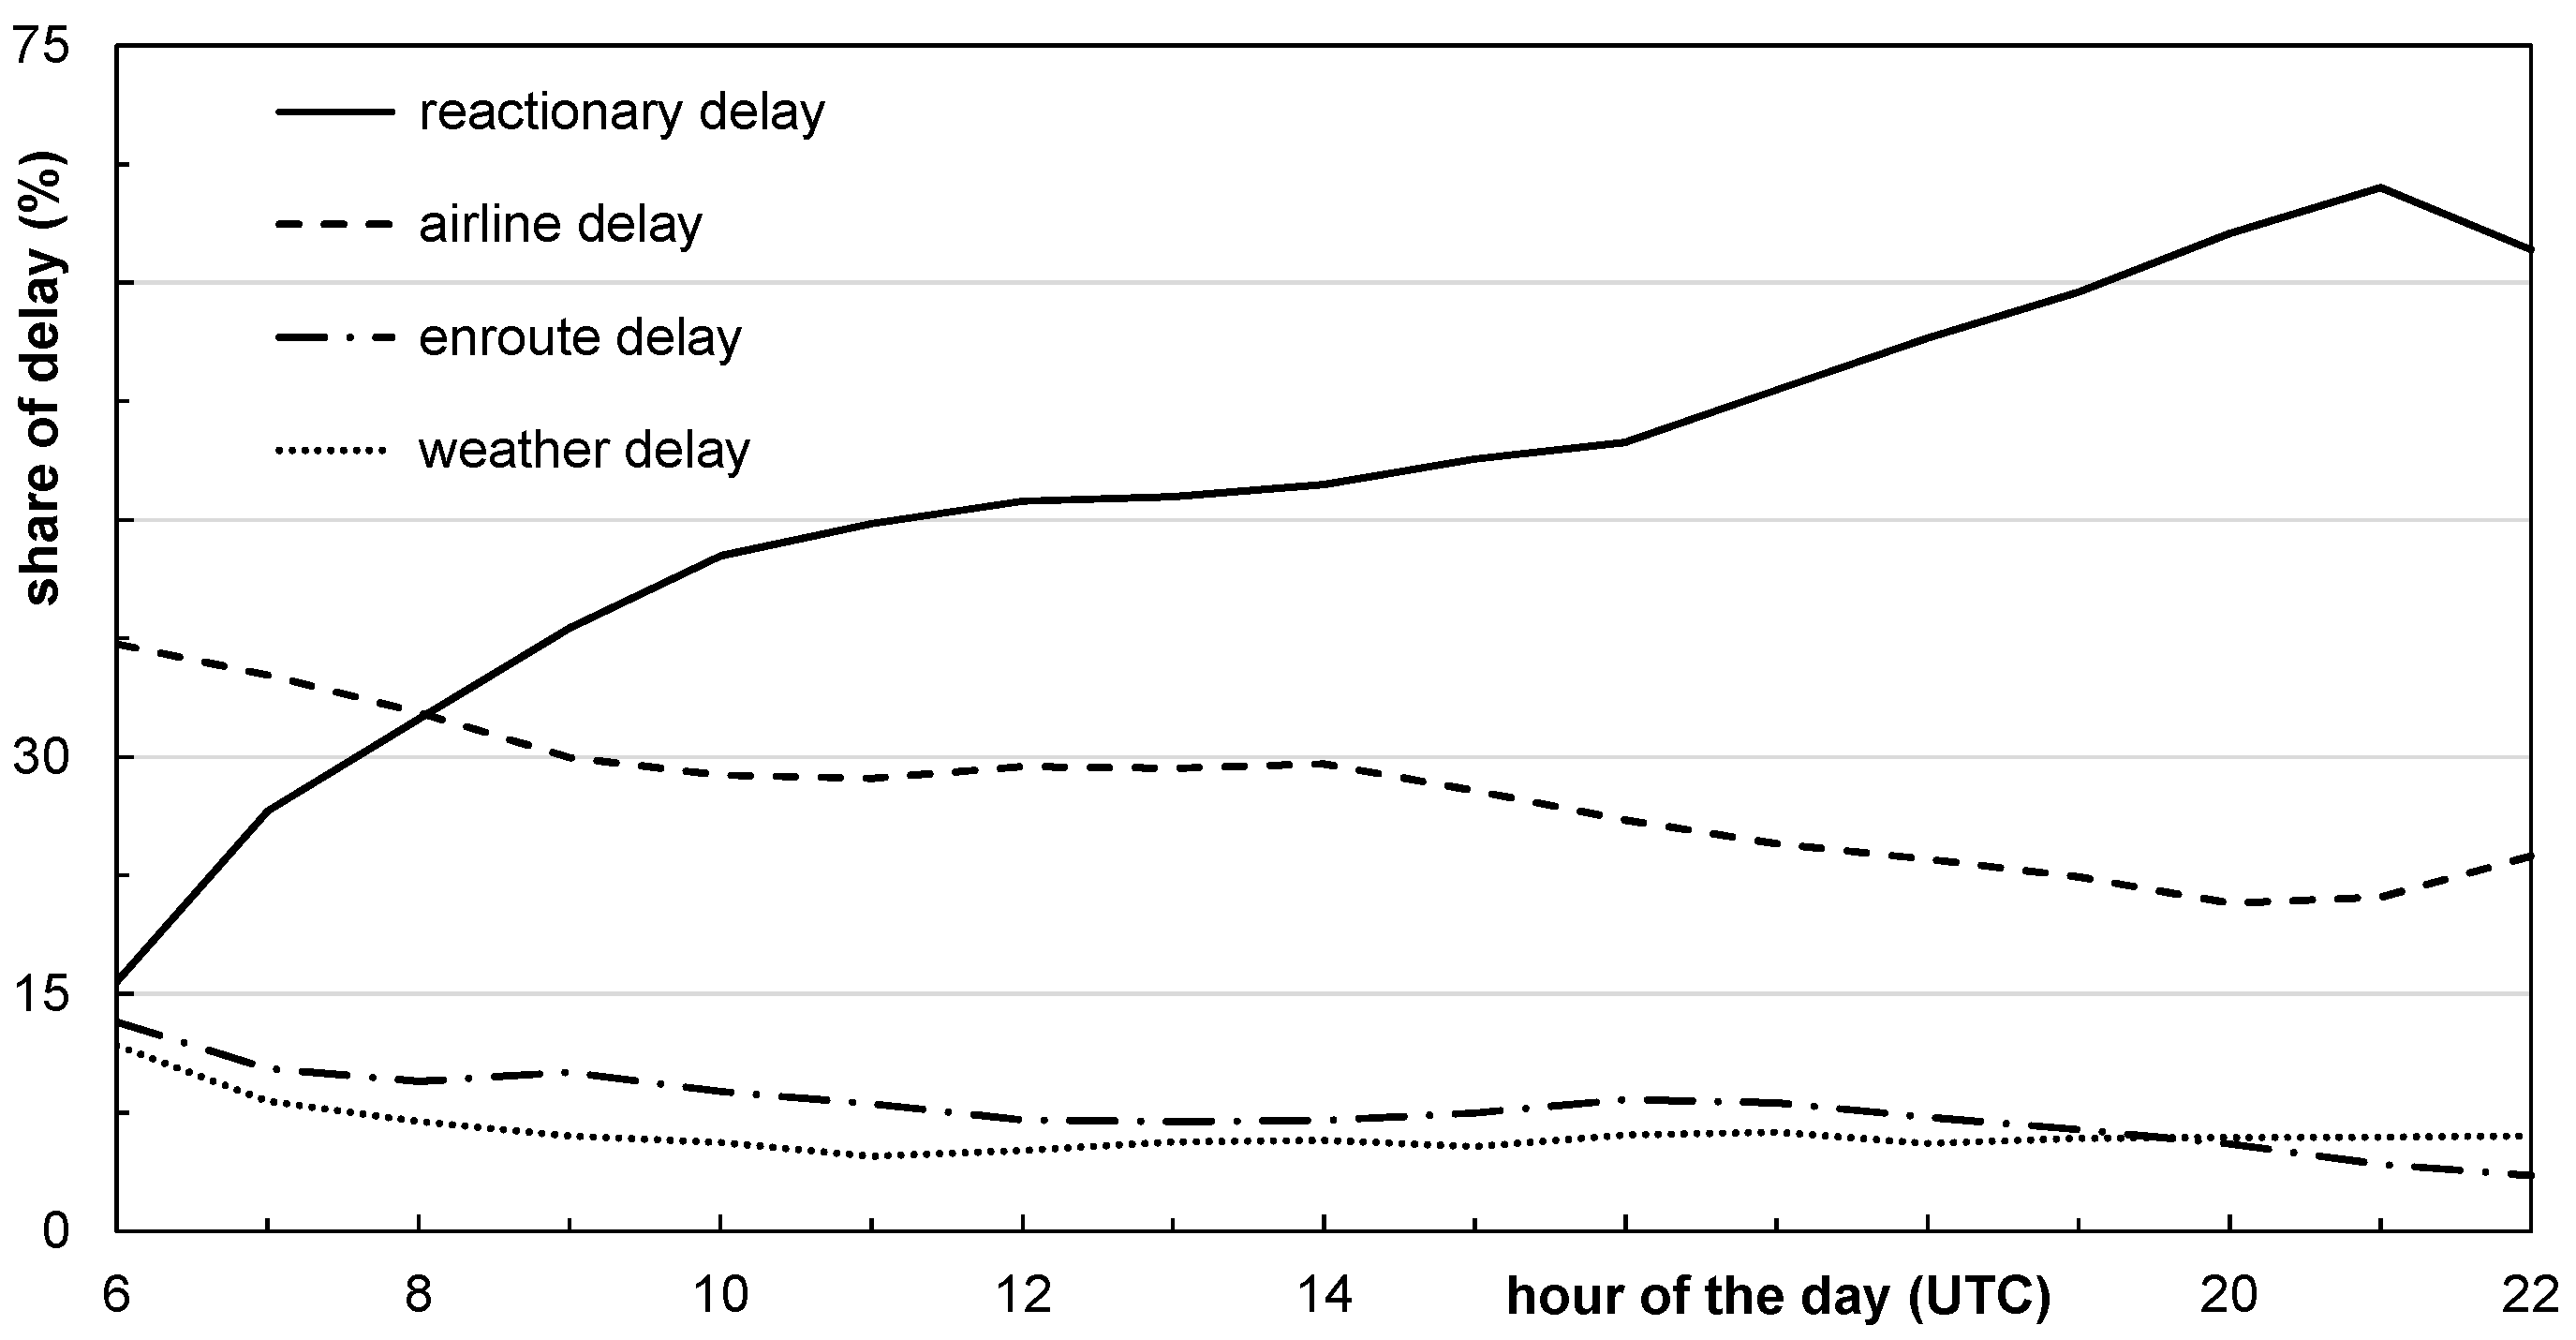
In Figure 2 the departure delay is analyzed and broken down into four delay groupings: airline, reactionary, en route (Air Traffic Flow Management, ATFM), and weather (other than ATFM, but ATFM delays due to weather at destination) delays. This grouping is based on the standard IATA delay codes defined in the Airport Handling Manual [12]. The airline delay causes range from delay code 11 “late check-in (passenger and baggage)” to delay code 69 “captain request for security check”. The reactionary delay (code 91–96) considers causes of load connection: check-in error, rotation (aircraft, crew, cabin crew), and operations control.
The reactionary delay starts at 18% and reaches a maximum of 66% and 2100 UTC. During that time, the airline delay decreases from 37% to 21%. The delay caused by en route and weather impacts has only a minor influence, indicated by a relatively stable, average share of 8% and 6%, respectively. The local turnaround delays, caused by airlines, airport operators, ground handlers, and other parties, accounted for 35% of all departure delays in 2016, where the average departure delay per flight reaches 11.2 min [10]. All this demands a sustainable improvement of the turnaround efficiency and predictability, supported by local initiatives such as A-CDM or APOC (Airport Operations Centre), a platform for stakeholder communication and coordination [14].
The turnaround consists of five major tasks: deboarding, catering, cleaning, fueling, and boarding—as well as the parallel processes of unloading and loading. From the operator perspective, all these aircraft handling processes will follow defined procedures and are mainly controlled by the ground handling, airport, or airline staff [15,16]. As an exception, the boarding process is driven by the passengers’ experience and willingness or ability to follow the proposed procedures (e.g., late arrivals, no-shows, amount of hand luggage, priority passengers). To provide a reliable time stamp for the TOBT, the critical path of the turnaround has to be under the control of the operational entities. The stochastic and passenger-controlled progress of aircraft boarding makes it difficult to reliably predict the turnaround time, even if boarding is already in process.
1.1. Status Quo
Comprehensive overviews are provided by Schmidt for aircraft turnaround [17], by Jaehn and Neumann for boarding [18], and by Nyquist and McFadden [19] and Mirza [20] for the corresponding economic impact. Relevant studies concerning aircraft boarding strategies include, but are not limited to, the following examples.
A common goal of simulation-based approaches is to minimize the time required for passengers to board the aircraft. Taking into account specific boarding patterns, a study by Van Landeghem and Beuselinck [21] investigates the efficiency of different boarding strategies. A similar approach is used by Ferrari and Nagel [22], focused particularly on disturbances to the boarding sequence caused by early or late arrivals of passengers. The results show faster boarding times for the commonly used back-to-front boarding in the case of passengers not boarding in their previously assigned boarding block. This fact indicates that a back-to-front policy is not an optimal solution to the boarding problem. Picking up on the idea of block boarding, a study based on an analytical model by van den Briel et al. [23] shows significantly improved boarding times for block policies compared to the back-to-front policy. In contrast, Bachmat and Elkin [24] show the benefits of the back-to-front policy as opposed to random boarding. Schultz et al. [25] demonstrates with a stochastic cellular automaton model that back-to-front boarding is most efficient if two boarding blocks are used, which is confirmed by Bachmat et al. [26] using a 1 + 1 polynuclear growth model with concave boundary conditions.
The interactions of passengers during the seating process are the focus of a study by Bazargan [27]. The mathematical model’s output aims to minimize interferences using a mixed integer linear program for optimization. A stochastic boarding approach is developed by Schultz et al. [25] to cover both individual passenger behavior and the aircraft/airline operational constraints of aircraft/airlines. Using a Markov Chain Monte Carlo optimization algorithm, Steffen [28] develops a boarding strategy assuming that the handling of hand luggage has a major impact on the boarding time and provides a model based on fundamental statistical mechanics [29]. Frette and Hemmer [30] identify a power law rule where the boarding time scales relate to the number of passengers to board, which allows for the prediction of the results of the back-to-front boarding strategy; Bernstein [31] extends this approach to large numbers of passengers.
Tang et al. [32] develop a boarding model considering passengers’ individual physique (maximum speed), quantity of hand luggage, and individually preferred distance. Based on a boarding strategy from Steffen [28], Milne and Kelly [33] develop a method that assigns passengers to seats so that their luggage is distributed evenly throughout the cabin, assuming a less time-consuming process for finding available storage in the overhead bins. Qiang et al. [34] propose a boarding strategy that allows passengers with a large amount of hand luggage to board first. Milne and Salari [35] assign passengers to seats according to the number of hand luggage items and propose that passengers with few pieces should be seated close to the entry. Zeineddine [36] emphasizes the importance of groups when traveling by aircraft and proposes a method whereby all group members should board together, assuming a minimum of individual interferences in the group.
Bachmat et al. [37] demonstrate with an analytical approach that boarding efficiency is linked to the aircraft interior design (seat pitch and passengers per row). Chung [38] and Schultz et al. [39] address the aircraft seating layout and indicate that alternative designs could significantly reduce the boarding time for both single- and twin-aisle configuration. Fuchte [40] addresses aircraft design and, in particular, the impact of aircraft cabin modifications with regard to the boarding efficiency. Schmidt et al. [41,42] evaluate novel aircraft layout configurations and seating concepts for single- and twin-aisle aircraft with 180–300 seats. The innovative approach to dynamically changing the cabin infrastructure through a Side-Slip Seat is evaluated by Schultz [43].
Steffen and Hotchkiss [44] experimentally tested airplane boarding methods in a mock Boeing 757 fuselage. Kierzkowski and Kisiel [45] provide an analysis covering the time needed to place items in the overhead bins depending on the availability of seats and occupancy of the aircraft. Gwynne et al. [46] perform a series of small-scale laboratory tests to help quantify individual passenger boarding and deplaning movement considering seat pitch, hand luggage items, and instructions for passengers. Schultz [47] provides a set of operational data including classification of boarding times, passenger arrival times, time to store hand luggage, and passenger interactions in the aircraft cabin as a fundamental basis for boarding model calibration. Miura and Nishinari [48] conducted an experiment to understand how passengers assessed boarding/deboarding times.
1.2. Objectives and Structure of the Document
The paper provides an overview about the current status of passenger boarding research, as an important process of the aircraft turnaround. After introducing a stochastic boarding model to consider individual passenger behavior during aircraft boarding [25,39], results from field measurements to validate the model [49] are presented in Section 2. Results from the boarding model application and the implementation of innovative infrastructural changes [43] are given in Section 3. In the context of aircraft boarding, new topics are discussed in Section 4: evaluation of complex passenger interactions (for boarding time prediction) and the capabilities of a future connected cabin [50]. Finally, the paper closes with a summary and future outlook.
2. Stochastic Boarding Model
The most scientific approaches do not reflect the operational aircraft/airline conditions (e.g., seat load factor, conformance to the boarding procedure) or the non-deterministic nature of the underlying processes (e.g., the amount and distribution of hand luggage). Furthermore, there is a clear lack of reliable data on aircraft operations and passenger handling. Assumptions regarding the inner processes are often derived from simplified research environments or gathered in less realistic test setups. To bridge this gap, data from the field are manually recorded during the day of operations to calibrate the sub-processes of a stochastic aircraft boarding model [25,39].
2.1. Model
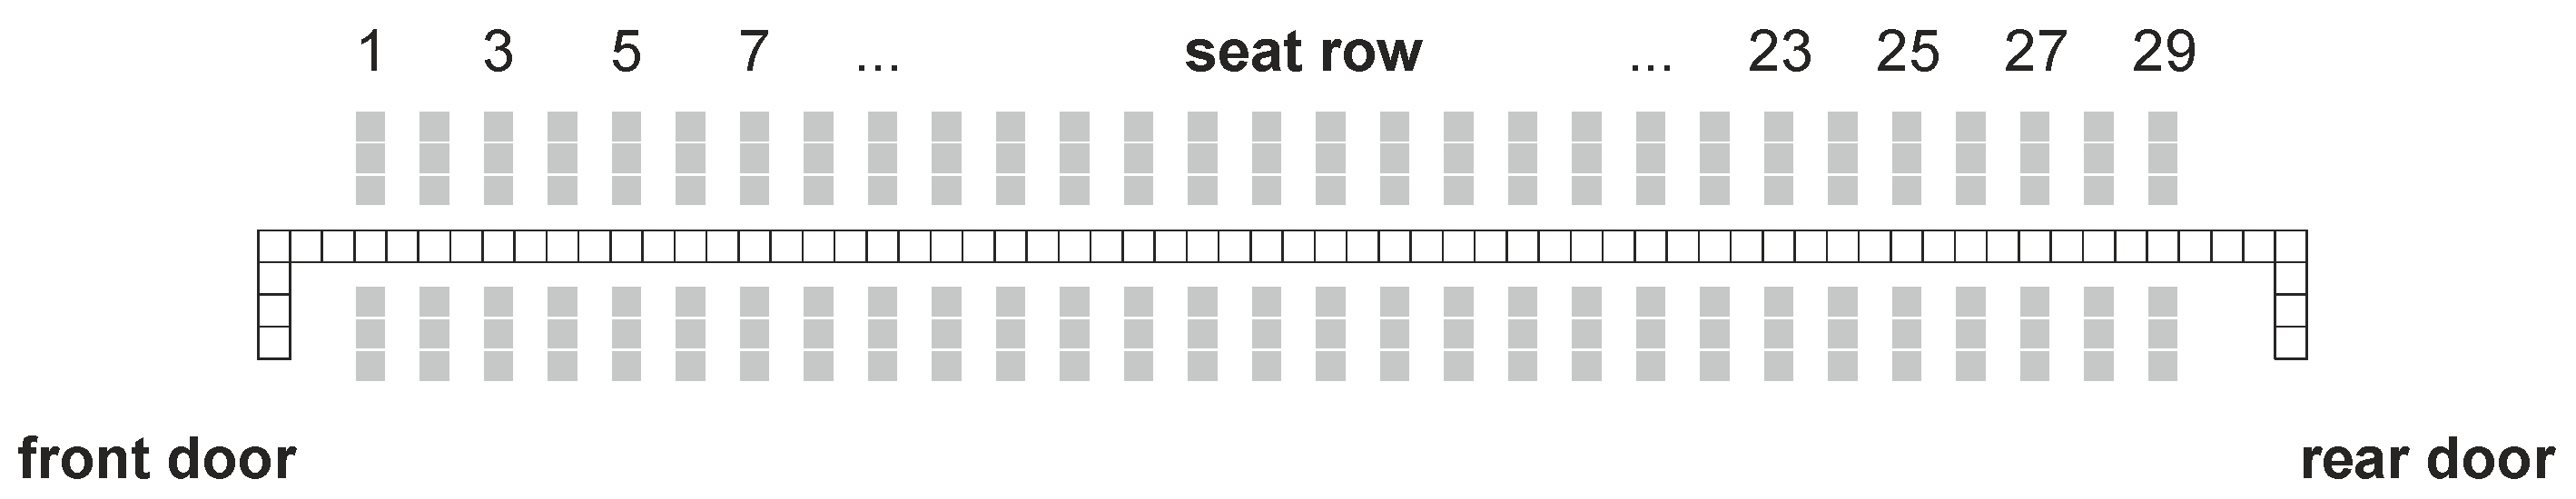
The proposed dynamic model for the boarding simulation is based on an asymmetric simple exclusion process (ASEP, cf. [51]). The ASEP was successfully adapted to model the dynamic passenger behavior in the airport terminal environment [25,52]. In this context, passenger boarding is assumed to be a stochastic, forward-directed, one-dimensional, and discrete (time and space) process. To provide both an appropriate set of input data and an efficient simulation environment, the aircraft seat layout is transferred into a regular grid with aircraft entries, aisle(s) and passenger seats as shown in Figure 3 (reference: Airbus 320, 29 rows, 174 seats). This regular grid consists of equal cells with a size of 0.4 × 0.4 m, whereas a cell can either be empty or contain exactly one passenger.
The boarding process consists of a simple set of rules for passenger movement: (a) enter the aircraft by the assigned door (based on the current boarding scenario); (b) move forward from cell to cell along the aisle until reaching the assigned seat row; and (c) store the baggage (the aisle is temporarily blocked to other passengers) and take the seat. The movement process only depends on the state of the next cell (empty or occupied). The storage of the baggage is a stochastic process and depends on the individual amount of hand luggage. The seating process is stochastically modeled as well, whereas the time to take the seat depends on the already used seats in the corresponding row.
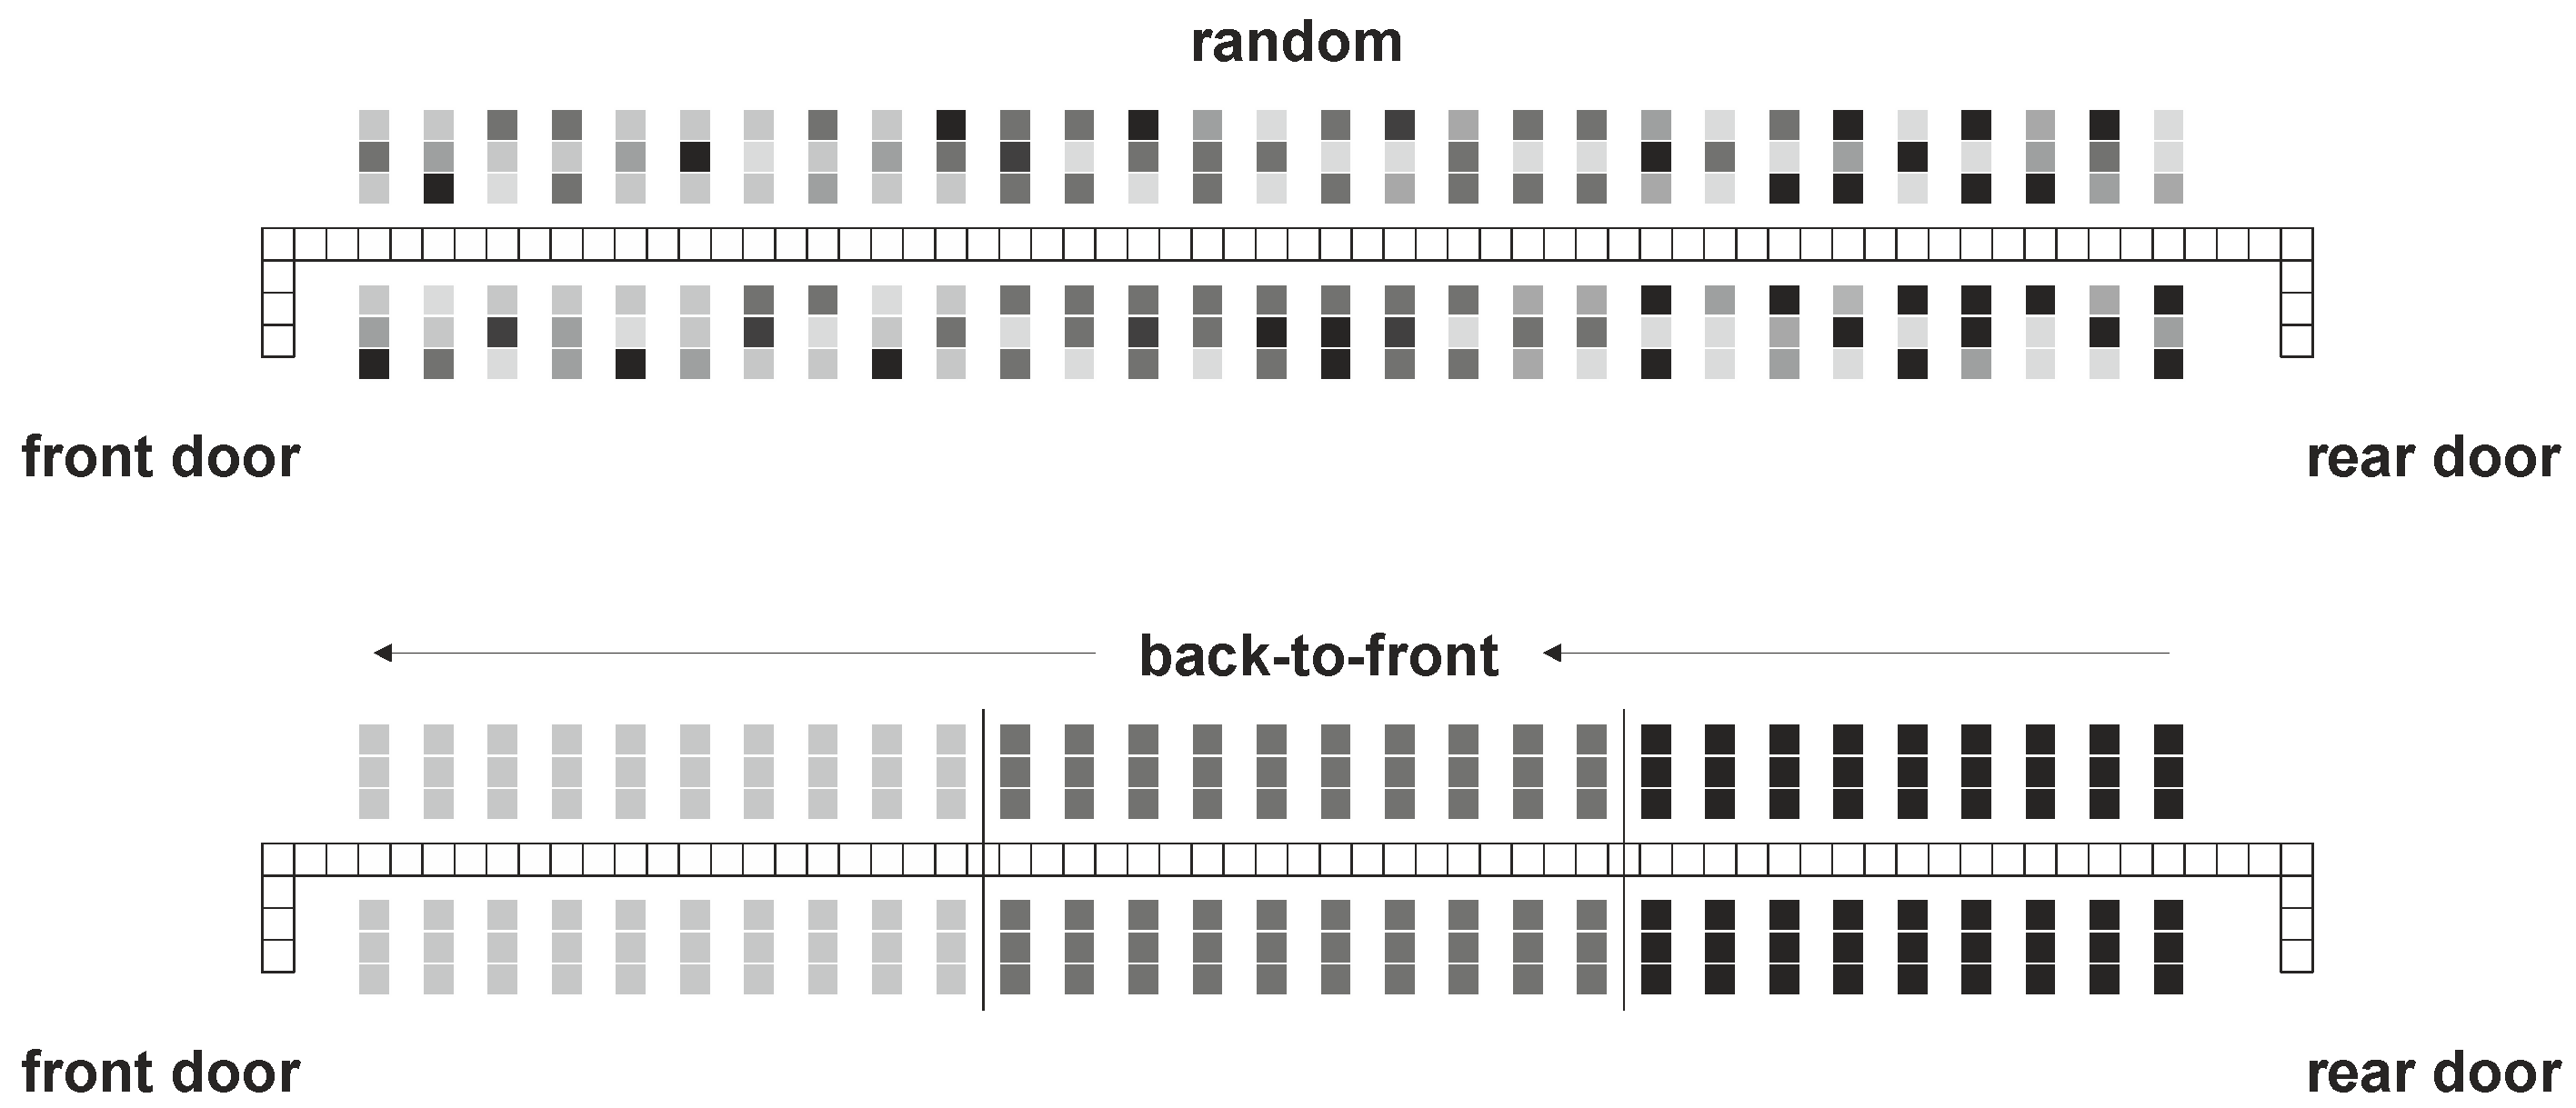
The stochastic nature of the boarding process requires a minimum of simulation runs for each selected scenario in order to derive reliable simulation results. In this context, a simulation scenario is mainly defined by the underlying seat layout, the number of passengers to board (seat load factor, default: 85%), the arrival frequency of the passengers at the aircraft (default: 14 passengers per min), the number of available doors (default 1 door), the specific boarding strategy (default: random), and the conformance of passengers to the current strategy (default: 85%). Further details regarding the model and the simulation environment are provided in [25,39]. To model different boarding strategies, the grid-based approach enables the individual assessment of seats as well as classification/aggregation according to the intended boarding strategy. In Figure 4, the seats are color-coded (grey-scale) and boarding takes place in the order of the grey-scale value (darkest color first). In this context, random boarding means that all passengers possess a pre-assigned seat, but the chronological order of passengers is not specified. To implement the commonly used back-to-front boarding, seats are aggregated to blocks (assignment per row). In fact, back-to-front boarding is often preferred by airlines but is only favorable for a block configuration with fewer than three blocks [25,26].
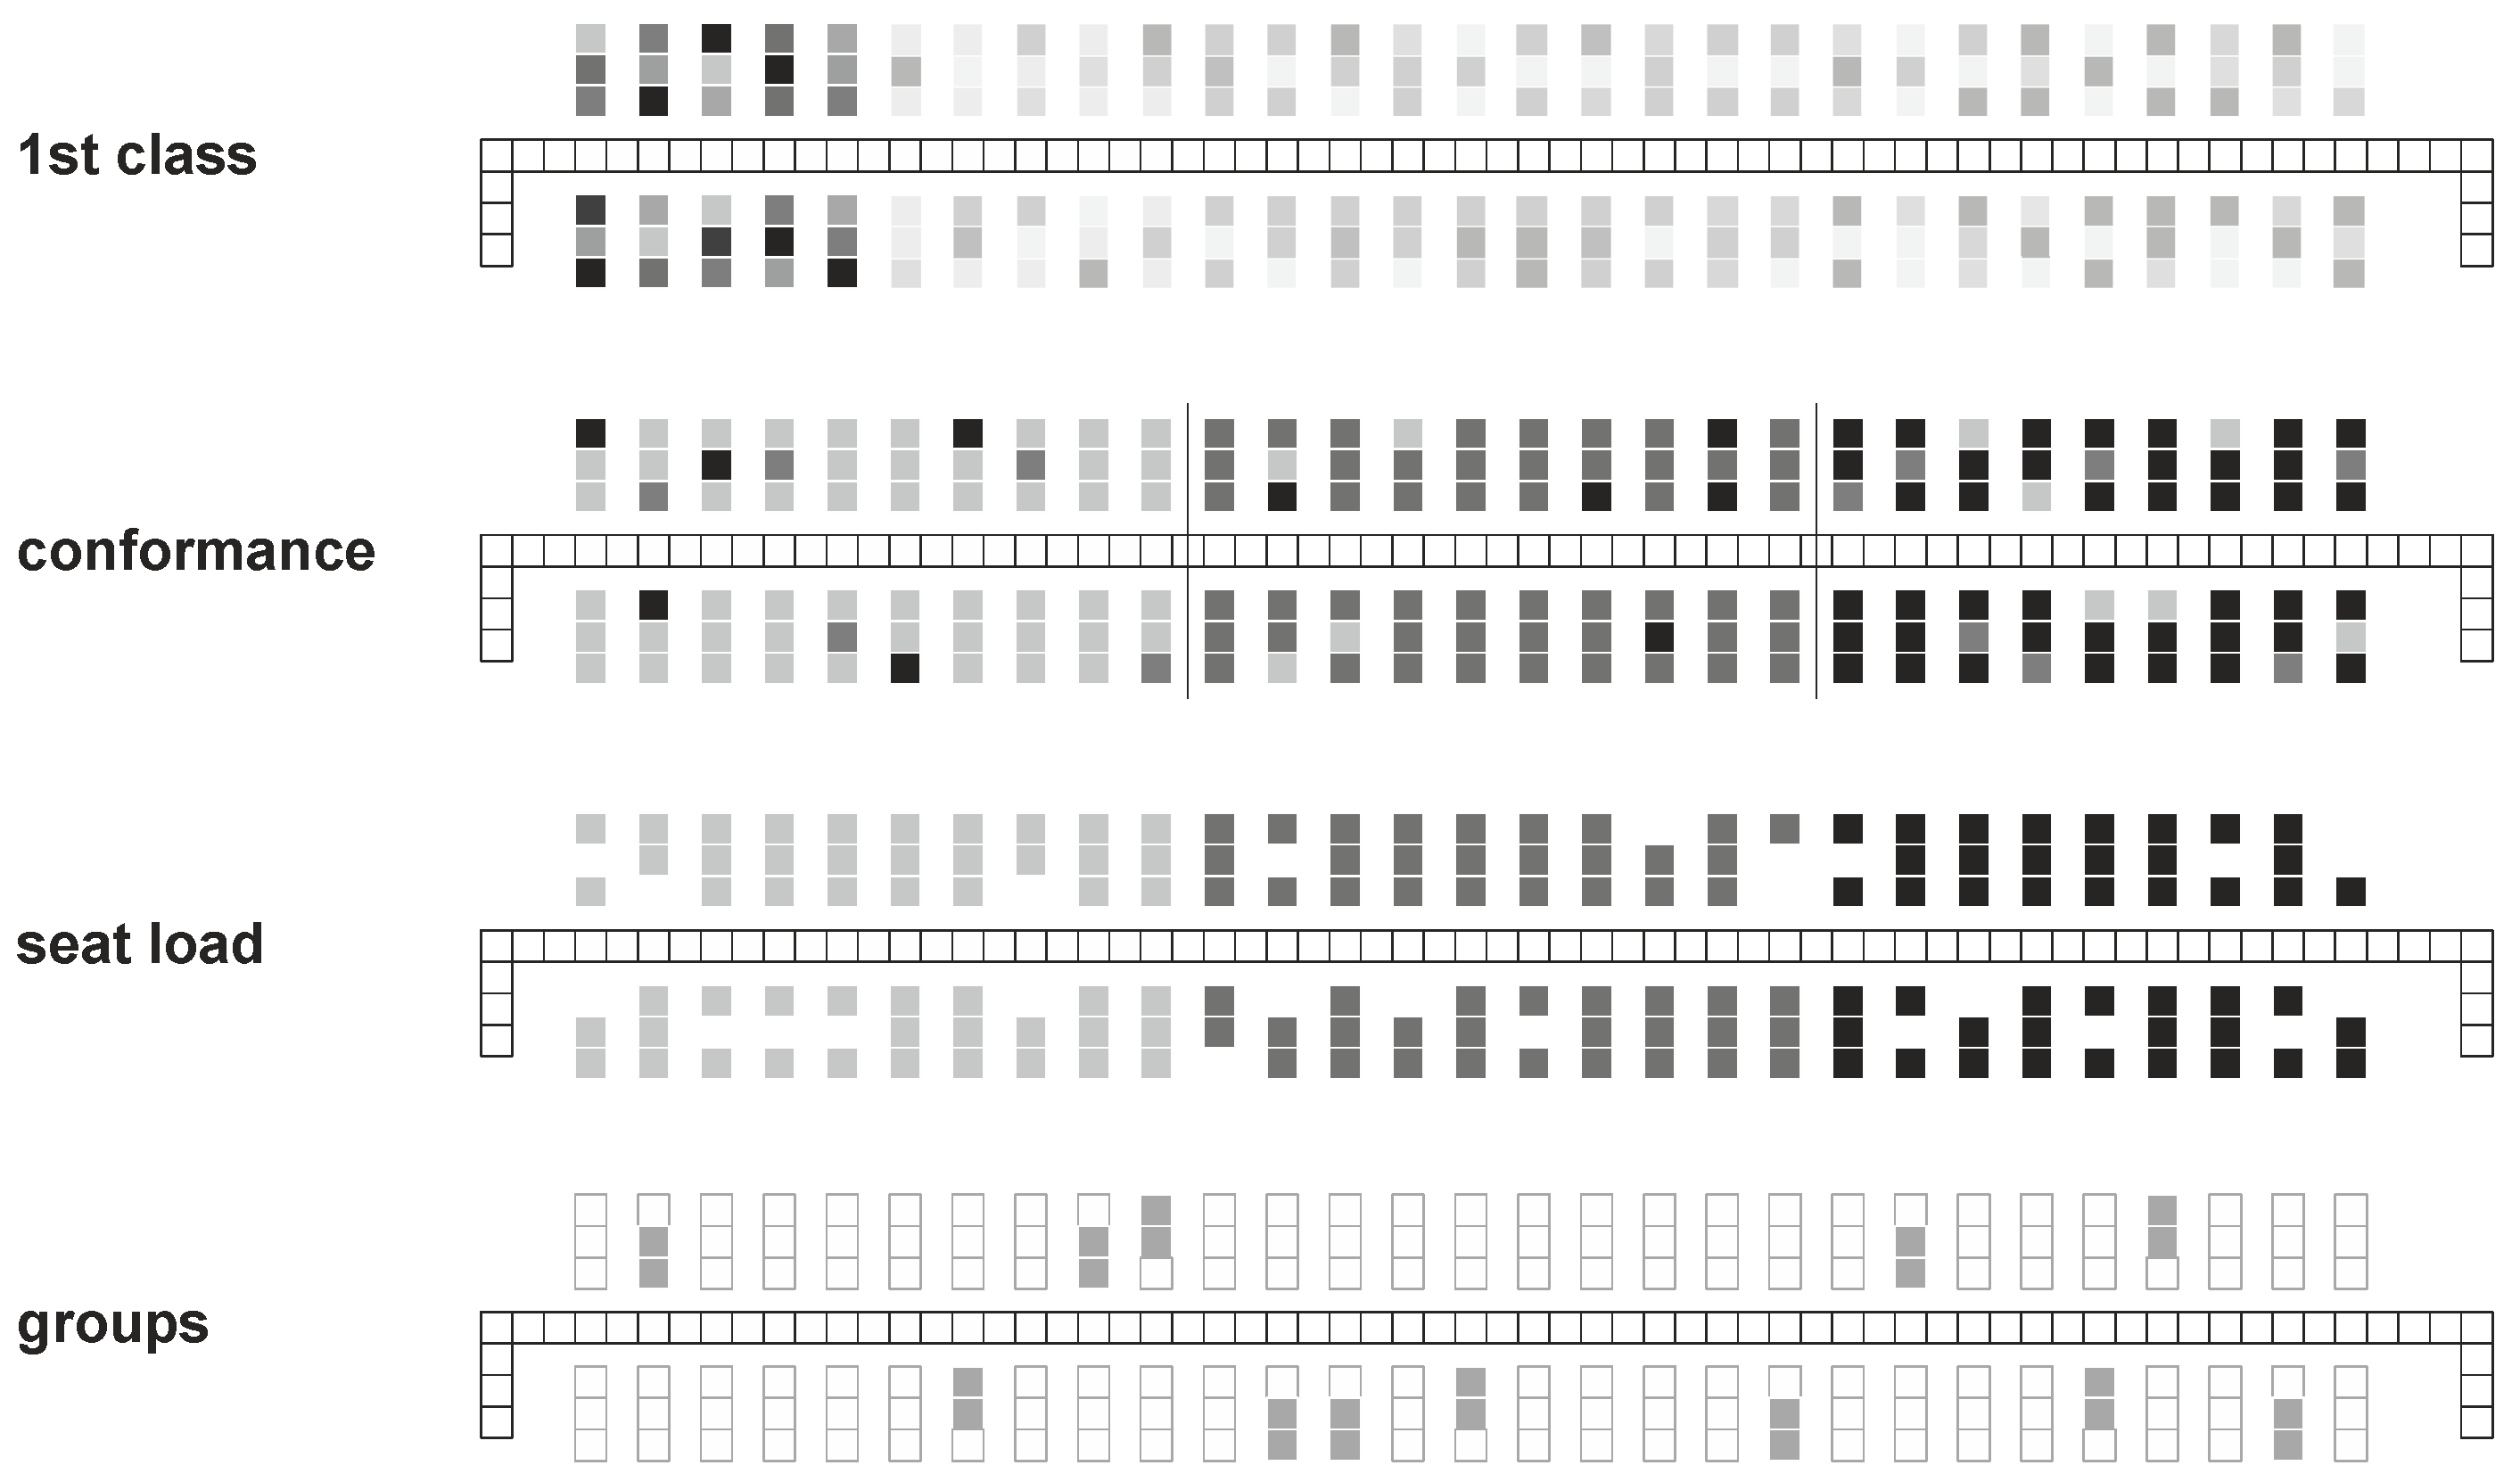
Furthermore, the operational constraints are implemented in the stochastic boarding model (see Figure 5). In particular, these constraints consist of priority boarding (e.g., first/business class), conformance of passengers to the boarding strategy (e.g., late arrivals), seat load factor (ratio of booked to available seats), and group patterns (e.g., families).
In the simulation environment, the boarding process is implemented as follows. Depending on the seat load, a specific number of randomly chosen seats are used for boarding. For each seat, a passenger (agent) is created. The agent contains individual parameters, such as number of hand luggage items, maximum walking speed in the aisle (set for all agents to 0.8 m/s), seat coordinates, time to store the hand luggage, and arrival time at the aircraft door. Further on, several process characteristics could be recorded during the simulation runs (e.g., waiting time, number of interactions). To create the time needed to store the hand luggage, a triangular distribution provides a stochastic time value depending on the number of items [25,39]. The agents are sorted with regard to their seats and the current boarding strategy. From this sequence, a given percentage of agents (conformance rate) are taken out of the sequence and inserted into a position, which contradicts the current strategy (e.g., inserted into a different boarding block). According to the arrival time distribution (e.g., linear or exponential) and the boarding sequence, each agent gets a timestamp to appear on the aircraft door queue. When the simulation starts, the first agent in the queue always enters the aircraft by moving from the queue to the entry cell of the aisle grid (aircraft door), if this cell is free. In each simulation step, all agents located in the row are moved to the next cell, if possible (free cell and not arrived at the seat row), using a shuffled sequential update procedure (emulate parallel update behavior [51,53]). If the agent arrives at the assigned seat row, s/he waits in the cell according to the time needed to store the hand luggage. Depending on the seat row condition (e.g., blocked aisle or middle seat or both), additional time is stochastically generated to wait in the aisle to perform the seat shuffle. During the whole waiting process, no other agent can pass. When the waiting process finally finishes, the agent is set to the seat and the aisle cell is set free.
The developed boarding model does not address unruly passenger or system behavior or counterflow passenger movements, which may arise from individual problems in finding the assigned seat or blocked overhead compartments. In particular, the problem of blocked overhead compartments could not be solved by operational strategies, but with increased compartment capacity or a more restrictive airline policy regarding the amount of hand luggage allowed. If the airline does not react to high numbers of hand luggage items, an adopted boarding approach could result in evenly distributed hand luggage throughout the aircraft cabin [33].
2.2. Field Measurement and Calibration
This section provides an overview of the results of the field measurements and boarding trials (further details are available in [47,49]). In Figure 6, the measurements of manually measured 282 boarding events for single-aisle aircraft (Airbus 320, Boeing 737) are shown, with a minimum of 29 passengers and a maximum of 190 passengers. Assuming a linear boarding process, the boarding time increases for each passenger by 4.5 s, with an additional offset of 2.3 min on average (solid regression line in Figure 6).
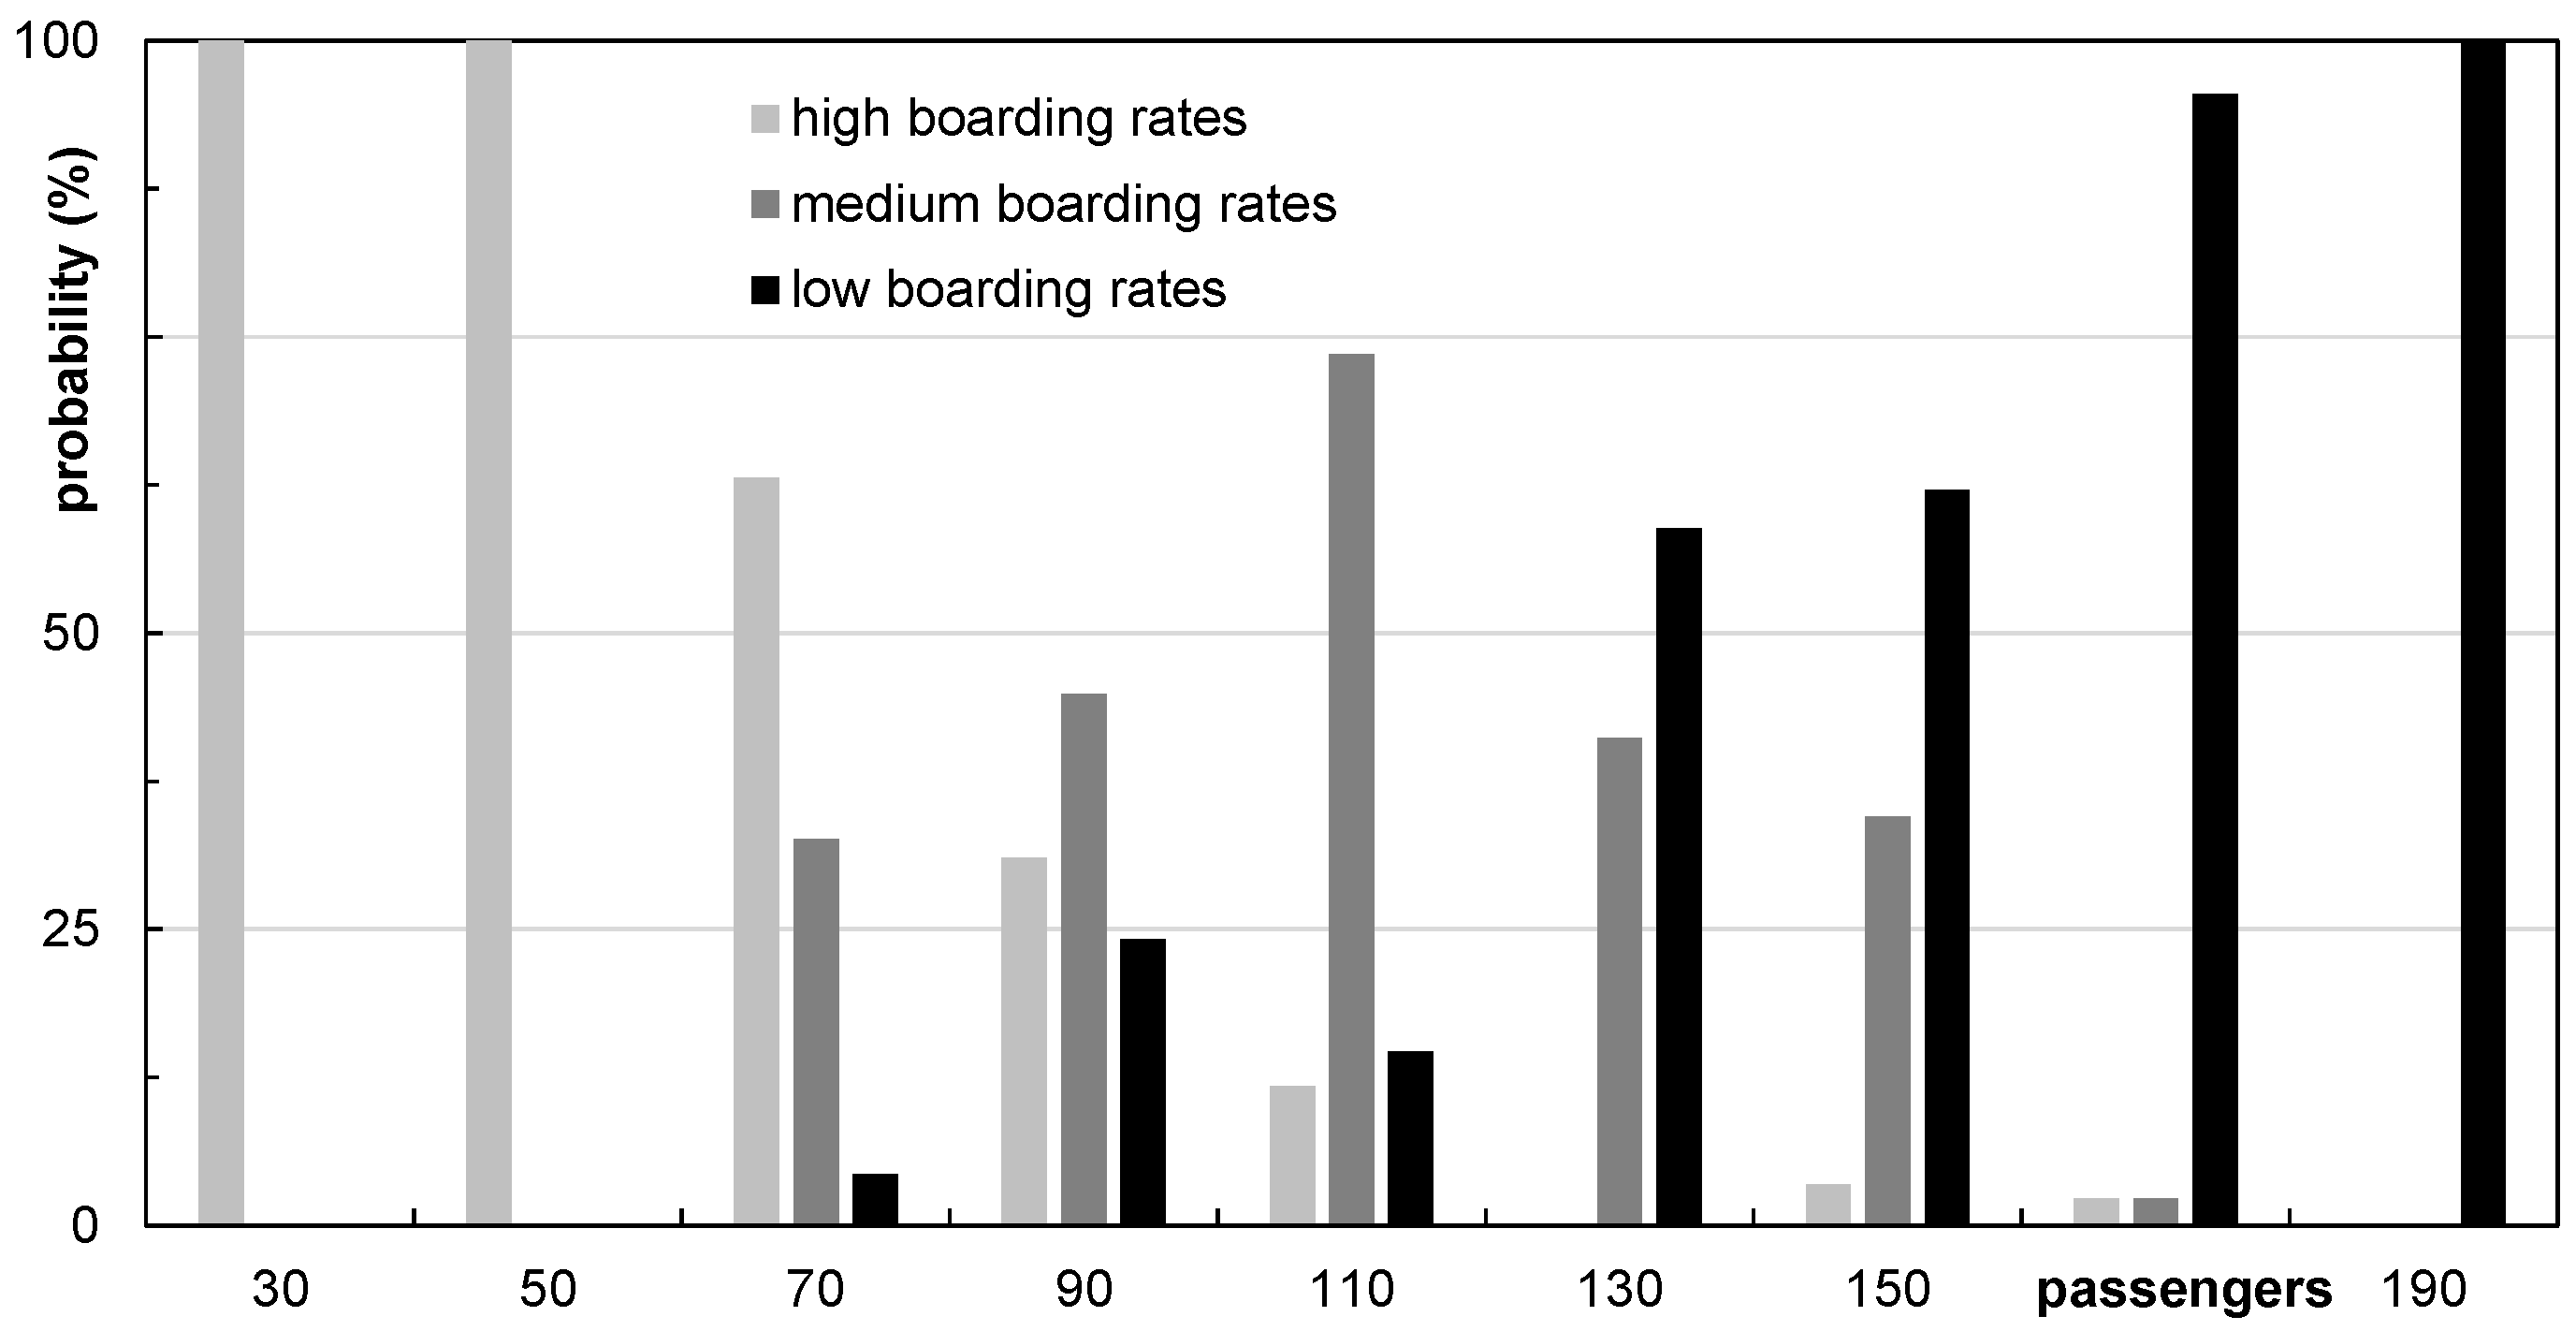
Using a data classification method based on a Q–Q plot, the set of boarding times is separated into three classes with regards to boarding rate (average number of passengers boarded per min): high, medium, and low. The characteristics regarding the amount of passengers according to the classification are shown in Figure 7.Here, the boarding rate possesses a probability of 12% to be high, 73% to be medium, and 15% to be low if 110 passengers are boarded.
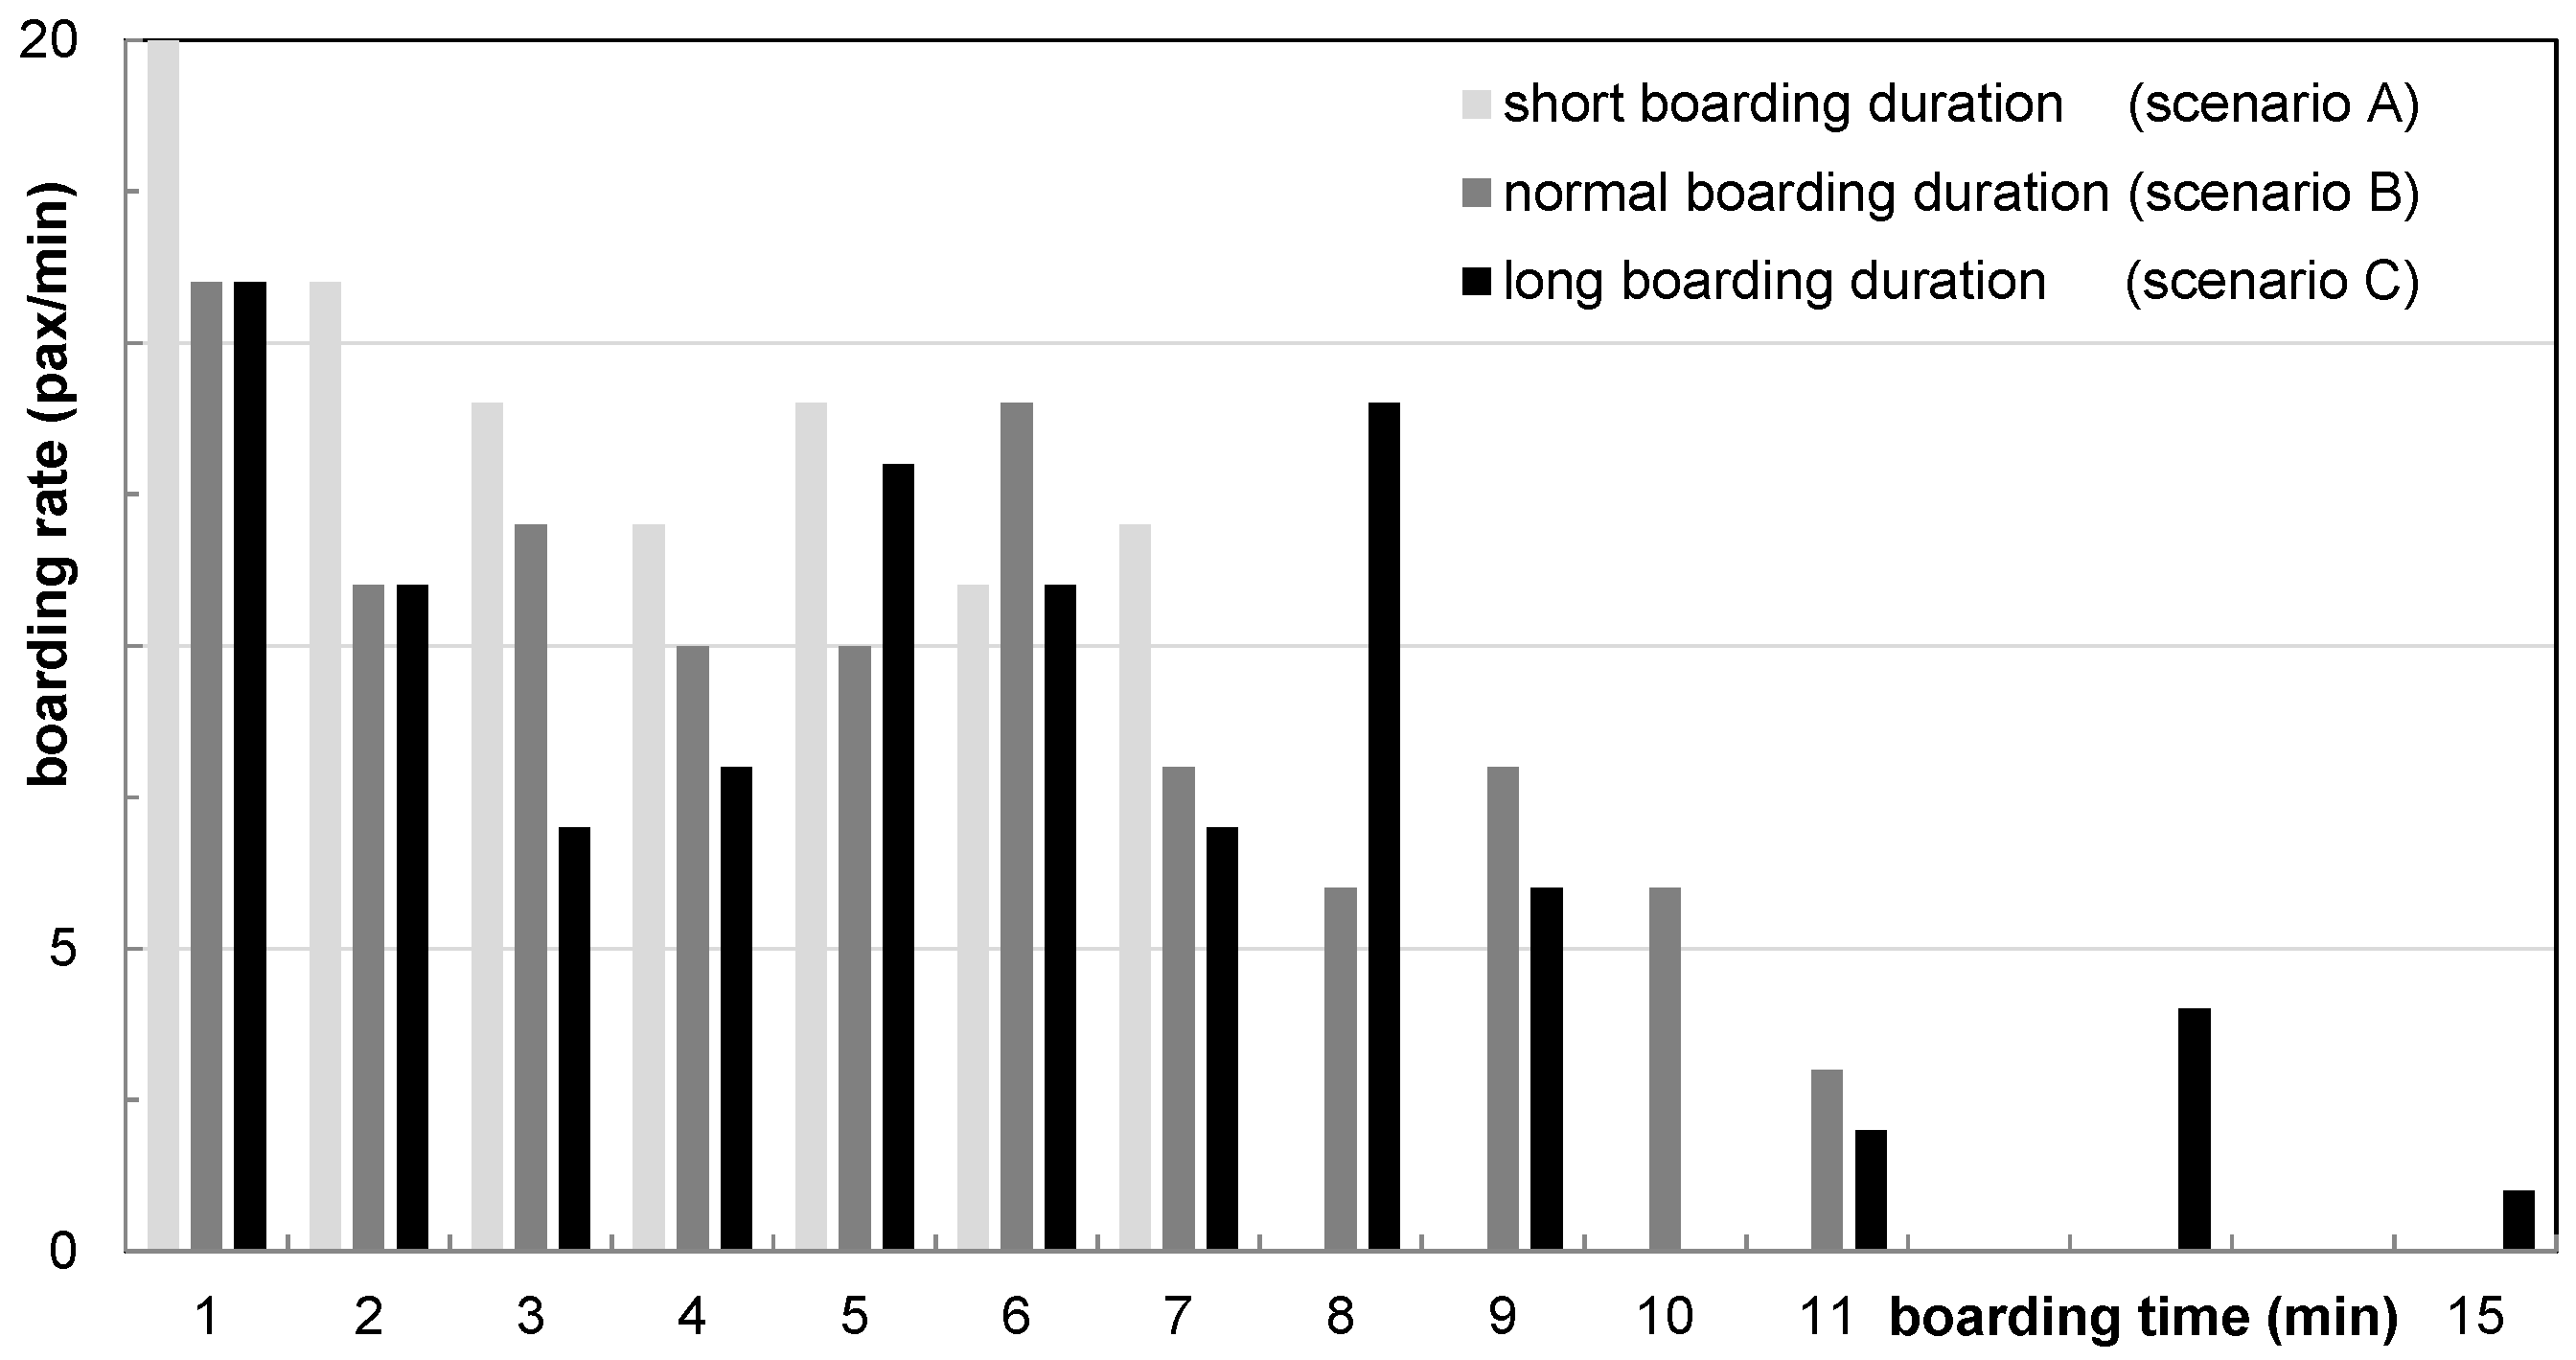
To emphasize the operational progress of different boarding events, three boarding scenarios are selected from the recorded data. These scenarios reflect one specific flight on different days (nearly the same number of passengers: 99, 100, and 104) but significantly varying boarding rates and times. In Figure 8, the scenarios show a short (A), normal (B), and long (C) boarding duration. Due to the different passengers’ arrival times, boarding is completed after 7 min in scenario A (average arrival rate of 14.1 passenger/min), after 11 min in scenario B (average arrival rate of 9.4 passenger/min), and after 15 min in scenario C (average arrival rate of 6.7 passenger/min).
Obviously, late passengers could also significantly extend the boarding process (scenario C). However, a (constant) lower arrival rate of passengers at the aircraft adversely affects the boarding process. The arrival rate of passengers at the aircraft is mainly triggered by the presence of passengers at the boarding gate and the service rate at the boarding pass checkpoint. As a consequence, an airline should balance the effort/benefit ratio between introducing new boarding procedures and faster dispatch/higher availability of passengers at the boarding gate.
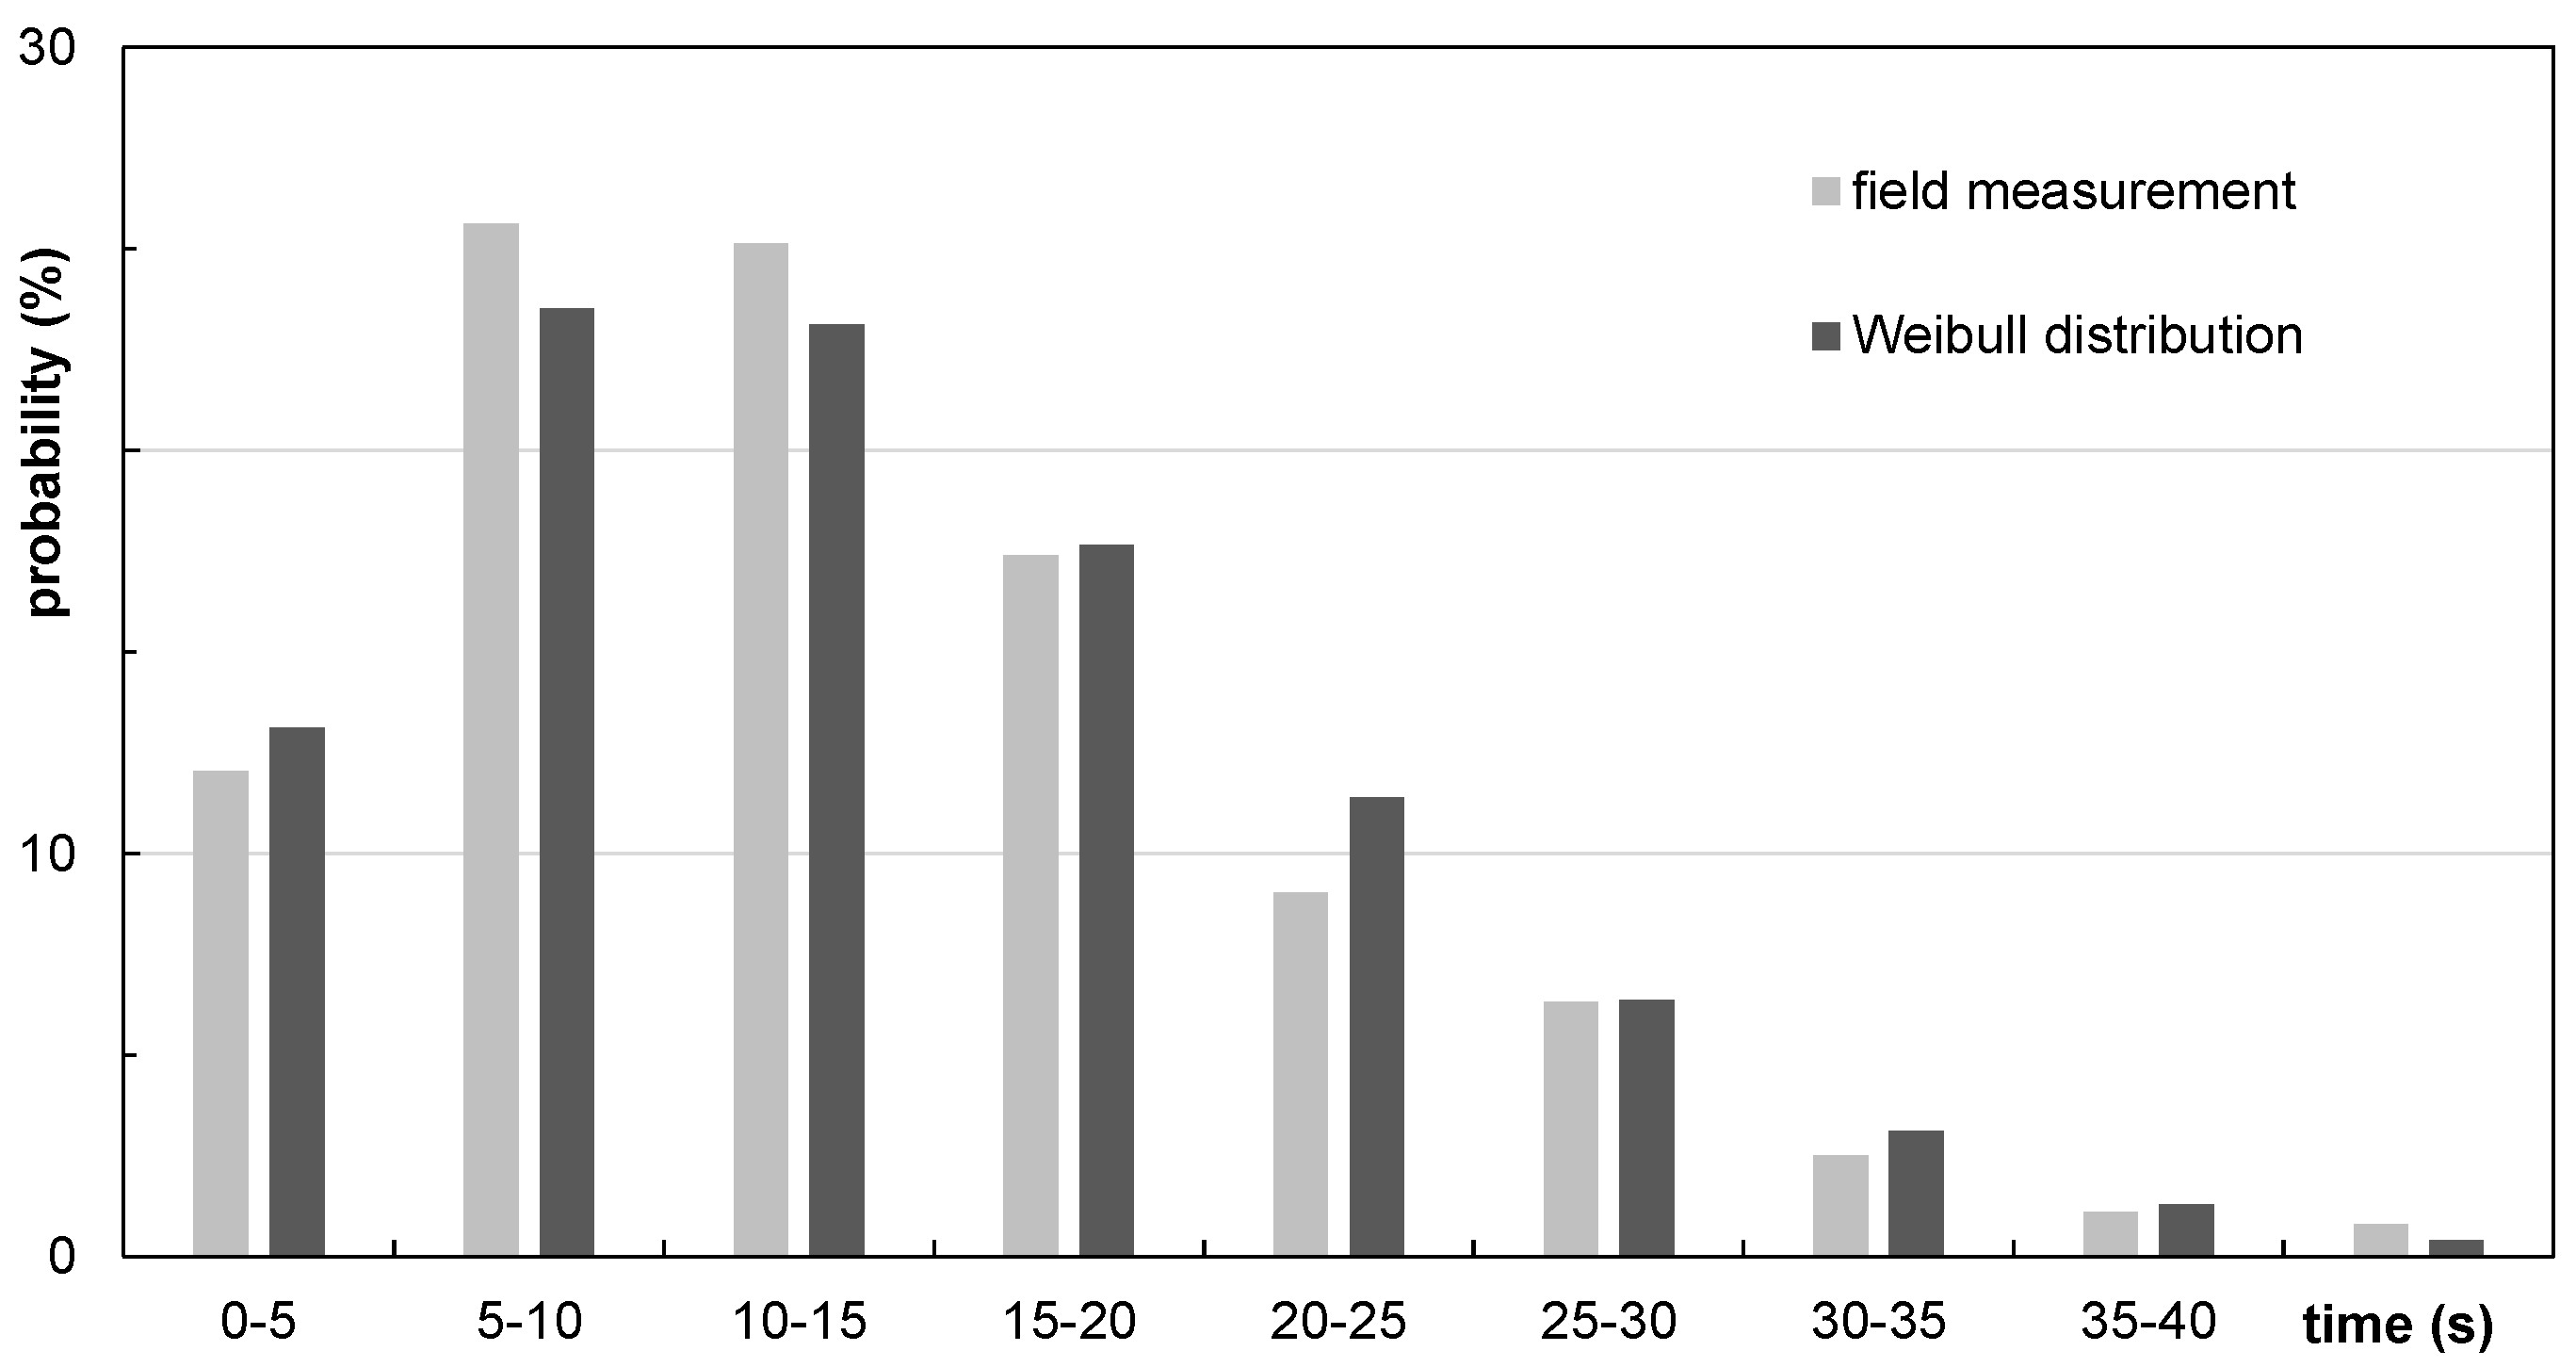
To calibrate the modeled passenger processes during boarding, the following input parameter were measured in the field: distribution of time needed to store hand luggage (see Figure 9), distribution of time for seat shuffling (interactions during seating), distribution of passenger arrival rates at aircraft door, and distribution of walking speed in the aisle of the aircraft cabin. Finally, the calibrated stochastic aircraft boarding model shows deviations smaller than 5% between measured and simulated boarding times [47,49].
3. Application of Aircraft Boarding Model
The stochastic boarding model is implemented in a simulation environment, which allows for evaluating specific boarding scenarios with different procedures and technologies. The model was primarily developed to analyze the A320 reference layout in an efficient way, by means of calculation times and consideration of relevant operational constraints. Nevertheless, the model was extended to be used for twin-aisle configuration [39], implementation of infrastructural changes such as the Side-Slip Seat [54], development and optimization of appropriately adapted boarding strategies [43,55], and to derive a complexity metric to predict boarding progress [56]. An additional visualization module is developed to demonstrate the working principle of the analyzed boarding scenarios (see Figure 10). In this section, the results of two different applications of the boarding model are shown: a comparison of different boarding approaches and an innovative infrastructural change in the aircraft cabin to speed up the aircraft boarding [43].
3.1. Comparison of Different Boarding Approaches: Conformance, Hand Luggage, Groups
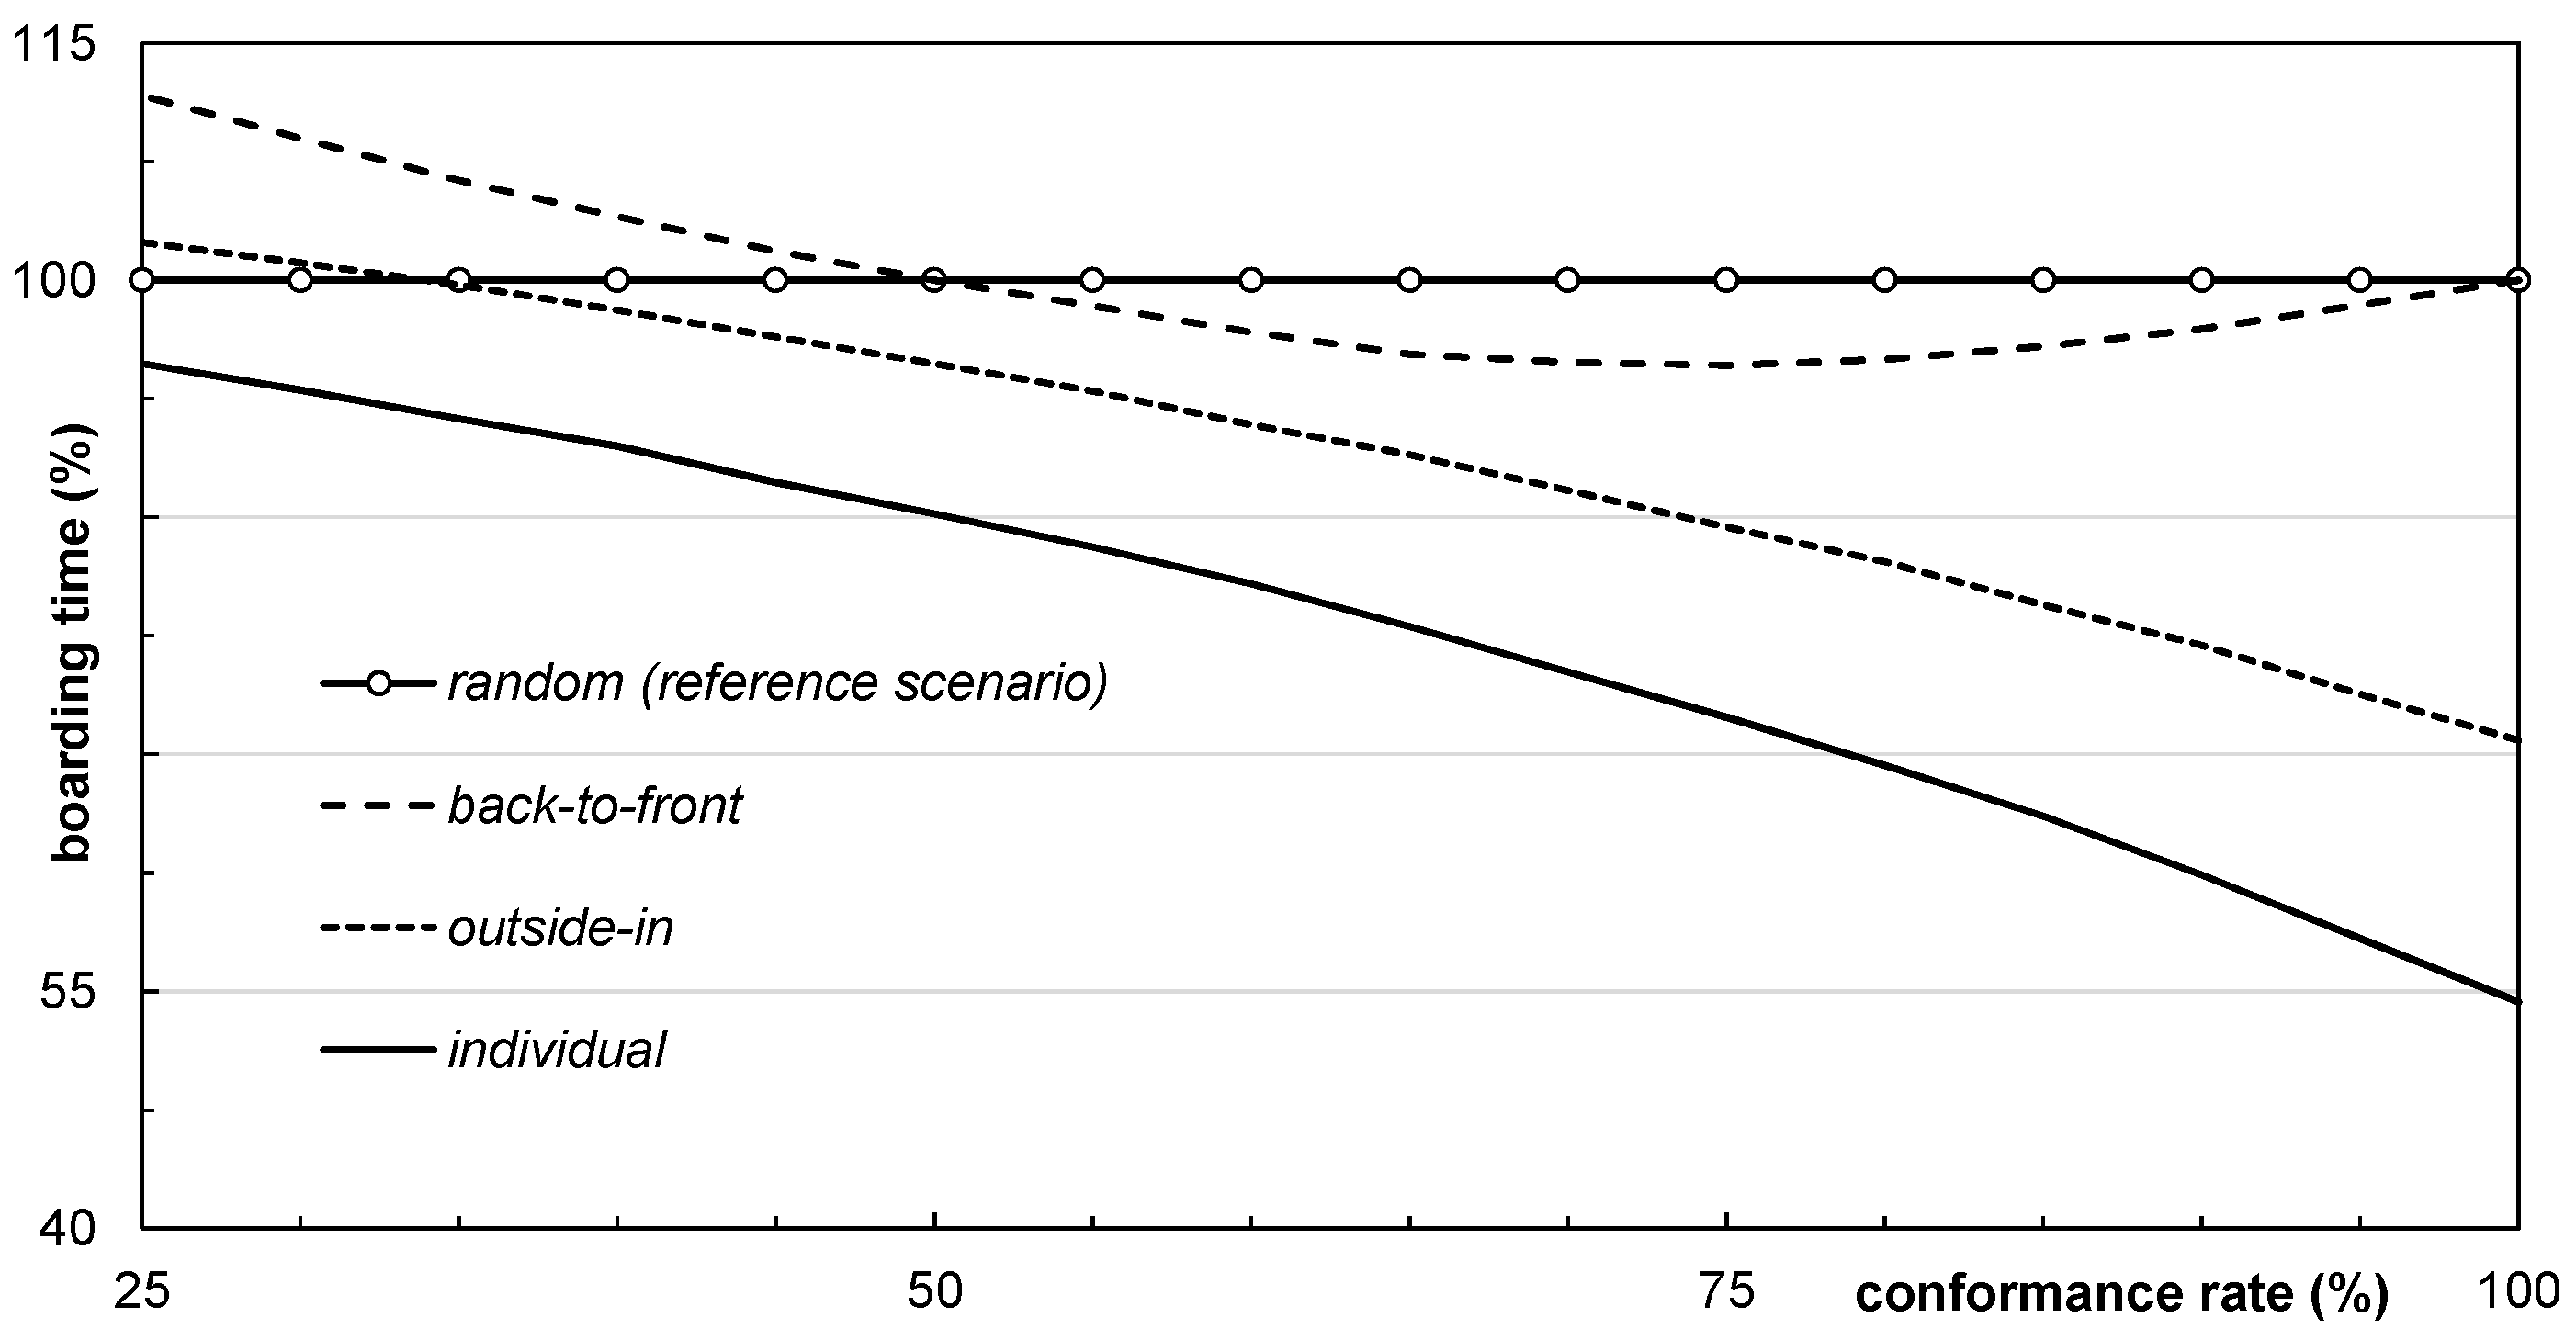
A familiar boarding procedure is the back-to-front strategy, which is operationally applied at some airlines. For this strategy, seat rows are aggregated to seat blocks and these blocks are called at the boarding gate. The efficiency of the back-to-front strategy depends on the size of the blocks [25]. Beside the approach of random and back-to-front boarding, two additional strategies are commonly used as reference implementations to emphasize the capabilities of procedural changes: outside-in boarding and individual, seat-wise boarding. In outside-in boarding, three seat blocks exist for window, middle, and aisle seats. Here, the window seats block is boarded first, followed by the middle and aisle blocks. Individual boarding consists of a seat-wise combination of back-to-front and outside-in boarding and is generally considered the fastest boarding sequence [28].
In the following evaluation, a sensitivity analysis is applied with regards to the model parameter of passenger conformance to boarding strategies. The boarding time of the random boarding strategy is used as a reference with a value of 100% (default seat load of 85%). The conformance rate describes the fact that a boarding strategy demands a specific chronological order of passengers (more precise: seats), but this order could only be realized up to a certain level: passengers may arrive late from prior flights (airside connection) or security control (landside connection), privileged passengers could board at any time, and families (groups) will not be separated. It is expected that these disturbances will reduce the effectiveness of boarding strategies. In Figure 11, the average boarding time is shown against an increasing conformance rate. Evidently, the random strategy could not be affected by changes in the conformance rate. The back-to-front strategy shows a decreasing boarding time at the beginning, but after a minimum boarding time (value of 95% at 75% conformance rate), the boarding increases again. The outside-in and individual boarding perform progressively better with increasing conformance.
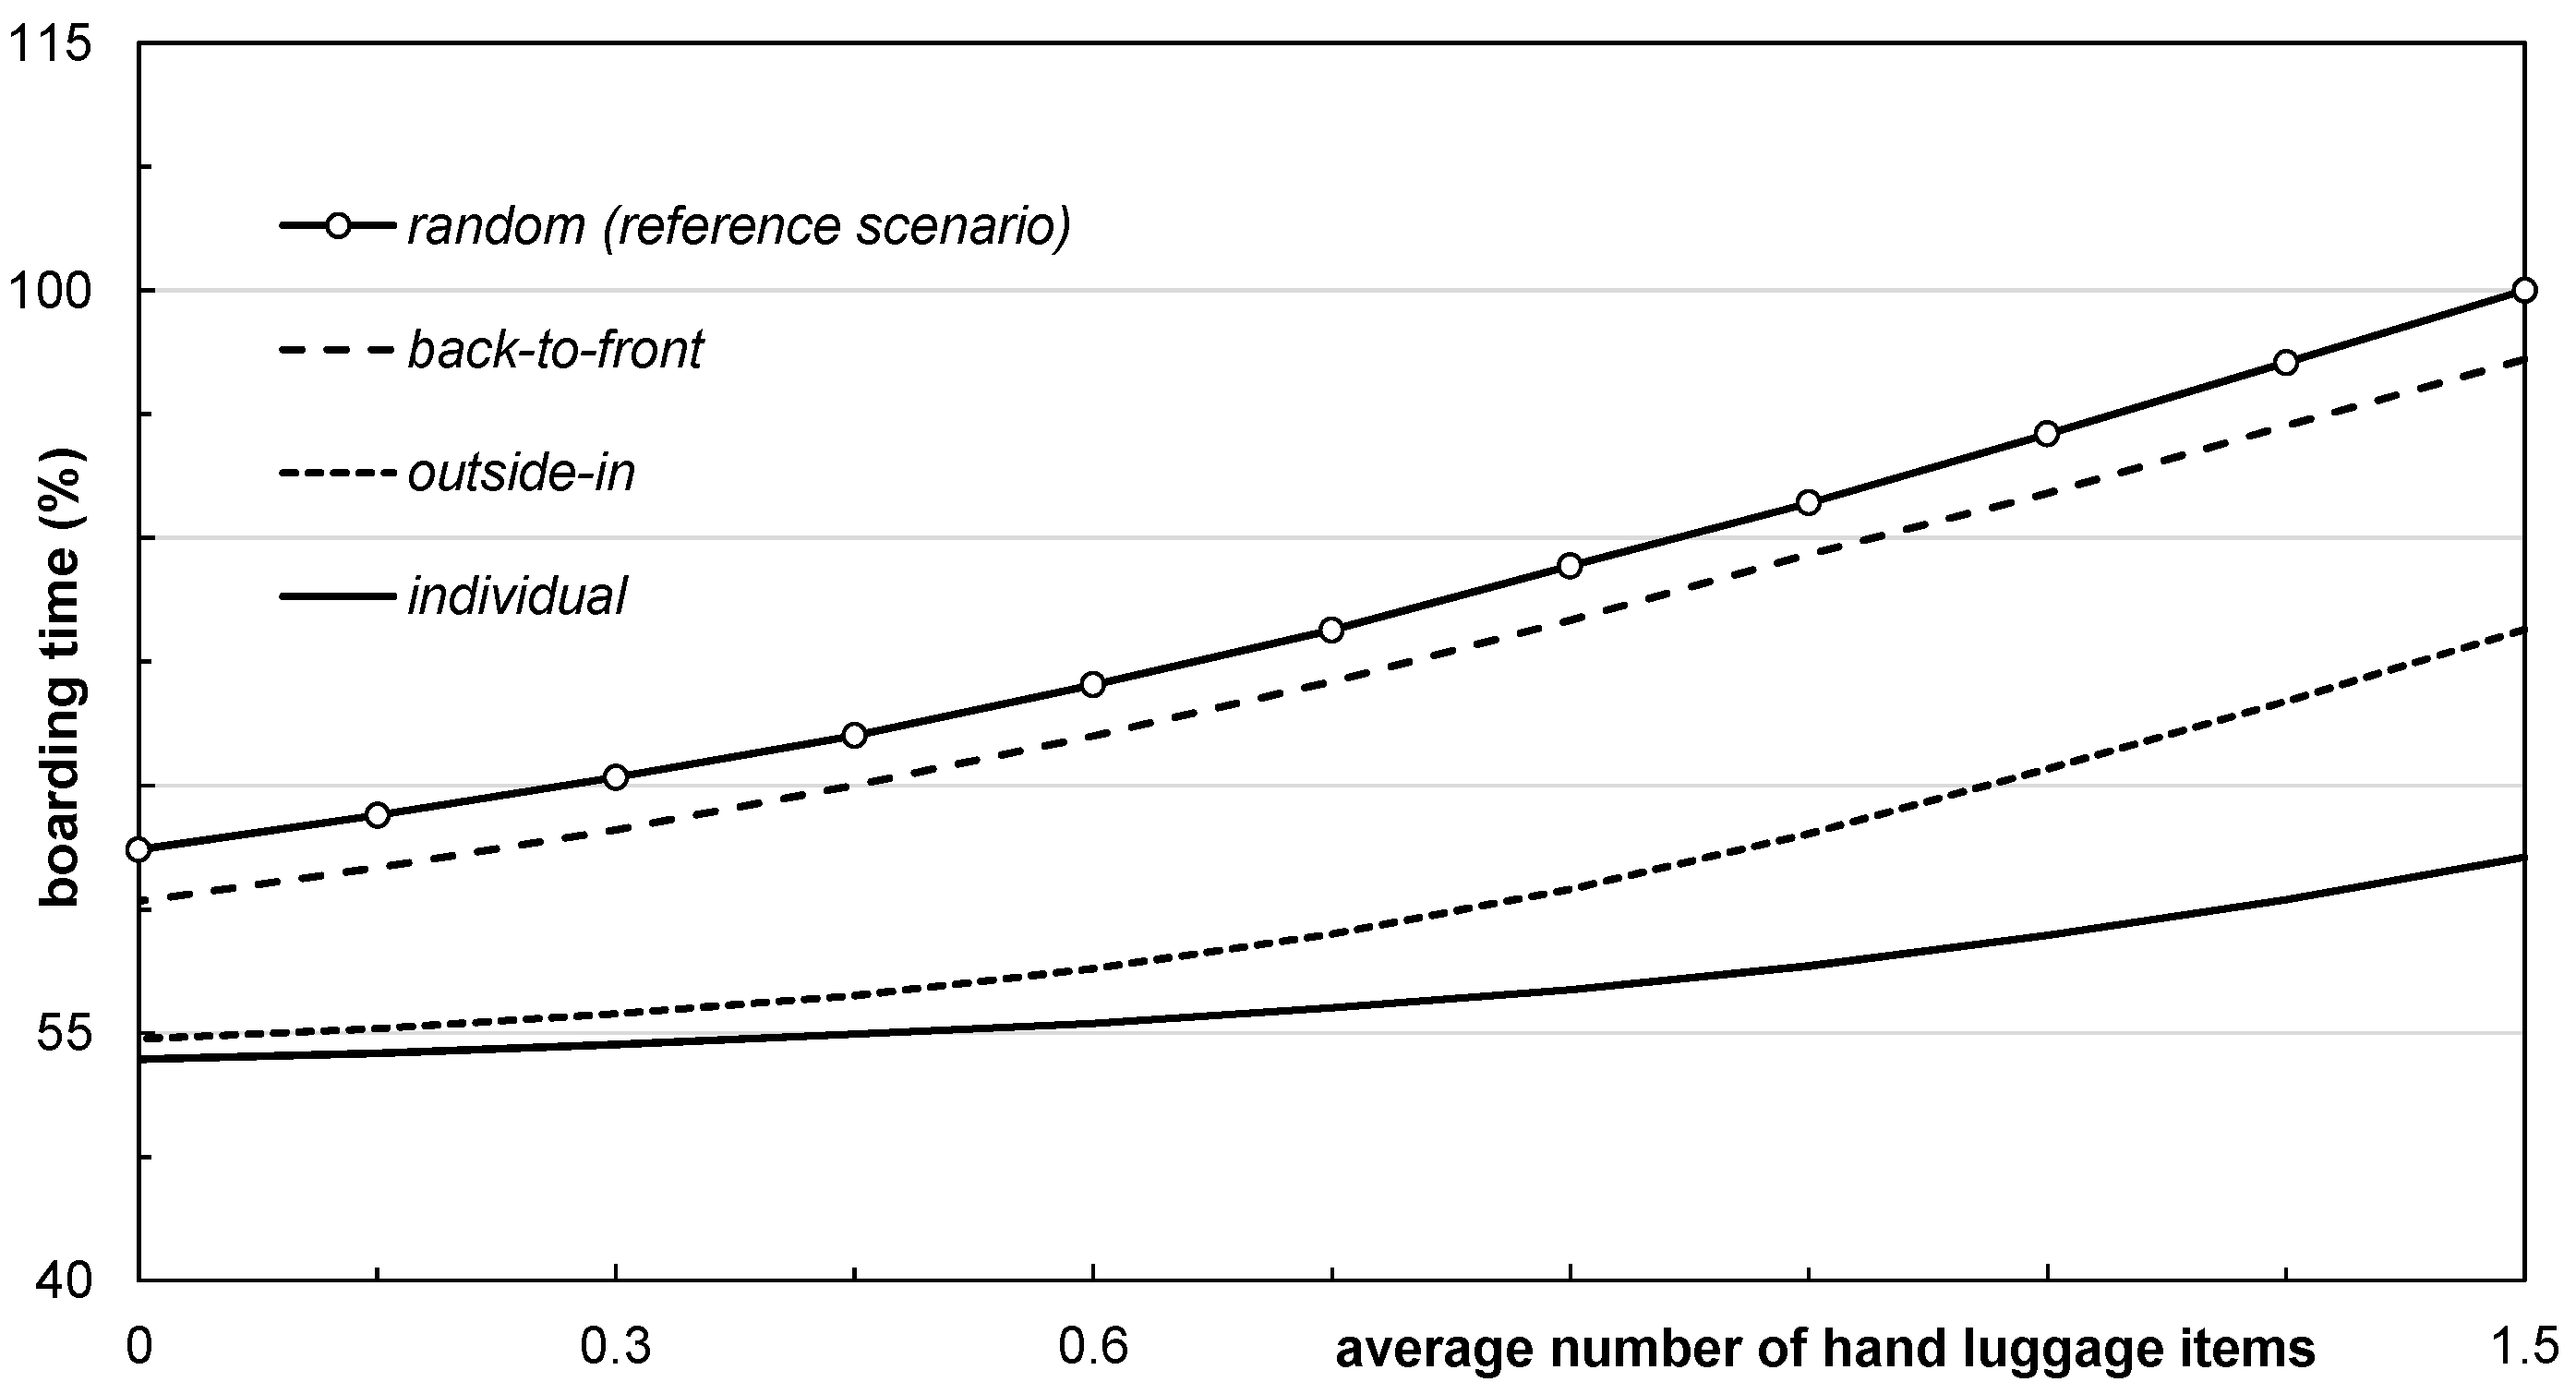
A large amount of hand luggage results in higher boarding times, caused by blocked overhead compartments and additional counterflow passenger movements in the aircraft aisle. Therefore, the potential boarding time savings accomplished by a stepwise reduction in the number of hand luggage items is also addressed. Figure 12 shows a reduction in boarding time if the number of hand luggage items is reduced from an average of 1.5 to zero items per passenger. The initial approach assumed at least one piece of baggage per passenger and probabilities for one piece, two pieces, and three pieces of 60%, 30%, and 10%, respectively [39], and is taken as the baseline to stepwise reduce the number of hand luggage items. As Figure 12 shows, all strategies result in faster boarding. In particular, the boarding time is reduced by 34%, 33%, 25%, and 12% for random, back-to-front, outside-in, and individual strategies assuming a “no hand luggage” rule.
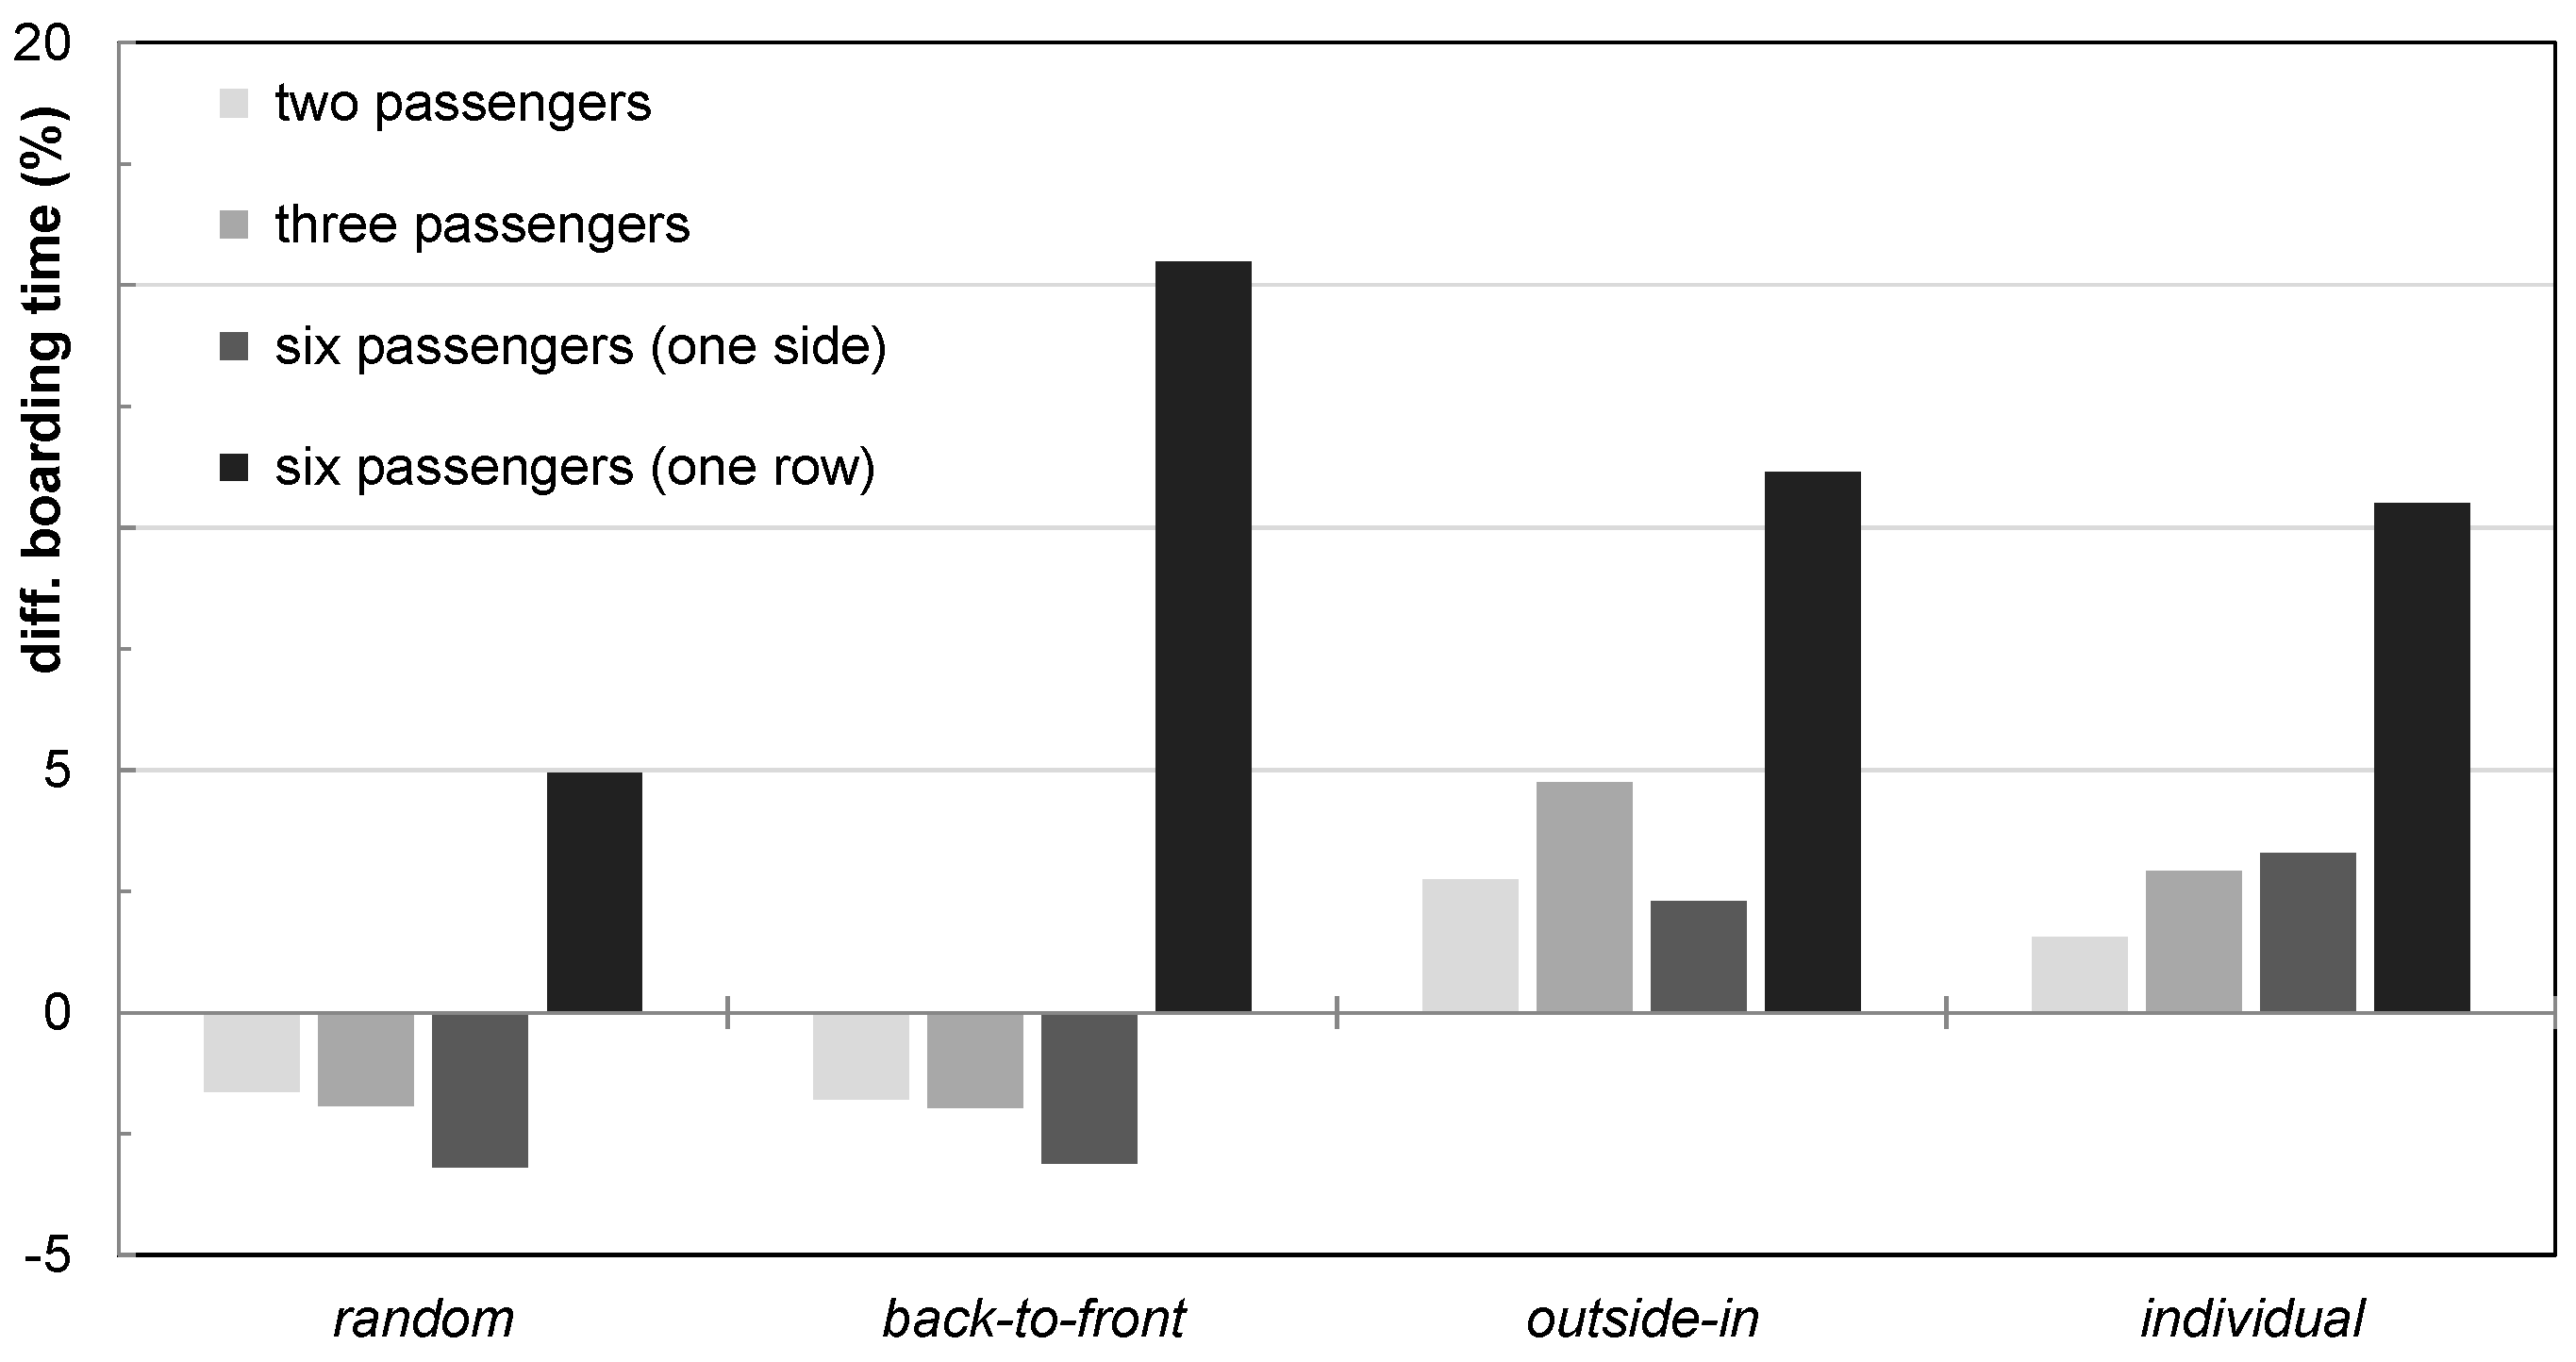
With a focus on specific group constellation, an average ratio of 30% is used to emphasize the impact of groups on boarding time. A ratio of 30% at a seat load of 85% means that approximately 44 passengers are part of a group, on average. The evaluation is based on four specific group constellations: two passengers, three passengers, six passengers in one row, and six passengers sitting on one side of the aisle in sequential rows. The results of the exemplary group constellation are shown in Figure 13.
3.2. Side-Slip Seat
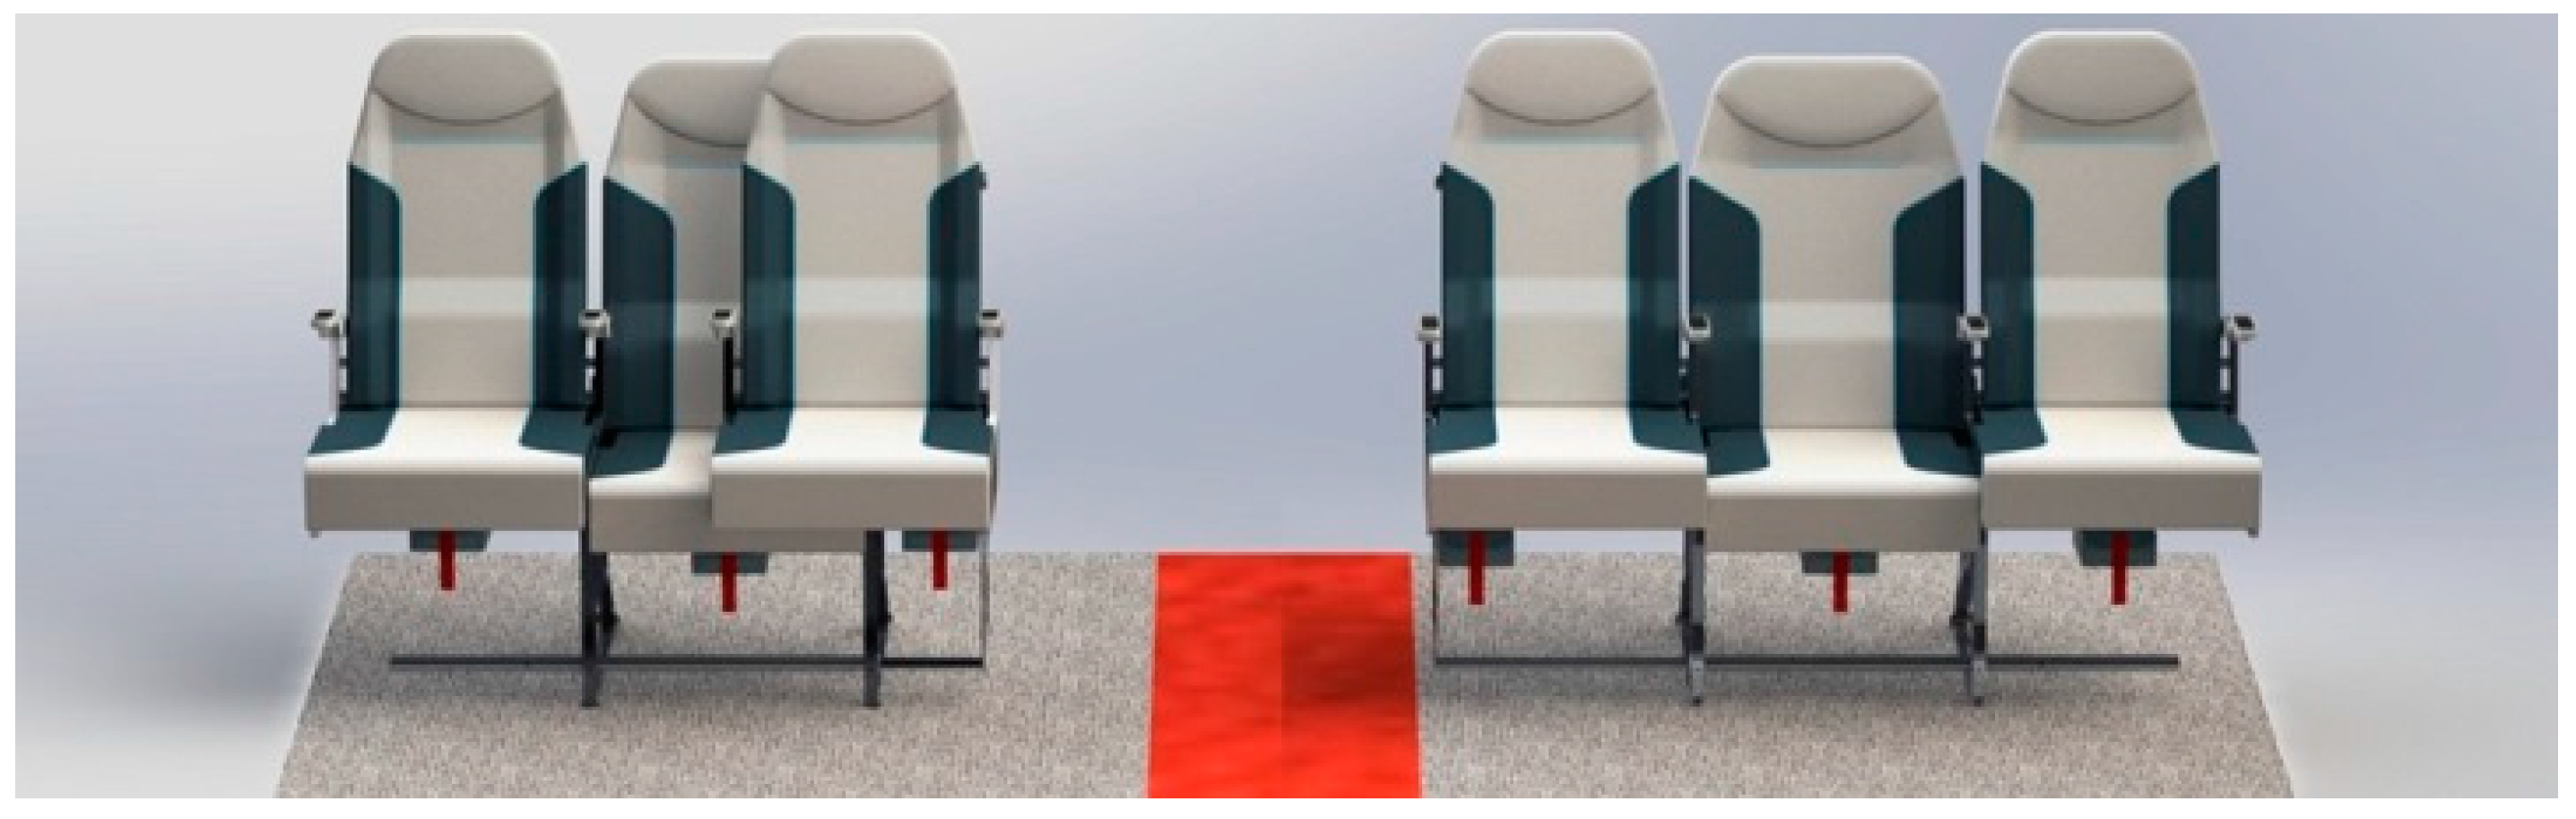
Standard approaches to accelerating the boarding process mainly address the management of passenger behavior by providing airline-specific boarding sequences (e.g., boarding by zones, e.g., Air Canada) or reducing the amount of hand luggage (only one piece per passenger). Only the use of the rear door of the aircraft to board passengers could be understood as a significant change in the infrastructure. The most prominent negative effect on the boarding time is a blocked aisle due to passengers storing their hand luggage or entering their seat row. With the innovative technology of the Side-Slip Seat [54], the available infrastructure could be dynamically changed to support the boarding process by providing a wider aisle, which allows two passengers to pass each other in a convenient way (see Figure 14). Two additional benefits come with this new technology: the wider aisle allows airlines to offer full-size wheelchair access down the aisle and the middle seat is two inches wider than the aisle and window seats (aisle and window seats retain their standard width). Figure 14 demonstrates the staggered seat approach: the aisle seat is initially positioned over the middle seat and will be moved into flight position if a passenger wants to use the middle or aisle seat.
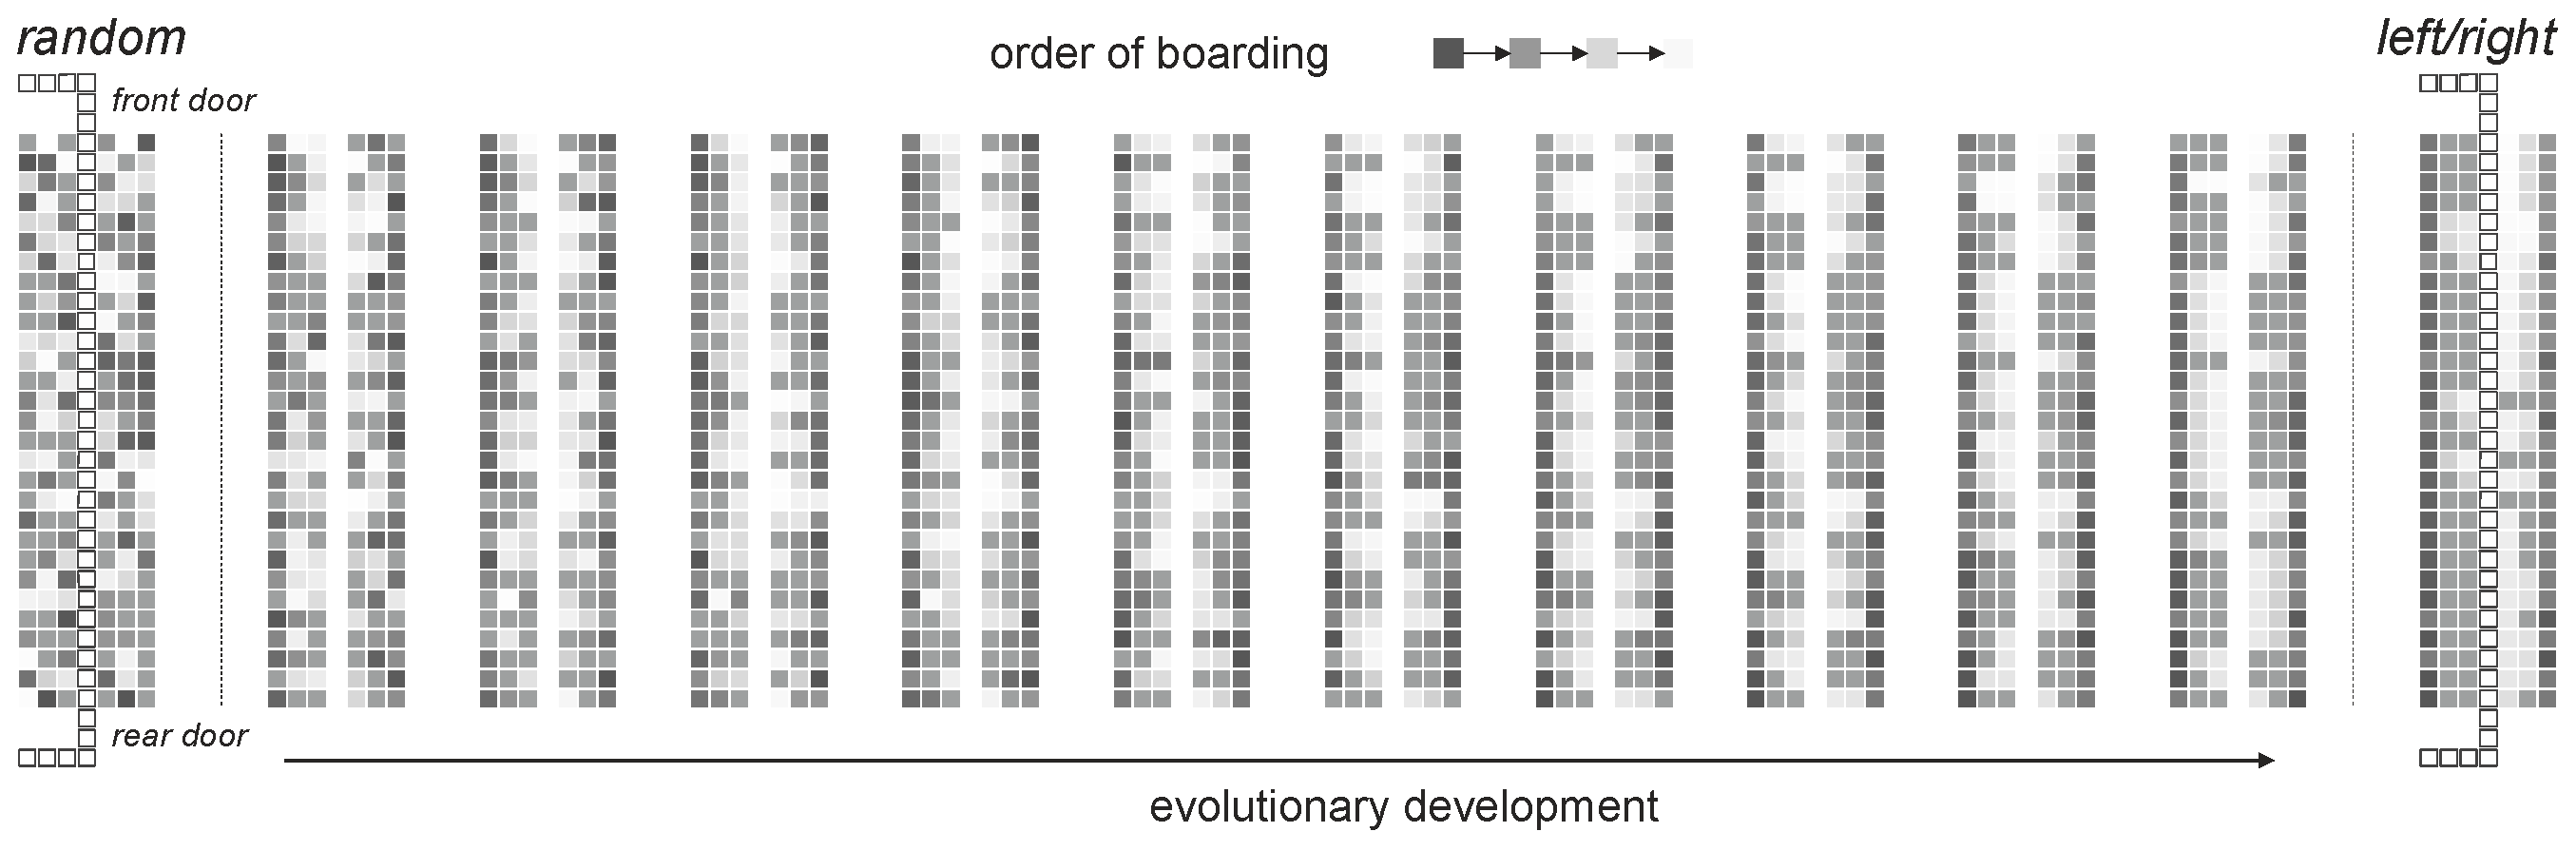
The stochastic boarding model is adapted to allow parallel movement of two passengers along the aisle. Furthermore, the dynamic status of the seat row (folded/unfolded) is implemented to enable/disable this parallel movement. The implementation of these new dynamic aircraft seats demands an appropriately adapted boarding strategy. To identify an optimal boarding sequence, the stochastic simulation model [25,39] was used as a reliable basis for an evolutionary algorithm, which continuously improves an initial set of boarding sequences. As Figure 15 shows, the evolutionary development steps lead to a boarding strategy where passengers on one side of the aisle should be boarded first. A detailed description of the method and results is provided in [43].
The evolutionary algorithm demonstrates that a boarding sequence that differentiates between the left and the right side of the aircraft will benefit most from the innovative Side-Slip Seat technology. Using the reference A320 layout, a random boarding strategy calling the left (right) side of the aircraft first results in 19% faster boarding, accompanied by more reliable progress (10% smaller value for the standard deviation of boarding time).
4. Boarding Progress and Connected Aircraft Cabin
Addressing the fact that boarding is on the critical path of the aircraft 4D trajectory and not controlled by the operators, a reliable scientific approach is needed for real-time evaluation of the boarding process using the capabilities of a future connected cabin (e.g., sensor environment). To enable reliable prediction of the boarding time, the aircraft/airport infrastructure and IT systems have to provide a set of relevant data. It is expected that a future connected cabin will be designed as a sensor network for multiple purposes (cyber physical system) such as passenger convenience, communication devices, or maintenance planning. In the context of boarding, an environment of sensors with the ability to detect whether passengers have taken their seats (e.g., pressure, infrared, or video sensors) or stand in the aisle and information from the boarding counter (passenger arrival sequence) are assumed as being likely future aircraft cabin equipment.
Therefore, a set of indicators is developed for depicting the real-time status of boarding progress as a fundamental basis for the prediction of the boarding time [50]. In this context, the aircraft seats are used as a sensor network with the capability to detect the seat status: free or occupied. The seat status is the basis for the calculation of an aircraft-wide interference potential as the major indicator of boarding progress.
4.1. Interference Potential as a Metric for Progress Prediction
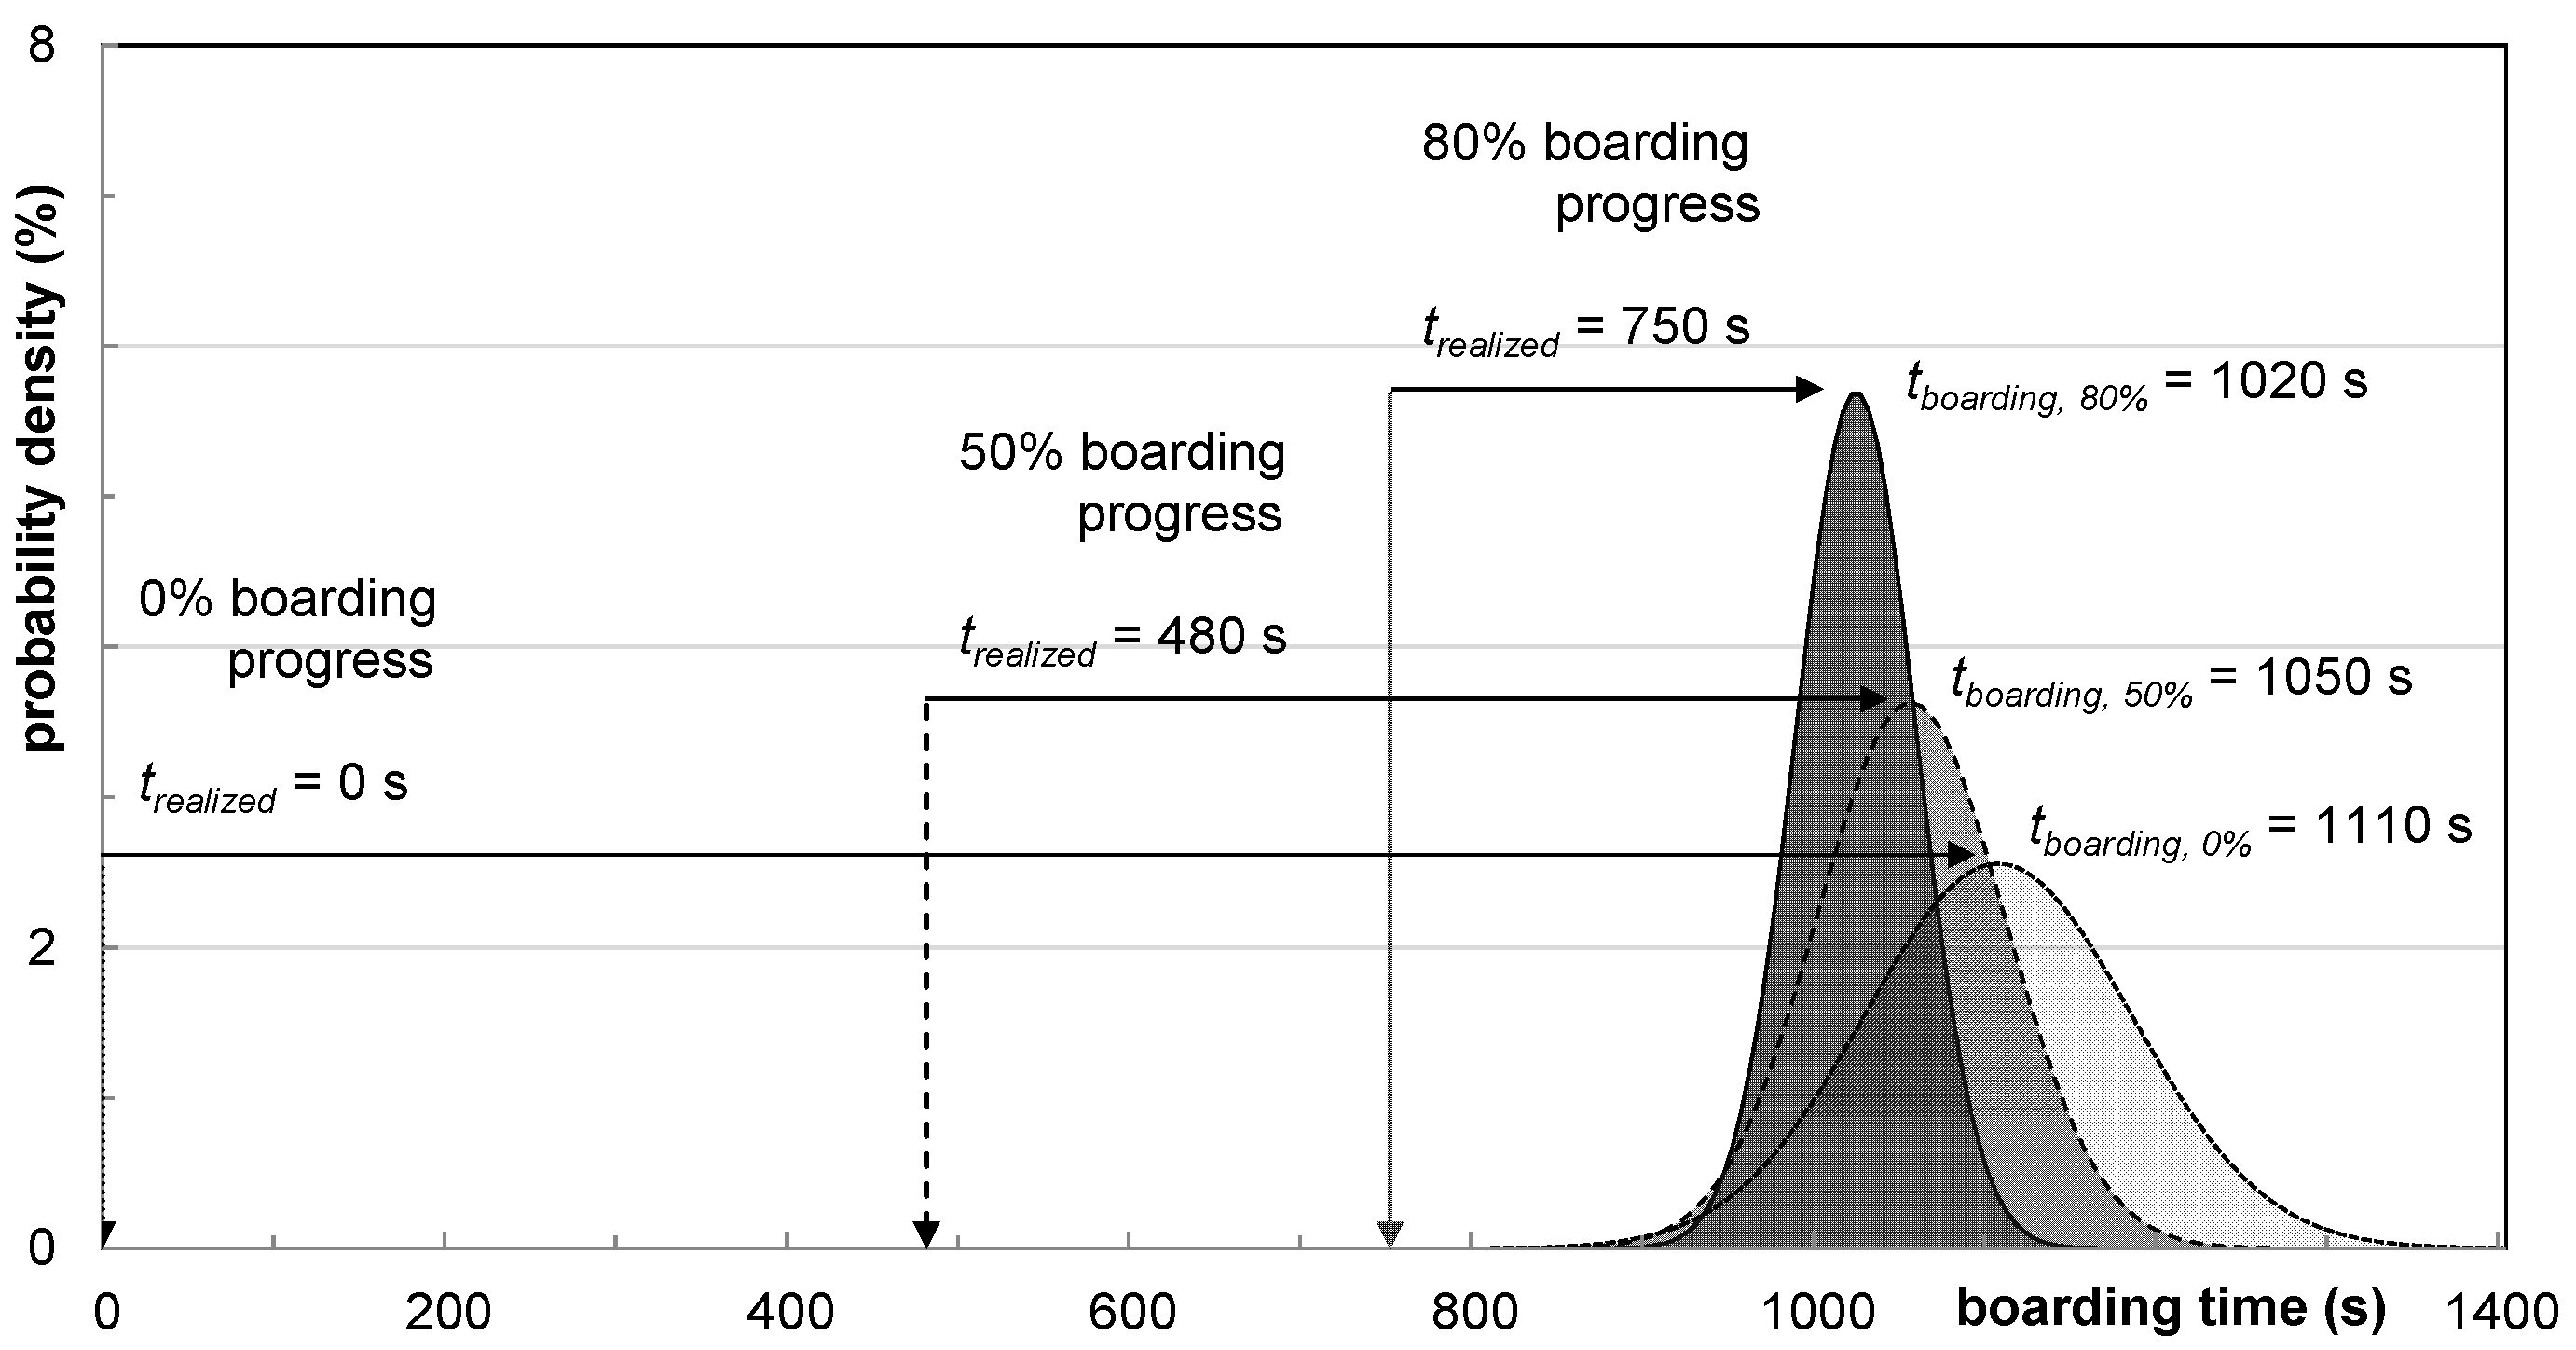
To predict the duration of aircraft boarding, the stochastic simulation model could be used with specific assumptions for the day of operations such as the position of the aircraft (apron, gate), doors to be used, number of boarding counters, aircraft type (e.g., A31x, A32x, B737), number of passengers booked (e.g., seat load factor, specific seats used), characteristics of passengers (e.g., premium, economy, hand luggage), or boarding sequence. Finally, this specific parameter set is implemented into the simulation environment and results in both an average boarding time and a corresponding standard deviation. During the course of boarding, the number of passengers seated in the aircraft increases constantly (realized boarding time) and the stochastic component of boarding time has a decreasing influence on the final boarding time. In Figure 16, the implication of the decreasing uncertainty during the course of boarding is shown, indicated by higher values of the corresponding probability density function. Here, boarding progresses of 0%, 50% and 80% are used as examples, with a realized progress time tr. The prediction of expected boarding time t0 starts at 1103 s (0% progress, 100% stochastic) and the last prediction (80% progress, 20% stochastic) results in 1021 s, with standard deviations of 78 s and 35 s, respectively.
Furthermore, the boarding time could be predicted with a higher level of reliability (more stable boarding progress), if the exact sequence of passengers is known beforehand. However, the boarding times still consist of a normal distributed characteristic, as Figure 17 demonstrates by using probability density.
Nevertheless, it is expected that a future connected cabin could provide additional data to further improve the prediction of boarding time. Thus, a metric was developed to evaluate the current boarding progress considering the allocation of occupied seats in the aircraft cabin. The main idea is that a scenario where all aisle seats are occupied will lead to significantly longer boarding times in comparison to a scenario where all window seats are occupied, if new passengers enter the aircraft. In the case of occupied aisle seats, passengers have to stand up first before new passengers can take a seat. In the case of occupied window seats, no further interactions will arise, if a new passenger takes seat. The possible interactions between passengers are aggregated to an interference potential for the current seat occupation in the aircraft.
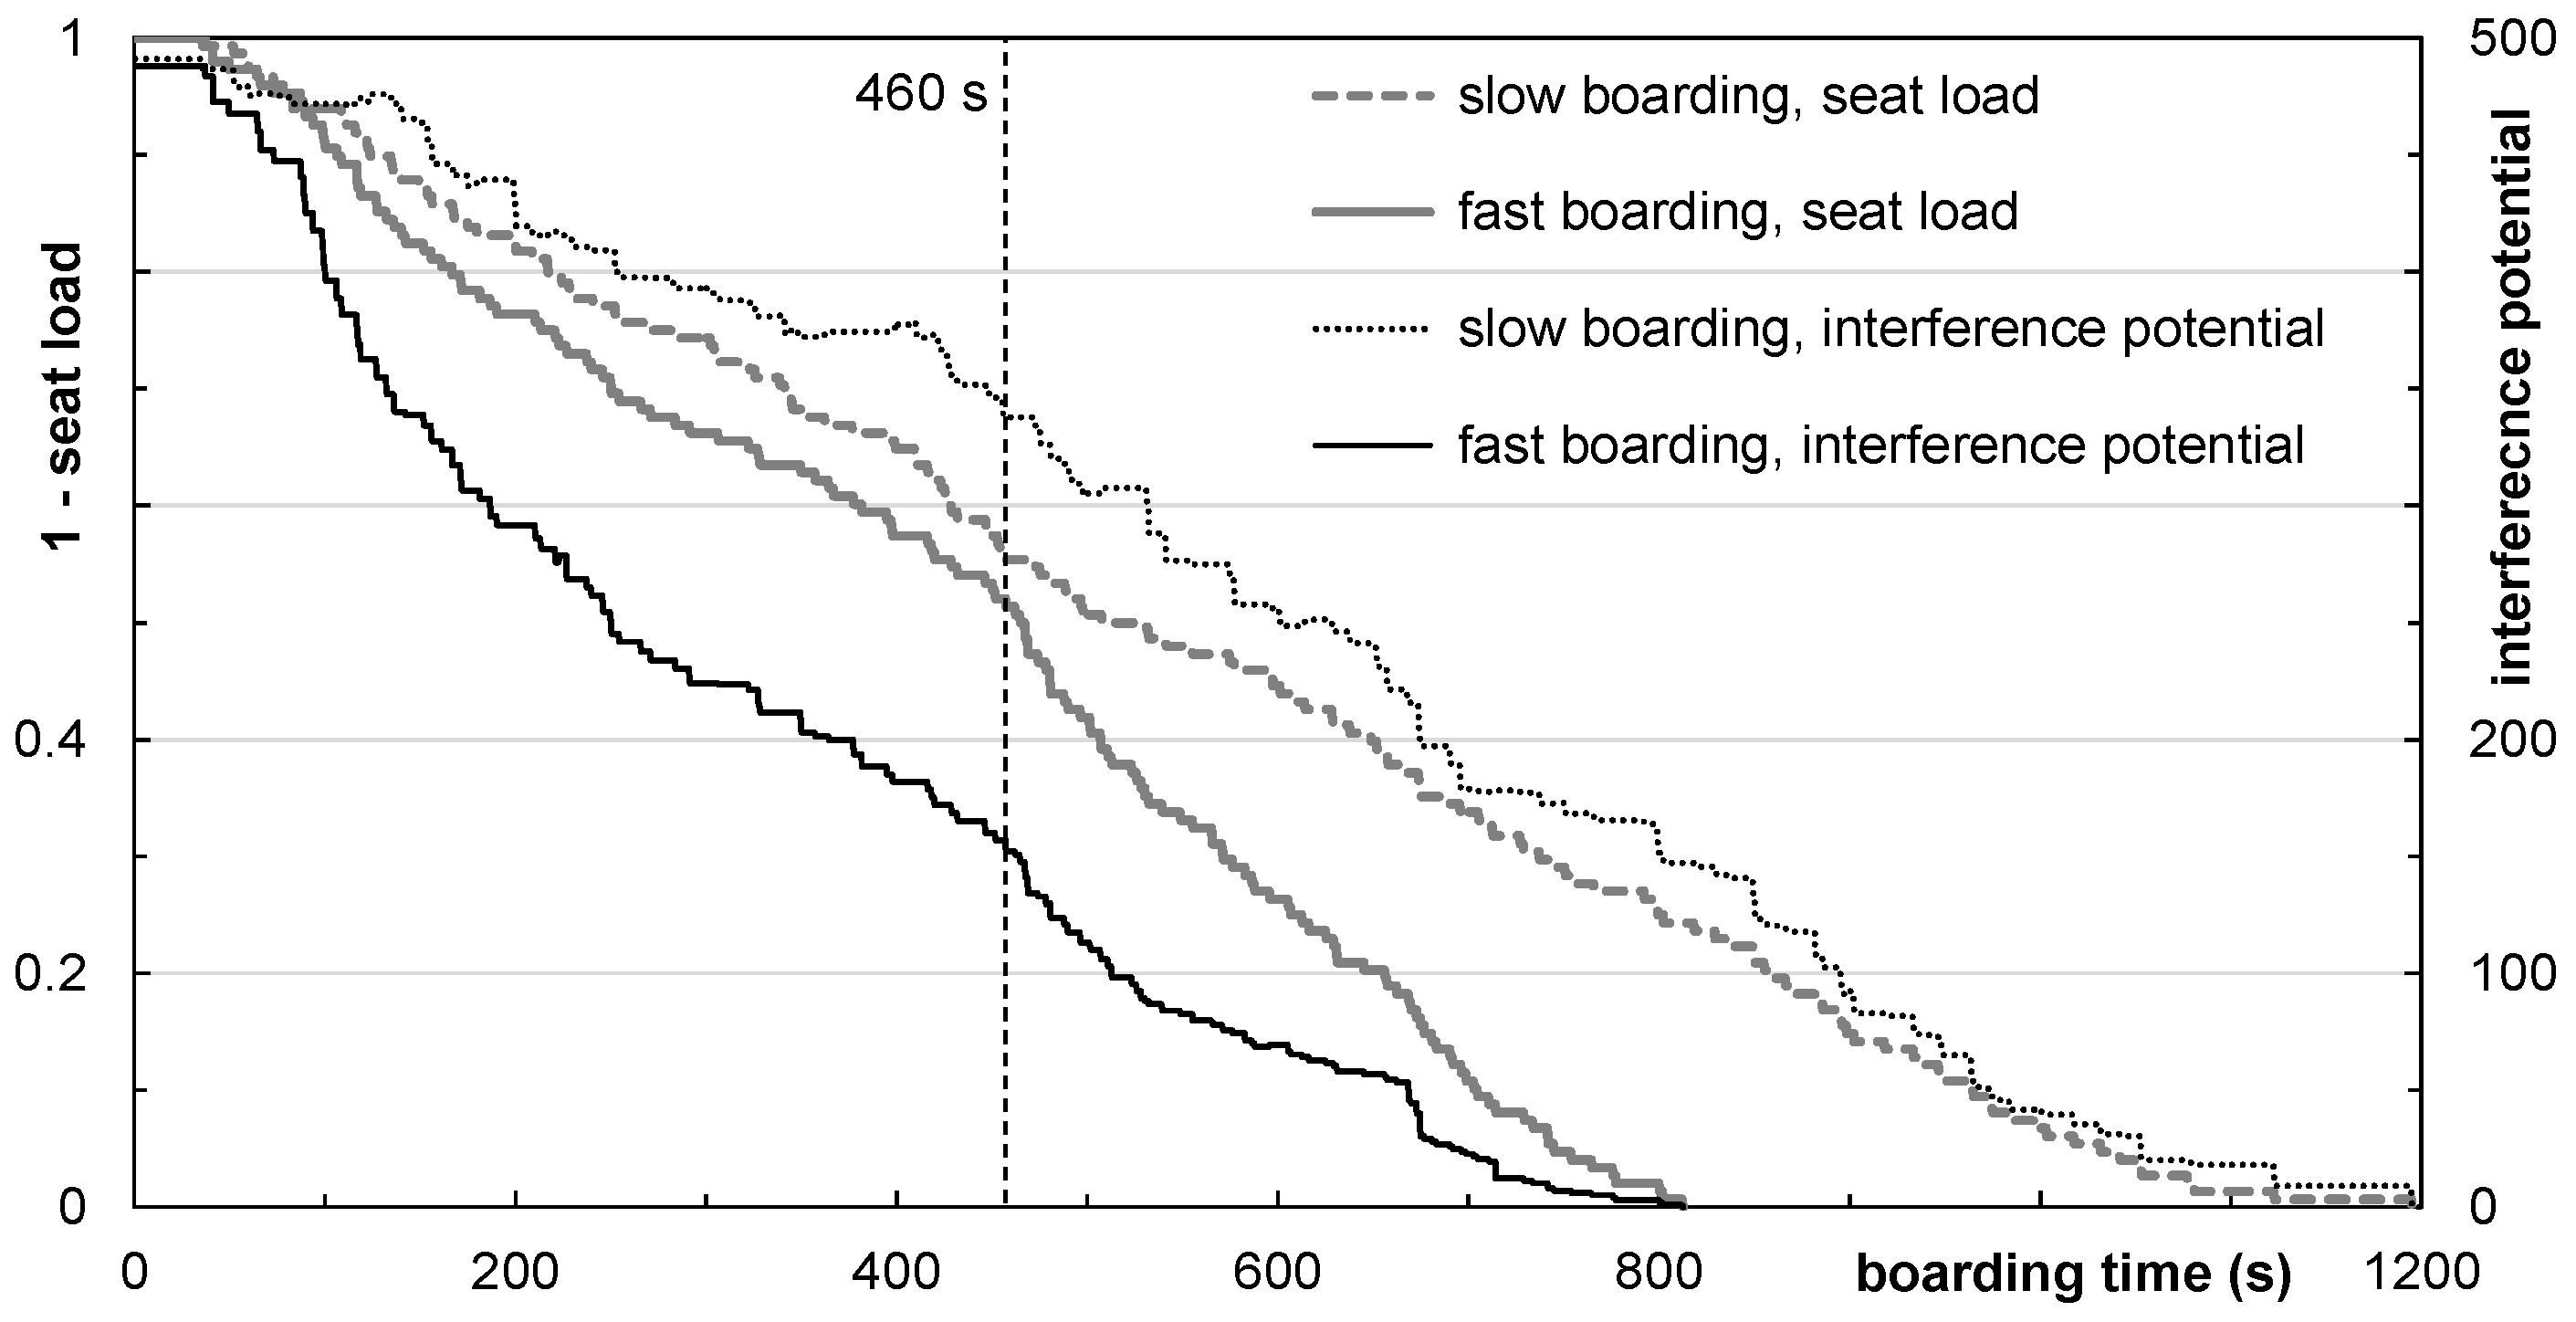
In Figure 18 the progress of the interference potential and the seat load are shown. The gray, vertical line labels a point in time (460 s) where the progress of the seat load provides no clear indication of which boarding strategy will be faster. However, the newly developed interference potential demonstrates that the boarding marked with a solid line has a significantly lower value for the interference potential, which leads to a shorter boarding time [55].
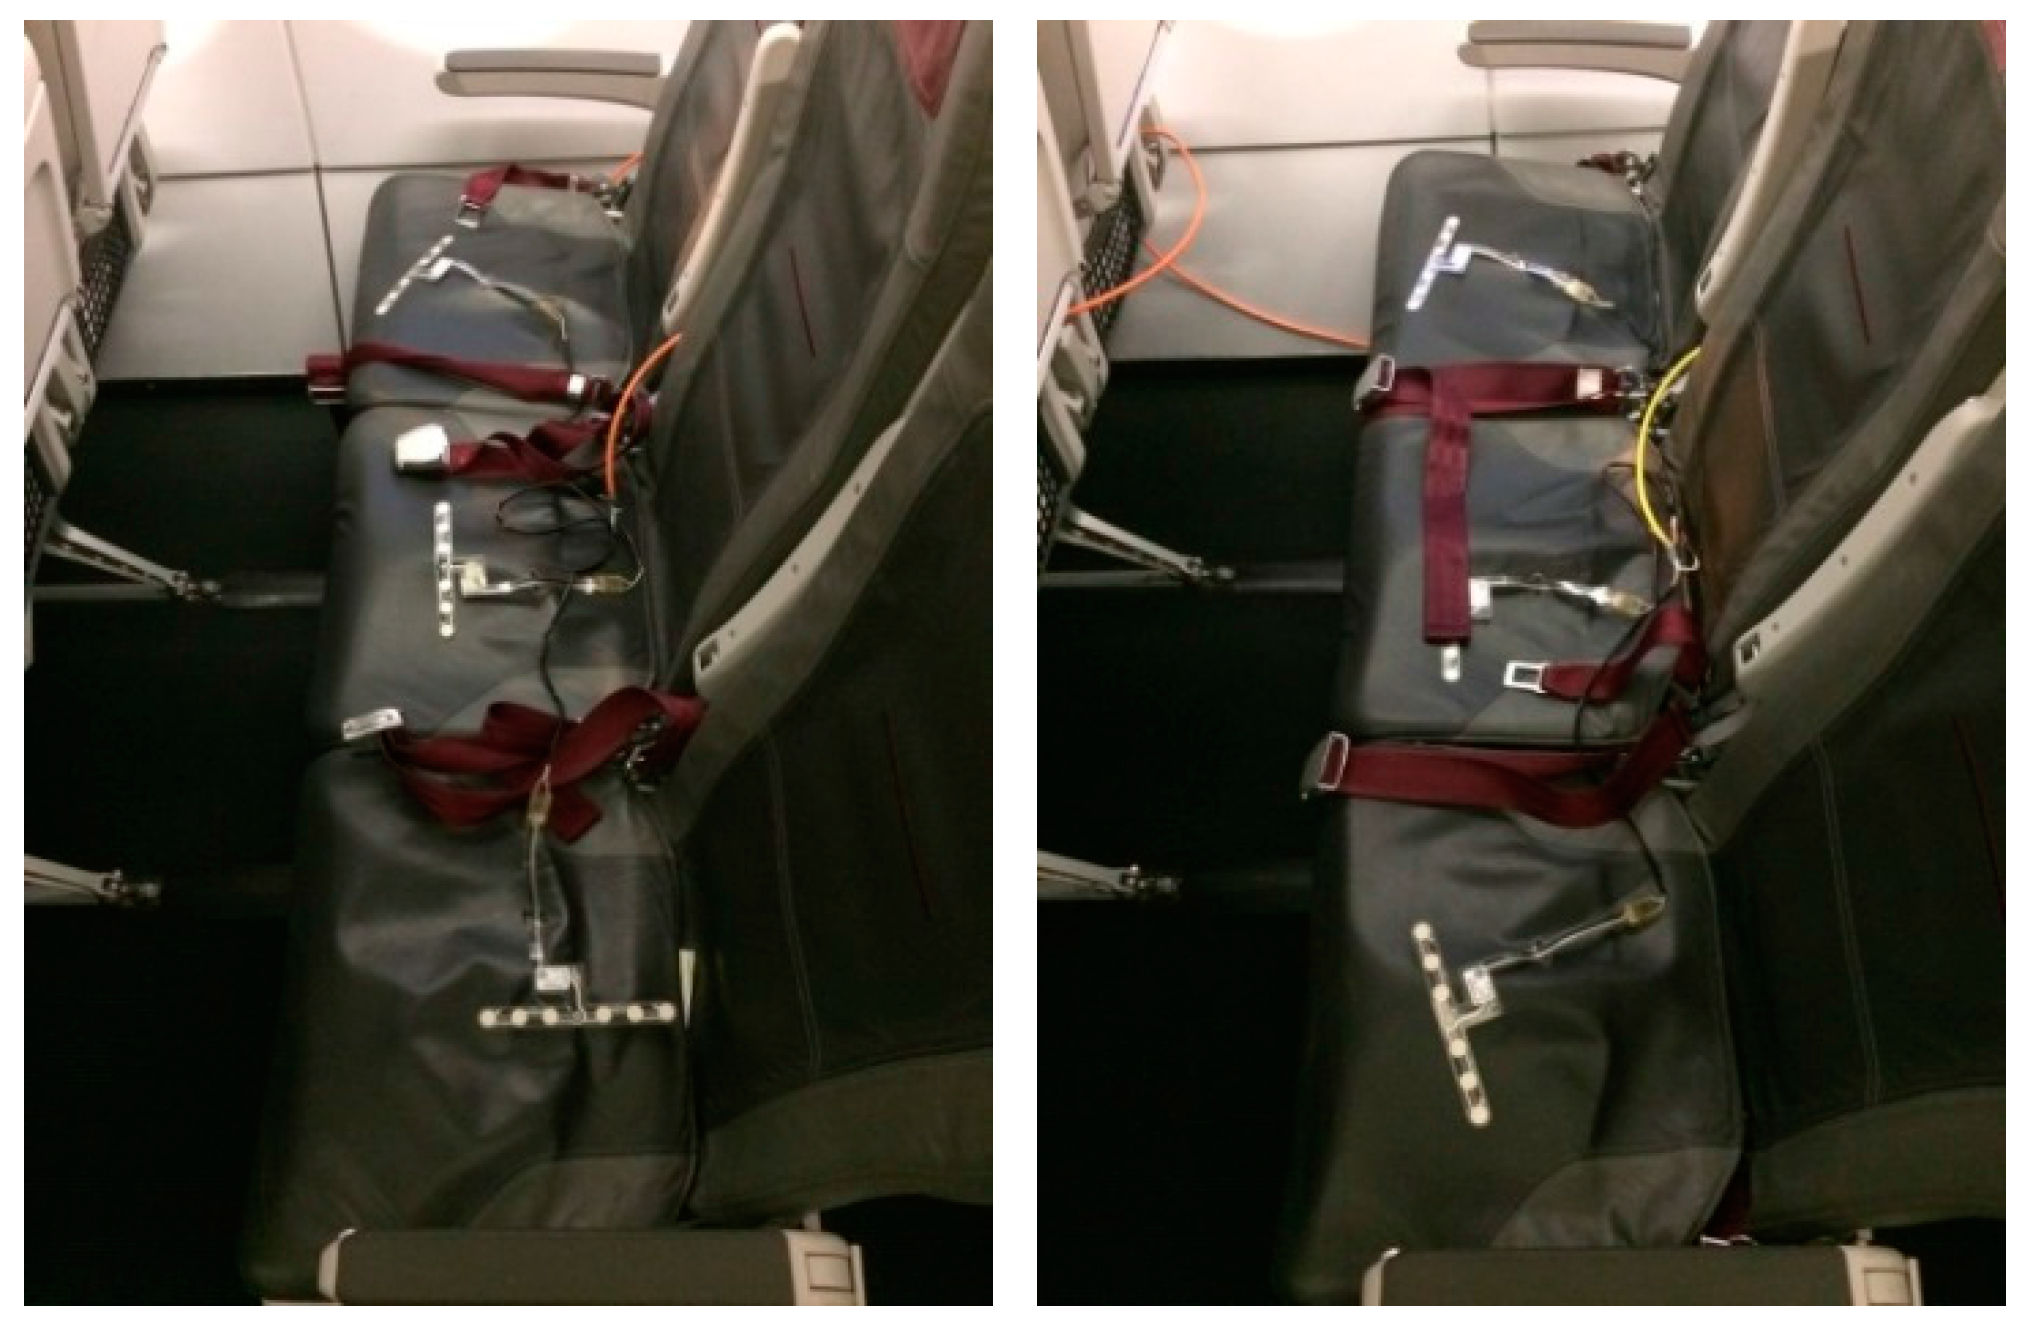
4.2. Field Trial of a Connected Aircraft Cabin
A hardware prototype environment of a connected aircraft cabin was developed (implementing interference potential) and used in field trials in close cooperation with Eurowings. In Figure 19, the field test setup is shown with seat sensors from the automotive industry. This sensor network was successfully tested in a mockup environment previously. The individual seat sensors efficiently indicate the seat status and aggregated seat row conditions are sent to a central processing unit, which shows aircraft-wide status information to the operator. Furthermore, a sensor floor was installed in the aircraft aisle to additionally detect specific passenger positions (density, congestion) and walking speeds in the aisle.
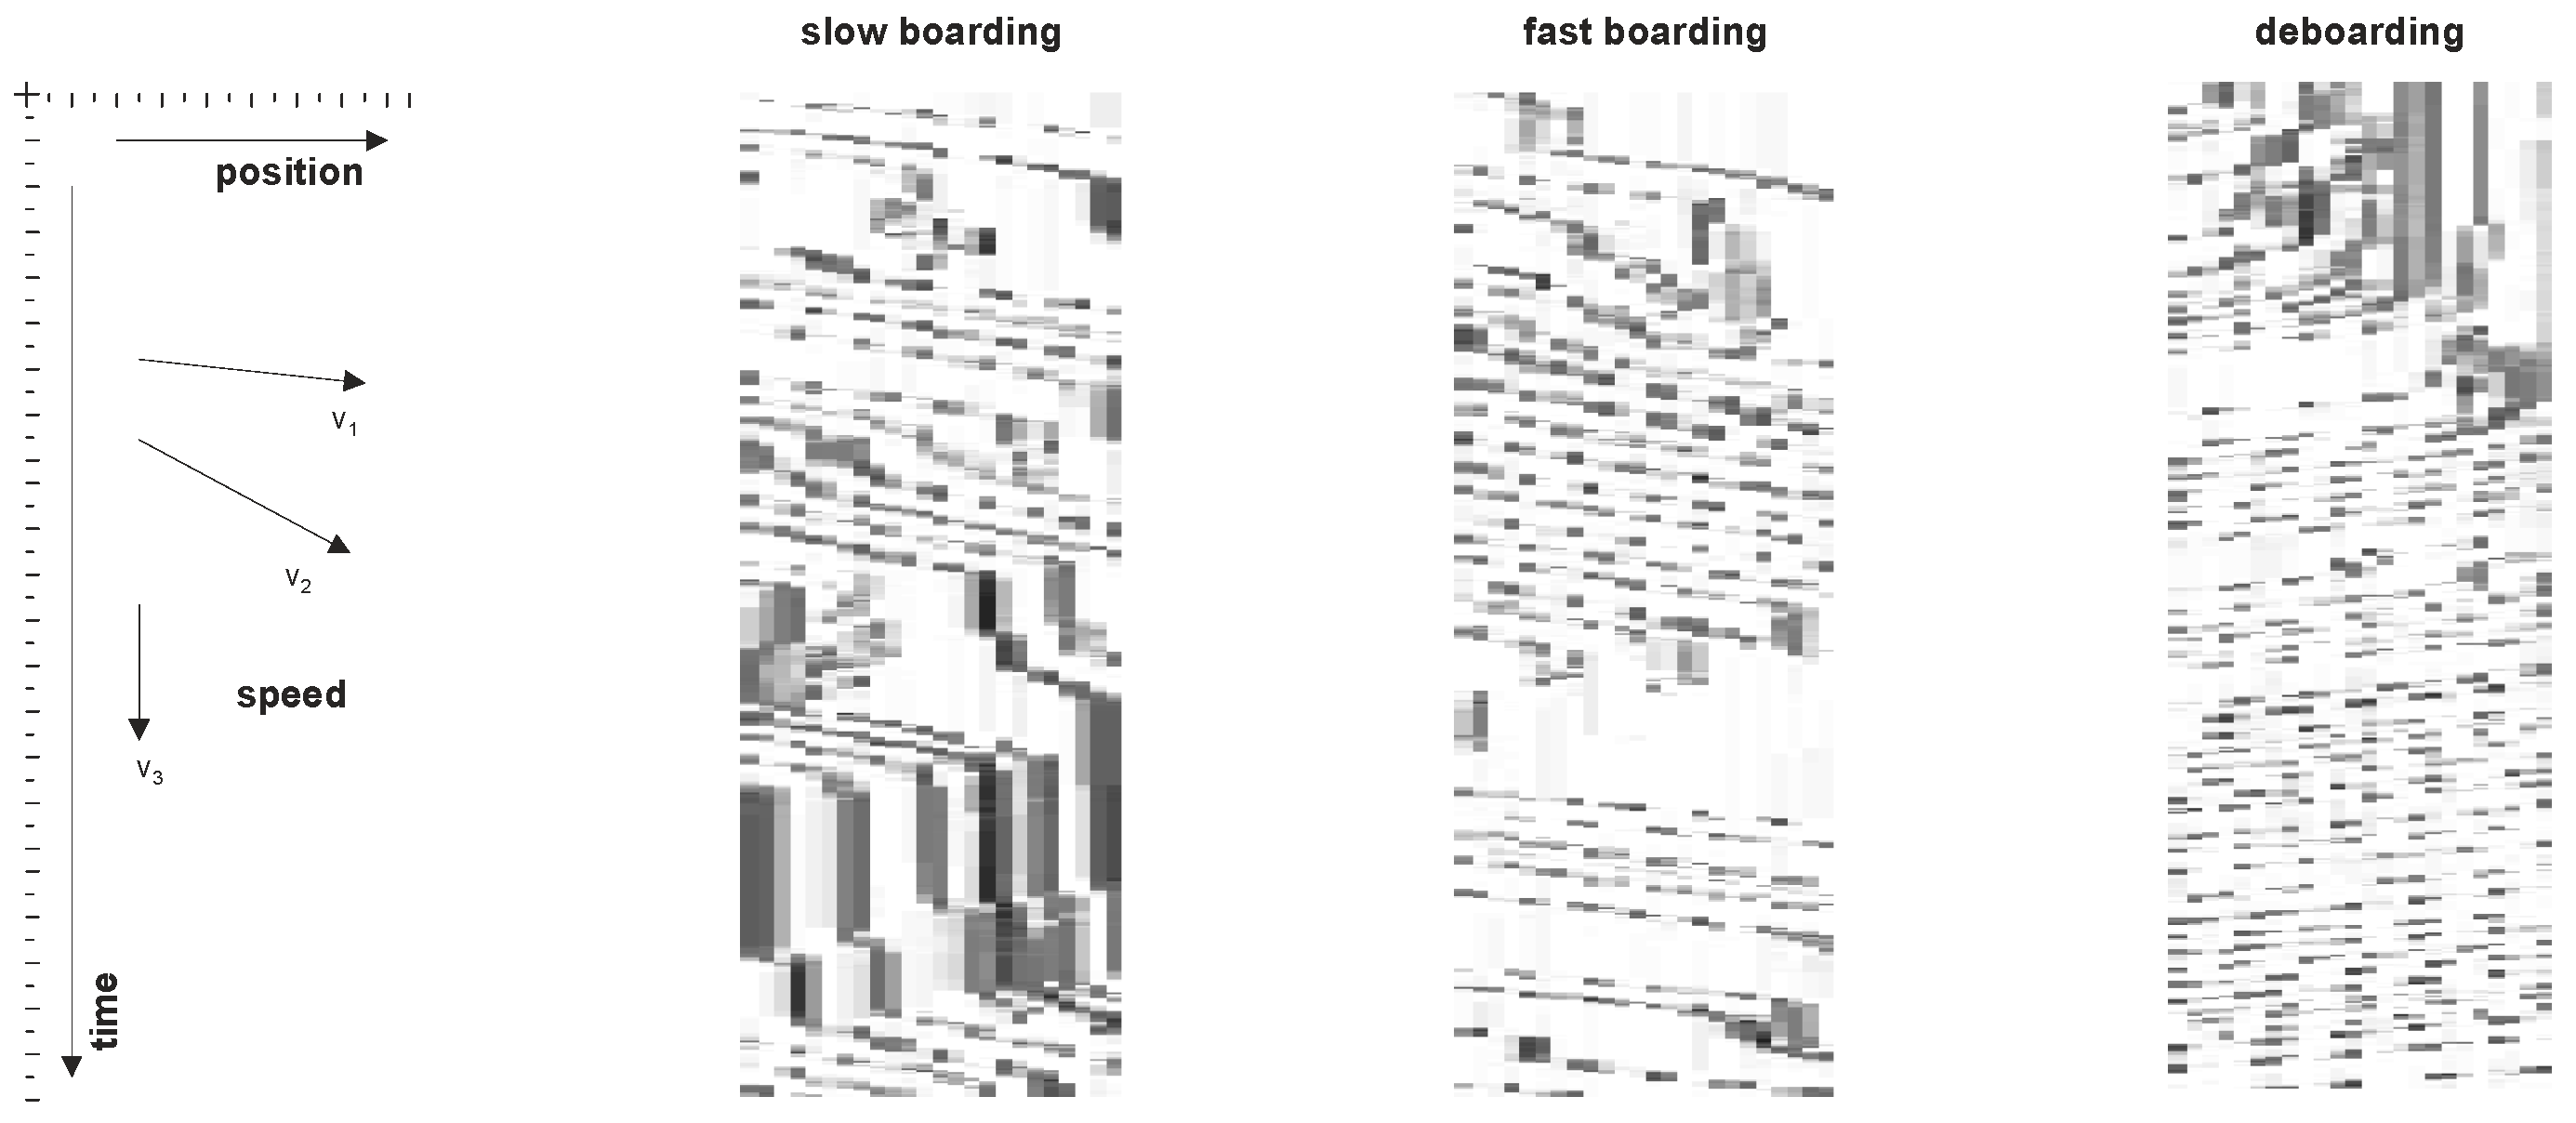
In Figure 20 the sensor results of two different boarding scenarios are shown: slow and fast boarding. Herein, the x-axis shows the position along the aircraft aisle and the y-axis shows the time. Consequently, this kind of representation allows for determining maximum walking speed of passengers, and an indication of congested areas in the aisle. The slow boarding scenario clearly consists of more congested areas (waiting queues), while the fast boarding shows mainly unconstrained passenger movements in aircraft aisle. A preliminary analysis of the average unconstrained (maximum) speed of passengers results in 0.78 m/s, with a standard deviation of 0.31 m/s during boarding and a speed of 0.99 m/s with 0.24 m/s during deboarding.
5. Summary and Outlook
This paper gives an overview of the status quo regarding fast aircraft turnaround, with a specific focus on aircraft boarding. A stochastic boarding model is introduced that considers both individual passenger behavior and operational constraints. The input parameters of the boarding model are calibrated with data from field trials and the model finally shows deviations smaller than 5% between measured and simulated boarding times.
The stochastic boarding model is implemented in a simulation environment to evaluate specific boarding scenarios using different boarding strategies and technologies. The application of the model confirms prior findings (e.g., outside-in is faster than random boarding) and shows higher sensitivity of complex boarding strategies (outside-in and individual boarding) to passenger conformance, which is important for real airline/aircraft operations. Furthermore, simulation results indicate that boarding time could be reliably reduced by 20–30% in the field. Infrastructural changes, such as the innovative Side-Slip Seat, show additional potential to shorten the boarding time.
It is assumed that future aircraft cabins will be designed as a sensor network (cyber physical system, connected cabin) to provide information on passenger convenience, communication devices, or maintenance planning. In the context of aircraft boarding, this information could be used to assess the current and future status of boarding progress. Thus, a set of indicators is developed to evaluate and aggregate the (current and expected) passenger interactions during boarding to an interference potential, which will be the fundamental basis for real-time predictions of boarding time using machine learning (cf. [57]). Finally, a hardware prototype environment of a connected aircraft cabin was developed and tested in a field trial, in close cooperation with Eurowings, and showed promising results with regards to future boarding improvements. In combination with integrated airline/airport information management (e.g., sequence of boarding passengers), the boarding process could now be transformed from a black box to a transparent process with the operator’s real-time ability to react to significant deviations from the planned process.
Conflicts of Interest
The author declares no conflicts of interest.
References
- ICAO. Aviation System Block Upgrades—The Framework for Global Harmonization, 2nd ed.; ICAO: Montreal, QC, Canada, 2013; Ver. 3. [Google Scholar]
- Eurocontrol. Airport CDM Implementation Manual, 5th ed.; Eurocontrol: Brussels, Belgium, 2017. [Google Scholar]
- SESAR. Concept of Operations Step 2 (Ed. 01.01.00). Single European Sky ATM Research Programme; Eurocontrol: Brussels, Belgium, 2014. [Google Scholar]
- Tobaruela, G.; Fransen, P.; Schuster, W.; Ochieng, W.Y.; Majumdar, A. Air traffic predictability framework—Development, performance evaluation and application. J. Air Transp. Manag. 2014, 39, 48–58. [Google Scholar] [CrossRef]
- ICAO. Manual on System Wide Information Management (SWIM) Concept, Doc. 10039 AN/511; ICAO: Montreal, QC, Canada, 2016. [Google Scholar]
- ICAO. Flight & Flow Information for a Collaborative Environment (FF-ICE) Concept, Doc. 9965; ICAO: Montreal, QC, Canada, 2012. [Google Scholar]
- ICAO. Global Air Traffic Management Operational Concept, Doc 9854, AN/458; ICAO: Montreal, QC, Canada, 2005. [Google Scholar]
- Bronsvoort, J.; McDonald, G.; Porteous, R.; Gutt, E. Study of aircraft derived temporal prediction accuracy using FANS. In Proceedings of the 13th ATRS World Conference, Abu Dhabi, UAE, 27–30 June 2009. [Google Scholar]
- Mueller, E.R.; Chatterji, G.B. Analysis of aircraft arrival and departure delay. In Proceedings of the AIAA Aviation Technology, Integration, and Operations Conference, Los Angeles, CA, USA, 1–3 October 2002. [Google Scholar]
- Eurocontrol. Performance Review Report—An Assessment of Air Traffic Management in Europe during the Calendar Year 2014, 2015, 2016, 2017 Performance Review Commission; Eurocontrol: Brussels, Belgium, 2017. [Google Scholar]
- Tielrooij, M.; Borst, C.; van Paassen, M.M.; Mulder, M. Predicting arrival time uncertainty from actual flight information. In Proceedings of the 11th USA/Europe ATM Seminar, Lisbon, Portugal, 23–26 June 2016. [Google Scholar]
- IATA. AHM 730—Codes to be used in aircraft movement and diversion messages. In Airport Handling Manual, 37th ed.; IATA: Montreal, QC, Canada, 2017. [Google Scholar]
- Eurocontrol. CODA DIGEST All-Causes Delay and Cancellations to Air Transport in Europe—2016; Eurocontrol: Brussels, Belgium, 2016. [Google Scholar]
- SESAR. Single European Sky ATM Research Programme. In European ATM Master Plan, 2015 ed.; Eurocontrol: Brussels, Belgium, 2015. [Google Scholar]
- Fricke, H.; Schultz, M. Improving aircraft turn around reliability. In Proceedings of the 3rd ICRAT, Fairfax, VA, USA, 1–4 June 2008; pp. 335–343. [Google Scholar]
- Fricke, H.; Schultz, M. Delay Impacts onto turnaround performance. In Proceedings of the 8th USA/Europe ATM Seminar, Napa, CA, USA, 29 June–2 July 2009. [Google Scholar]
- Schmidt, M. A Review of Aircraft Turnaround Operations and Simulations. Prog. Aerosp. Sci. 2017, 92, 25–38. [Google Scholar] [CrossRef]
- Jaehn, F.; Neumann, S. Airplane boarding. Eur. J. Oper. Res. 2015, 244, 339–359. [Google Scholar] [CrossRef]
- Nyquist, D.C.; McFadden, K.L. A study of the airline boarding problem. J. Air Transp. Manag. 2008, 14, 197–204. [Google Scholar] [CrossRef]
- Mirza, M. Economic Impact of Airplane Turn-times. AERO Q. 2008, 4, 14–19. [Google Scholar]
- Van Landeghem, H.V.; Beuselinck, A. Reducing passenger boarding time in airplanes: A simulation based approach. Eur. J. Oper. Res. 2002, 142, 294–308. [Google Scholar] [CrossRef]
- Ferrari, P.; Nagel, K. Robustness of efficient passenger boarding strategies for airplanes. J. Transp. Res. Board 2005, 1915, 44–54. [Google Scholar] [CrossRef]
- Van den Briel, M.H.L.; Villalobos, J.R.; Hogg, G.L.; Lindemann, T.; Mule, A.V. America west airlines develops efficient boarding strategies. Interfaces 2005, 35, 191–201. [Google Scholar] [CrossRef]
- Bachmat, E.; Elkin, M. Bounds on the performance of back-to-front aircraft boarding policies. Oper. Res. Lett. 2008, 35, 597–601. [Google Scholar] [CrossRef]
- Schultz, M.; Schulz, C.; Fricke, H. Efficiency of Aircraft Boarding Procedures. In Proceedings of the 3rd International Conference for Research in Air Transportation, Fairfax, VA, USA, 1–4 June 2008; pp. 371–377. [Google Scholar]
- Bachmat, E.; Khachaturov, V.; Kuperman, R. Optimal back-to-front airplane boarding. Phys. Rev. E 2013, 87. [Google Scholar] [CrossRef] [PubMed]
- Bazargan, M. A linear programming approach for aircraft boarding strategy. Eur. J. Oper. Res. 2007, 183, 394–411. [Google Scholar] [CrossRef]
- Steffen, J.H. Optimal boarding method for airline passengers. J. Air Transp. Manag. 2008, 14, 146–150. [Google Scholar] [CrossRef]
- Steffen, J.H. A statistical mechanics model for free-for-all airplane passenger boarding. Am. J. Phys. 2008, 76, 1114–1119. [Google Scholar] [CrossRef]
- Frette, V.; Hemmer, P.-C. Time needed to board an aircraft: A power law and the structure behind it. Phys. Rev. E 2012, 85. [Google Scholar] [CrossRef]
- Bernstein, N. Comment on time needed to board an airplane: A power law and the structure behind it. Phys. Rev. E 2012, 86, 023101. [Google Scholar] [CrossRef] [PubMed]
- Tang, T.-Q.; Wu, Y.-H.; Huang, H.-J.; Caccetta, L. An aircraft boarding model accounting for passengers’ individual properties. J. Transp. Res. Part C Emerg. Technol. 2012, 22, 1–16. [Google Scholar] [CrossRef]
- Milne, R.J.; Kelly, A.R. A new method for boarding passengers onto an airplane. J. Air Transp. Manag. 2014, 34, 93–100. [Google Scholar] [CrossRef]
- Qiang, S.-J.; Jia, B.; Xie, D.-F.; Gao, Z.-Y. Reducing airplane boarding time by accounting for passengers’ individual properties: A simulation based on cellular automaton. J. Air Transp. Manag. 2014, 40, 42–47. [Google Scholar] [CrossRef]
- Milne, R.J.; Salari, M. Optimization of assigning passengers to seats on airplanes based on their carry-on luggage. J. Air Transp. Manag. 2016, 54, 104–110. [Google Scholar] [CrossRef]
- Zeineddine, H. A dynamically optimized aircraft boarding strategy. J. Air Transp. Manag. 2017, 58, 144–151. [Google Scholar] [CrossRef]
- Bachmat, E.; Berend, D.; Sapir, L.; Skiena, S.; Stolyarov, N. Analysis of aircraft boarding times. Oper. Res. 2009, 57, 499–513. [Google Scholar] [CrossRef]
- Chung, C.-A. Simulation design approach for the selection of alternative commercial passenger aircraft seating configurations. J. Aviat. Technol. Eng. 2012, 2, 100–104. [Google Scholar] [CrossRef]
- Schultz, M.; Kunze, T.; Fricke, H. Boarding on the critical path of the turnaround. In Proceedings of the 10th USA/Europe ATM Seminar, Chicago, IL, USA, 10–13 June 2013. [Google Scholar]
- Fuchte, J. Enhancement of Aircraft Cabin Design Guidelines with Special Consideration of Aircraft Turnaround and Short Range Operations. Ph.D. Thesis, Technische Universität Hamburg-Harburg, Hamburg, Germany, April 2014. [Google Scholar]
- Schmidt, M.; Nguyen, P.; Hornung, M. Novel Aircraft Ground Operation Concepts Based on Clustering of Interfaces; SAE Technical Paper 2015-01-2401; SAE AeroTech Congress and Exhibition: Seattle, WA, USA, September 2015. [Google Scholar]
- Schmidt, M.; Heinemann, P.; Hornung, M. Boarding and turnaround process assessment of single- and twin-aisle aircraft. In Proceedings of the 55th AIAA Aerospace Sciences Meeting, AIAA SciTech Forum, AIAA 2017-1856, Grapevine, TX, USA, 9–13 January 2017. [Google Scholar]
- Schultz, M. Dynamic change of aircraft seat condition for fast boarding. J. Transp. Res. Part C Emerg. Technol. 2017, 85, 131–147. [Google Scholar] [CrossRef]
- Steffen, J.H.; Hotchkiss, J. Experimental test of aircraft boarding methods. J. Air Transp. Manag. 2012, 18, 64–67. [Google Scholar] [CrossRef]
- Kierzkowski, A.; Kisiel, T. The human factor in the passenger boarding process at the airport. Proc. Eng. 2017, 187, 348–355. [Google Scholar] [CrossRef]
- Gwynne, S.M.V.; Senarath Yapa, U.; Codrington, L.; Thomas, J.R.; Jennings, S.; Thompson, A.J.L.; Grewal, A. Small-scale trials on passenger microbehaviours during aircraft boarding and deplaning procedures. J. Air Transp. Manag. 2018, 67, 115–133. [Google Scholar] [CrossRef]
- Schultz, M. Field trial measurements to validate a stochastic aircraft boarding model. J. Transp. Res. Part C Emerg. Technol. 2018. under review. [Google Scholar]
- Miura, A.; Nishinari, K. A passenger distribution analysis model for the perceived time of airplane boarding/deboarding, utilizing an ex-Gaussian distribution. J. Air Transp. Manag. 2017, 59, 44–49. [Google Scholar] [CrossRef]
- Schultz, M. Aircraft boarding—Data, validation, analysis. In Proceedings of the 12th USA/Europe ATM Seminar, Seattle, WA, USA, 26–30 June 2017. [Google Scholar]
- Schultz, M. The Seat Interference Potential as an Indicator for the Aircraft Boarding Progress; SAE Technical Paper 2017-01-2113; SAE AeroTech Congress and Exhibition: Fort Worth, TX, USA, September 2017. [Google Scholar]
- Schultz, M. Stochastic transition model for pedestrian dynamics. In Pedestrian and Evacuation Dynamics 2012; Weidmann, U., Kirsch, U., Schreckenberg, M., Eds.; Springer: Berlin, Germany, 2014; pp. 971–986. [Google Scholar]
- Schultz, M.; Fricke, H. Managing passenger handling at airport terminal. In Proceedings of the 9th USA/Europe ATM Seminar, Berlin, Germany, 14–17 June 2011. [Google Scholar]
- Schultz, M. Entwicklung eines individuenbasierten Modells zur Abbildung des Bewegungsverhaltens von Passagieren im Flughafenterminal. Ph.D. Thesis, Technische Universität Dresden, Dresden, Germany, August 2010. [Google Scholar]
- Molon Labe Seating. Side-Slip Seat. Available online: www.airlineseats.biz (accessed on 26 September 2017).
- Schultz, M. Implementation and Application of a Stochastic Aircraft Boarding Model. J. Transp. Res. Part C Emerg. Technol. 2018. under review. [Google Scholar]
- Schultz, M. A metric for the real-time evaluation of the aircraft boarding progress. J. Transp. Res. Part C Emerg. Technol. 2018, 86, 467–487. [Google Scholar] [CrossRef]
- Reitmann, S.; Gillissen, A.; Schultz, M. Performance benchmarking in interdependent ATM systems. In Proceedings of the 7th International Conference for Research in Air Transportation, Philadelphia, PA, USA, 20–24 June 2016. [Google Scholar]
Figure 1.
Variability of ground and flight phases on intra-European flights, 2008–2015 (cf. [10]).
Figure 1.
Variability of ground and flight phases on intra-European flights, 2008–2015 (cf. [10]).

Figure 2.
Average departure delay per flight by hour of the day (cf. [13]).
Figure 2.
Average departure delay per flight by hour of the day (cf. [13]).

Figure 3.
Grid-based simulation environment using an Airbus A320 seat layout as reference.

Figure 4.
Example for random and back-to-front boarding strategy (darker seats are boarded first).

Figure 5.
Consideration of operational constraints in the stochastic boarding model.

Figure 6.
Boarding times of 282 measured flights with different numbers of passengers, assuming a linear correlation between passengers and boarding time (solid line).
Figure 6.
Boarding times of 282 measured flights with different numbers of passengers, assuming a linear correlation between passengers and boarding time (solid line).

Figure 7.
Boarding rate classification (high, medium, and low) for different numbers of passengers.

Figure 8.
Boarding progress of one specific flight on different days of operations.

Figure 9.
Distribution of time needed to store hand luggage: comparison of field measurements and Weibull distribution.
Figure 9.
Distribution of time needed to store hand luggage: comparison of field measurements and Weibull distribution.

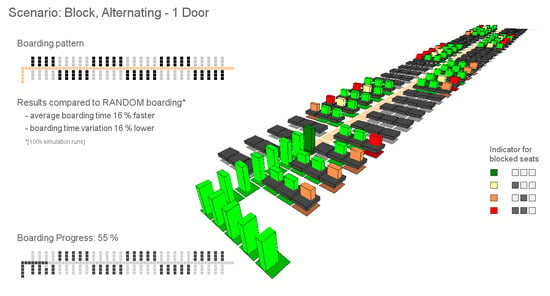
Figure 10.
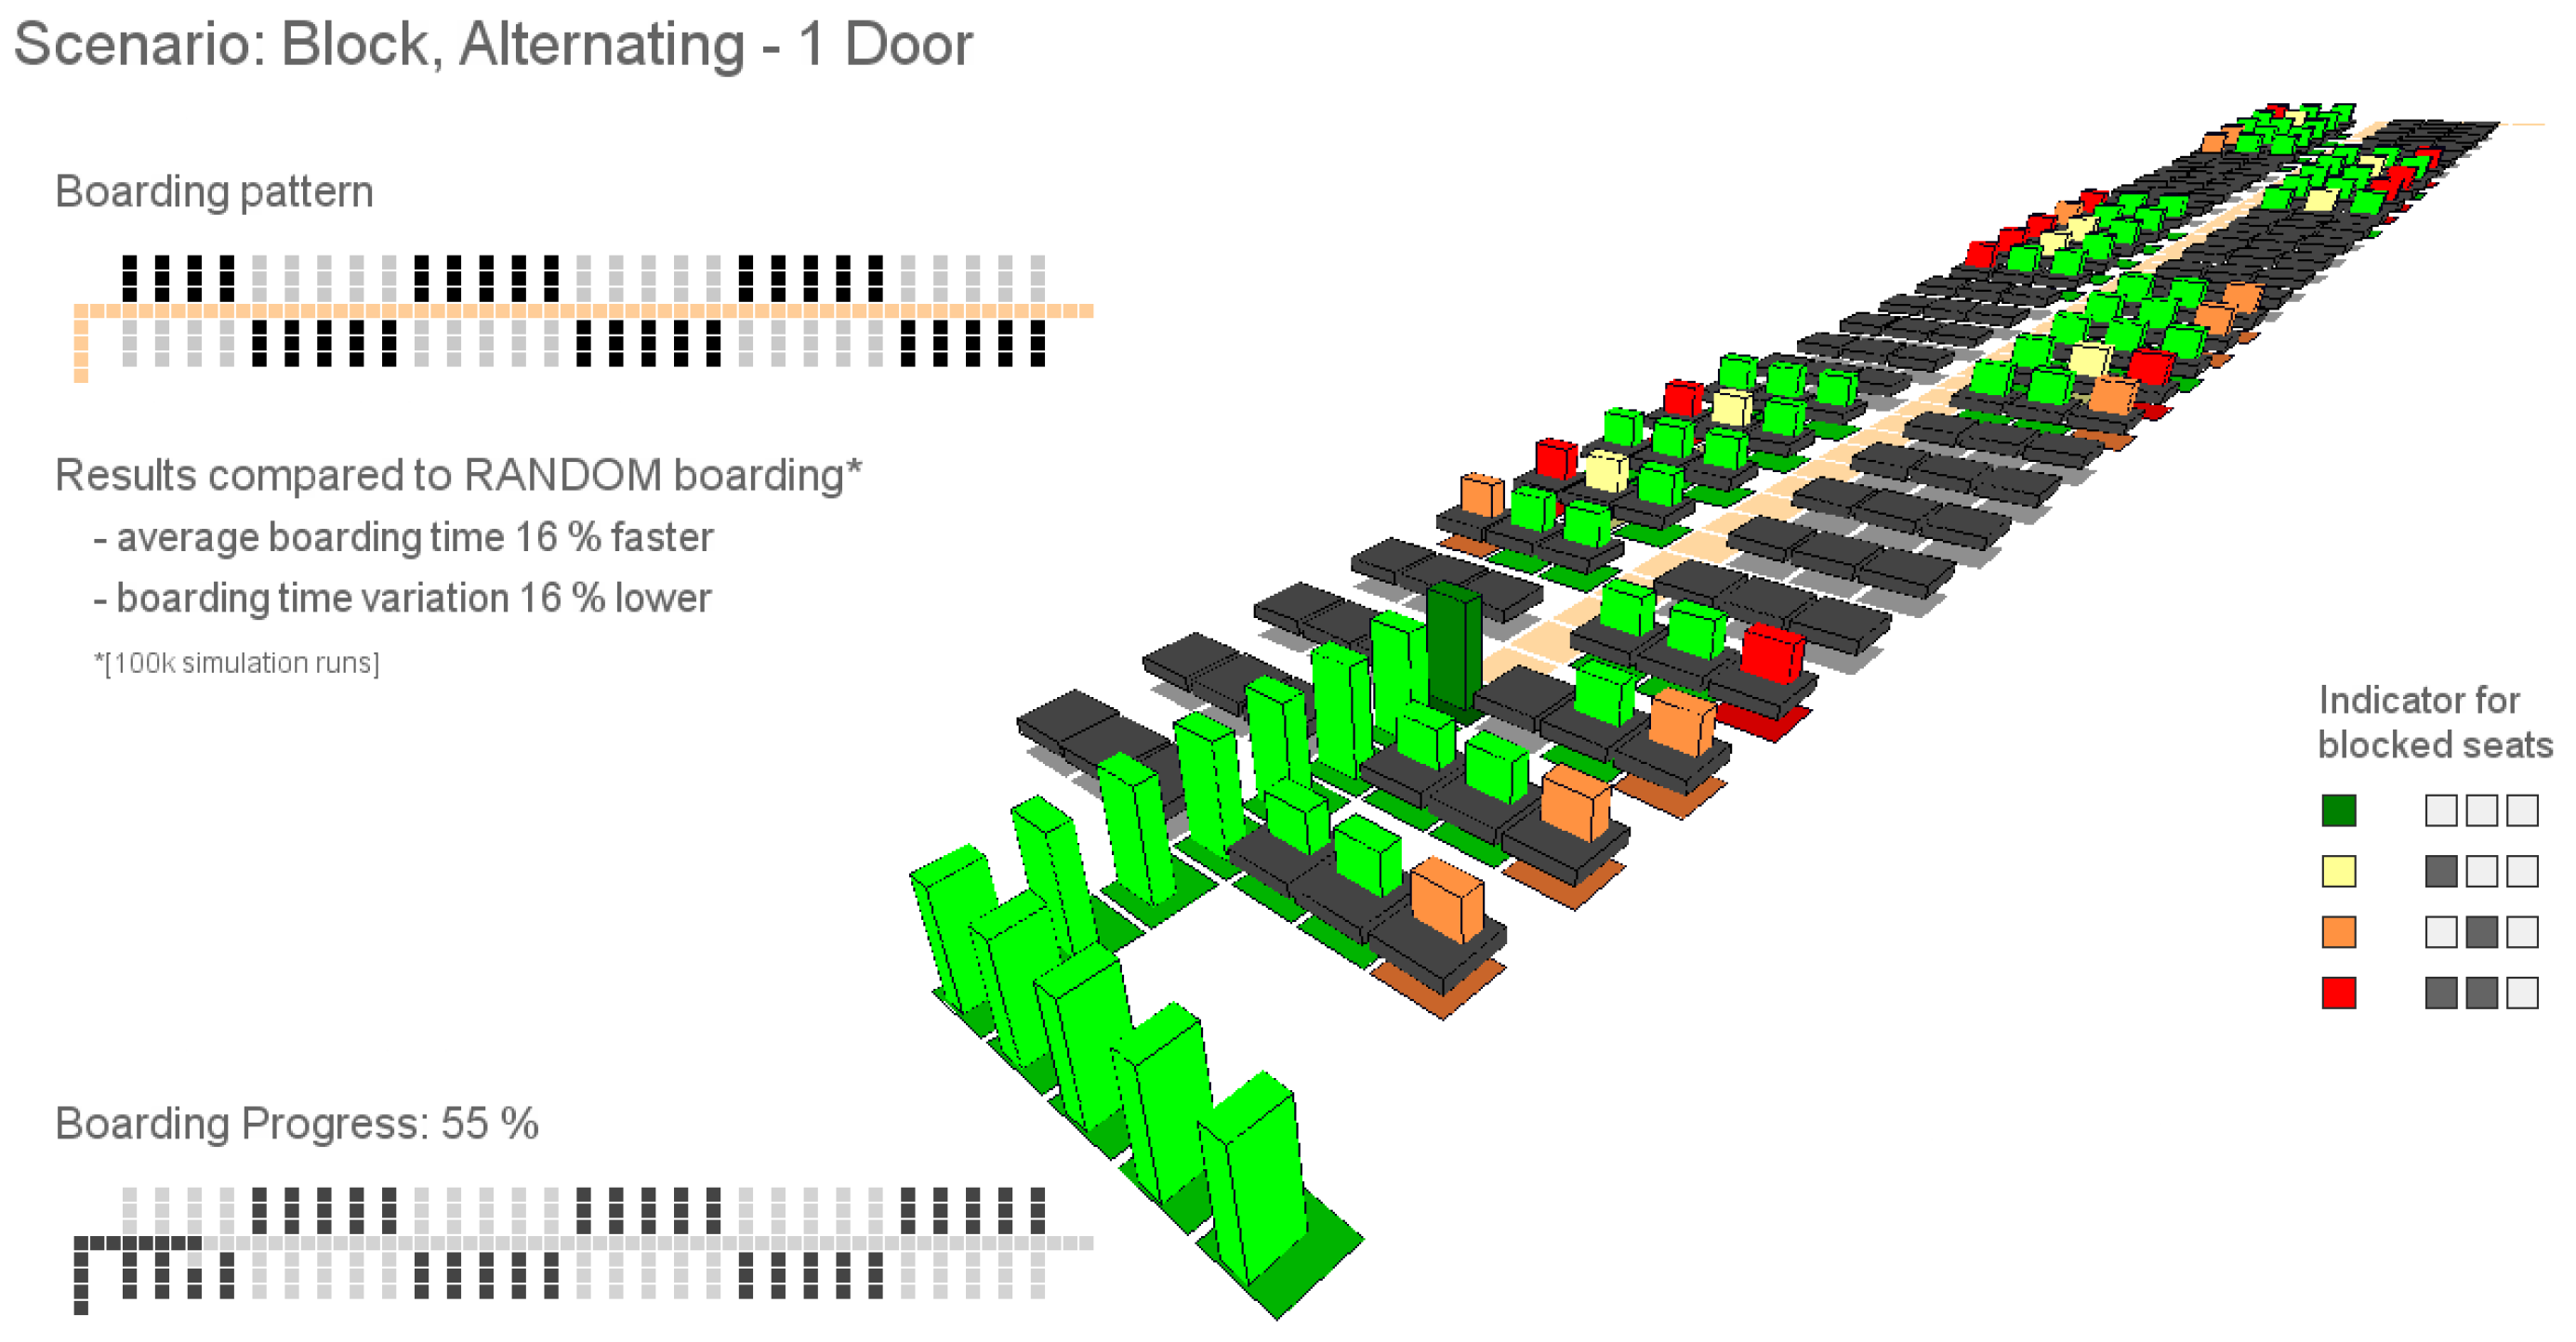
Visualization of the boarding process, using an alternating (half) block strategy as an example and indicating the interaction during the seating process (color coded).
Figure 10.
Visualization of the boarding process, using an alternating (half) block strategy as an example and indicating the interaction during the seating process (color coded).

Figure 11.
Boarding time of different boarding strategies with increasing conformance rate.

Figure 12.
Boarding time of different boarding strategies with decreasing hand luggage items.

Figure 13.
Boarding time difference considering four exemplary group constellations.

Figure 14.
Side-Slip Seat provides a wider aisle for boarding: seat in initial condition (left) and unfolded operational condition (right) [54].
Figure 14.
Side-Slip Seat provides a wider aisle for boarding: seat in initial condition (left) and unfolded operational condition (right) [54].

Figure 15.
Evolution of boarding sequence from random sequence to a left/right sequence.

Figure 16.
Evaluation of boarding time distribution during the aircraft boarding based on boarding progress of 0%, 50%, and 80%.
Figure 16.
Evaluation of boarding time distribution during the aircraft boarding based on boarding progress of 0%, 50%, and 80%.

Figure 17.
Boarding time distribution with unknown and known arrival sequence of passengers.

Figure 18.
Different progress indicators for both slow and fast boarding: seat load and interference potential.
Figure 18.
Different progress indicators for both slow and fast boarding: seat load and interference potential.

Figure 19.
Seat sensors in a field trial environment.

Figure 20.
Feedback from the floor sensors indicating walking speeds and passenger queues in the aircraft cabin.
Figure 20.
Feedback from the floor sensors indicating walking speeds and passenger queues in the aircraft cabin.

© 2018 by the author. Licensee MDPI, Basel, Switzerland. This article is an open access article distributed under the terms and conditions of the Creative Commons Attribution (CC BY) license (http://creativecommons.org/licenses/by/4.0/).
Share and Cite
MDPI and ACS Style
Schultz, M. Fast Aircraft Turnaround Enabled by Reliable Passenger Boarding. Aerospace 2018, 5, 8. https://doi.org/10.3390/aerospace5010008
AMA Style
Schultz M. Fast Aircraft Turnaround Enabled by Reliable Passenger Boarding. Aerospace. 2018; 5(1):8. https://doi.org/10.3390/aerospace5010008
Chicago/Turabian StyleSchultz, Michael. 2018. "Fast Aircraft Turnaround Enabled by Reliable Passenger Boarding" Aerospace 5, no. 1: 8. https://doi.org/10.3390/aerospace5010008
Note that from the first issue of 2016, this journal uses article numbers instead of page numbers. See further details here.