

Predictive Analysis of Airport Safety Performance: Case Study of Split Airport


1
Faculty of Transport and Traffic Sciences, University of Zagreb, 10000 Zagreb, Croatia
2
Croatian Academy of Sciences and Arts, Traffic Institute, 10000 Zagreb, Croatia
*
Author to whom correspondence should be addressed.
Aerospace 2023, 10(3), 303; https://doi.org/10.3390/aerospace10030303
Submission received: 14 February 2023
/
Revised: 14 March 2023
/
Accepted: 15 March 2023
/
Published: 17 March 2023
(This article belongs to the Collection Air Transportation—Operations and Management)
Abstract
:A predictive safety management methodology implies steps and tools of predictive safety management in aviation, i.e., use of predictive (forecasting) and causal modeling methods to identify potential and possible hazards in the future, as well as their causal factors which can help define timely and efficient mitigation measures to prevent or restrain emerging hazards turning into adverse events. The focus of this paper is to show how predictive analysis of an organization’s safety performance can be conducted, on the sample airport. A case study regarding implementation of predictive analysis of an organization’s safety performance, was performed at Split Airport. The predictive analysis of an airport’s safety performance was conducted through the analysis of Split Airport safety database, causal modeling of Split Airport organizational and safety performance indicators, outlier root cause analysis of Split Airport safety performance indicators, predictive analysis of safety performance (forecasting of Split Airport organizational and safety performance indicators), and scenario cases that simulate future behavior of Split Airport safety performance indicators. Based on detected future hazards, and their causal factors, the appropriate mitigation measures are proposed for the purpose of improving and maintaining an acceptable level of safety at the airport.
1. Introduction
A Safety Management System (SMS) is a crucial mechanism to maintain and continuously improve safety levels in aviation organizations. The International Civil Aviation Organization (ICAO) developed a framework of efficient aviation safety management which is nowadays a regulatory obligation of every aviation organization [1,2]. ICAO SMS framework includes four main components, i.e., safety policy and objectives, safety risk management, safety assurance, and safety promotion [1,2,3,4]. Those components include twelve elements that form an efficient SMS: management commitment, safety accountability and responsibilities, appointment of key safety personnel, coordination of emergency response planning, SMS documentation, hazard identification, safety risk assessment and mitigation, safety performance monitoring and measurement, management of change, continuous improvement of the SMS, training and education, and safety communication. SMS is a management system that must be fully integrated into the everyday operations of every aviation organization [2,5,6].
Hazard identification represents one of the most important elements of any properly functional SMS, as it identifies hazards in the organization. Hazard identification uses sources and tools to successfully identify hazards. Tools to collect data and information in order to identify hazards are called safety management methodologies [2]. ICAO defines two types of safety management methodologies, i.e., reactive, and proactive. The third safety management methodology is called “predictive”, but it exists only conceptually, i.e., it is not yet well established. However, a proactive methodology has been developed in this segment of aviation safety management, and it uses safety reporting systems, safety oversight and safety performance indicators/targets to gather safety information continuously, to detect and mitigate the potential threats that may consequently trigger the occurrence of an accident or an incident. A proactive methodology introduces system defenses, to address potential safety issues through regulations, technology, and training, respectively. Recent studies have observed that a predictive methodology acts as an upgrade to a proactive methodology.
Previous research, with the focus on developing a predictive safety management methodology, via reactive and proactive approaches, has revealed new insights and possibilities [3,4,7,8,9,10,11,12,13,14,15,16,17,18,19,20,21,22]. A detailed chronological overview of the literature is presented in Section 2.
A predictive methodology in the current form uses real-time analytics softwares to analyze large amounts of flight data to detect emerging hazards, but it does not include predictive (forecasting) methods in the process. On the other hand, predictive (forecasting) methods are used in the aviation industry, mostly for planning purposes for future capacity or traffic demand but not in the segment of aviation safety management.
The authors of [21,22], developed a conceptual model of predictive safety management methodology, and defined the steps and tools of predictive safety management, i.e., use of predictive (forecasting) [18] and causal modeling methods [20] to identify potential and possible hazards in the future, as well as their causal factors which can help define timely and efficient mitigation measures to prevent or restrain emerging hazards turning into adverse events.
The scientific contribution of this research is reflected in the development of a predictive safety management methodology, and implementation of the same methodology to conduct a predictive analysis of airport safety performance on the sample airport, i.e., Split Airport. The methodology described in the paper can be adopted in any airport, i.e., it can be adopted in any organization. The forecasts of future events and the temporal causal model presented in the paper, are generated for the specific set of indicators monitored and recorded at Split Airport, but it can be generated for any other airport, using their own set of indicators.
2. Literature Overview
This part gives the chronological literature overview of research regarding prediction and causation, relevant to the predictive safety management.
Granger causality and its variations are among the most popular approaches to causal time series analysis [23]. It infers that X influences Y whenever the past values of X help in predicting Y from its own past [24,25].
In 1990, Apostolakis introduced a concept of probability in safety assessments of technological systems and stated how safety assessments of technological systems require the investigation of the occurrence and consequences of rare events [26].
Wu and others [27] explained the theory of evidence and the theory of possibility as possible alternatives to probability theory in the safety analyses of engineering systems.
Senders and Moray examine the nature of human error, i.e., its causes and origins, its classifications, and the extent to which it is possible to predict and prevent errors and their impact [28].
Pisanich and Corker [7] described a model for predicting pilot performance in interaction with varied levels of automation inflight management operations.
Spirtes and others [29] addressed questions of what assumptions and methods allow observations to be turned into causal knowledge, and how even incomplete causal knowledge can be used in planning and prediction to influence and control the environment. According to [29], causation is considered to be a relation between particular events; something happens and causes something else to happen. Each cause is a particular event, and each effect is a particular event.
In 2001, Sarasvathy stated that causation lies on a logic of prediction, effectuation on the logic of control and illustrated effectuation through business examples and realistic thought experiments, with examination of its connections with existing theories and empirical evidence [30].
In 2002, NASA issued the Probabilistic Risk Assessment Procedures Guide for NASA Managers and Practitioners, after the Challenger accident in 1986, and once again became a strong proponent of Probabilistic Risk Assessment (PRA), strengthening its position as a powerful tool for the prediction of risk where a system or systems are highly variable [8].
In 2003, Ghobbar and Friend devised a new approach to forecasting evaluation, a model which compares and evaluates forecasting methods based on their factor levels when faced with intermittent demand [9].
In 2004, Cartwright stated that causation is not a single, monolithic concept, and that there are different kinds of causal relations embedded in different kinds of systems, described using thick causal concepts [31].
Sloman [32] described how people conceive of the relation between cause and effect, and action and outcome. The causal framework starts with the idea that the purpose of causal structure is to understand and predict the effects of intervention.
Longworth described counterfactual theories of causation and Hall’s theory [33] that deals with cases of causation by omission, which have proved stubborn counterexamples to physical process theories of causation [34].
In 2006, Luxhøj and Coit presented an overview of a model that assessed the impact of new technology insertions or products designed to mitigate the likelihood or consequence of aviation accidents. The Aviation System Risk Model (ASRM), developed with joint support from the National Aeronautics and Space Administration (NASA) and the Federal Aviation Administration (FAA), was an example of a model devoted to classifying “low probability/high consequence” events [35].
Liou conducted [36] research to better understand the role that human factors play in major aviation accidents. A method for building an effective safety management system for airlines was developed that incorporated organization and management factors. It combined both fuzzy logic and the Decision-Making Trial and Evaluation Laboratory (DEMATEL). This method can map out the structural relations among diverse factors in a complex system and identify the key factors.
Roelen was one of the first authors who tried to explain how causal models could be used for controlling and managing aircraft accident risk and described the aviation system as a prime example of a complex multi-actor system. He stated how one of the main reasons to be interested in causation is because it allows for predicting system behavior if it is assumed that the past and present determine the future. Therefore, if observed in the past, certain causes have certain effects that can be assumed to be the same causes that would have the same effects in the future [37].
Shmueli [38] suggested that prediction is concerned with being able to know outcomes that have not yet been observed. Shmueli also explained how statistical modeling is a powerful tool for developing and testing theories by using causal explanation, prediction, and description.
In 2011, Du and Qin described a time-series extrapolation analysis model for short-term prediction of flight accidents in American general aviation [10] and Valdés and others [39] proposed risk models for runway overrun and landing undershoot, using a probabilistic approach. These models are supported with historical data on accidents in the area around the runway and will determine whether the risk level is acceptable or whether action must be taken to mitigate such risks at a given airport.
Buehner described temporal binding as a subjective shortening of elapsed time between actions and their resultant consequences. The research suggested that intentional action is not necessary for temporal binding and that it results from the causal relation linking actions with their consequences [40].
In 2013, Duanmu and others described theoretical methods of aviation accident forecasting, as well as early warning and prevention [11].
Button and Yuan examined the potential role that air freight transport can play in stimulating local and regional economic development. The focus was on causality, and not on simple correlation [41].
Van De Vijver and others explored the potential of Granger analysis in transport geography research by applying this method to a specific case of complex and potentially reciprocal linkages between the deployment of transport infrastructures and spatial economic development [42].
Roelen and others [12] conducted a study on an integrated approach to risk modeling in which the total aviation system, human factors and cultural aspects were considered in connection with technical and procedural aspects and with emphasis on representation of emerging and future risks.
In 2015, Di Gravio and others conducted research with the aim of building a statistical model of safety events in order to predict safety performance. They concluded that through the analysis of the possible scenarios, assessing their impact on equipment, procedures, and human factors, proposed model can address the interventions of the decision maker [13].
Peters and others [43] explained the difference between a prediction that is made with a causal model and a non-causal model. The predictions from a causal model will in general work as well under interventions as for observational data. In contrast, predictions from a non-causal model can potentially be very wrong if we actively intervene on variables.
To understand the importance of the key factors causing growth in air transport, Küçükönala and Sedefoğlu [44] used Granger causality analysis in order to see whether there is a causal relationship or not among air transport, tourism, economic growth and employment.
Pacheco and Fernandes explored the relations between international trade-related factors and international air passenger movement in Brazil, using the Granger causality methodology [45].
Peters and others in 2017, stated that probability theory and statistics are based on the model of a random experiment or probability space. Probability theory allows reasoning about the outcomes of random experiments, given the preceding mathematical structure. A causal structure entails a probability model, but it contains additional information not contained in a probability model, allowing the analysis of the effect of interventions or changes [46].
In 2018, Grant and others, stated that the prediction of accidents, or systems failure, should be driven by an appropriate accident causation model. Whilst various models exist, none is yet universally accepted, but there are elements of different models. They presented the findings from a review of the most frequently cited system-based accident causation models to extract a common set of systems-thinking tenets that could support the prediction of accidents [14].
Heinze-Deml and others stated that causal models can be viewed as a special class of graphical model that represent not only the distribution of the observed system but also the distributions under external interventions; hence enabling predictions under hypothetical interventions, which is important for decision making [47]. Heinze-Deml and others also emphasized how an important problem in many domains is to predict how a system will respond to interventions [48].
Rohrer discussed causal inference based on observational data, introducing graphical causal models that can provide a powerful tool for thinking more clearly about the interrelations between variables [49].
Singh and others analyzed the moderating effects of the multi-group in the relationship among safety management system (SMS), human factors (HF) and civil aviation safety (CAS) performance to highlight the impact of safety climate factors on the safety performance [50].
In 2019, Xu and others proposed a novel SARIMA-SVR model to forecast statistical indicators in the aviation industry that might be used for later capacity management and planning purpose. The results suggested that it achieved better accuracy than other methods and proved that incorporating Gaussian White Noise increases forecasting accuracy [15].
Based on the highest density domain (HDR) analysis, Ben and others proposed a new algorithm to predict aviation safety in an uncertain framework [16].
Insua and others stated how, in most cases, organizations use unsophisticated methods based on risk matrices for the development of aviation safety management systems and presented models to forecast and assess the consequences of aviation safety occurrences as part of a framework for aviation safety risk management at state level [17].
Zheqi and others carried out forecasting of aviation safety probability based on the uncertainty of a neural network point forecasting value [51].
In summary, based on a thorough literature overview of previous research from the last decade, and analysis of basic methodologies in aviation safety management, it can be seen that various improvements have been made regarding aviation safety management. Various studies have been conducted regarding approaches to causal time series analysis, and they include: various accident causation models; theory of evidence; probability theory in safety analyses of engineering systems; examinations of human error and its causal impacts; various interpretations of causation and prediction and relations between them; development of various probabilistic risk assessment models; identification of factors impacting safety performance and establishment of safety performance indicators; theoretical methods of aviation accident forecasting; statistical models of safety events in order to predict safety performance, models of forecasting statistical indicators; forecasting of aviation safety probability, etc. The proposed research presented in this paper includes both predictive (forecasting) methods to predict adverse events in an organization, as well as causal modeling methods which complement forecasting methods, by detecting causal factors of predicted events, which in turn provides an addition information to senior management regarding necessary mitigation measures needed to be done in order to prevent predicted adverse events from happening.
3. Data and Methods
This paper presents how predictive and causal modeling methods, i.e., predictive analysis can be conducted to analyze an airport’s safety performance. In order to conduct such an analysis, airport safety performance data are necessary. Safety performance data were collected from Split Airport, to perform predictive analysis of its safety performance.
3.1. Methods Used for Predictive Analysis of Split Airport Safety Performance
The aim of the research is to detect causal links among organizational and safety performance indicators from the sample airport. It is possible to improve safety management processes in aviation organizations, i.e., its safety performance, by identifying causal links and factors, and using predictive methods to forecast future events [22].
As explained in [22], the IBM SPSS Statistics 27 is a statistical and predictive analytics software that can be used to analyze all data in the observed datasets, to create optimal forecasting models and obtain forecasts, as well as to generate a causal model with causal links among all variables in the observed dataset. IBM SPSS Statistics 27 was used in this paper.
In [22], available examples of predicting methods used in various aviation sectors (air navigation services, airport operations, airline operations) were examined, and nine methods were tested as appropriate for aviation safety management: Holt’s linear trend, Brown’s linear trend, damped trend, simple exponential smoothing, simple seasonal exponential smoothing, Winter’s additive method, Winter’s multiplicative method, moving average method, and ARIMA modeling.
The predictive methods used in this study were chosen according to their applicability to the case in question, i.e., Split Airport, which has a strong seasonal component (it is busiest during the summer months, i.e., tourist season). The chosen methods are a simple seasonal exponential smoothing, a moving average method, and ARIMA modeling. The mathematical representation of each predictive methods can be found in [52], which explains each formula. Each method is available in IBM SPSS Statistics 27 software, through functions called Forecasting–Expert Modeler, and Forecasting using Temporal Causal Model via a function called the Apply Temporal Causal Model.
A causal model can be generated once the dataset is prepared correctly, using the function called Create Temporal Causal Model. The Temporal Causal Model (TCM) detects causal links among all indicators (variables) in the observed dataset, in this case Split Airport, and presents them in a circular diagram or in impact diagrams.
3.2. Data Used for Predictive Analysis–Split Airport
The core business of Split Airport is to provide services for passengers, cargo, and aircraft handling for domestic and international air transport.
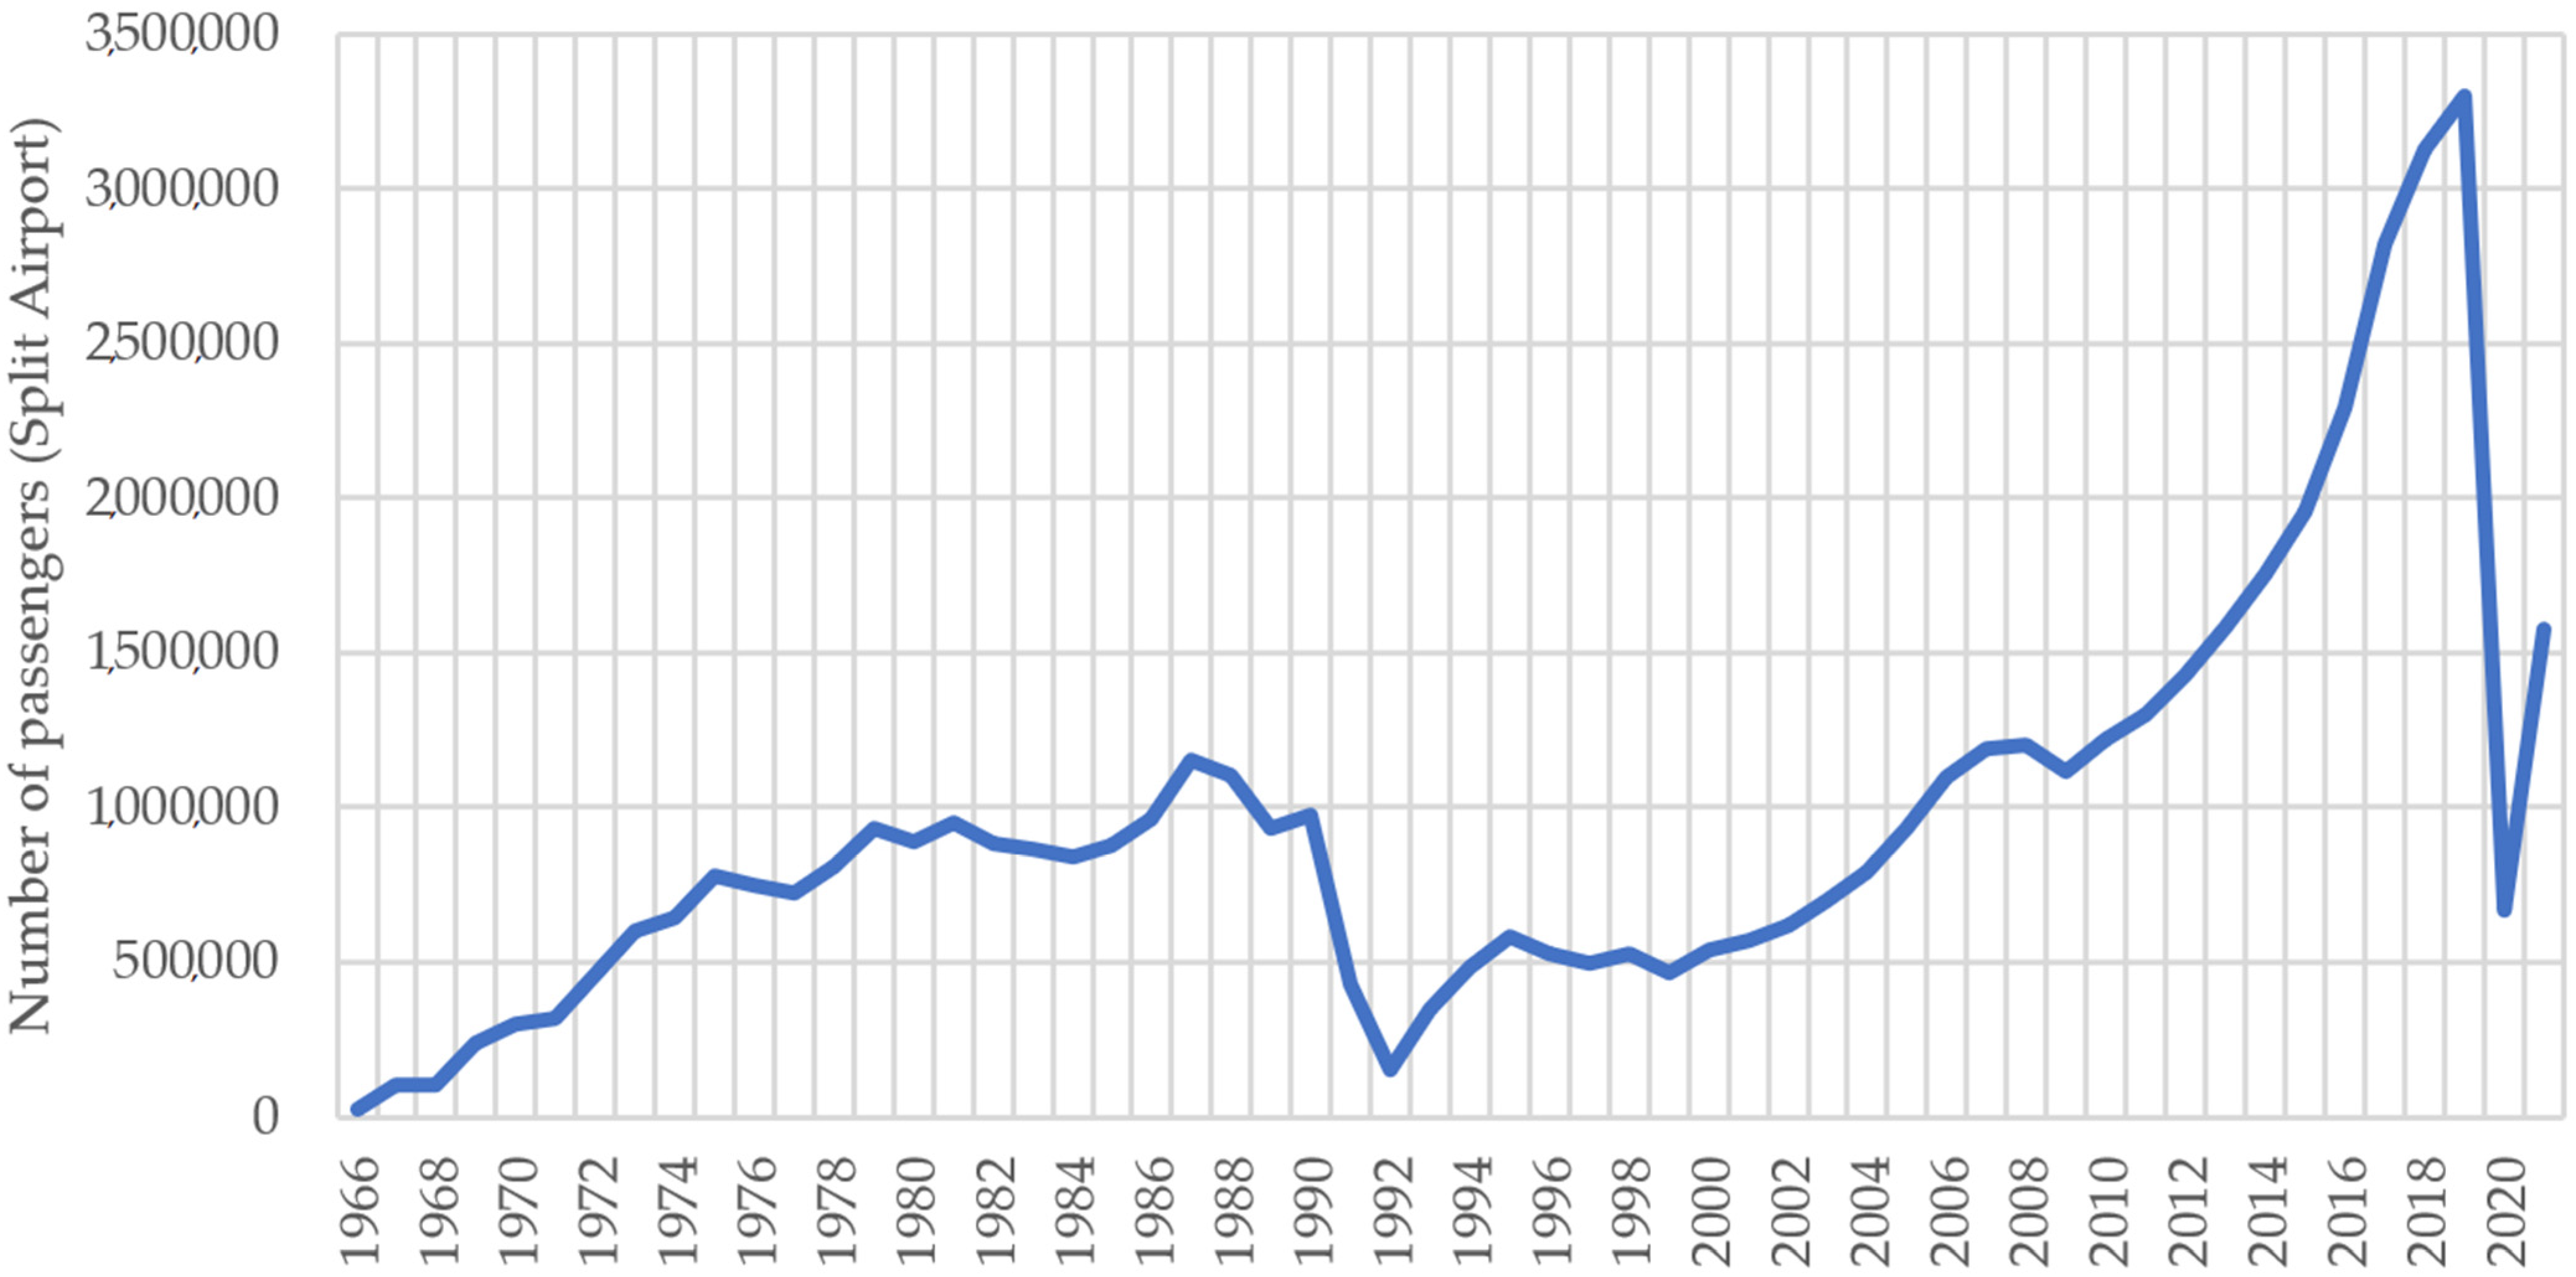
Split Airport is one of nine airports in Croatia. It is located in the Resnik area west of Kaštel Štafilić, 6 km from Trogir and 25 km from Split. The main elements of the airport infrastructure include maneuvering surfaces (runway (05/23), apron, etc.), passenger and cargo terminal, control tower, access roads, parking lots for buses and cars, and additional service and commercial facilities. Split Airport was opened on 15 November 1966. The number of passengers has grown year by year. This growth stopped in 1988 due to the economic crisis. In September 1991, the airport was closed due to the war, and in April 1992, it was reopened.
Recently, in 2020, the COVID-19 pandemic created a major setback for Split Airport traffic (Figure 1) due to the strict epidemiological measures [53].
The impact of COVID-19 on the aviation industry, from a global point of view, was major, resulting in ratings downgrades, liquidation and the bankruptcy of airlines and airports worldwide due to severe travel restrictions [54]. Even though the COVID-19 pandemic negatively impacted the aviation industry, the continuous growth of air traffic and the development of aviation systems is still anticipated in the near future.
Besides the impact of COVID-19, the war in Ukraine has also created a severe impacts on transport and trade, as it extends well beyond air travel to and from Ukraine; for example, airspace closures due to military activity and war-related sanctions have forced airlines to seek alternative routes, which extends travel times, increases fuel consumption and costs, etc. [55]. A long war will increase the impact on international aviation and make its recovery from the COVID-19 pandemic even more difficult [55].
As per the International Air Transport Association (IATA) [56], the recovery in air travel continued in 2022, with an increase of 64.4% in total traffic. Globally, air traffic in 2022 was at 68.5% of pre-pandemic (2019) levels, which shows a fast recovery and increasing trend from 2020 onwards. Hence, a full recovery of air traffic is expected in 2024 or 2025. It is also important to emphasize that, according to the latest air crash statistics [57], air crash fatalities increased in 2020, in comparison to previous years, despite the COVID-19 pandemic’s negative impact on the aviation industry and enormous decrease in the number of transported passengers during this period. Due to these observations, the existing safety management methodologies should be upgraded.
As per Split Airport, the traffic is recovering gradually (Figure 1), and in 2021 it reached 50% of the traffic accomplished 2019. In 2019, the airport was the second busiest in Croatia after Zagreb Airport, handling 3.3 million passengers. Split Airport was recorded as being the busiest airport in Croatia in 2021, handling 1.57 million passengers, and surpassing Zagreb Airport for the first time [53].
Due to the significant increase in passenger traffic, especially during the summer months, an expansion project was completed in summer of 2019, adding more than three times the floor space to the original terminal building, and increasing the capacity to five million passengers per year. The original terminal has been refurbished and is still being used for some international departures, while check in and all domestic departures as well as both international and domestic arrivals including baggage claim is located in the new areas. As a part of the expansion project, an enclosed bridge was built over the state road D409, taking passengers to the newly built parking lot, bus terminal and rental car facilities [53].
Split Airport holds high standards when it comes to safety and continuously seeks to improve its safety management. Applied safety management methodologies at Split Airport, in terms of gathering and processing safety data, are reactive and proactive. Split Airport uses sophisticated software to manage safety, i.e., Galiot Aero SMS 2.5.5. Galiot Aero SMS 2.5.5 provides strong and reliable proactive safety management at the airport.
A dataset of actual organizational and safety performance indicators at the airport, was used in this research. The dataset represents the safety data of Split Airport [53]. As a part of the Safety Assurance component, Split Airport has established a set of safety performance indicators (SPIs) and set-up accompanying safety performance targets (SPTs). SPIs are monitored on a monthly basis. The list of organizational indicators (OIs), safety performance indicators (SPIs) and safety performance targets (SPTs) for Split Airport SMS are presented in the following Table 1 [53].
A dataset is composed of monthly entries for two organizational indicators (OIs) and 25 safety performance indicators (SPIs). The values of achieved safety performance targets (SPTs) are also presented for each safety performance indicator. The observed period is from January 2014 until December 2021. The dataset contains 96 entries. All details can be found in the Appendix A.
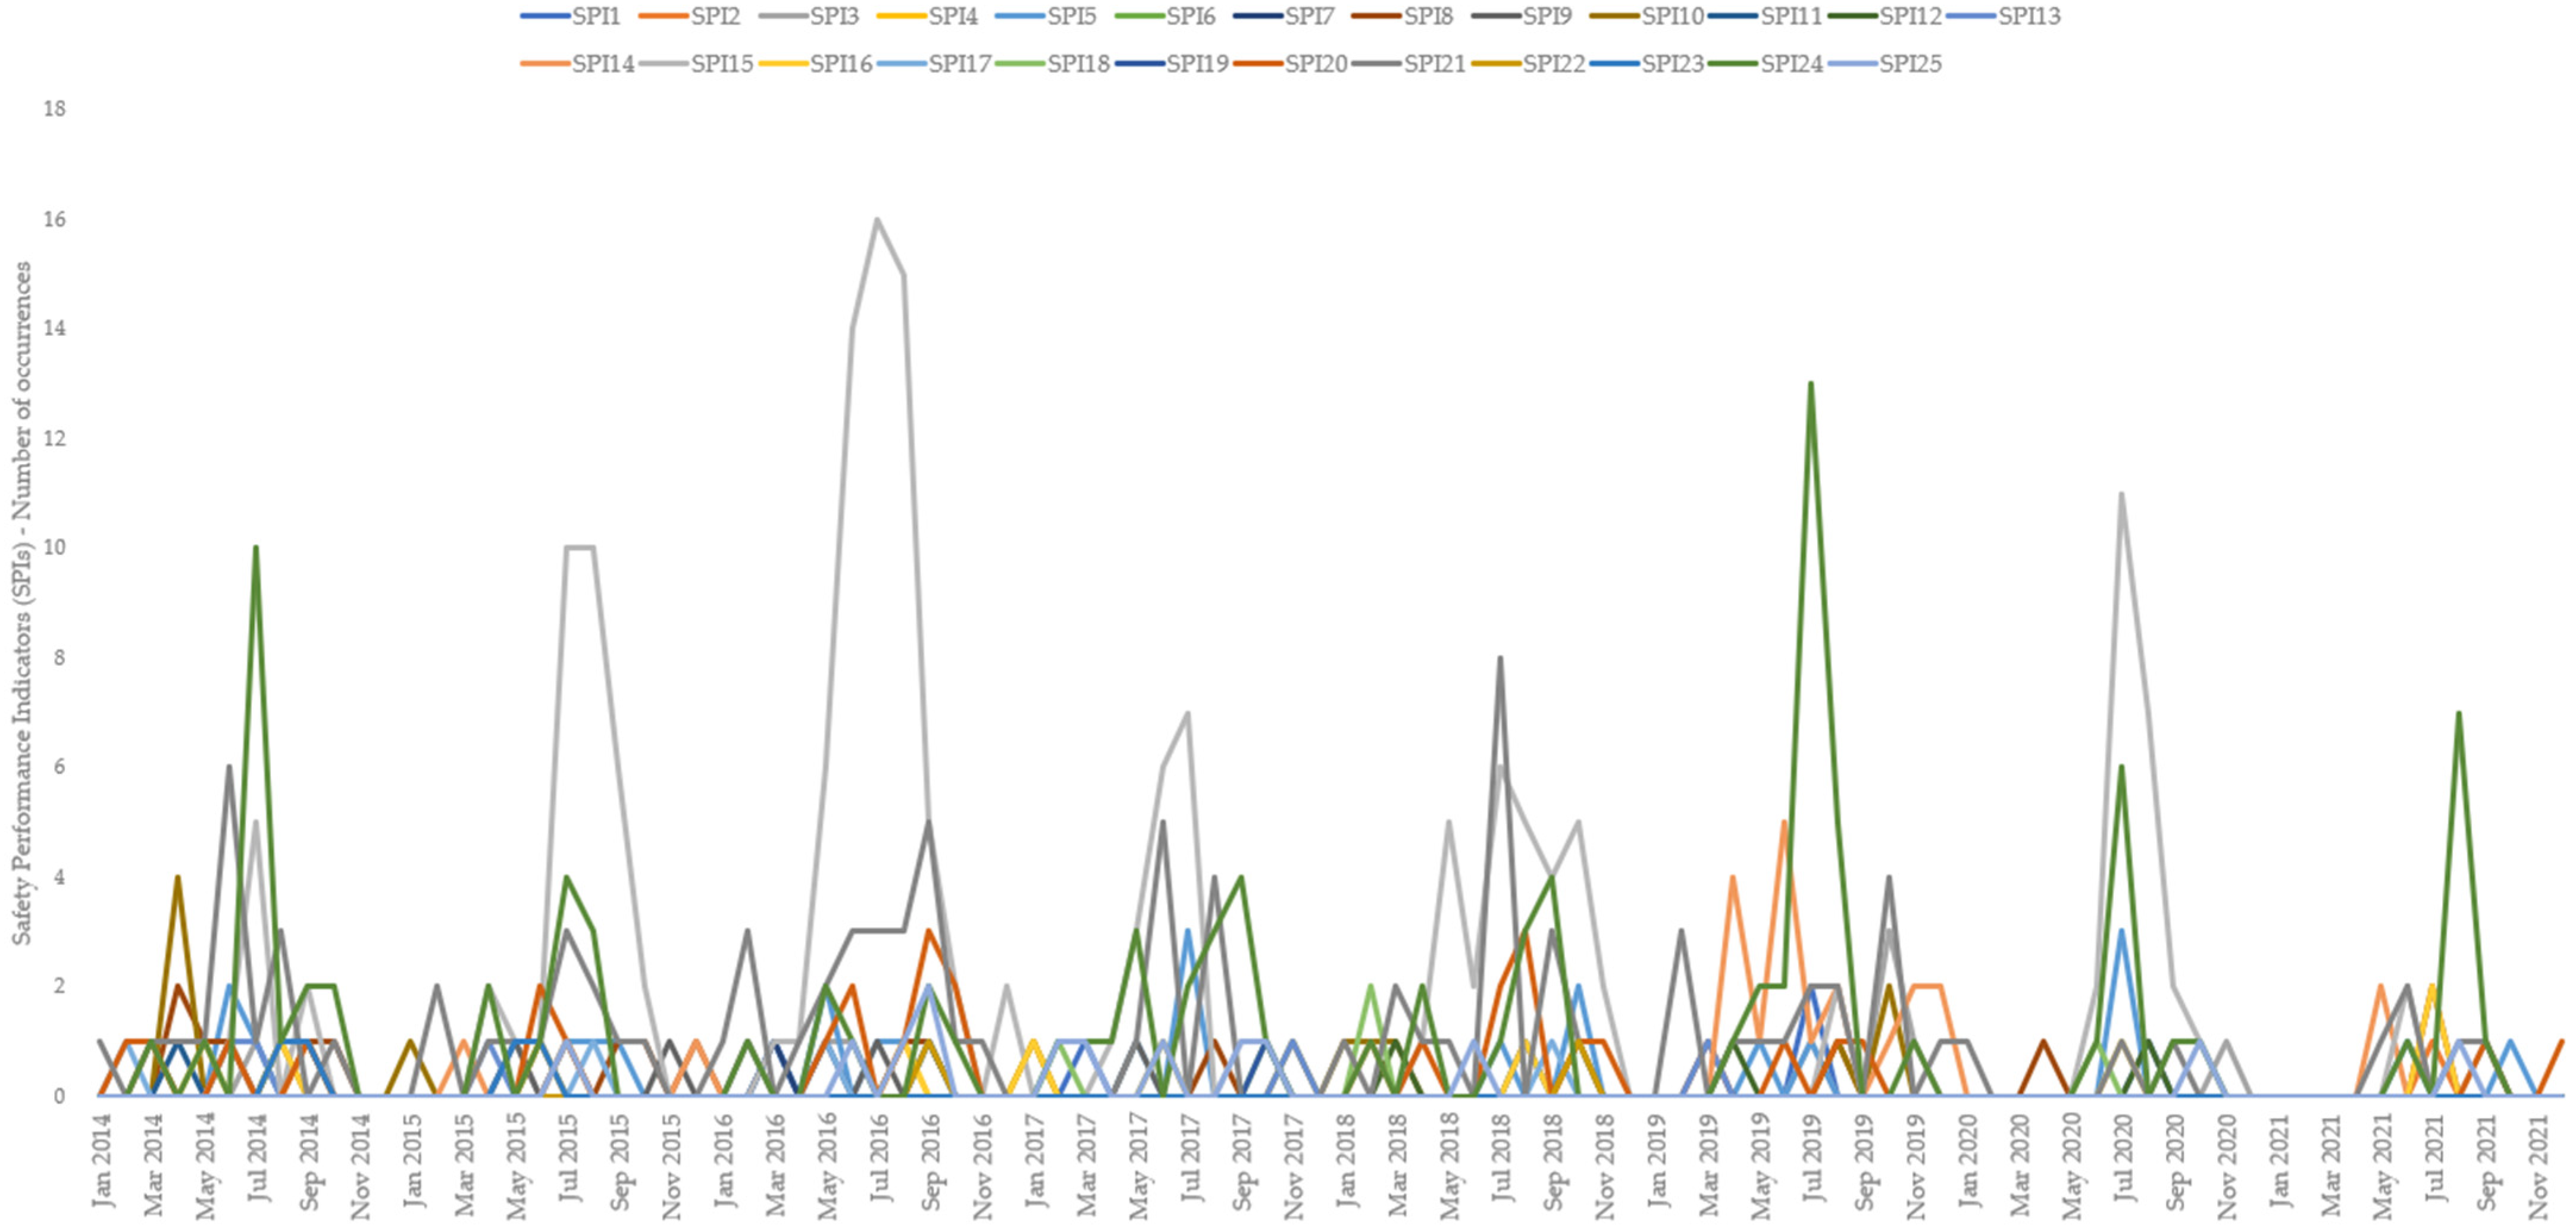
It can be observed that all SPIs are the number of occurrences (adverse events) in different segments of airport operations. Figure 2 shows which areas are most critical in the observed time period from January 2014 until December 2021, i.e., SPI15—Number of occurrences related to passenger handling at the gate (which even reached 16 occurrences per month in 2016); SPI21—Number of occurrences related to ground traffic (GSE) and vehicle driving (which reached eight occurrences per month in 2018) and; SPI24:Number of occurrences related to wildlife (which even reached 13 occurrences per month in 2019).
Predictive methods used to conduct the predictive analysis of the airport safety performance for Split Airport, include time series decomposition methods, i.e., a simple exponential smoothing method with a seasonal component, moving average method, and auto regression model that integrates the moving average (ARIMA).
Causal modeling methods were used to establish causal relations among organizational and safety performance indicators at Split Airport, using IBM SPSS Statistics 27 software and its Temporal Causal Modeling function. Temporal Causal Modeling was also used to predict the future behavior of safety performance indicators at Split Airport due to its causal links, i.e., to generate case scenarios.
Finally, based on predictive analysis of airport safety performance, mitigation measures were proposed in order to improve safety performance at Split Airport.
4. Results
This part presents the results of a predictive analysis Split Airport safety performance, including causal modeling of Split Airport organizational and safety performance indicators, outlier root cause analysis of Split Airport safety performance indicators, predictive analysis of safety performance, i.e., forecasting of Split Airport organizational and safety performance indicators, predictive analysis and causal modeling, i.e., scenario cases for Split Airport, and proposal of mitigation measures based on predictive analysis of airport’s safety performance.
4.1. Causal Model of Split Airport Organizational and Safety Performance Indicators
In this part, the aim is to establish a predictive causal model of defined organizational and safety performance indicators (SPIs) in order to present relations between organizational and safety performance indicators in an organization—in this case, the airport operator—Split Airport. Detecting relations between indicators indicates impacts (causes or effects) of indicators to one another, which in turn gives a possibility of improving the planning of future actions with enhanced forecasting (prediction) techniques that can improve safety performance at the airport.
To obtain impact relations between organizational and safety performance indicators, IBM SPSS function Temporal Causal Modeling was used. The set-up was made in such a way that independent variables are organizational indicators (OIs), i.e., OIs are set to be “inputs” in the temporal causal model, and safety performance indicators (SPIs) are dependent and independent variables, i.e., SPIs are set to be “both inputs and targets”. SPI6 model was excluded since the values were constant, i.e., equal to 0. Attachment B shows fit statistical details for the top causal models generated for each of Split Airport’s 24 safety performance indicators.
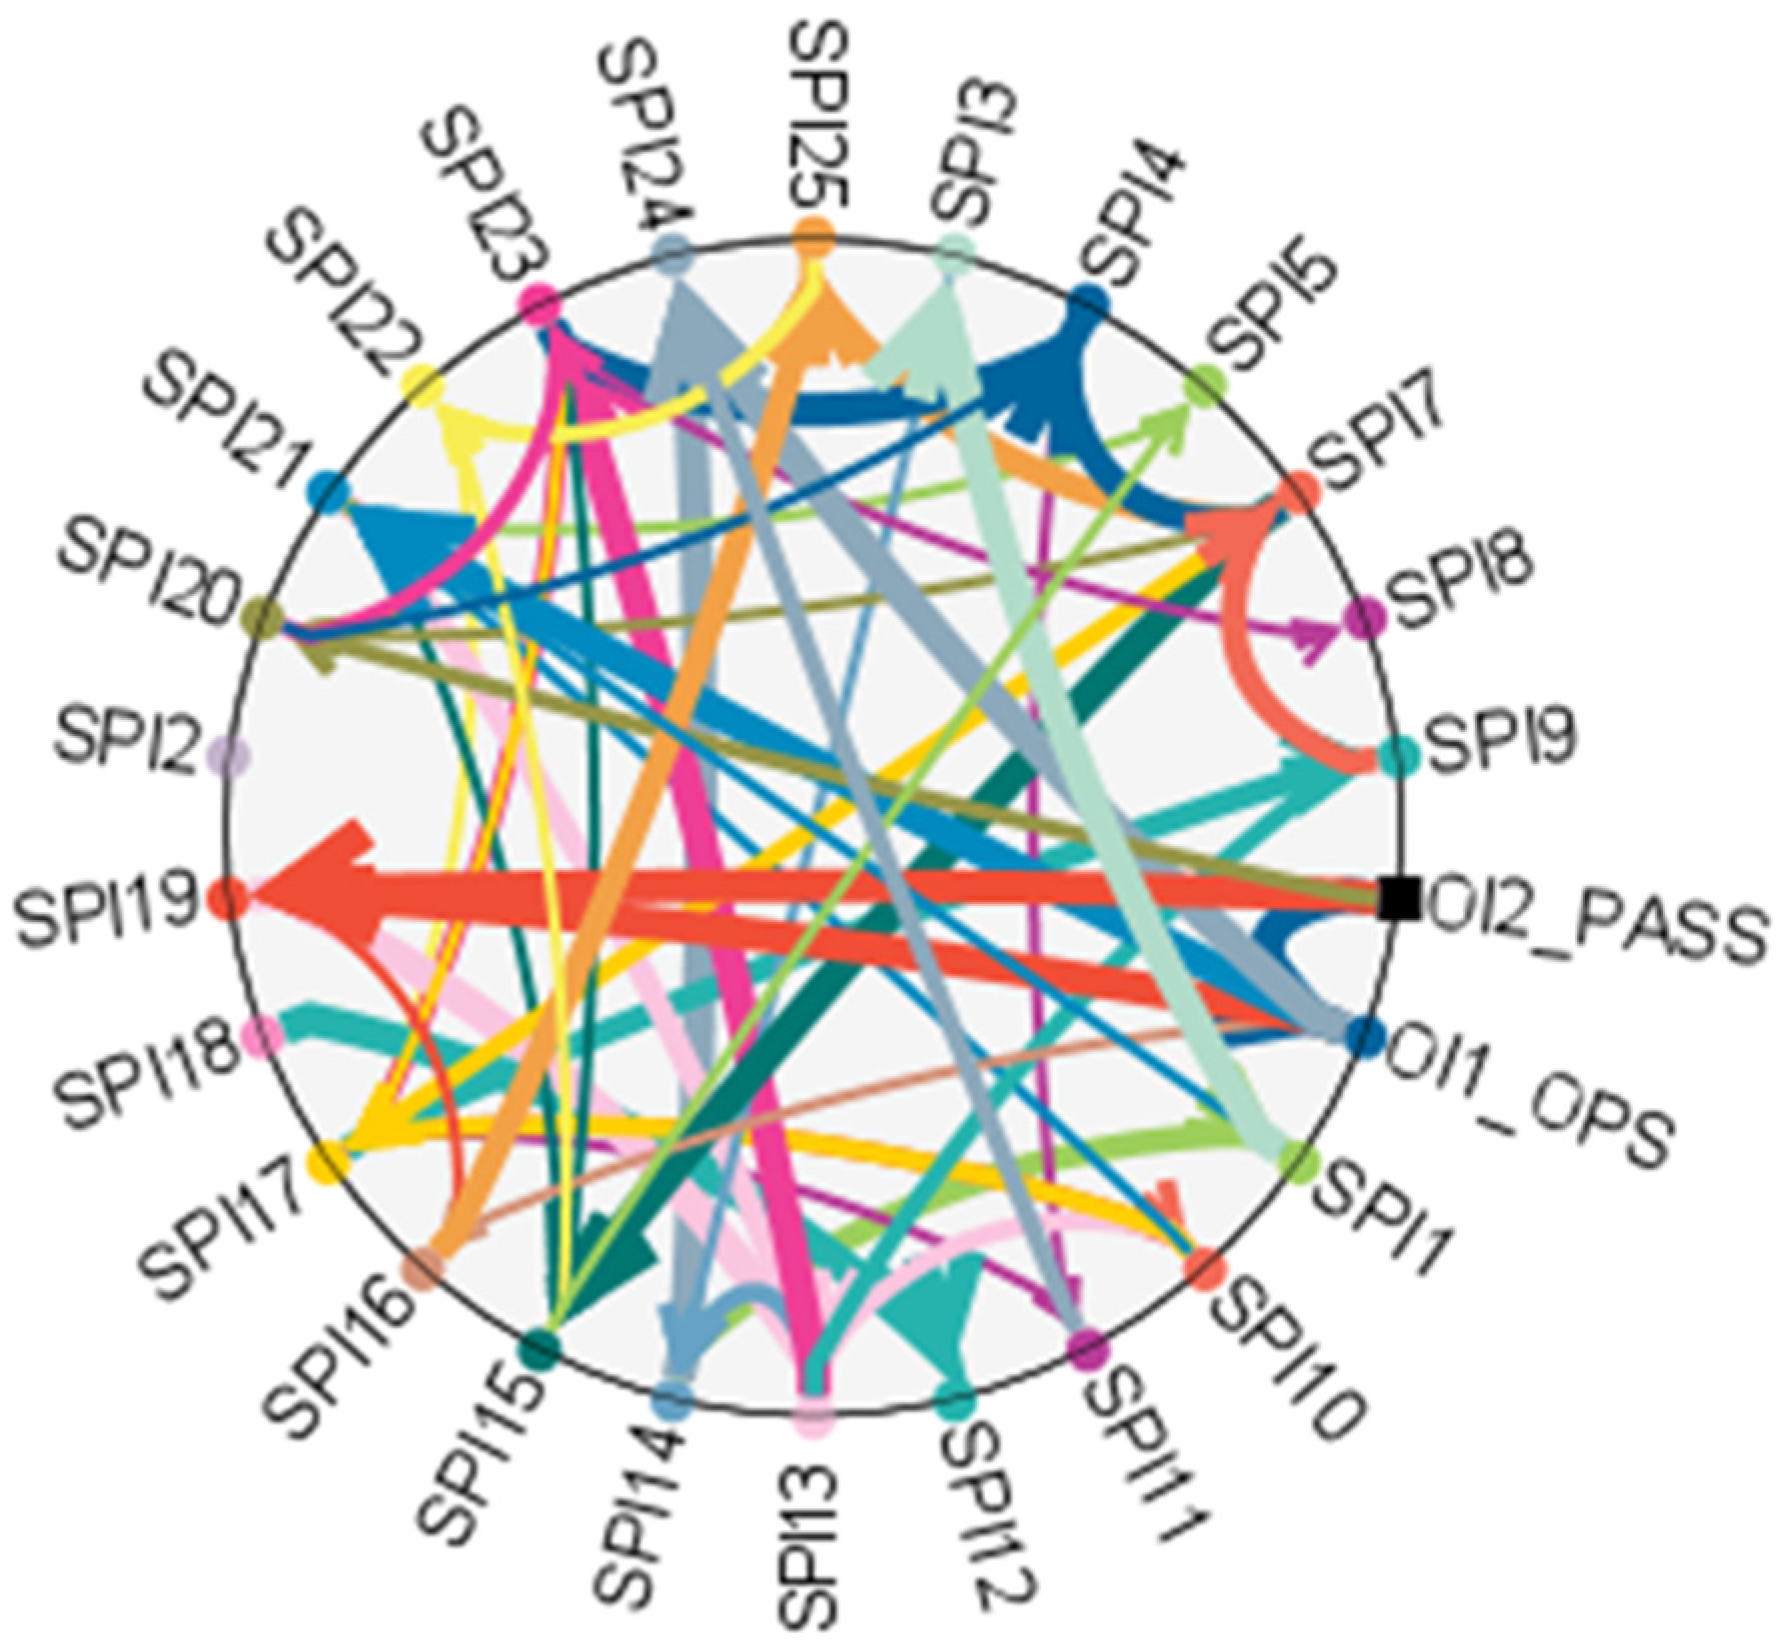
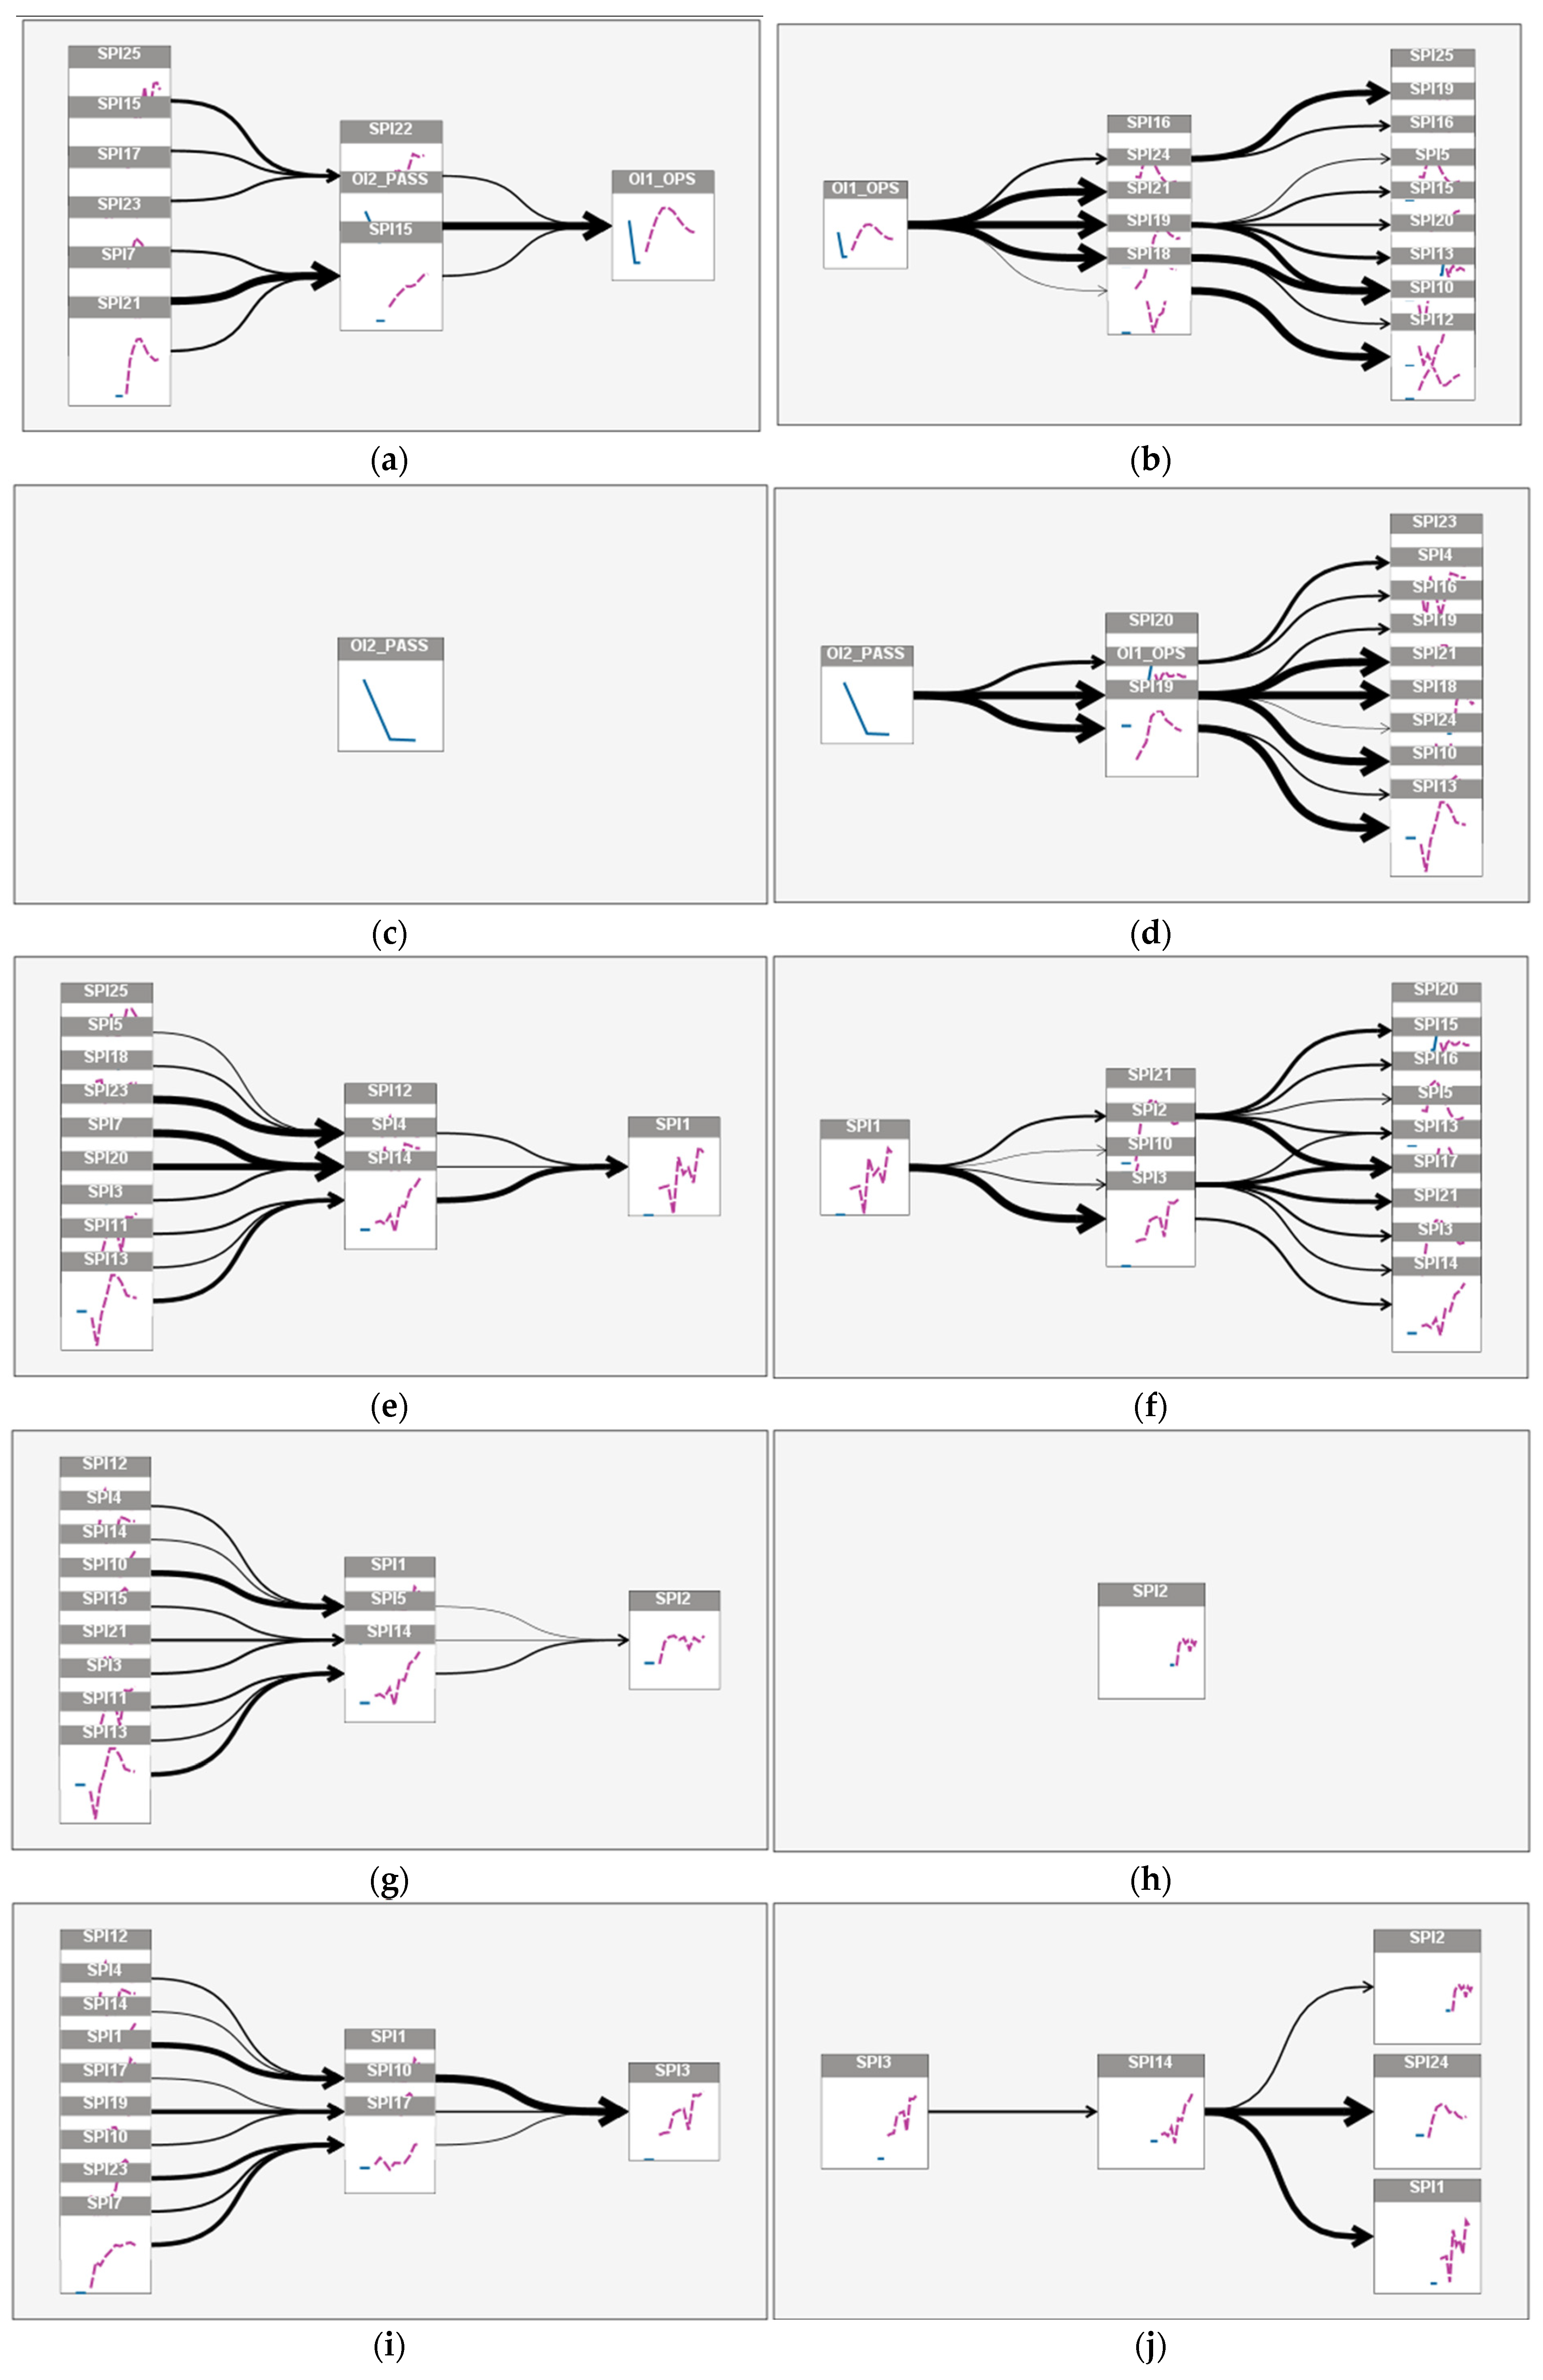
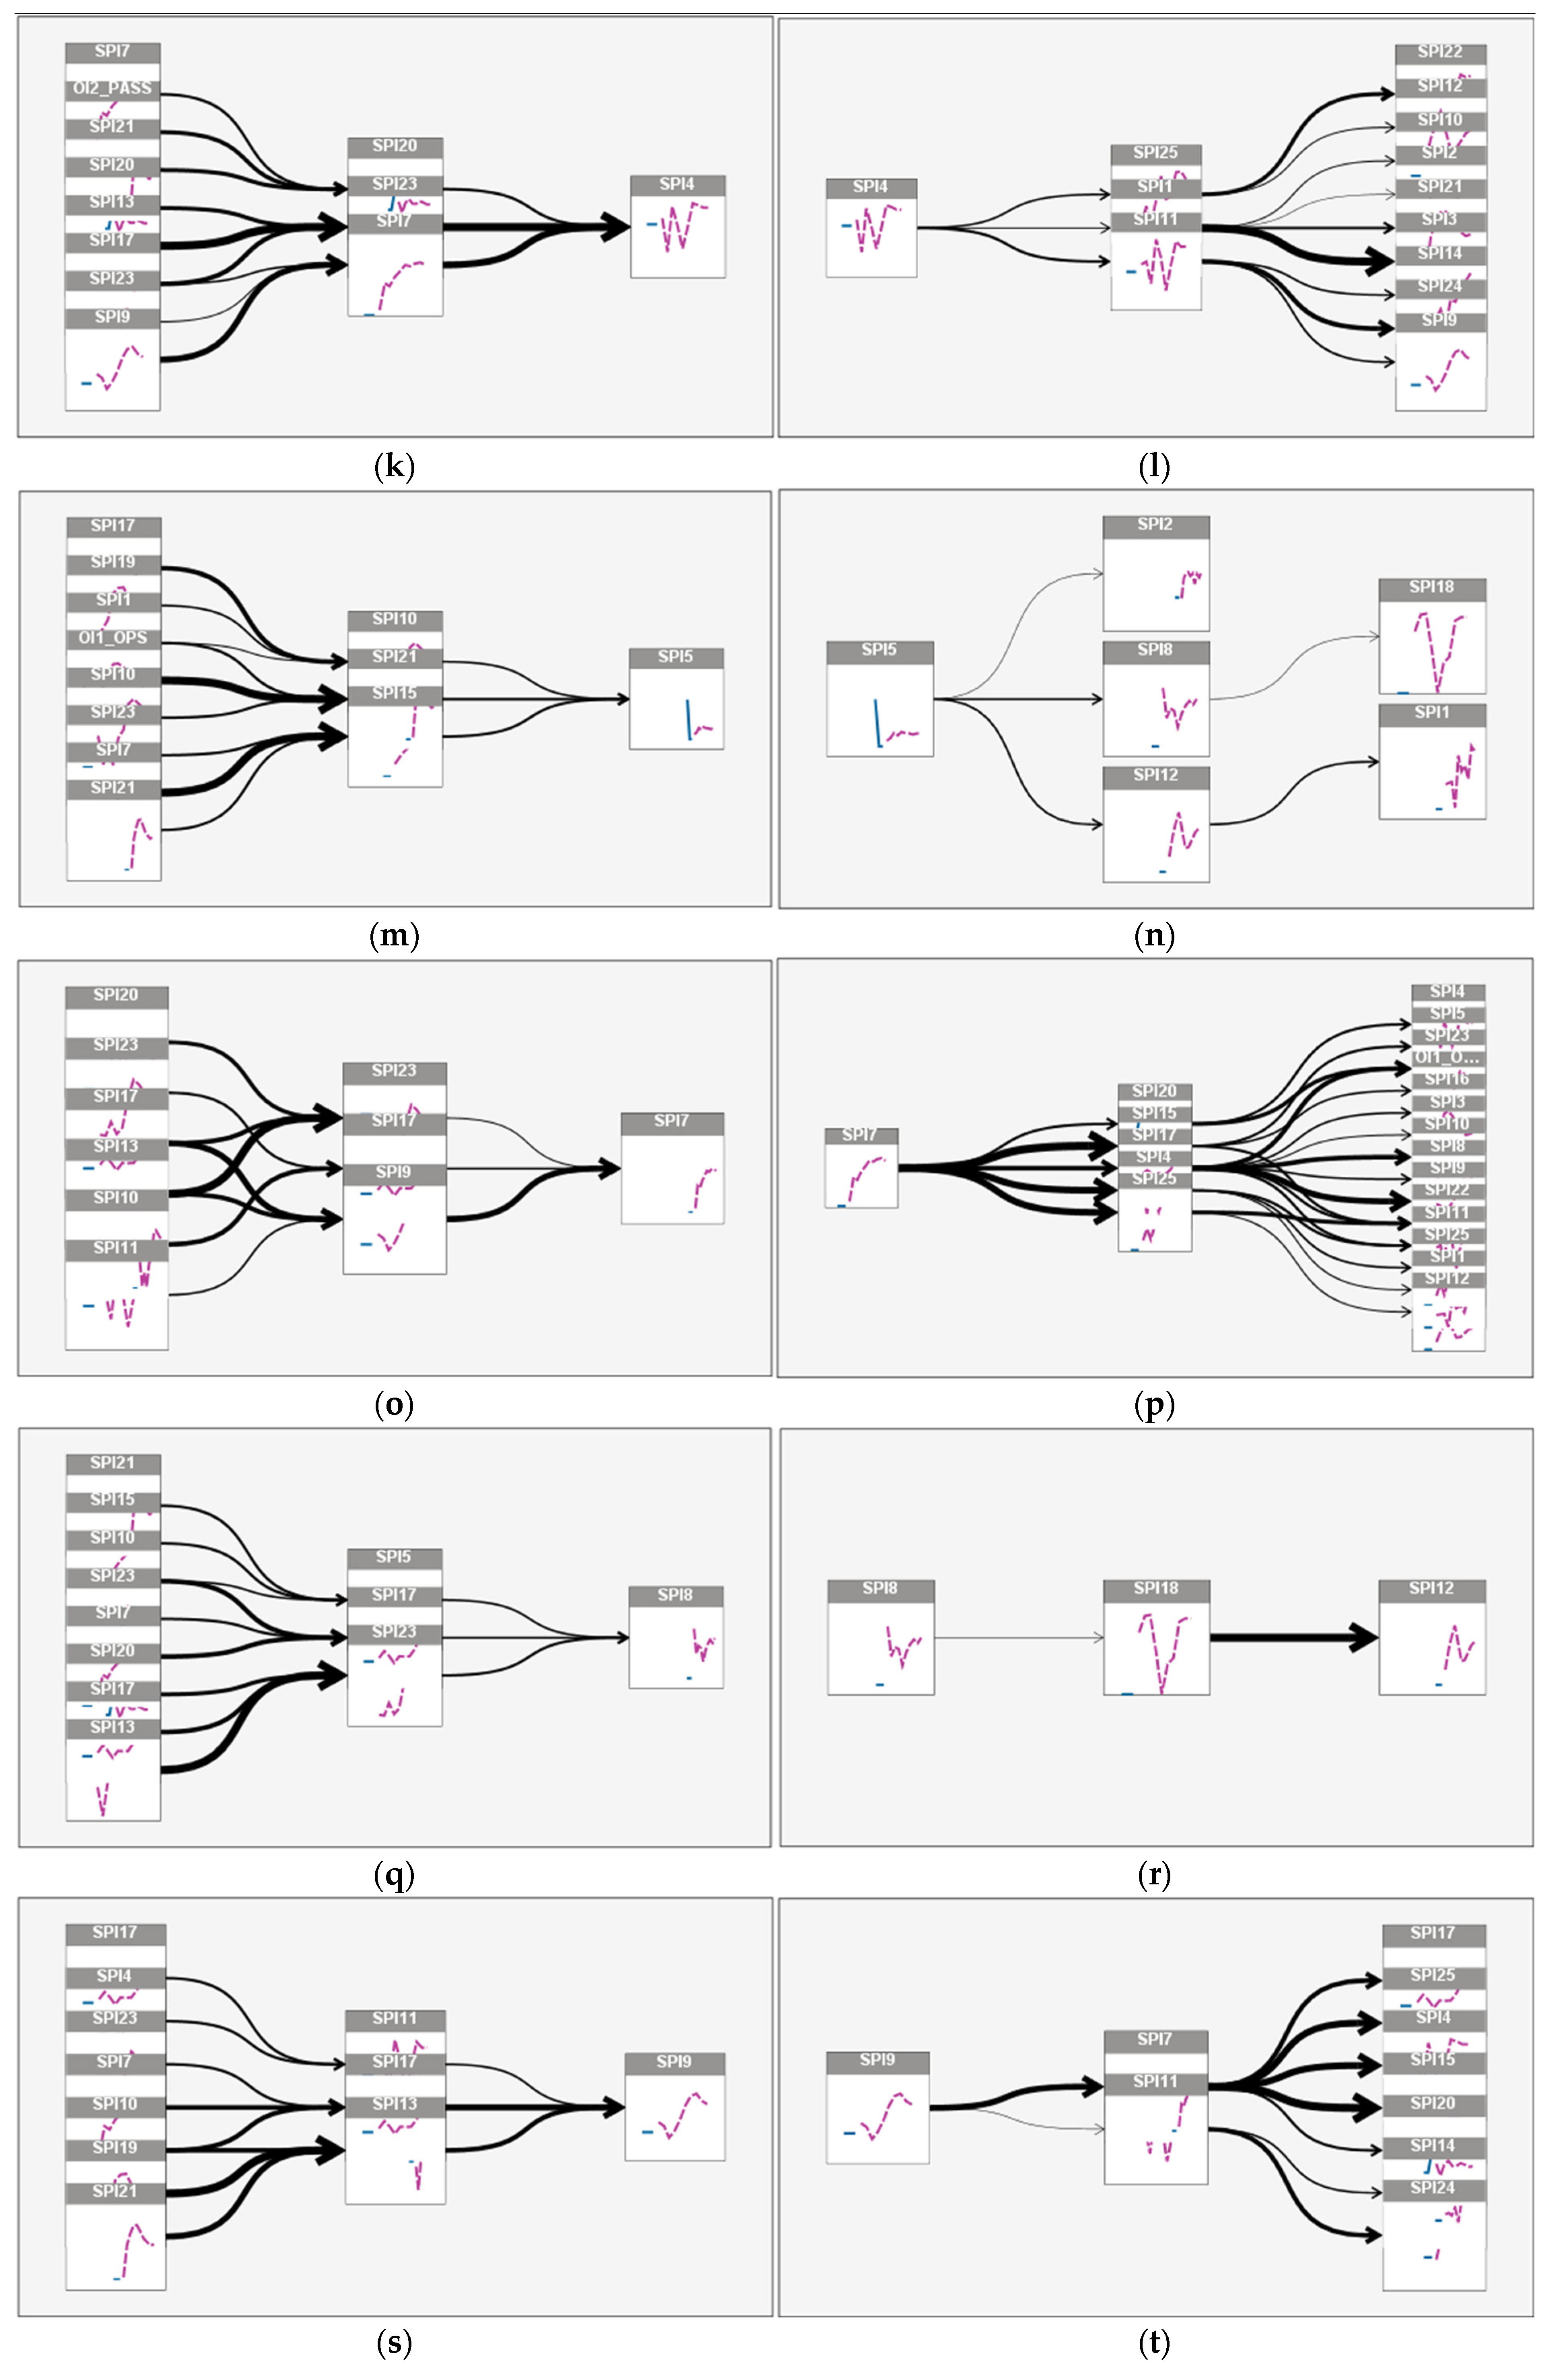
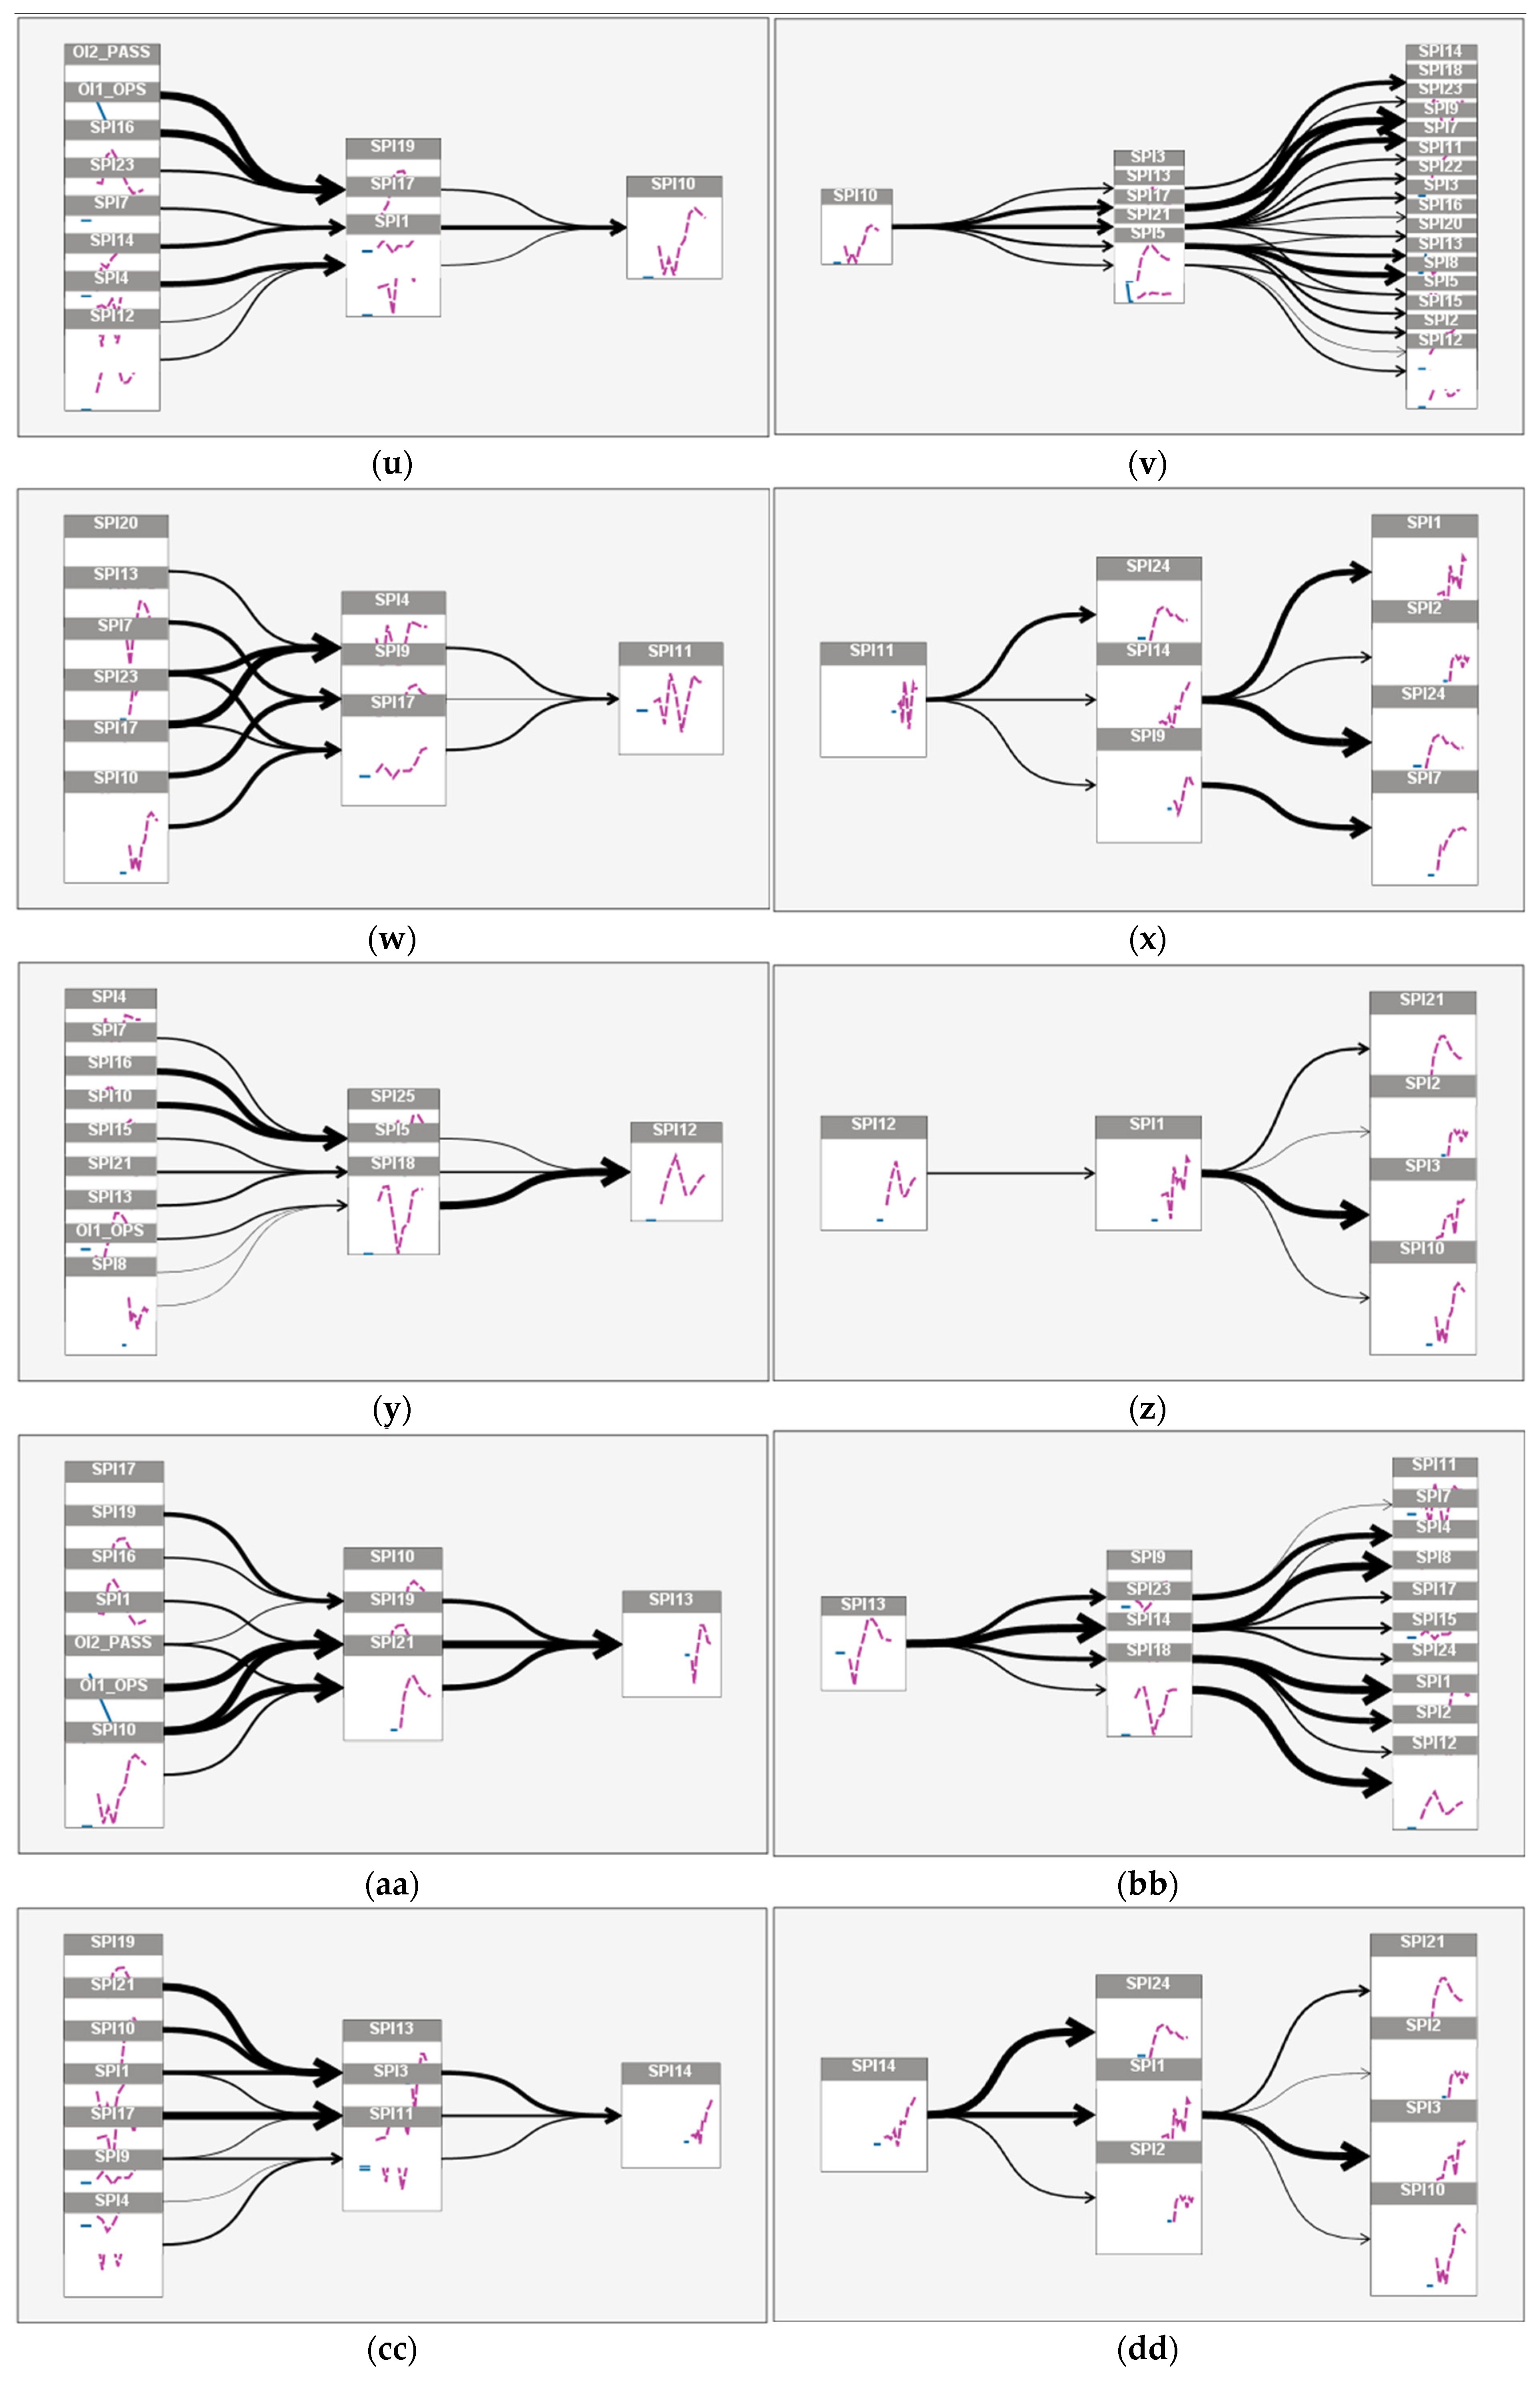
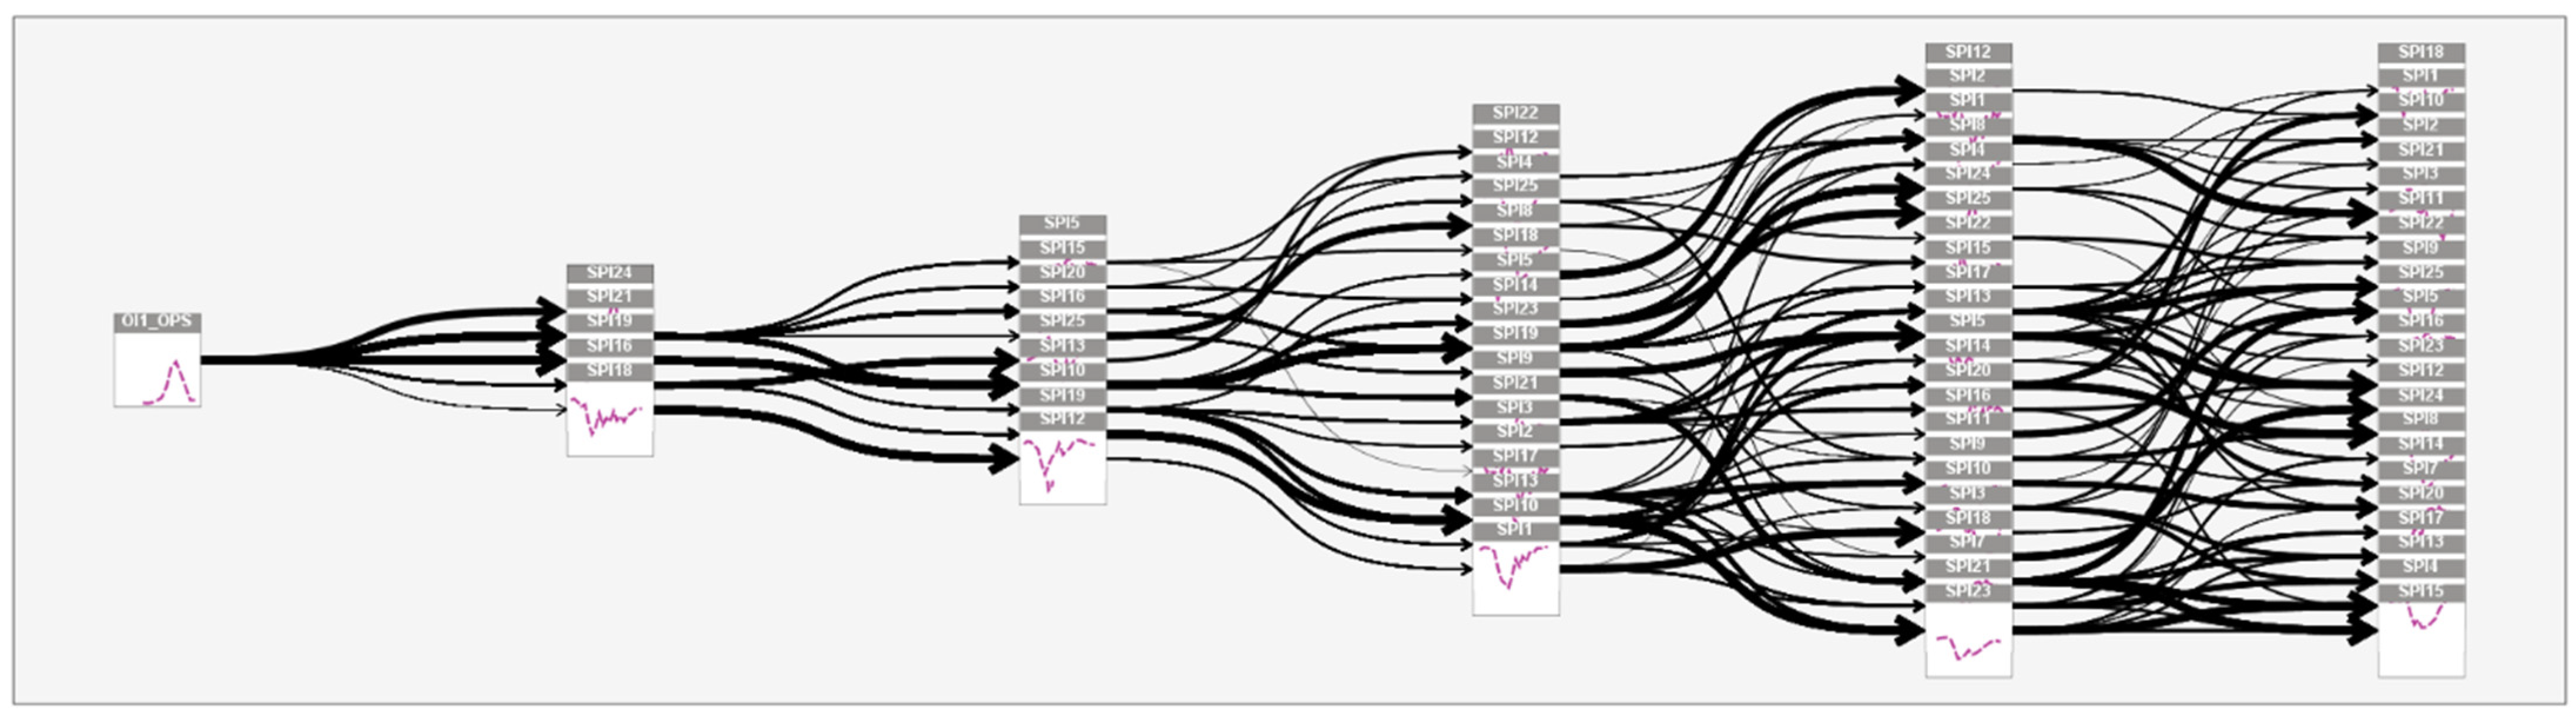
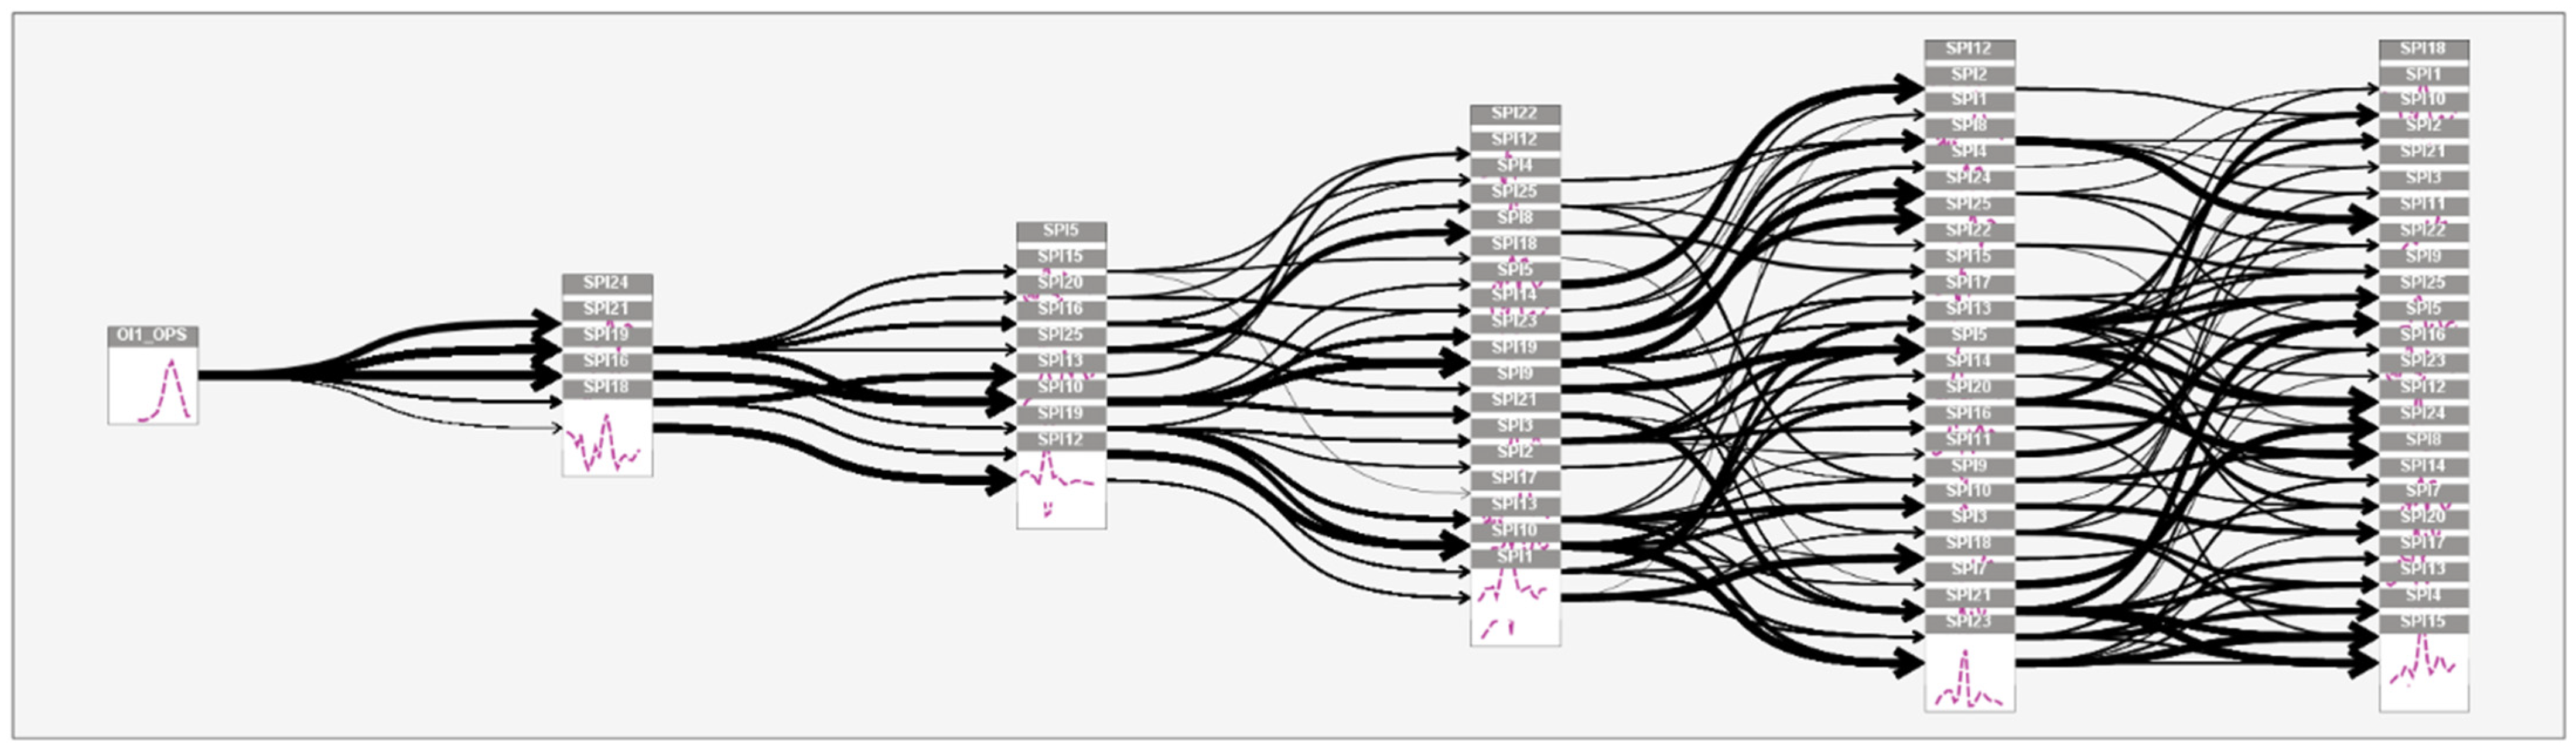
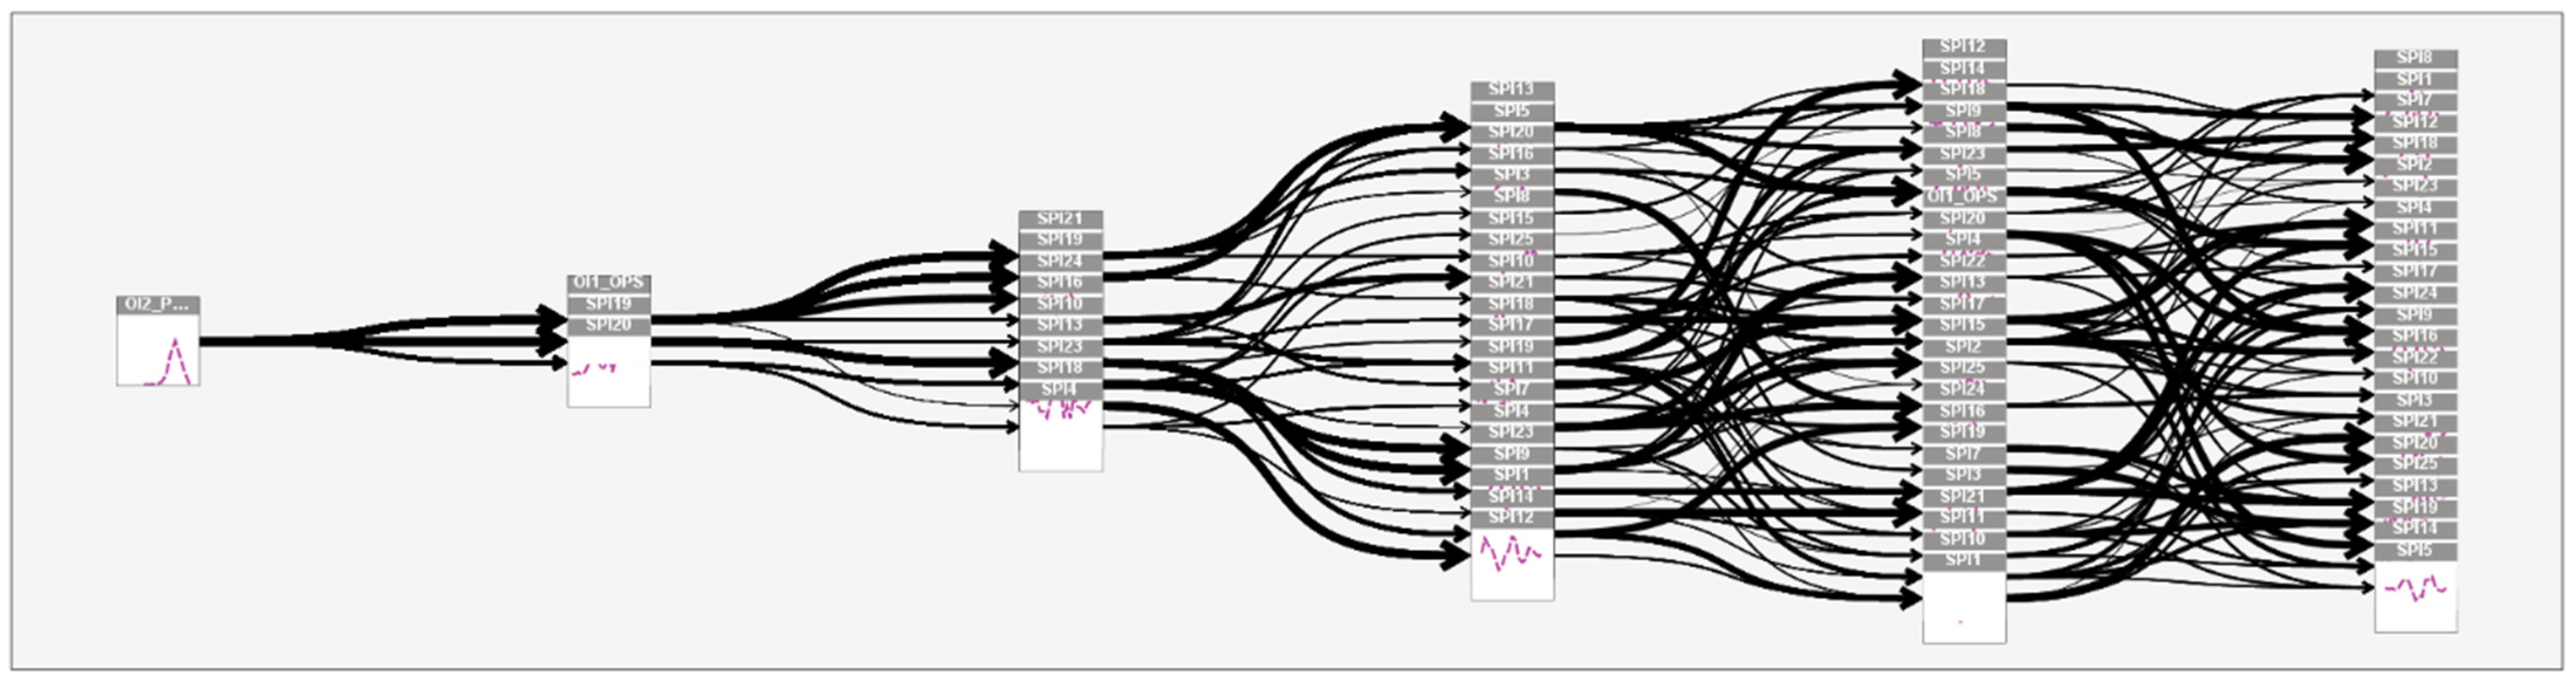
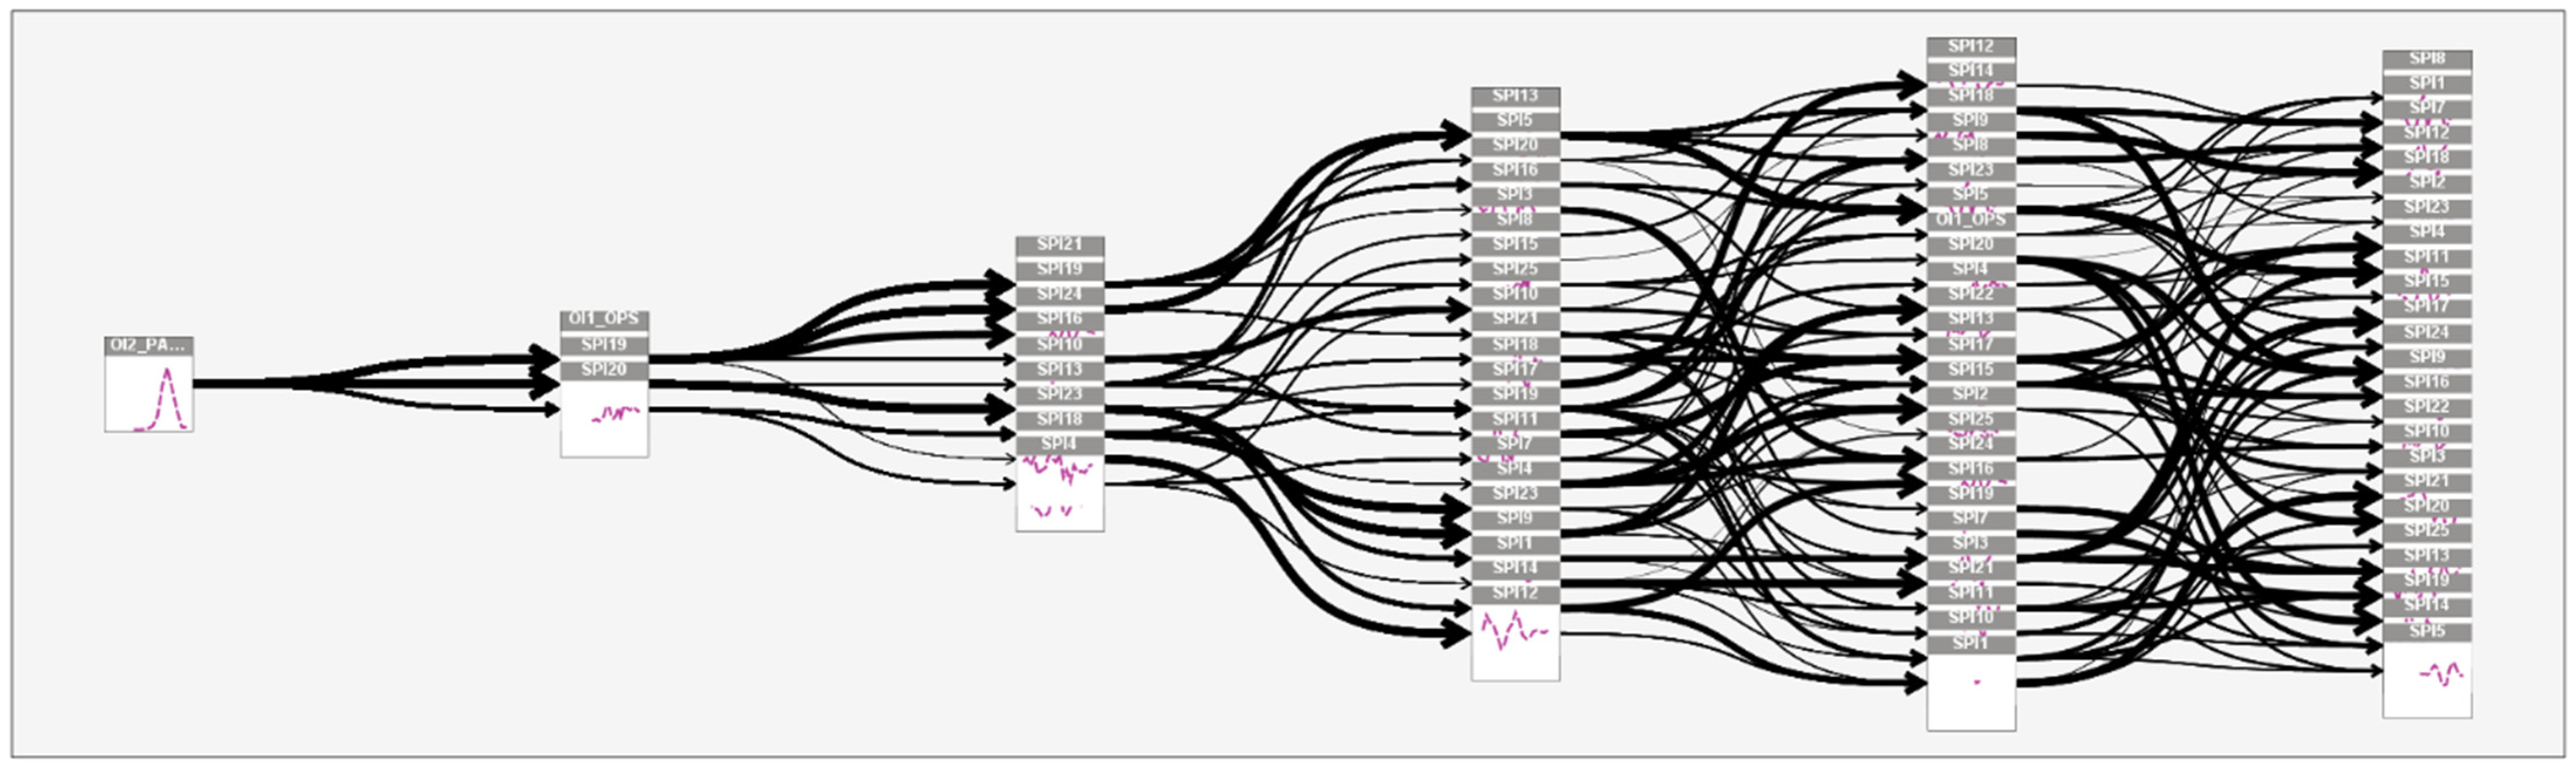
Figure 3 shows the causal model of all causal links among organizational indicators (OIs) and safety performance indicators (SPIs) for Split Airport.
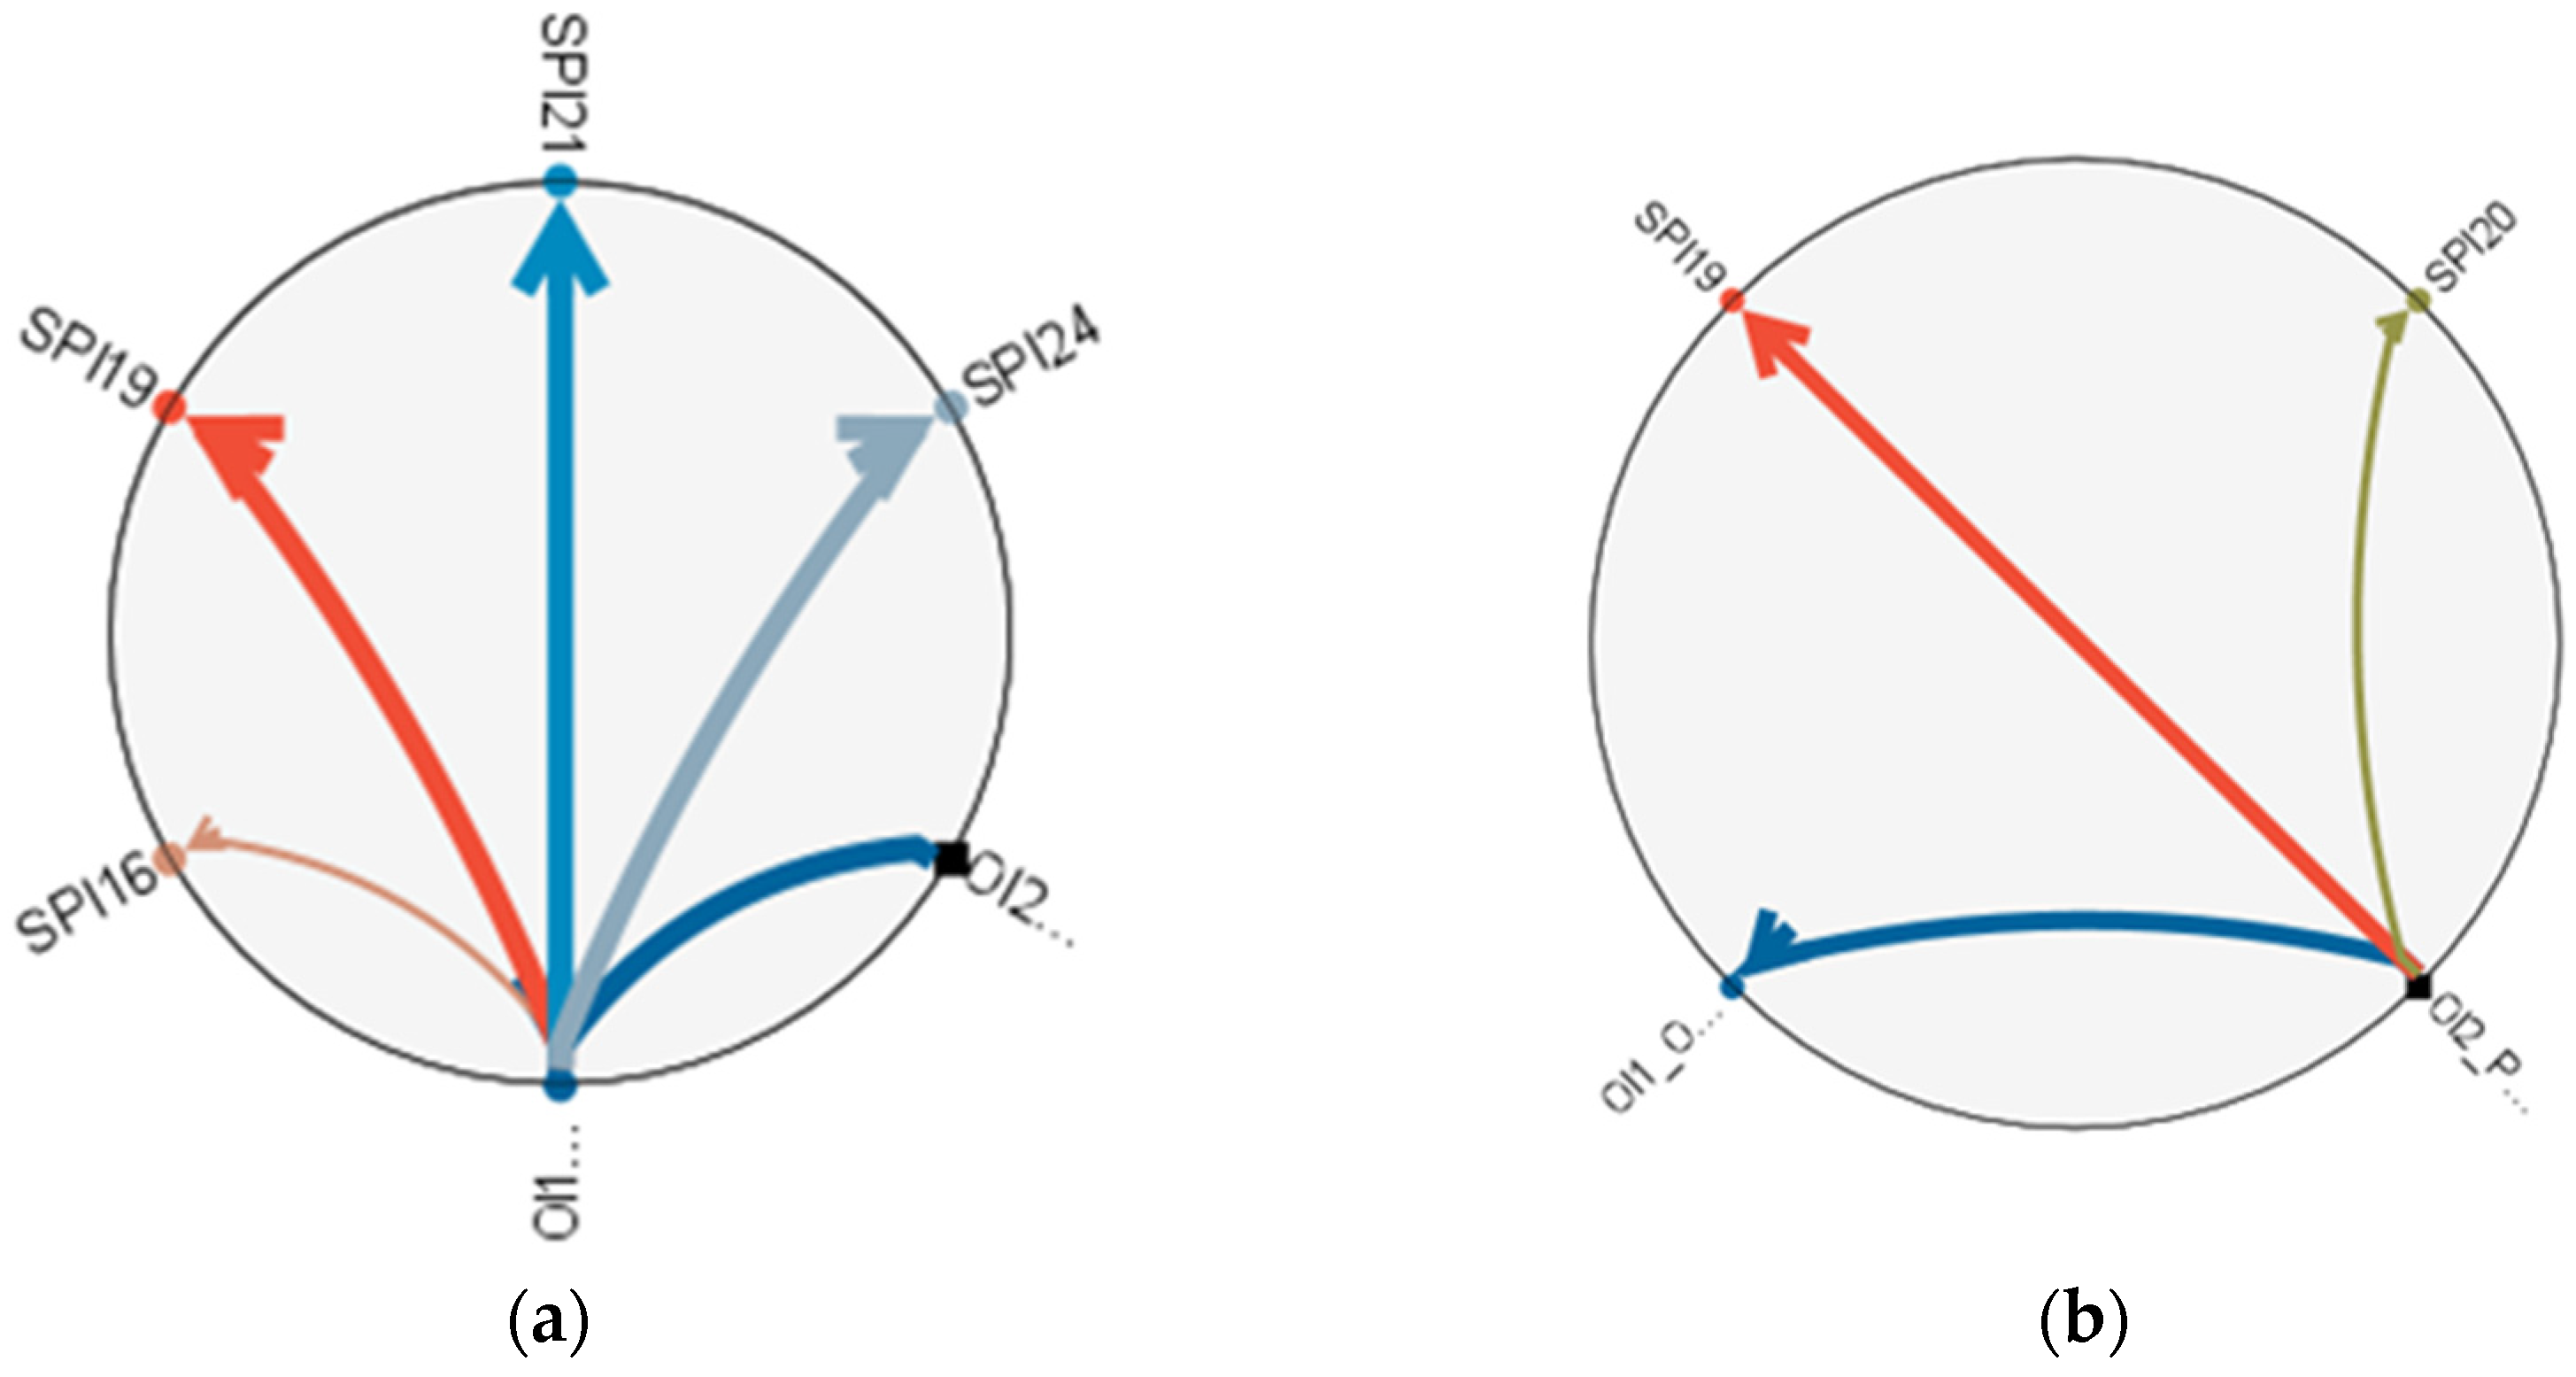
Figure 4 shows the direct impact of organizational indicators (OIs) on safety performance indicators (SPIs) at Split Airport, i.e., OI1—Number of aircraft operations, and OI2—Number of passengers.
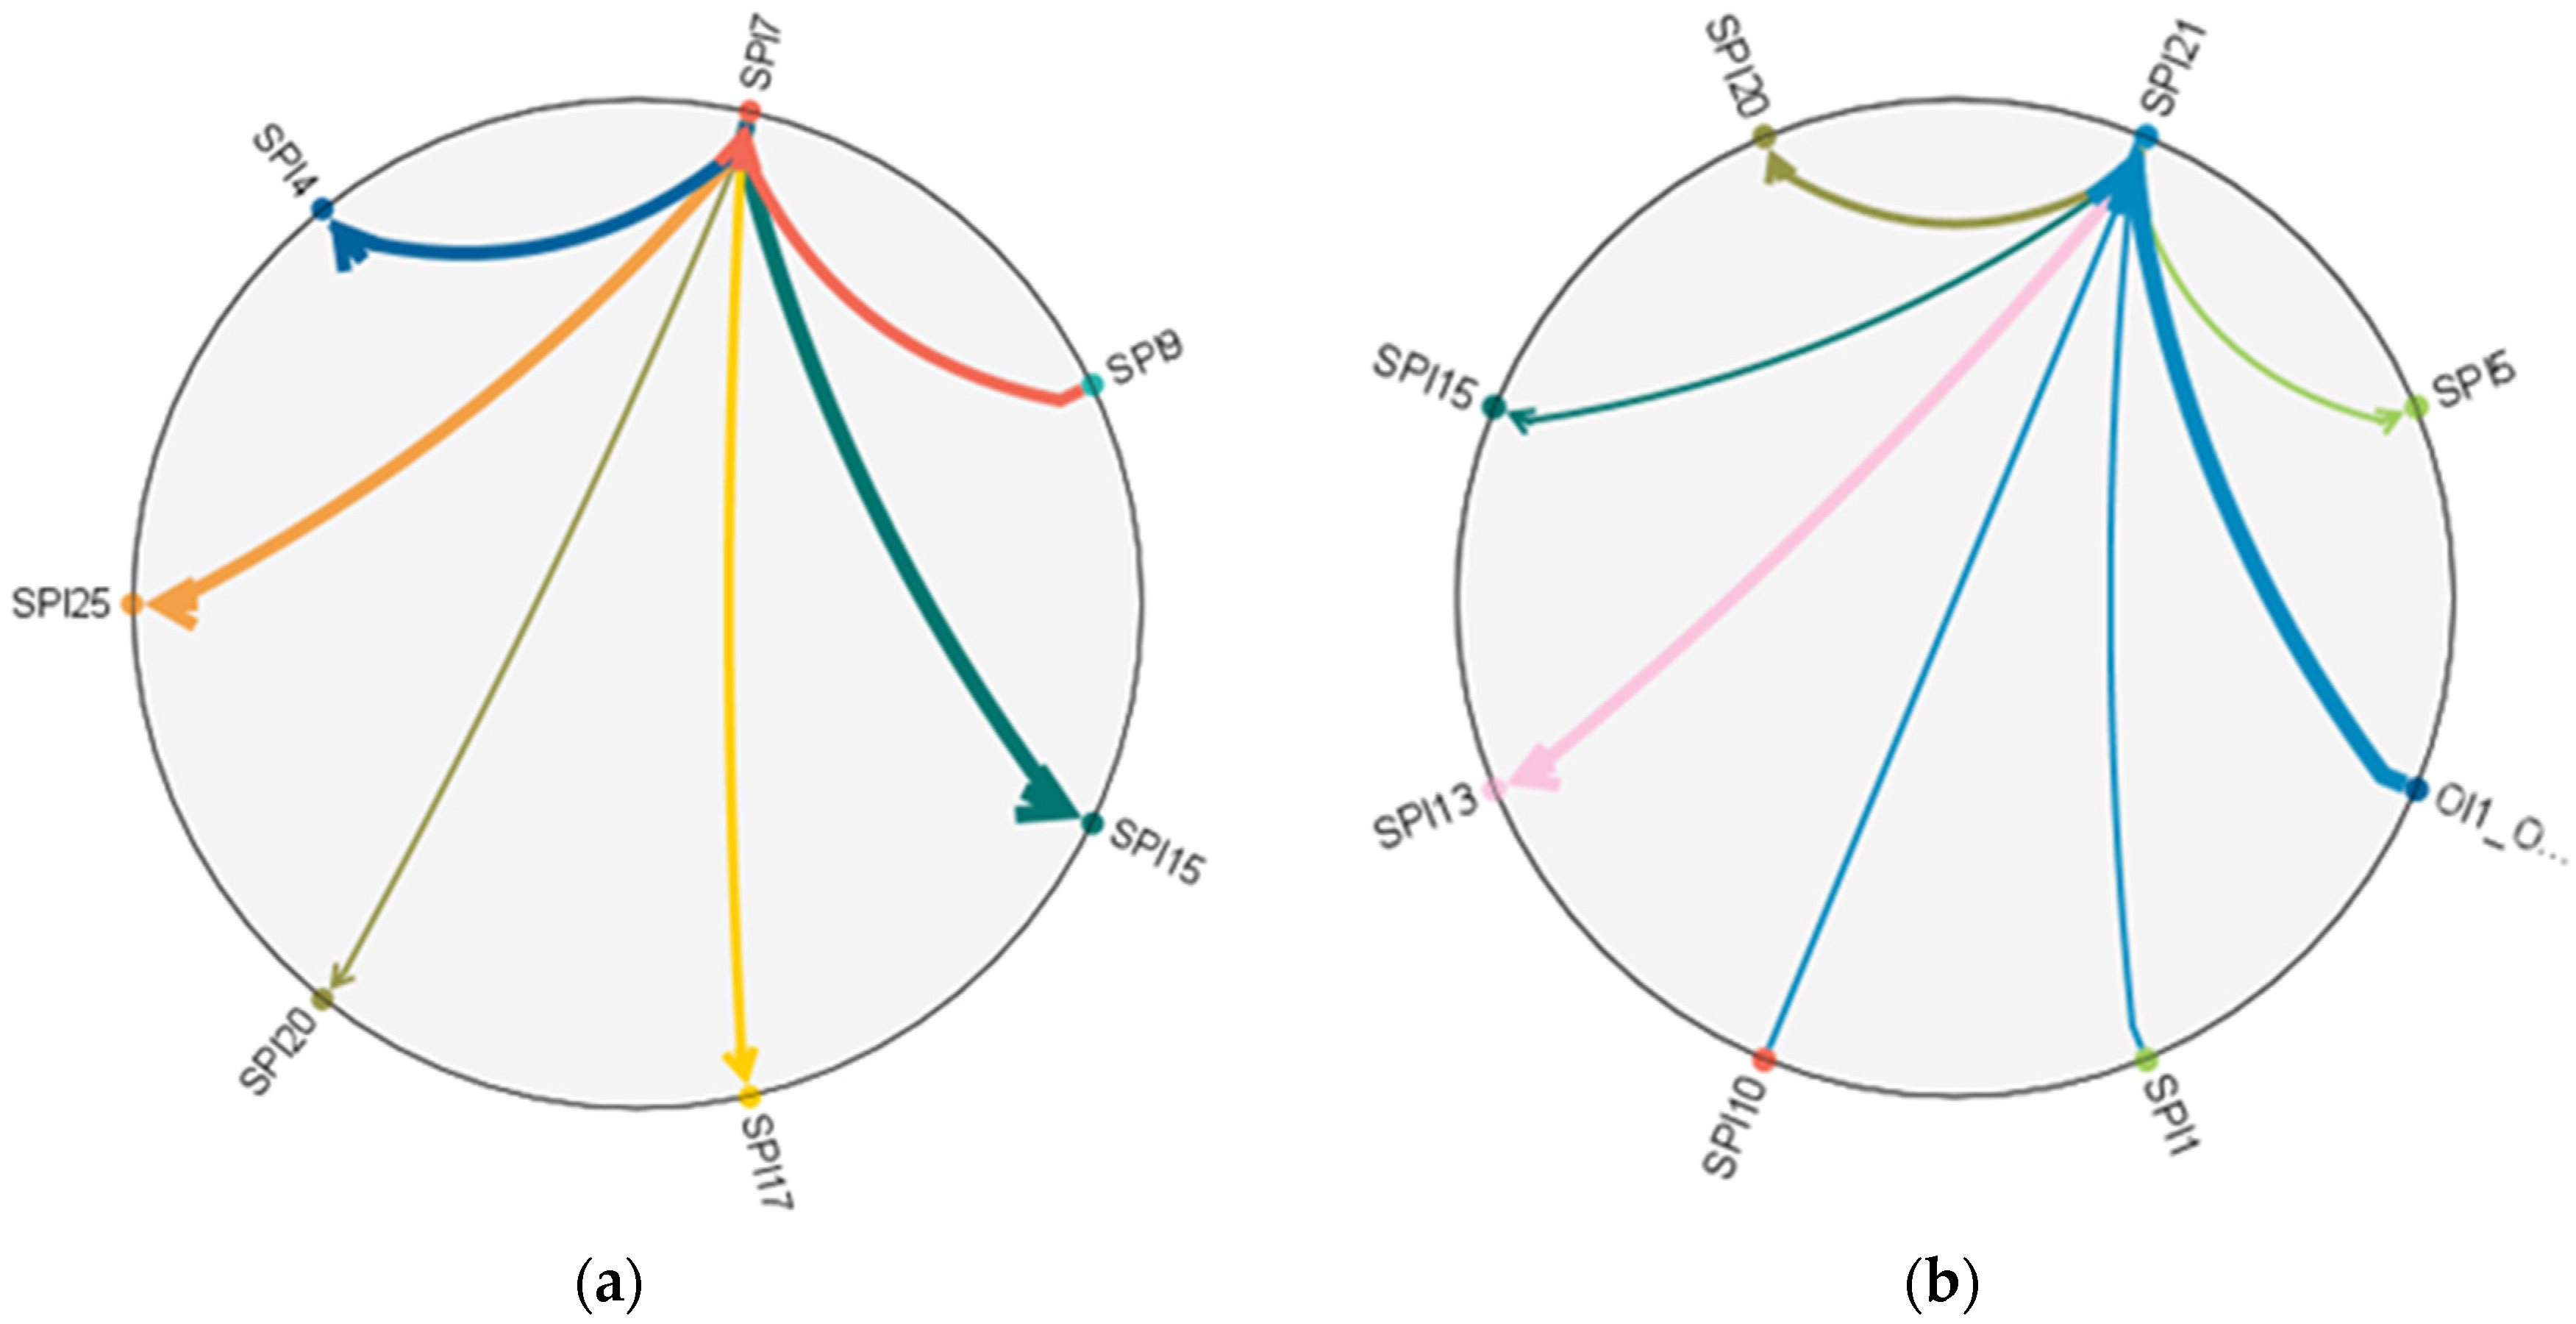
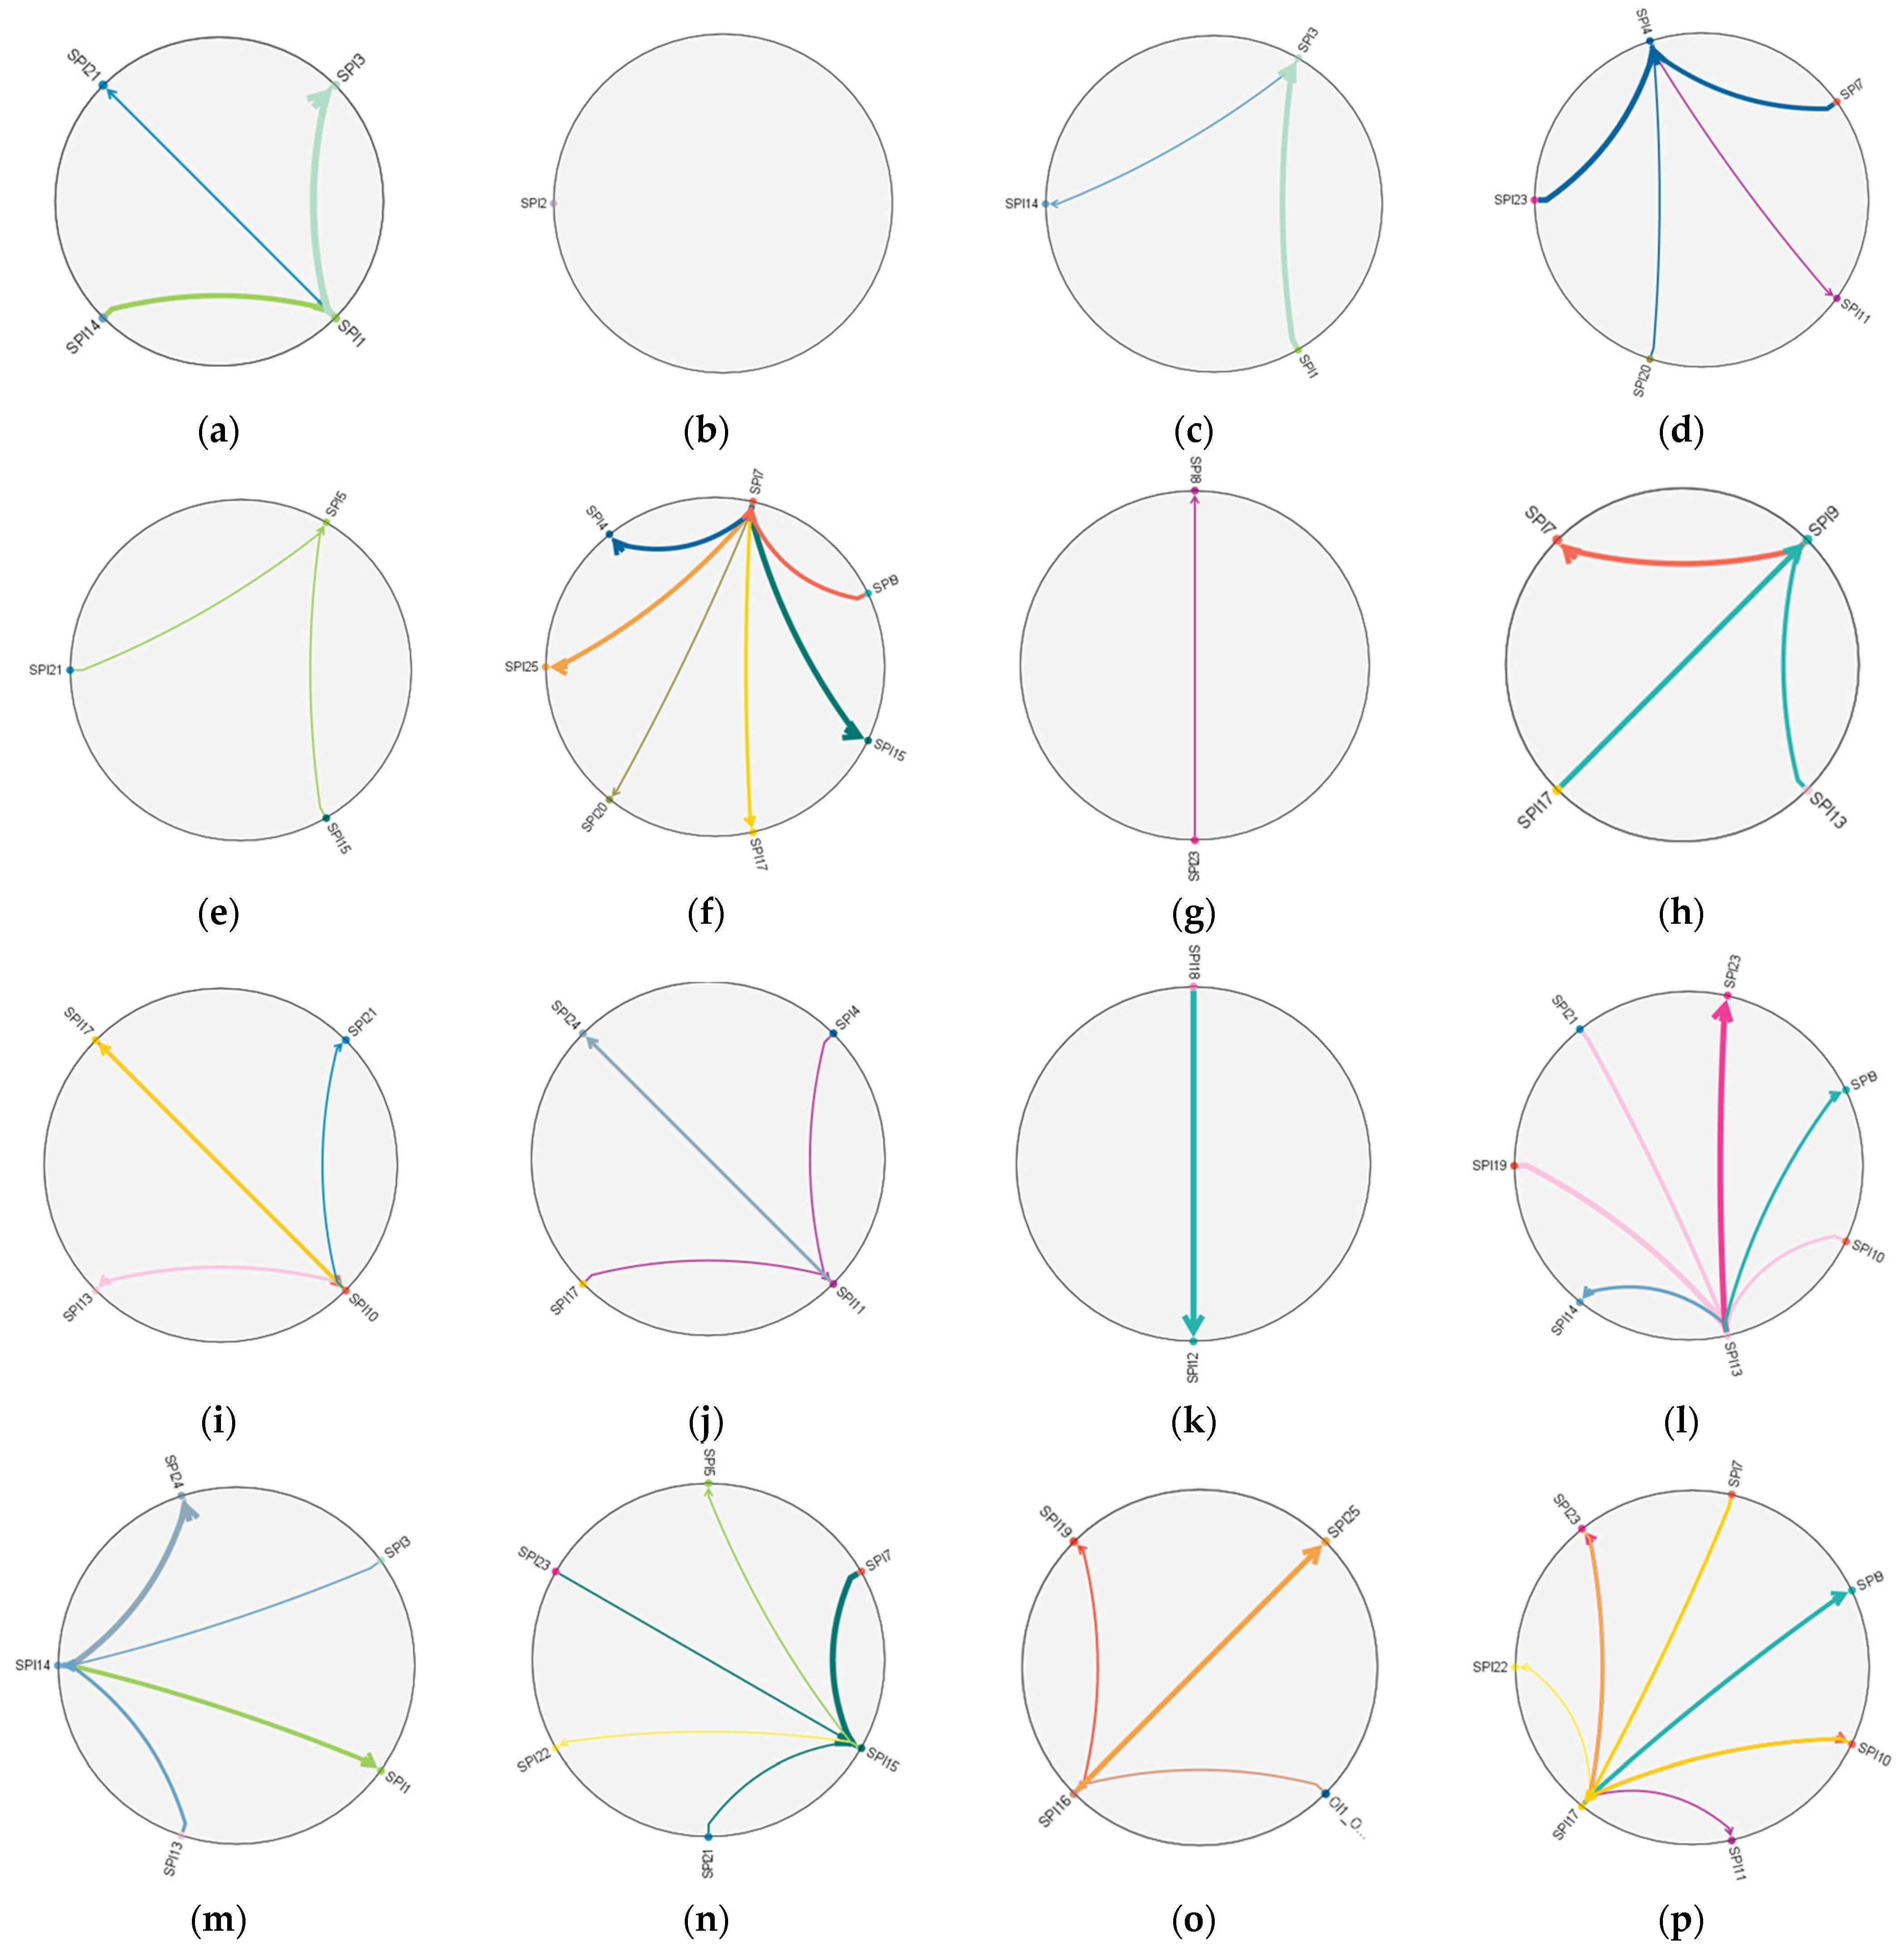
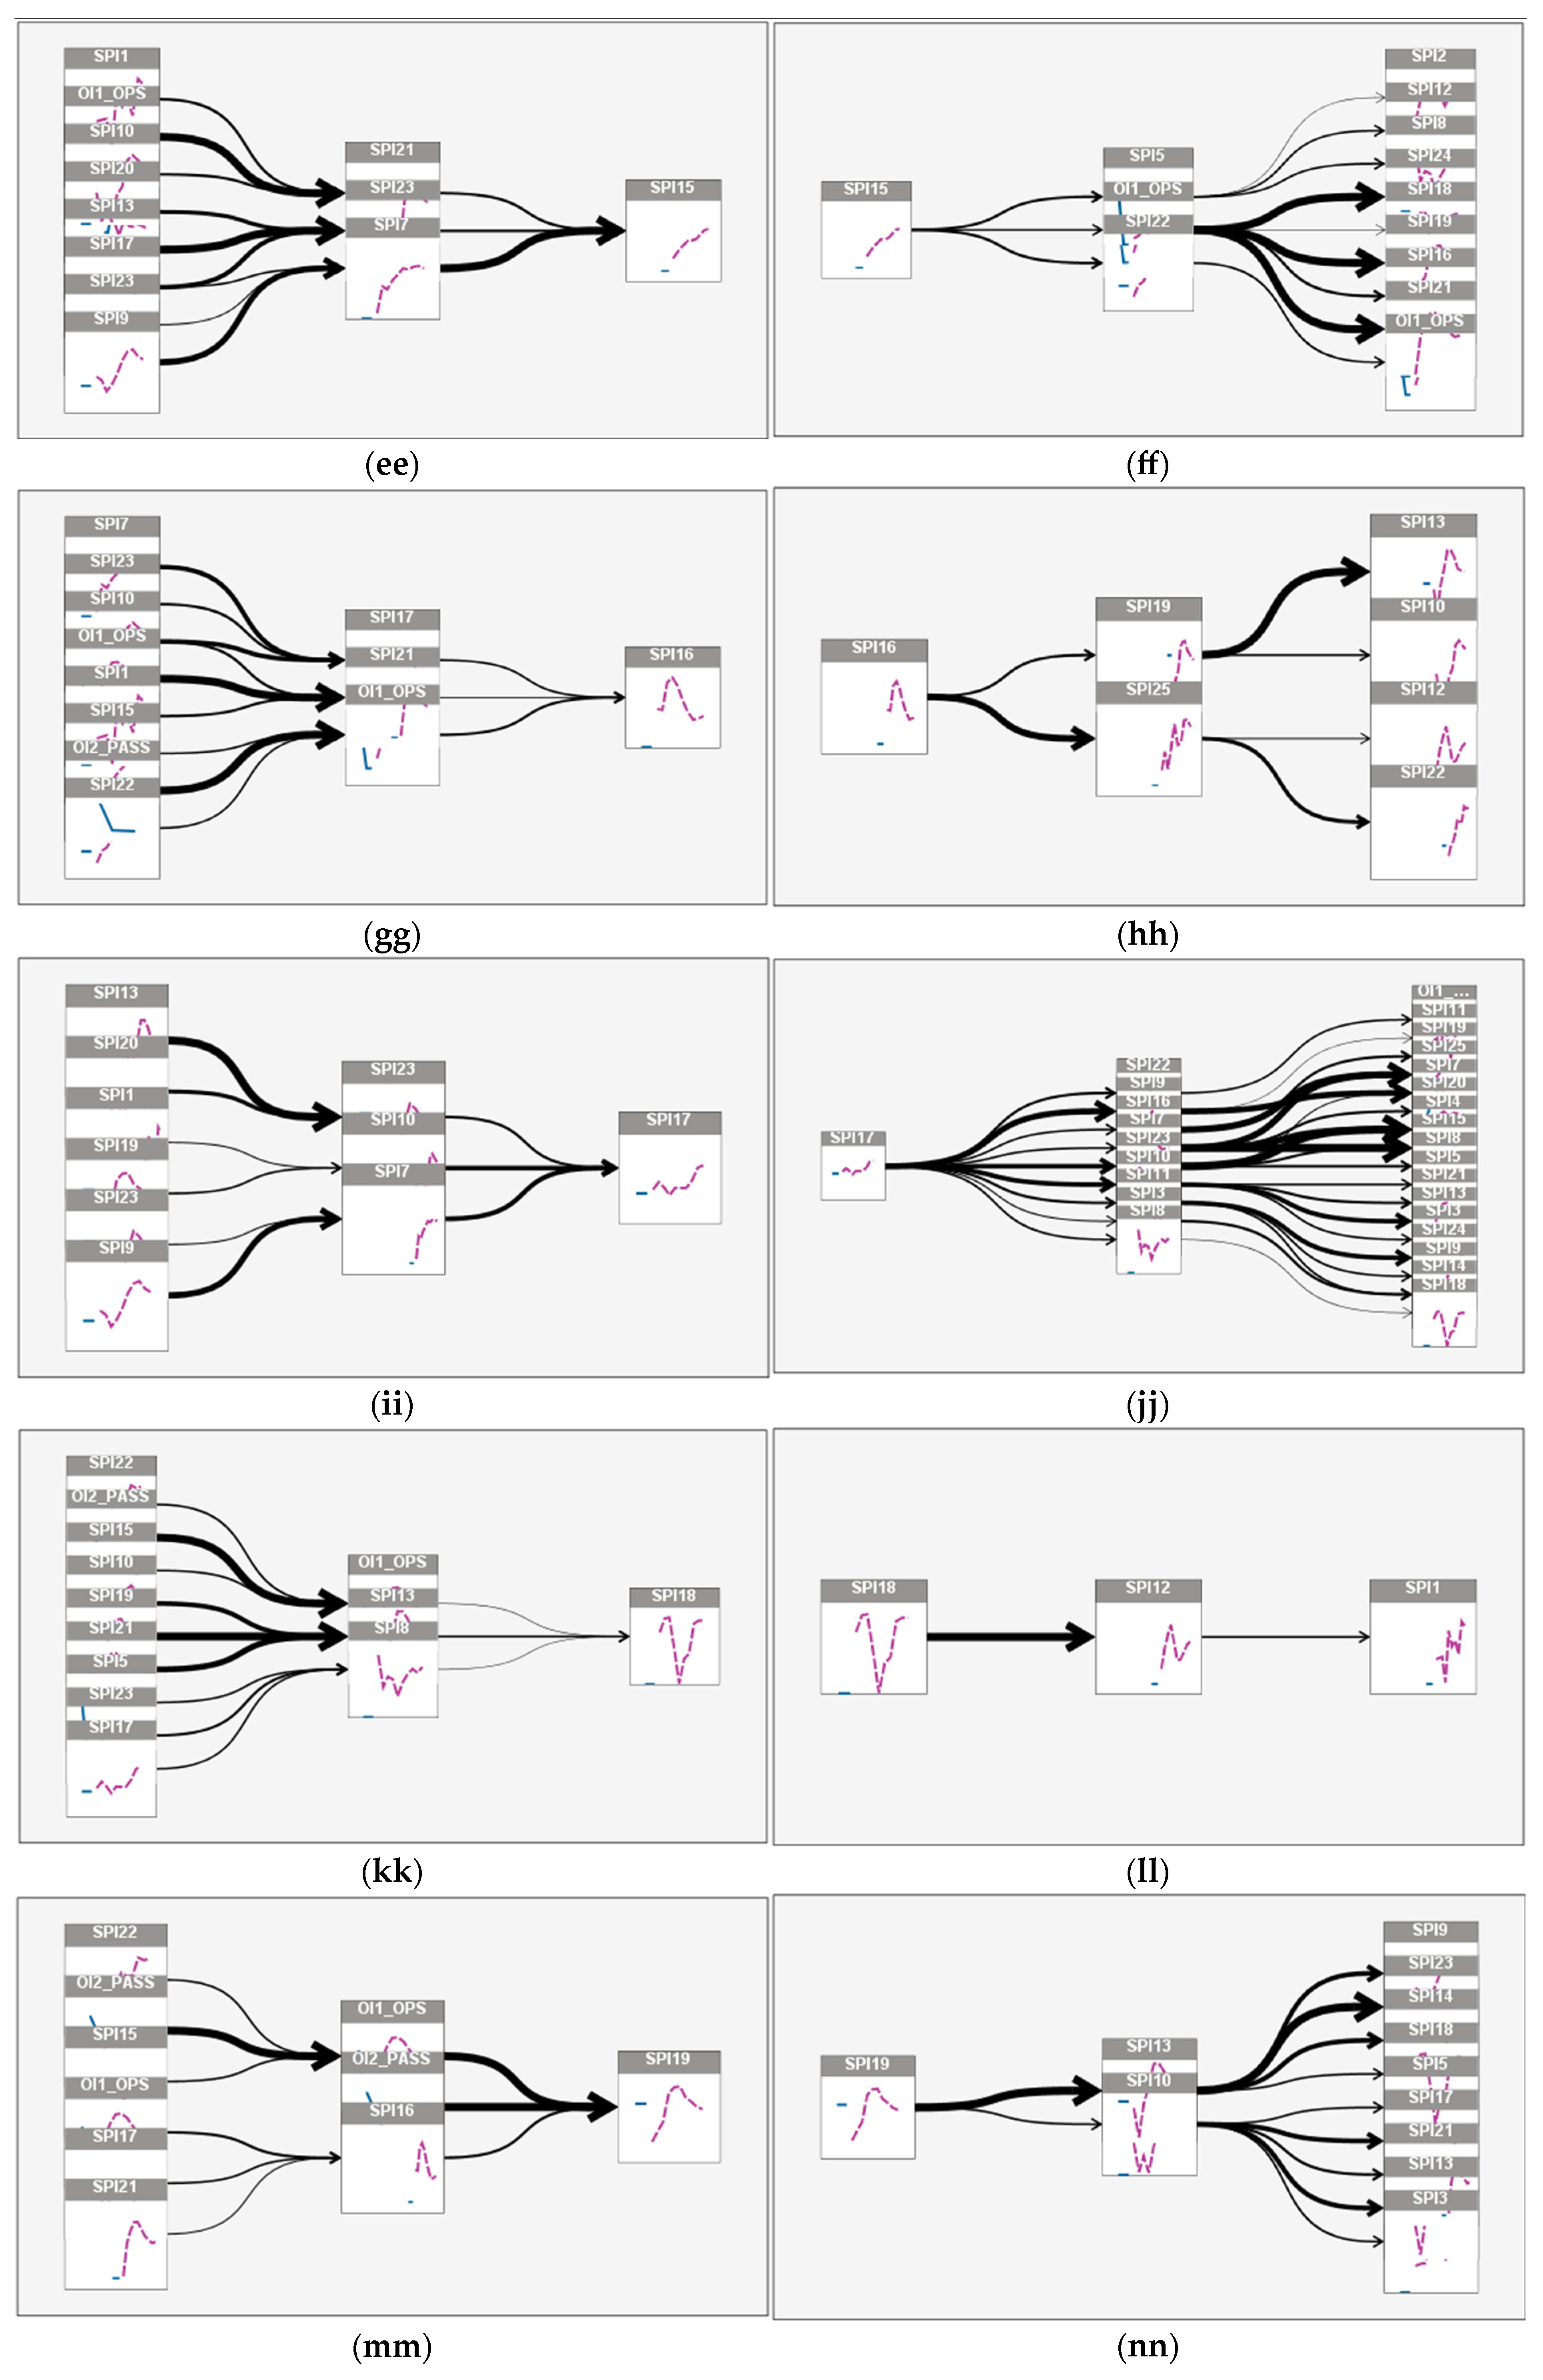
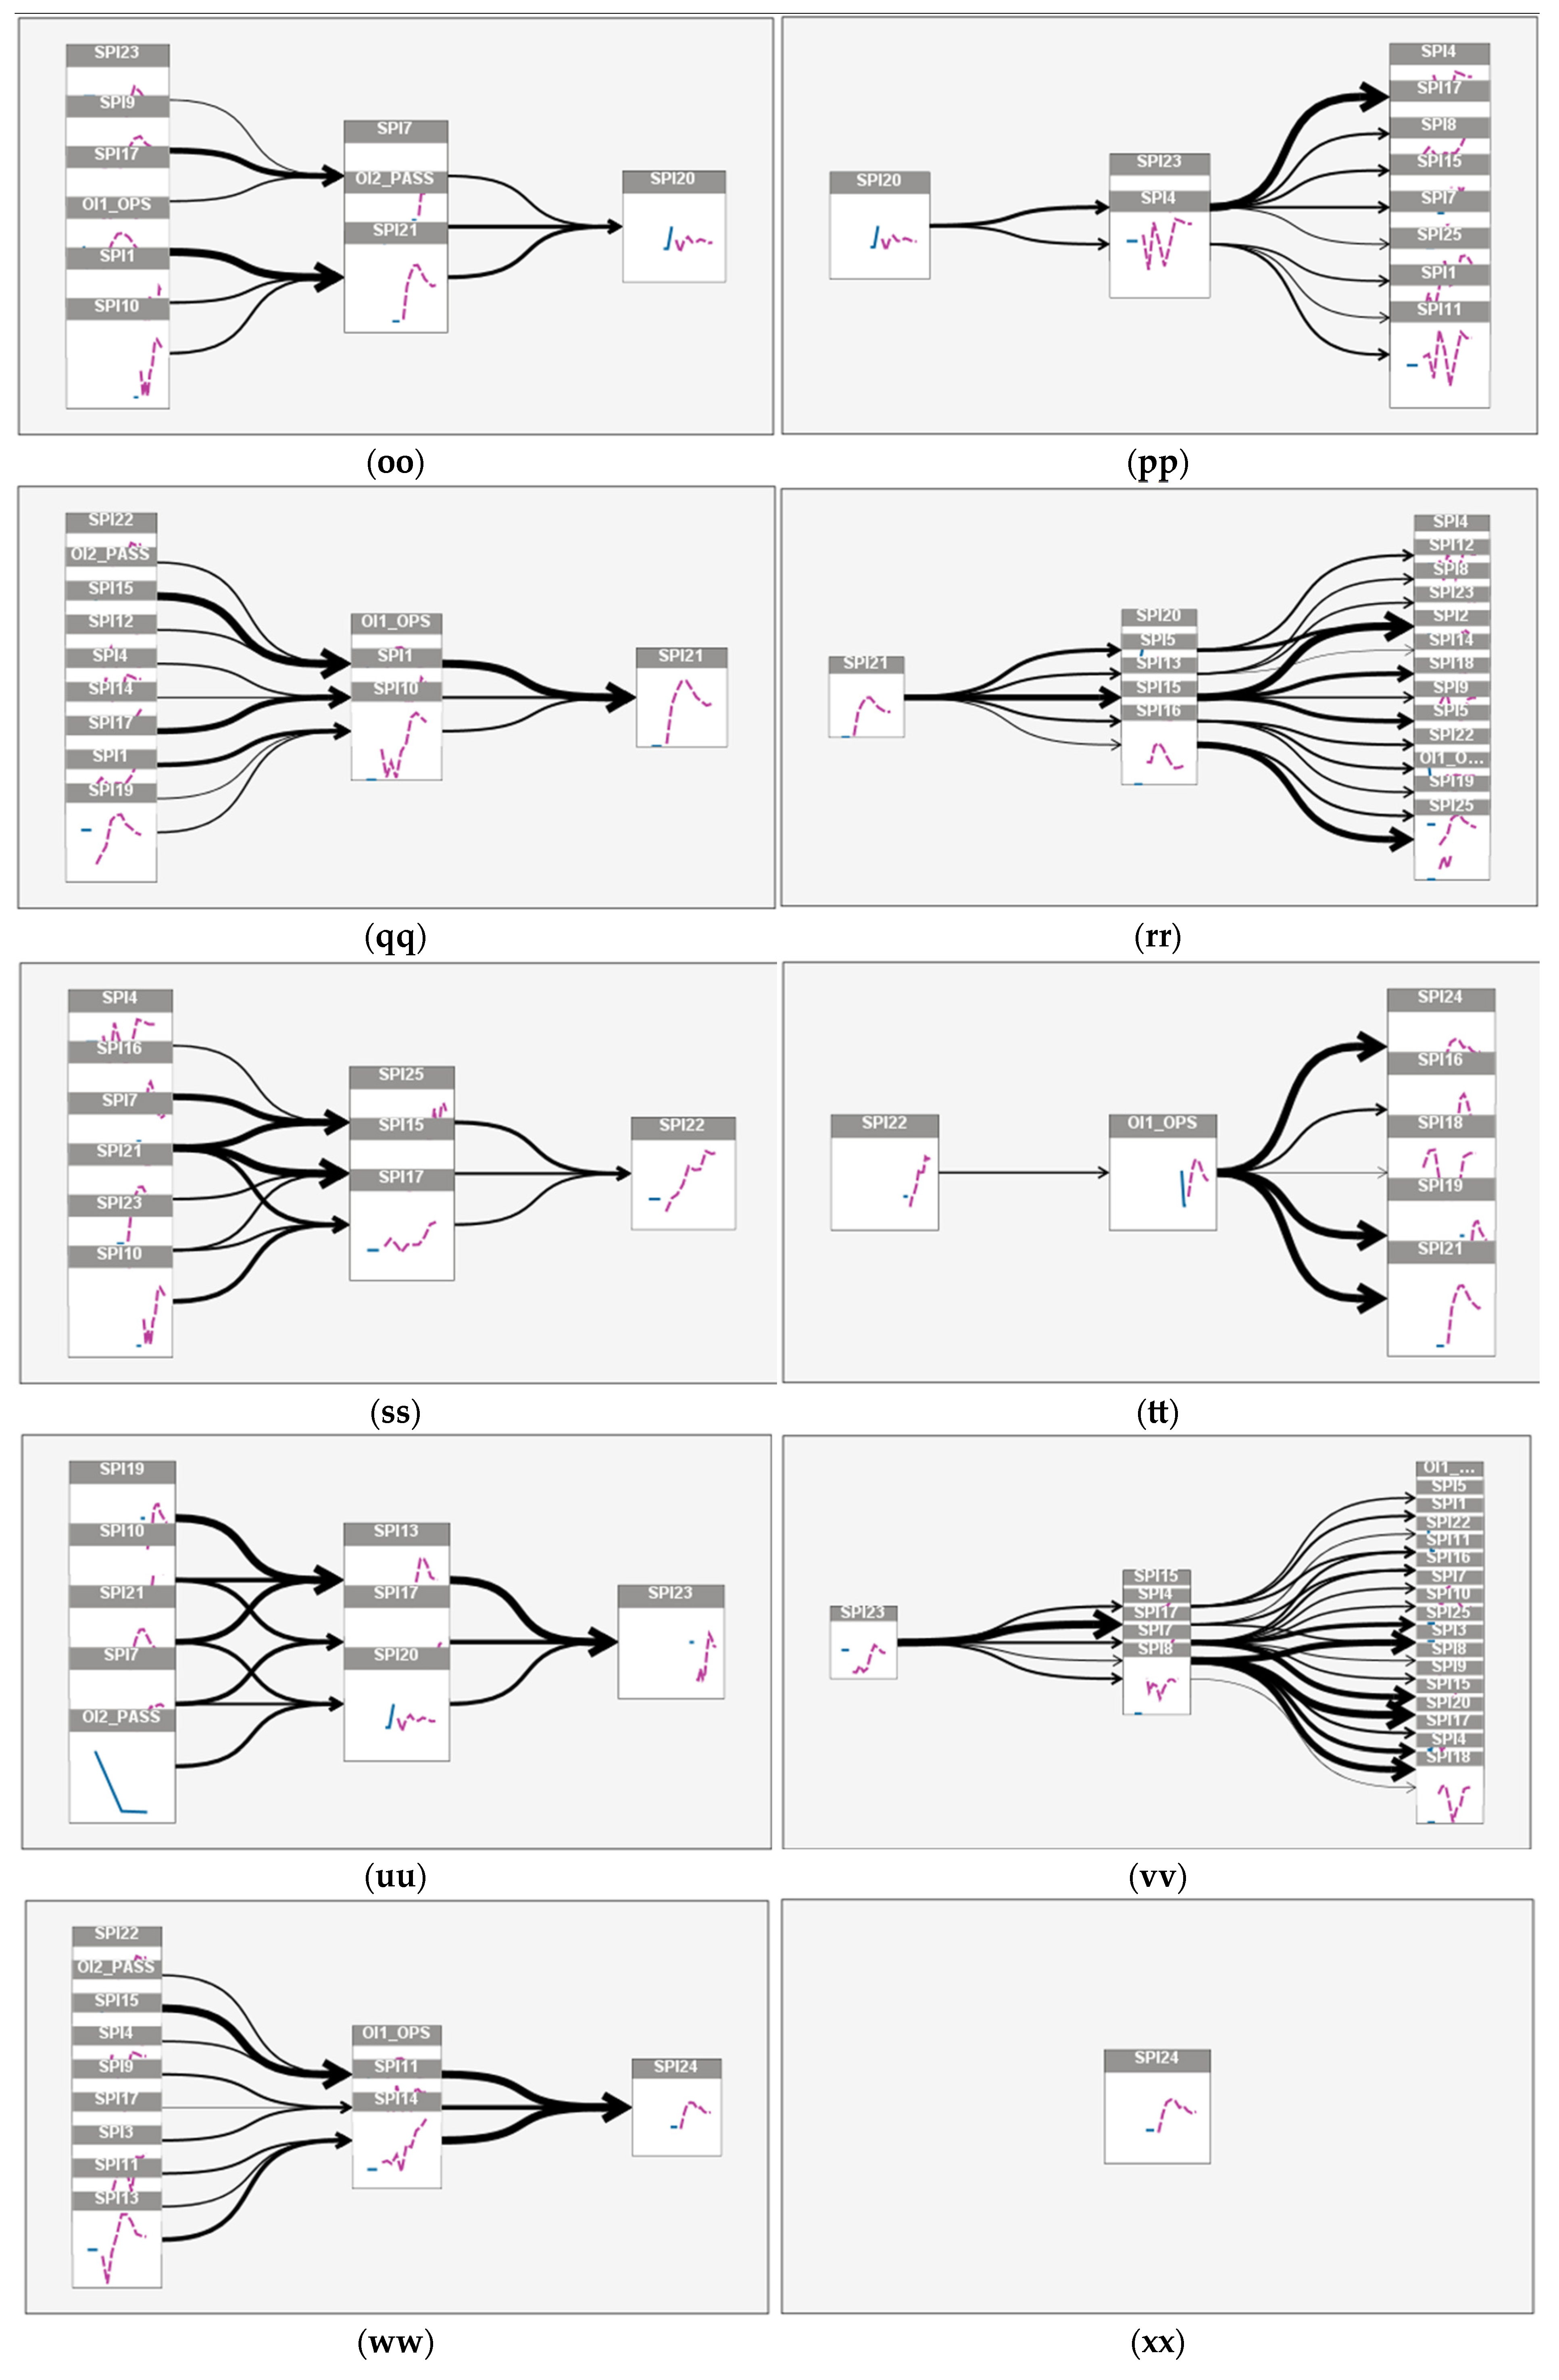
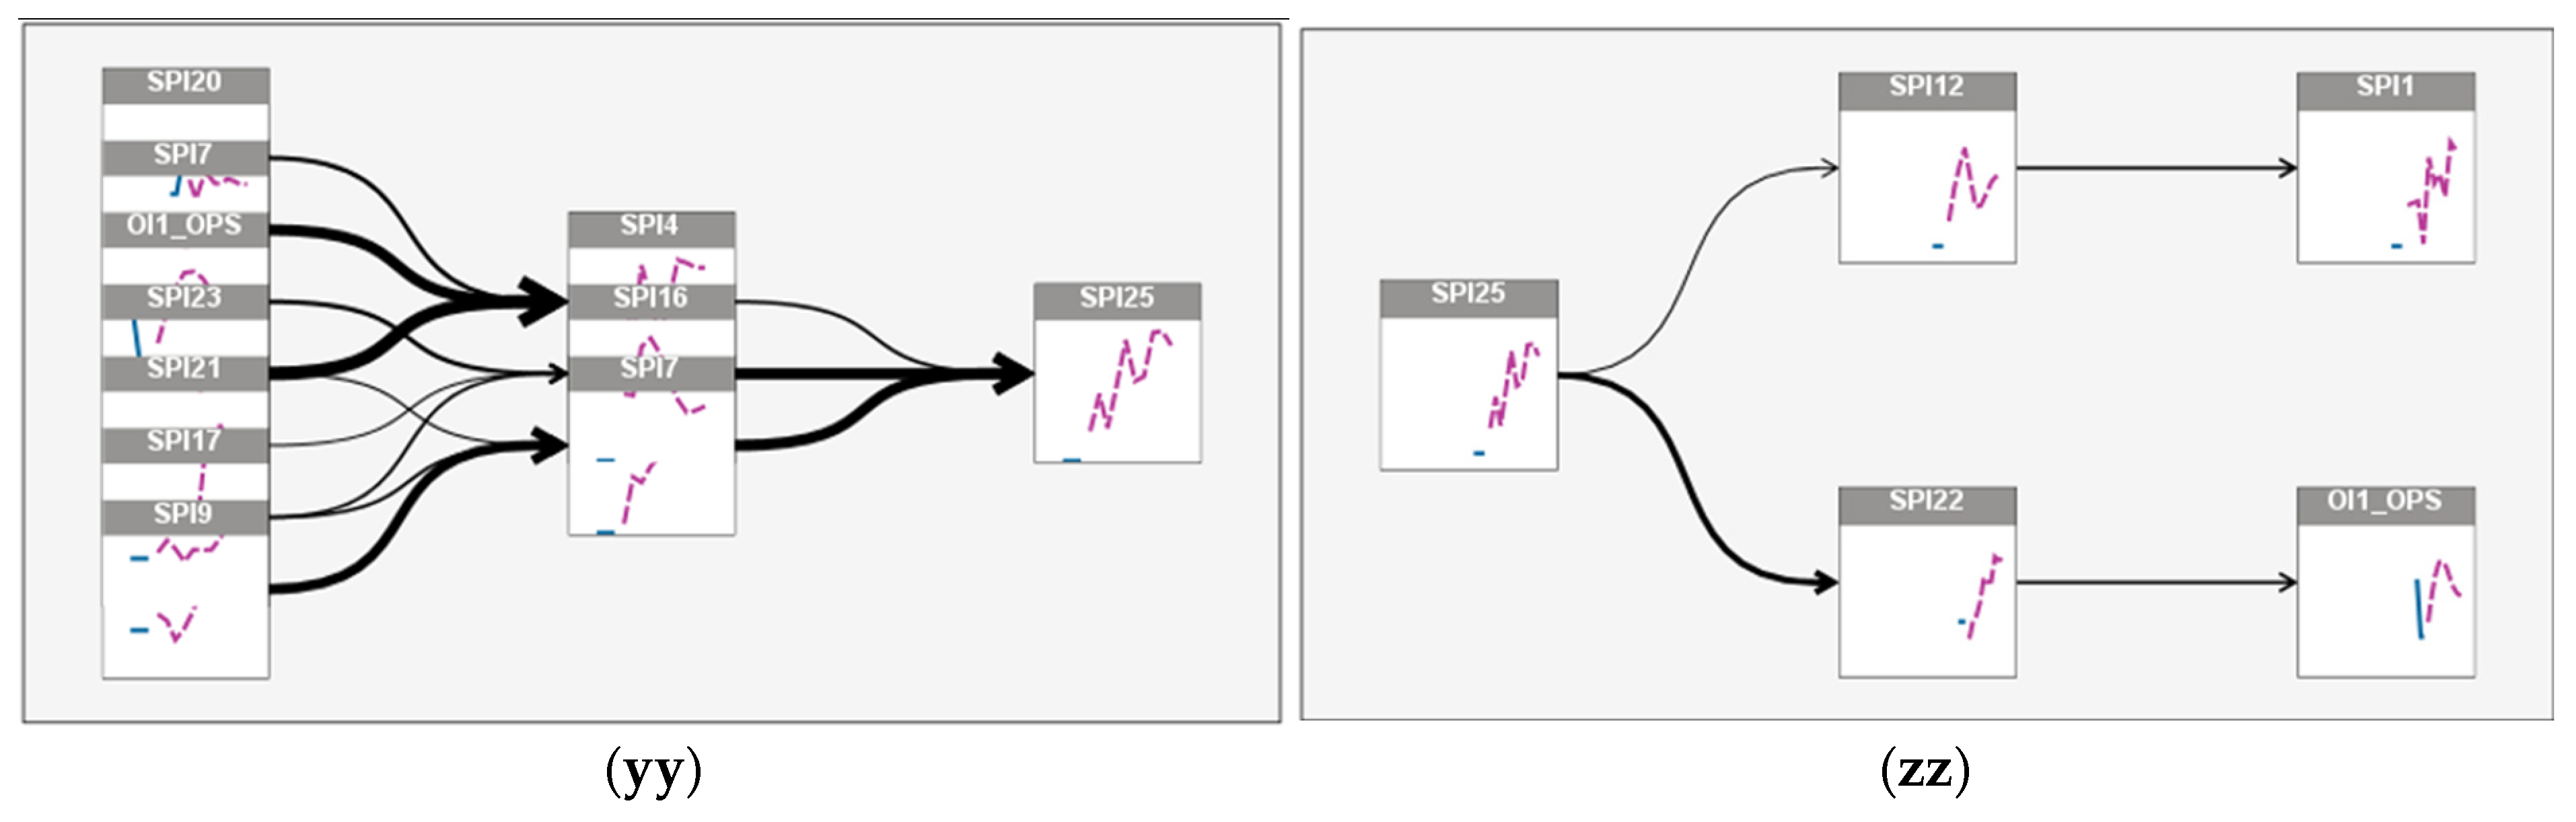
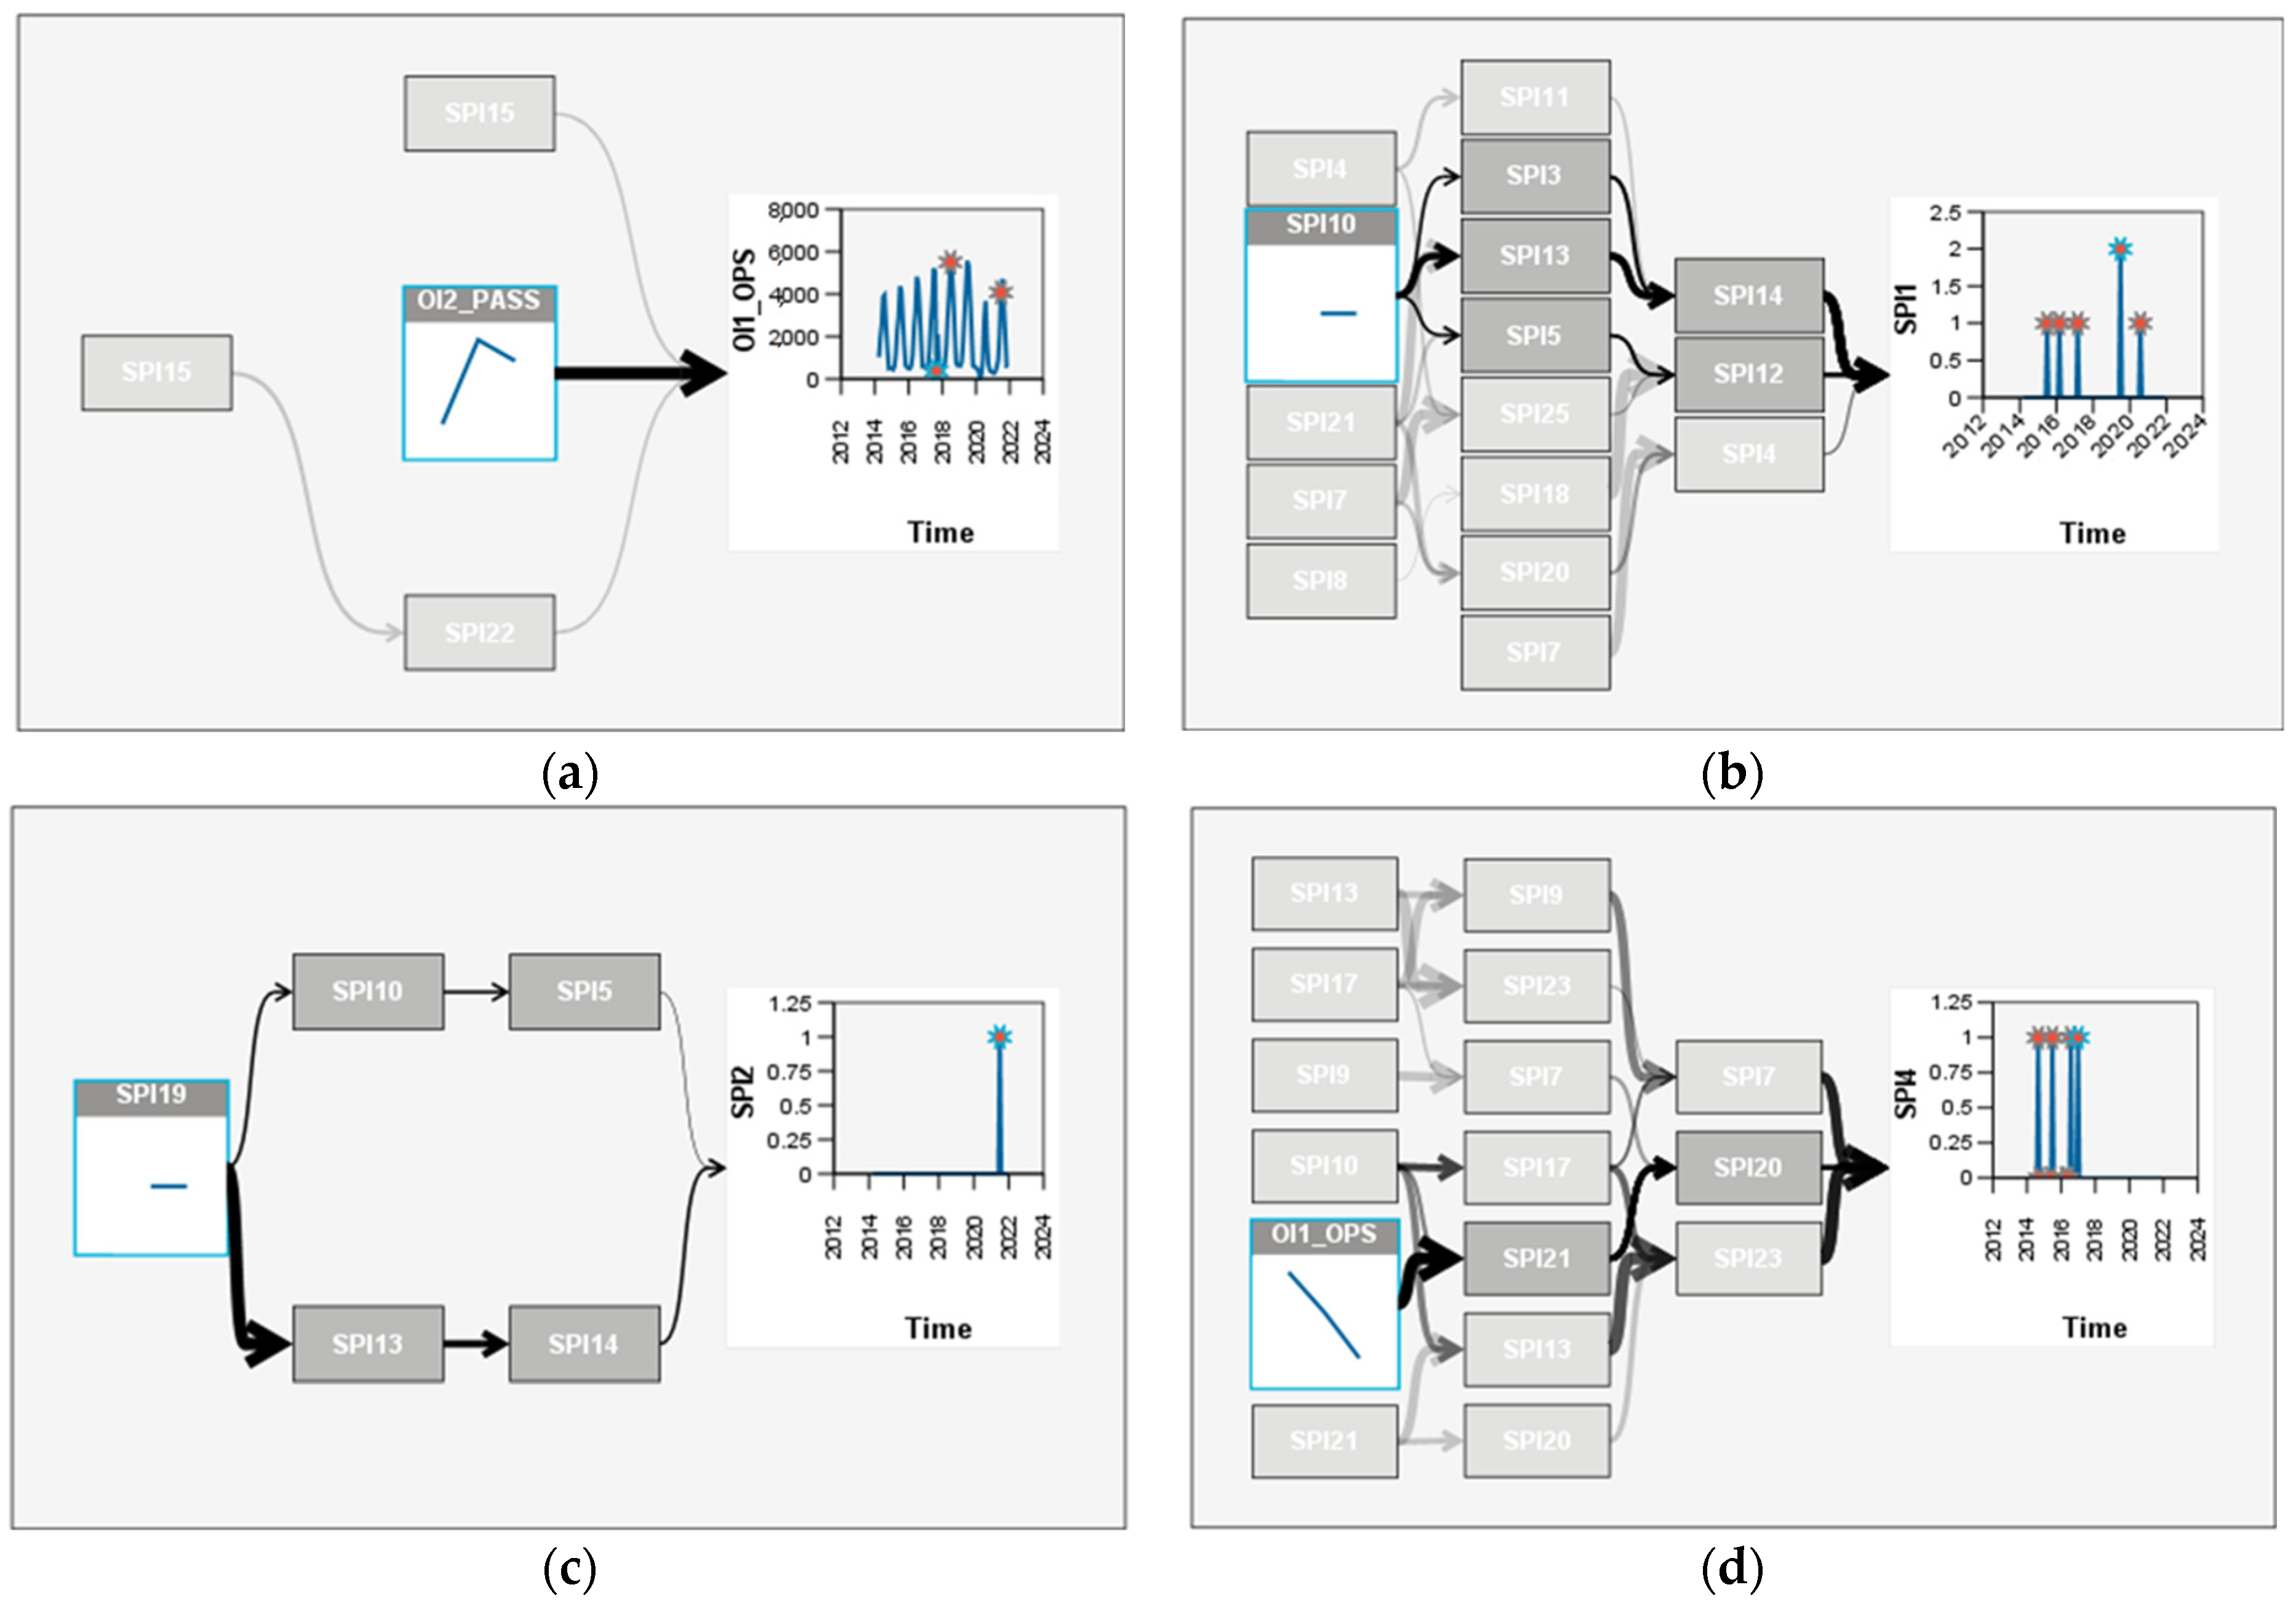
Figure 5 shows two examples of causal relations for individual organizational indicators (OIs) and safety performance indicators (SPIs) at Split Airport, for safety performance indicators SPI7—Number of training deficiencies, and SPI21—Number of occurrences related to ground traffic (GSE) and vehicle driving. Appendix B shows all causal relations for individual organizational indicators (OIs) and safety performance indicators (SPIs) at Split Airport.
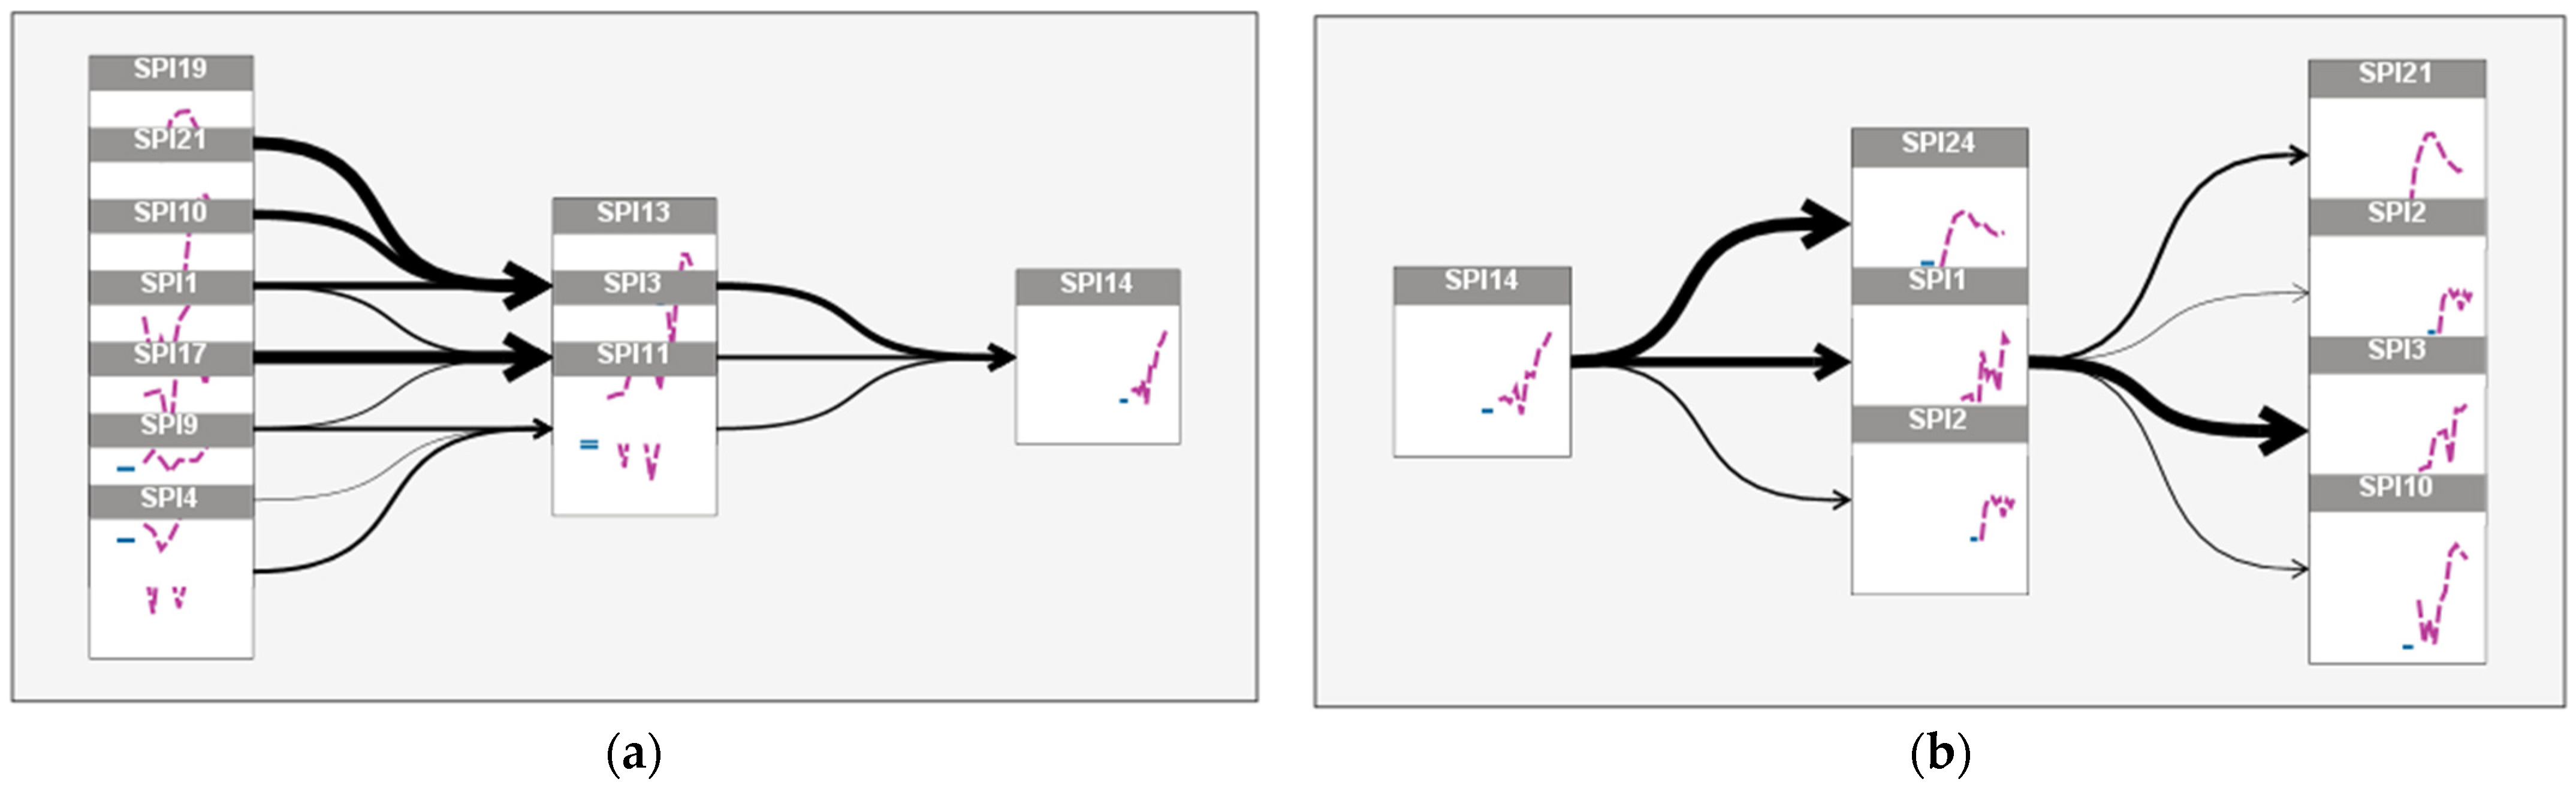
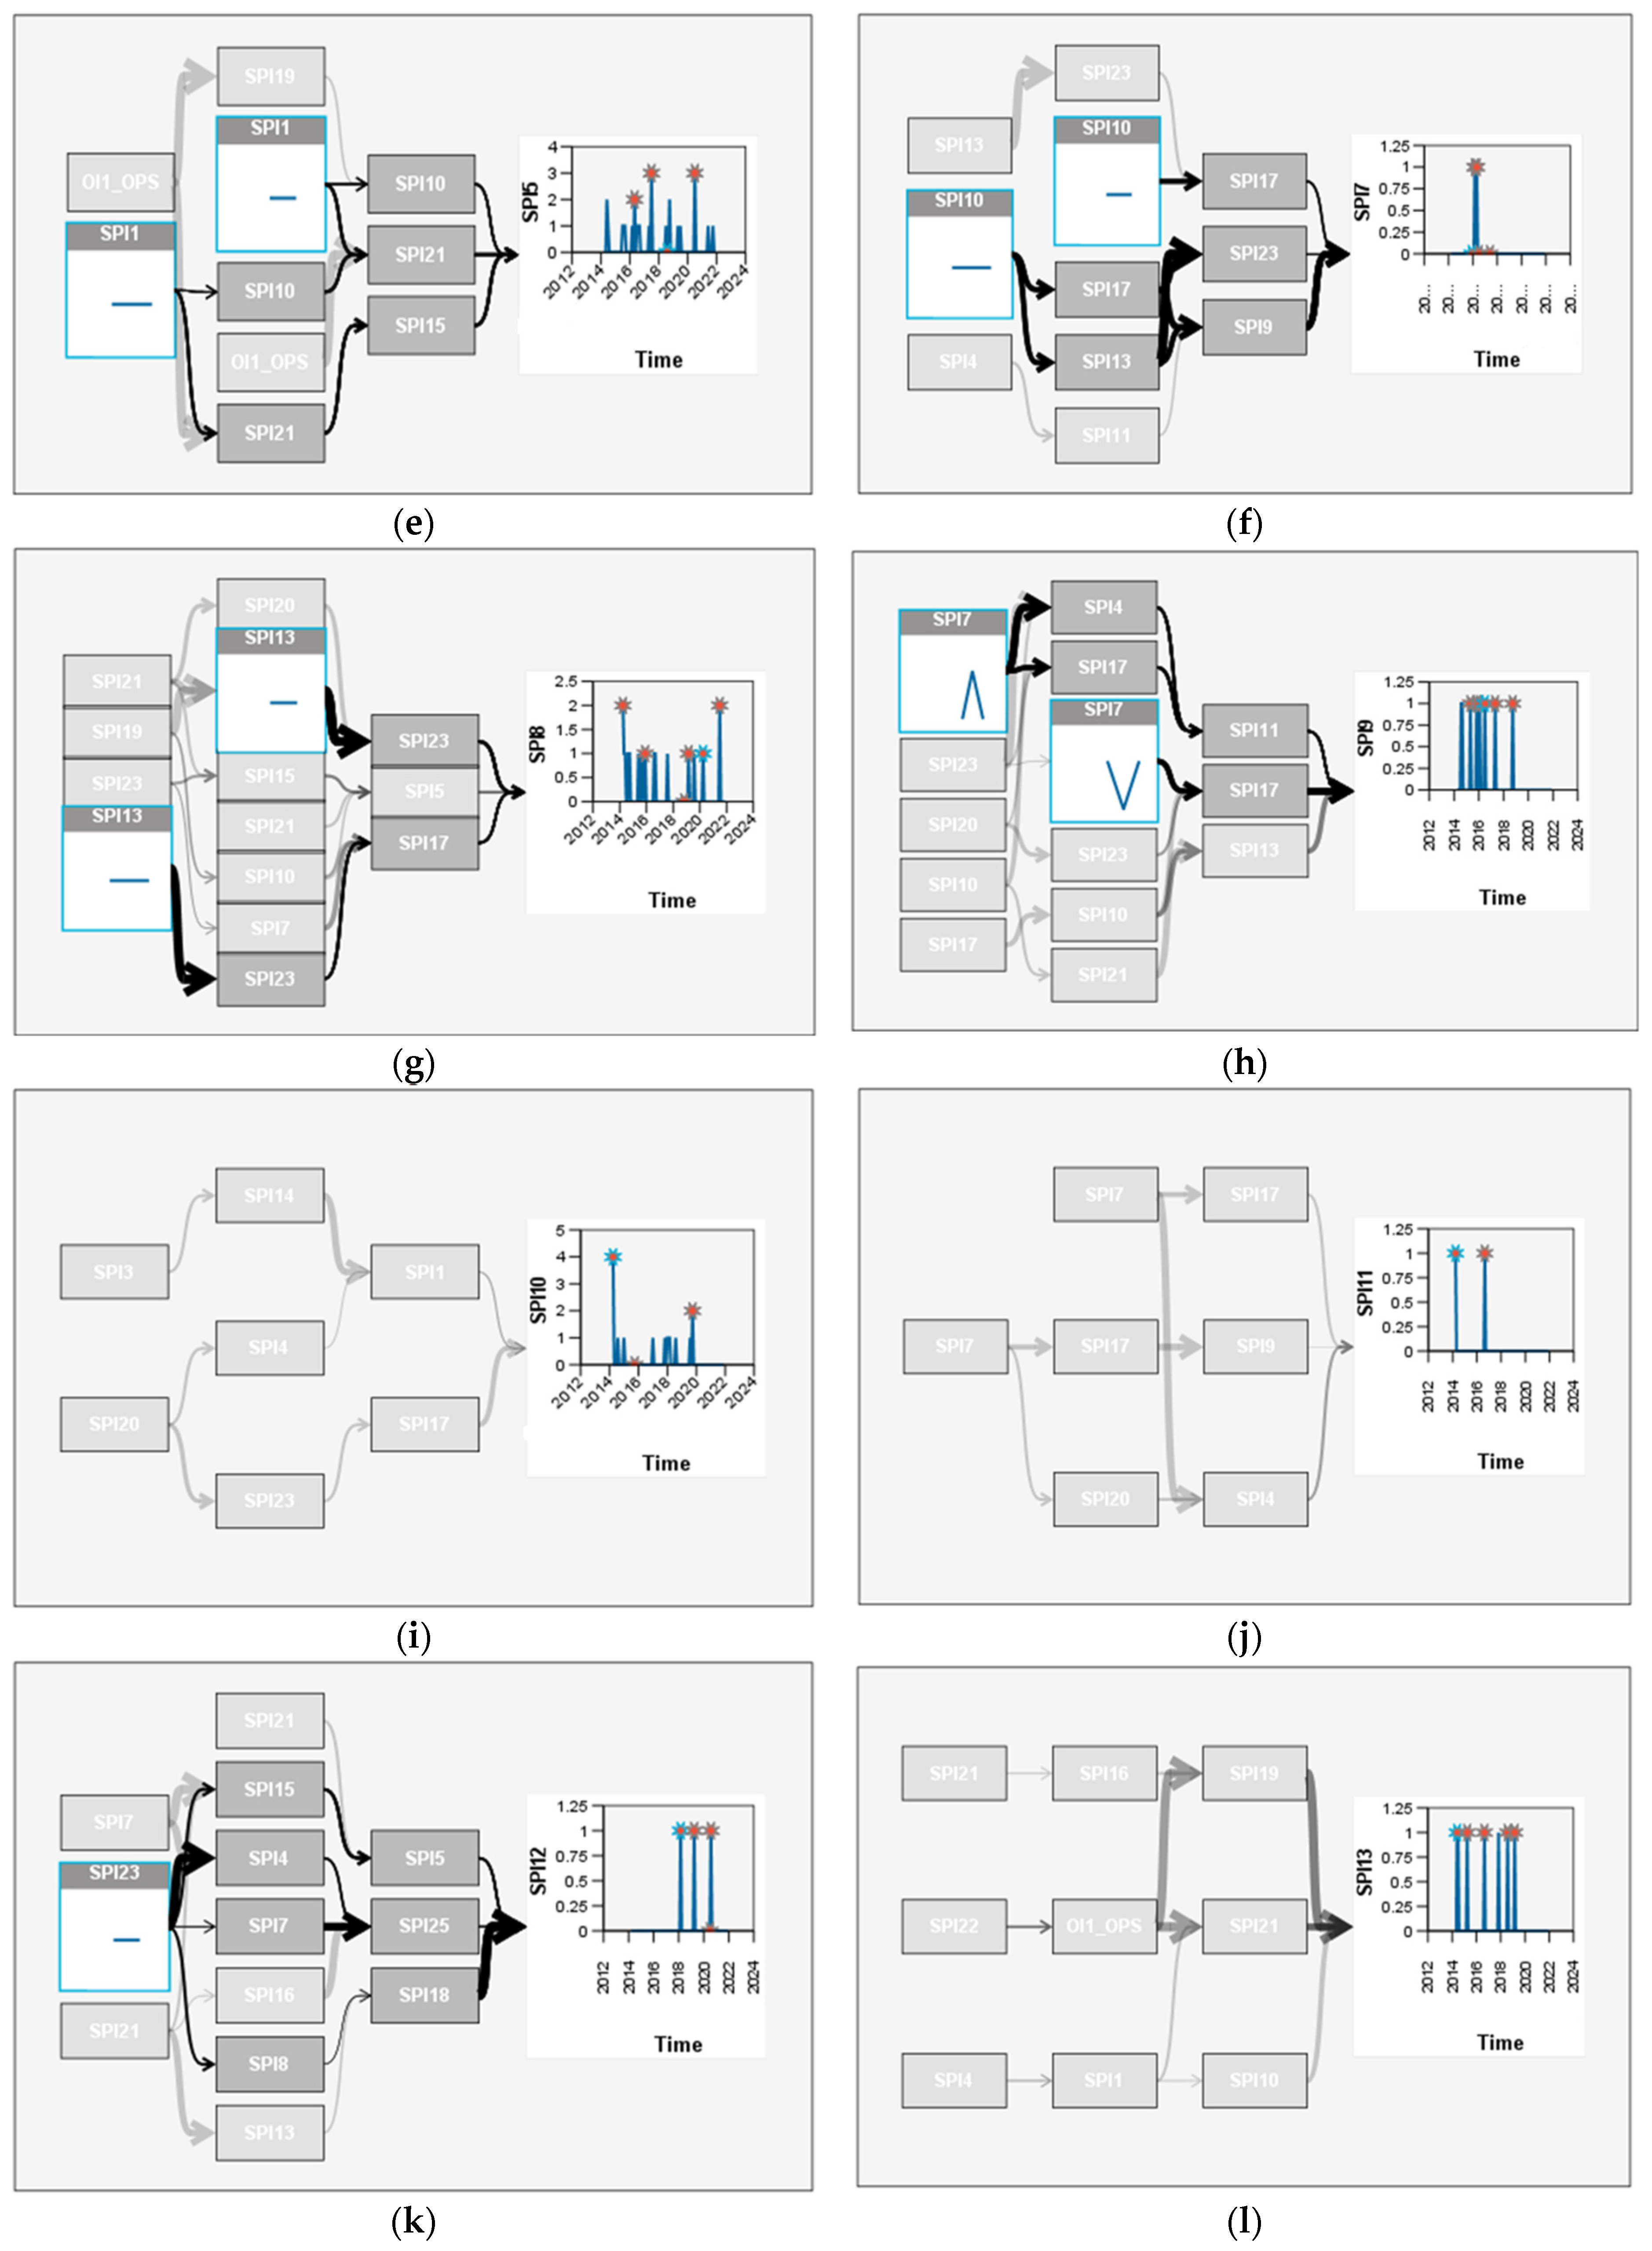
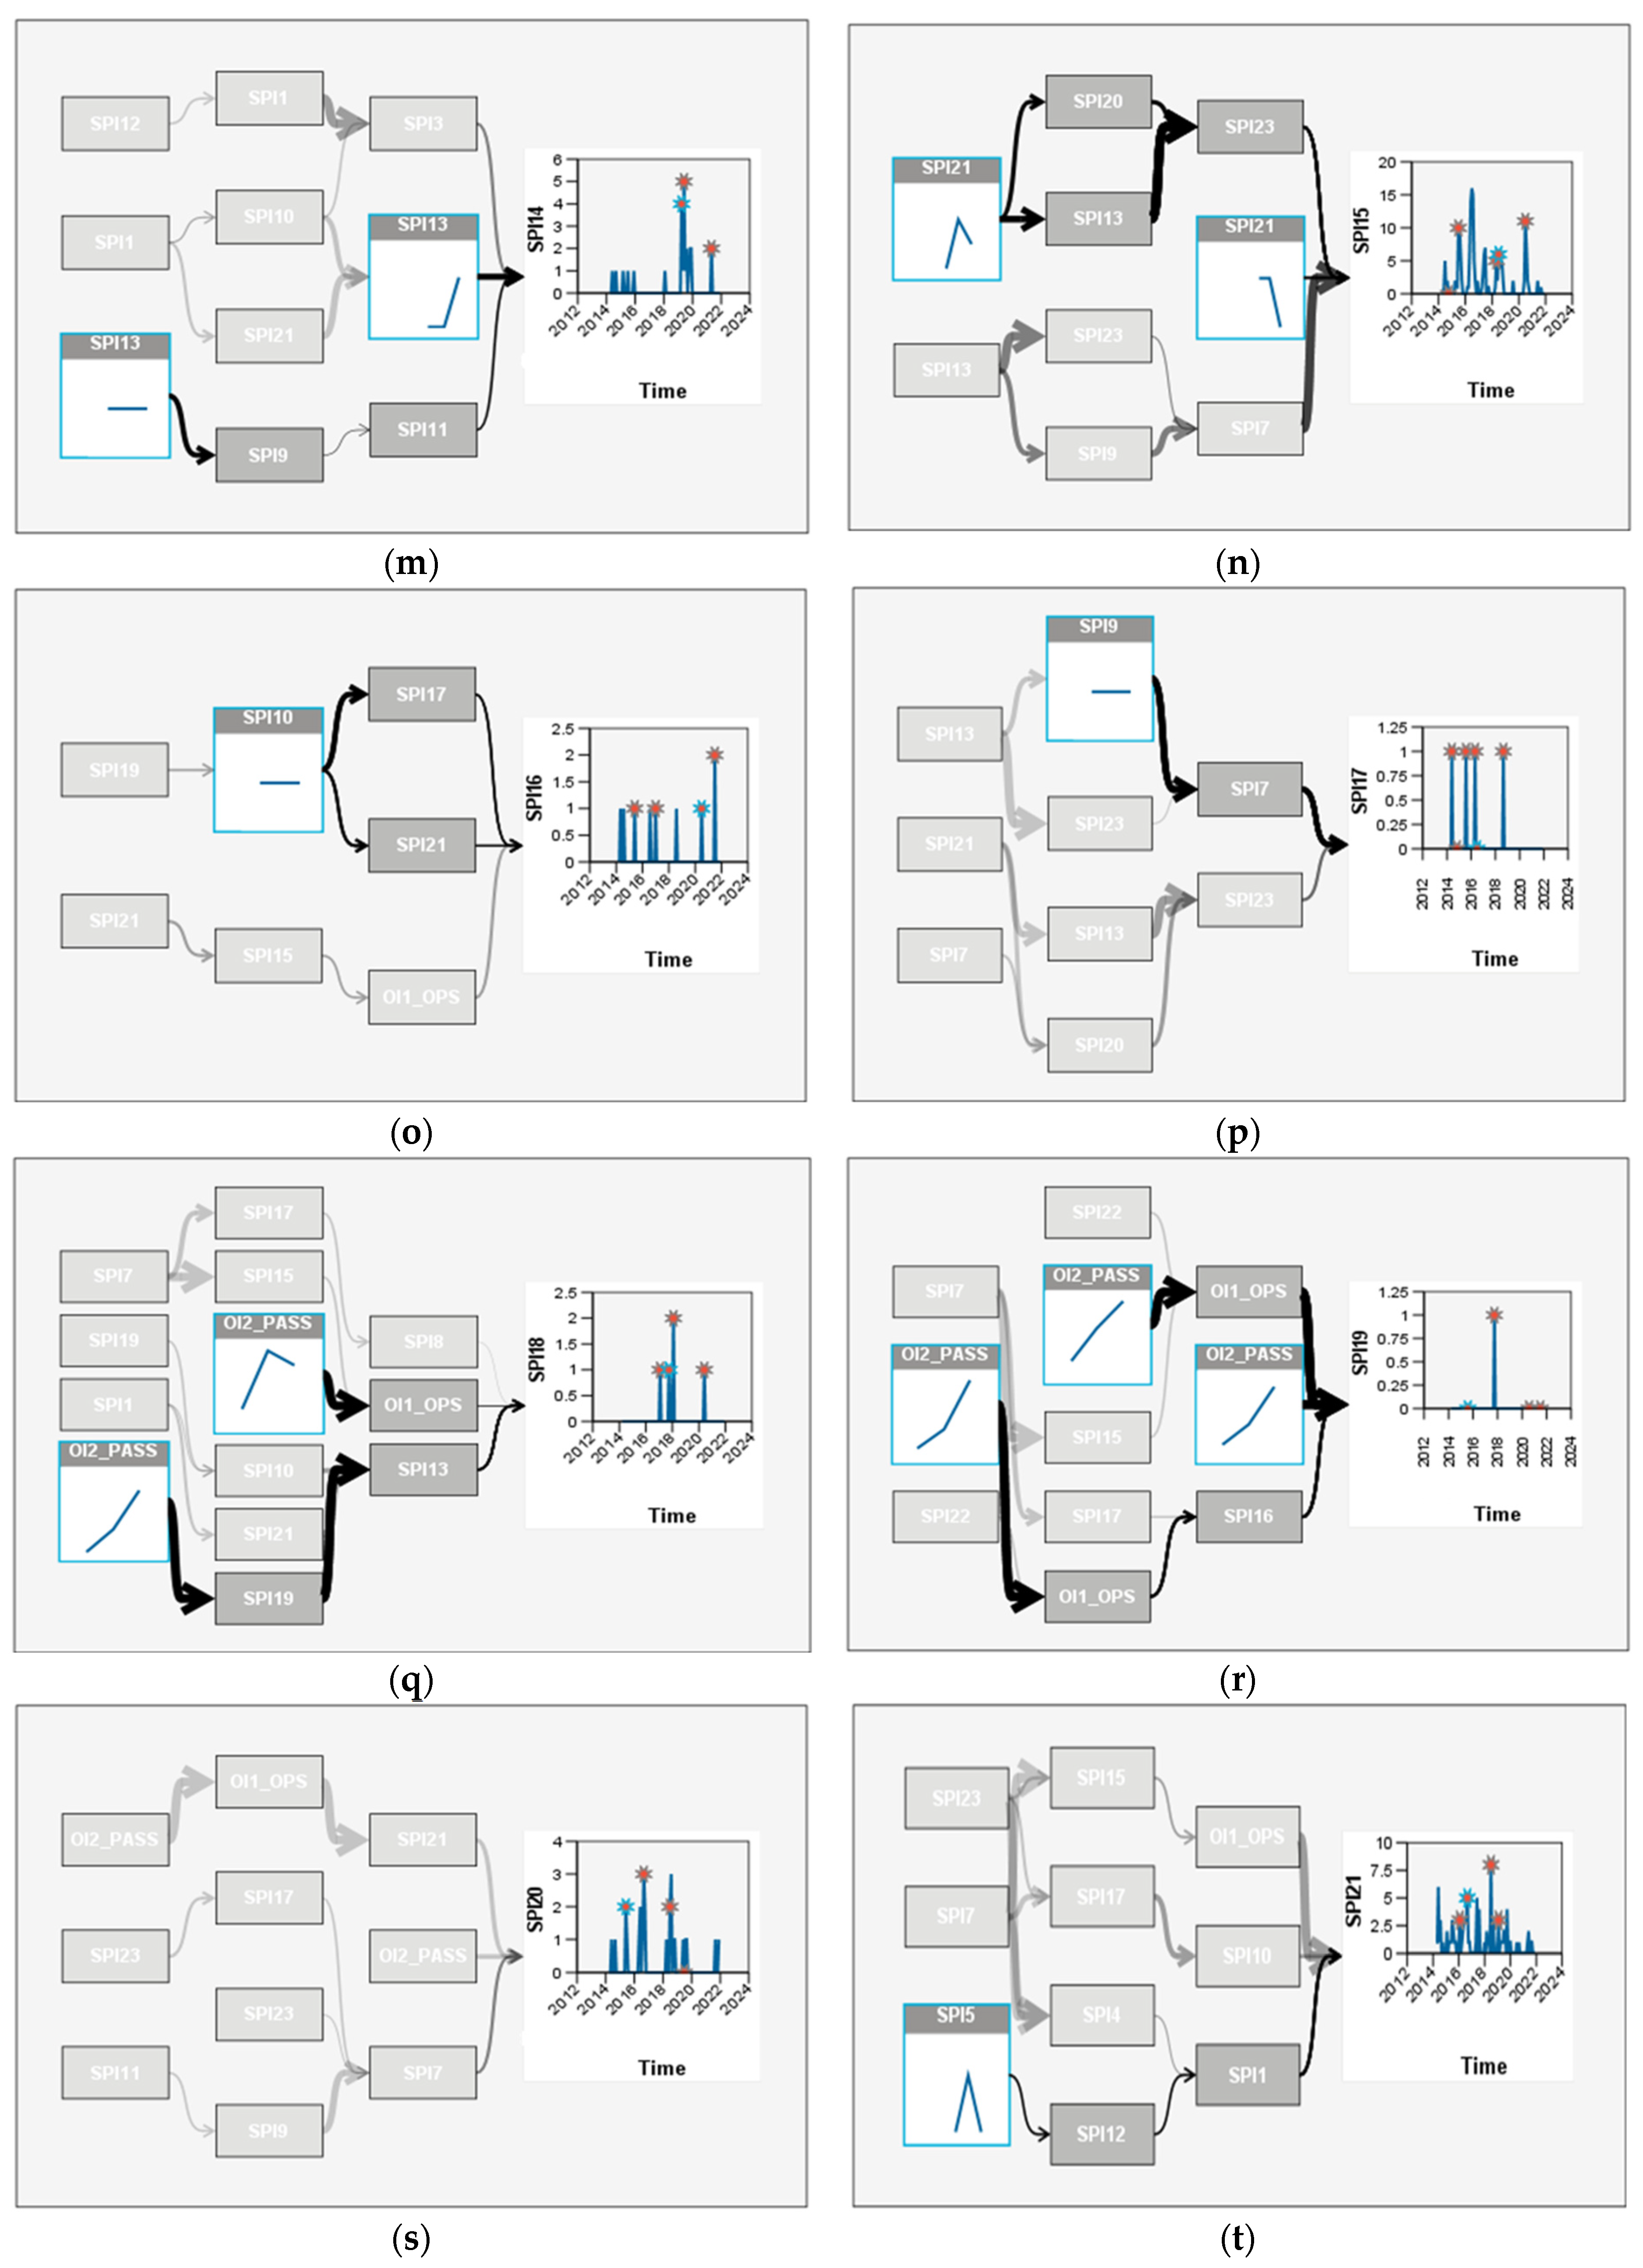
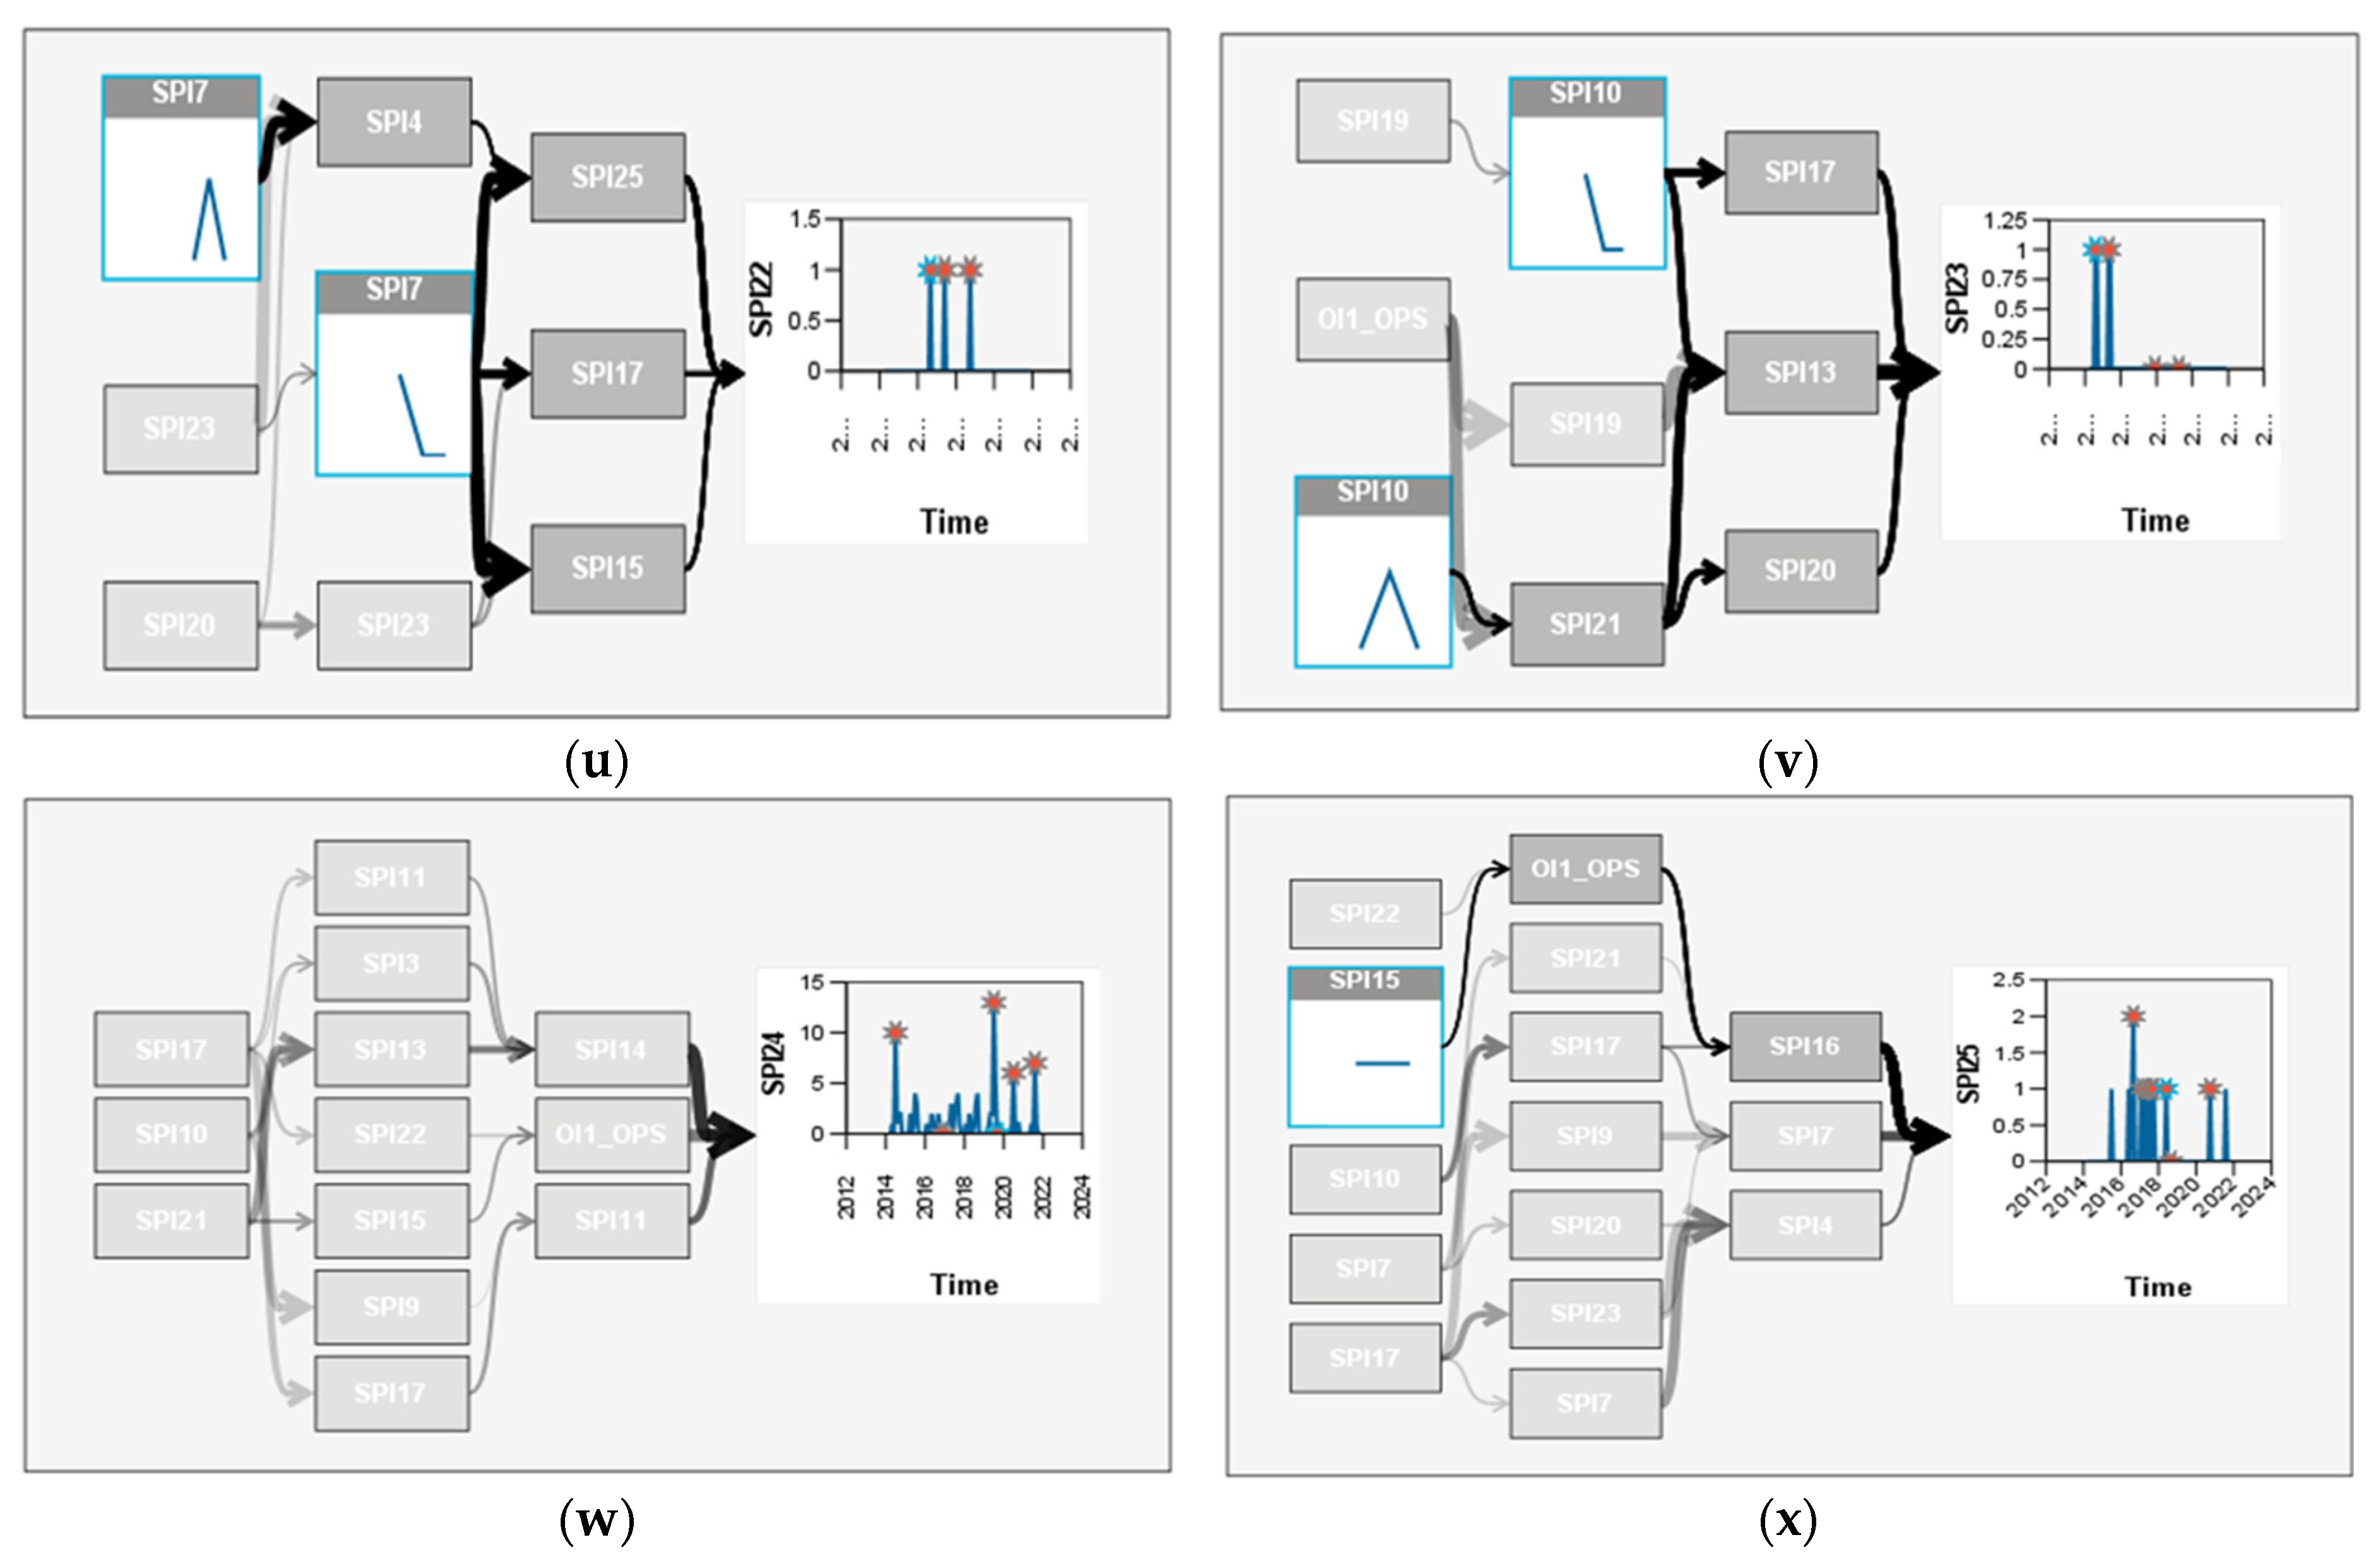
The next step, after the causal model was made, was to examine the relations between indicators, and find which impacts the ones in question; hence, the causal model shows which of the OIs and SPIs impacts safety performance indicators (SPIs). Figure 6 shows an example of an impact diagram of one safety performance indicator (SPI14—Number of occurrences related to FOD presence). Appendix B shows an impact diagram for all indicators in the observed dataset.
4.2. Outlier Root Cause Analysis of Split Airport Safety Performance Indicators
As it can be observed that all SPIs occur in different segments of airport operations at Split Airport, it has been concluded that extreme numbers of occurrences are in fact outliers of each safety performance indicator dataset, which are in fact of most interest to any operator because those extreme values (outliers) are exactly the ones that are of most concern to an operator and exactly the ones any operator wishes to mitigate. Outliers can be very low or very high values that do not fit the pattern in the set of values that some dataset contains.
In this case, the upper (higher) values of outliers will be considered because they represent unwanted occurrences in an organization, i.e., every organization tends to reduce these events to 0 or to the minimum acceptable level (preferably below safety performance targets—SPTs). Hence, applying root cause analysis of outliers (hazardous events or occurrences in the organization) can be very useful to determine which indicators caused these extreme values in order to mitigate or prevent them in the future. Finding causes enables organization to react before hazardous events occur.
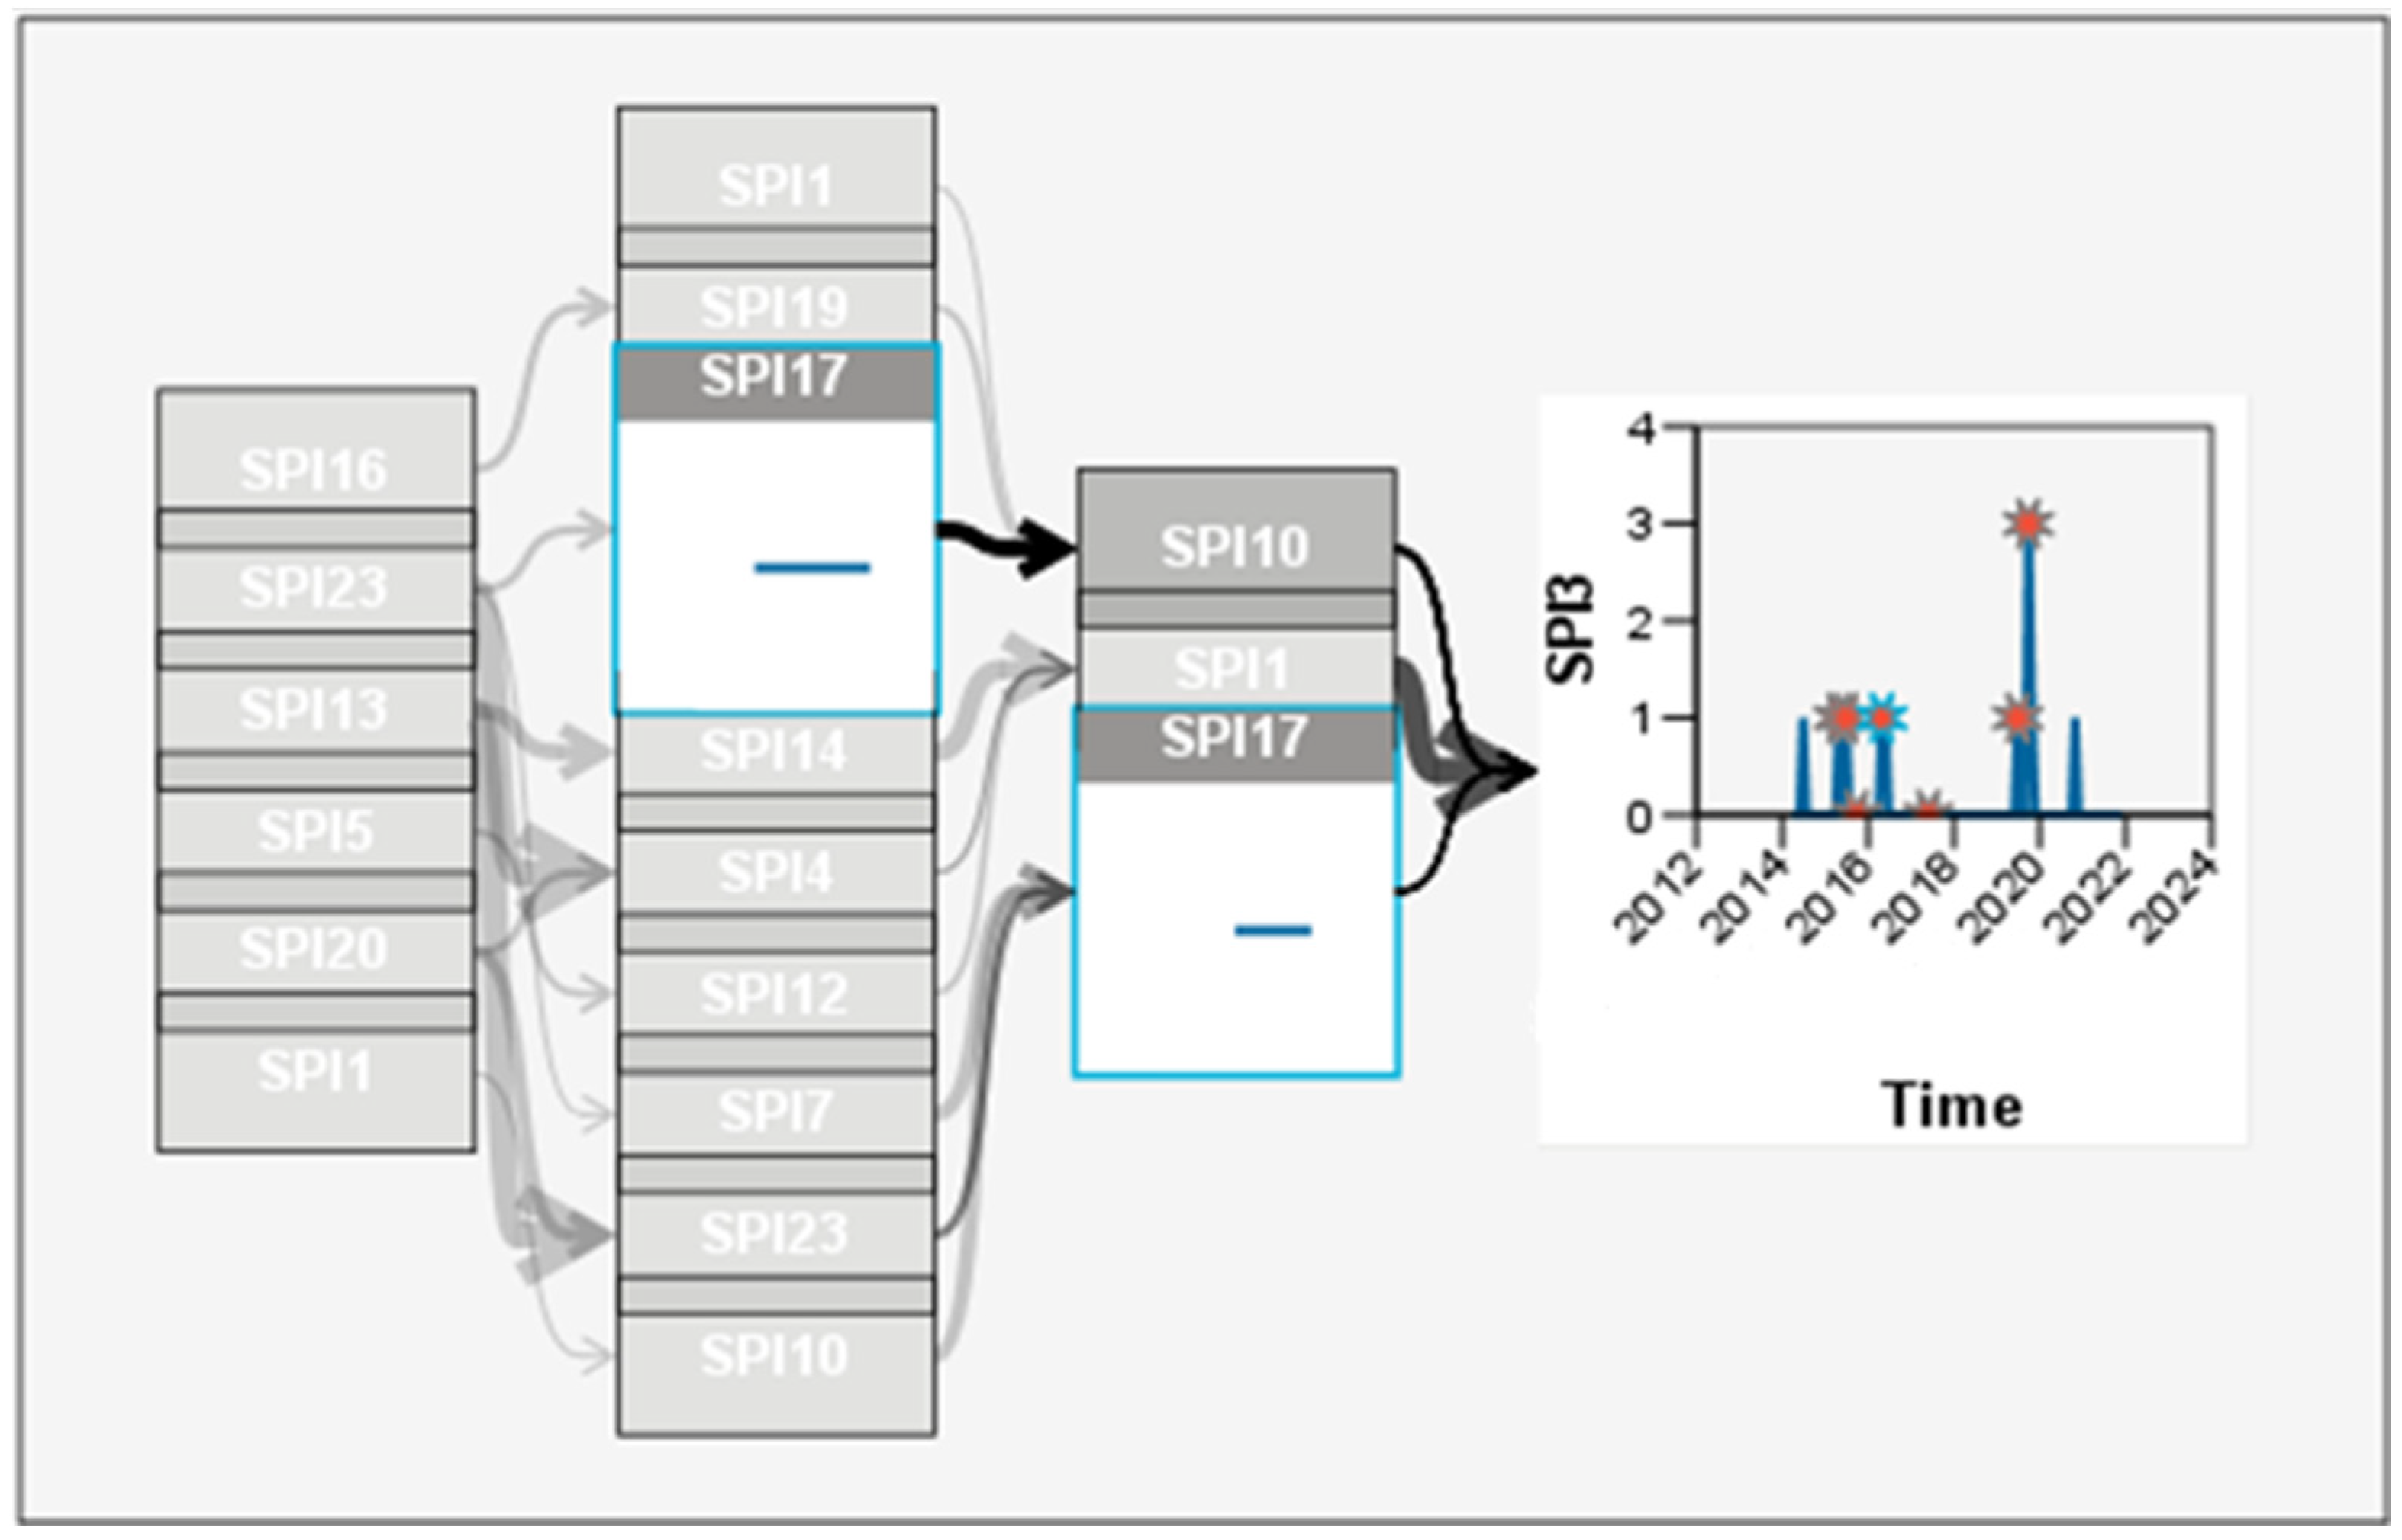
Table 2 shows outlier root cause analysis for one example of a safety performance indicator (SPI3—Number of dangerous goods incidents), conducted using IBM SPSS Statistics 27, function “Outlier Root Cause Analysis”. Five outliers were detected in May 2015, July 2015, May 2016, July 2019, and October 2019. It can be observed that SPI3 was detected to be higher in May 2015 because of SPI16—Number of occurrences related to passenger handling—disembarking/embarking, in July 2015 because of SPI23—Number of engine start-up incidents, in May 2016 because of SPI17—Number of occurrences related to personal protective equipment, in July 2019 because of SPI1—Number of occurrences related to LIRF and loadsheet crosscheck, and in October 2019 because of SPI13—Number of aircraft marshalling occurrences.
Figure 7 shows graphically which indicators caused SPI3, and points out the strongest cause among them, which is SPI17—Number of occurrences related to personal protective equipment.
Details on every outlier root cause analysis for each safety performance indicator can be found in the Appendix C.
It is important to emphasize that some disruptive events (outliers), such as COVID-19 or war, as previously mentioned, can impact the organizational safety performance by causing discontinuities in the operating environment. Root cause analysis can help map out some causal factors impacting safety performance, but not all of them. However, any additional information about the causal relations can help improve safety performance in some respects. This can be applied to organizations with a rather stable set-up of their processes and operations, as presented in the following examples from Split Airport.
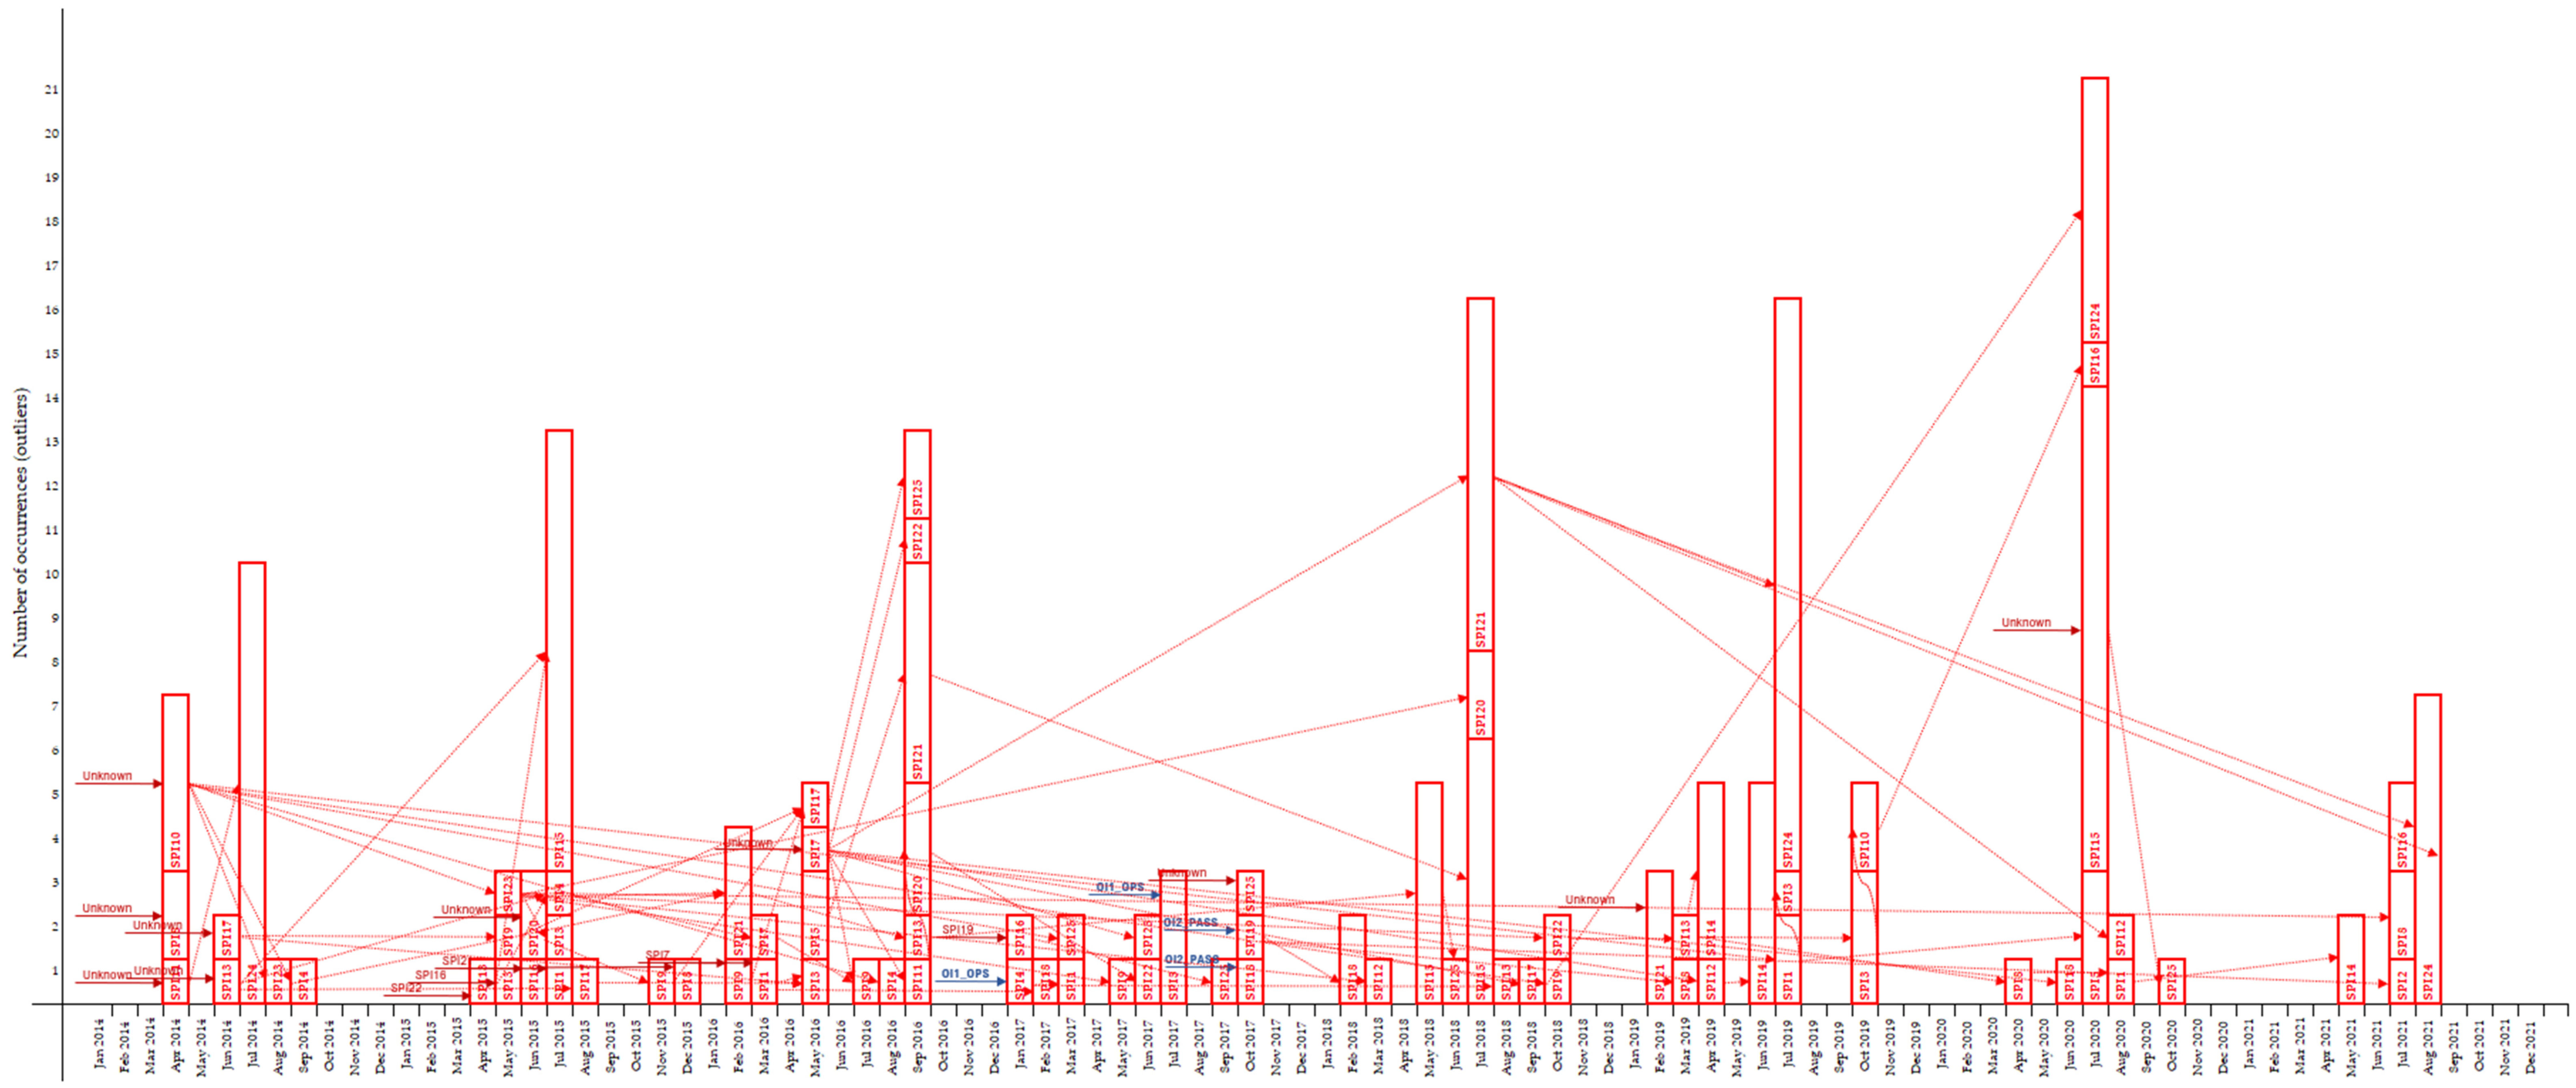
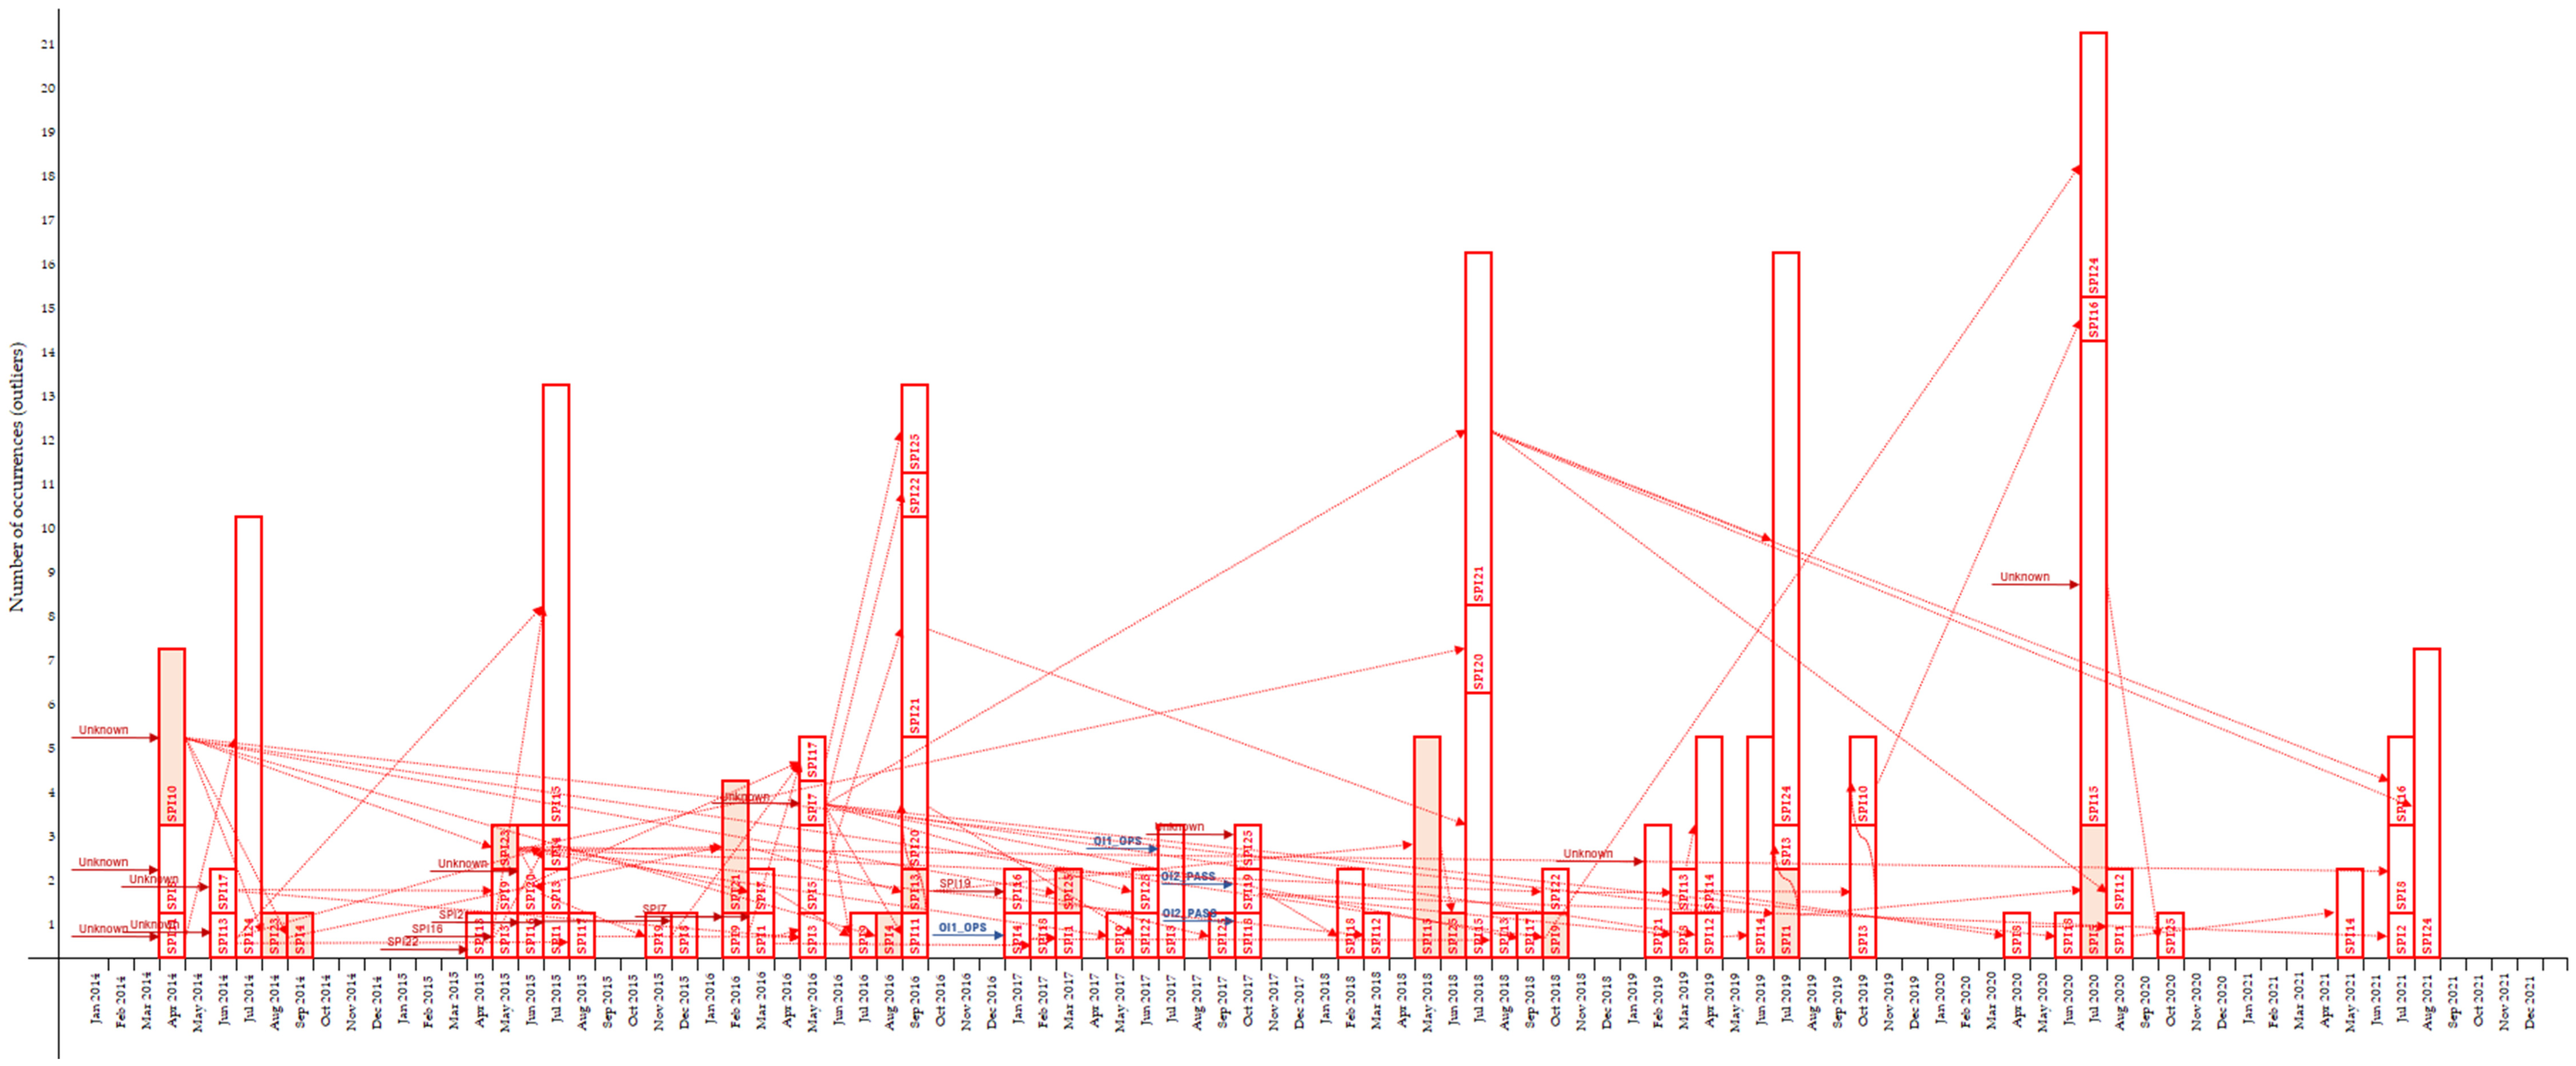
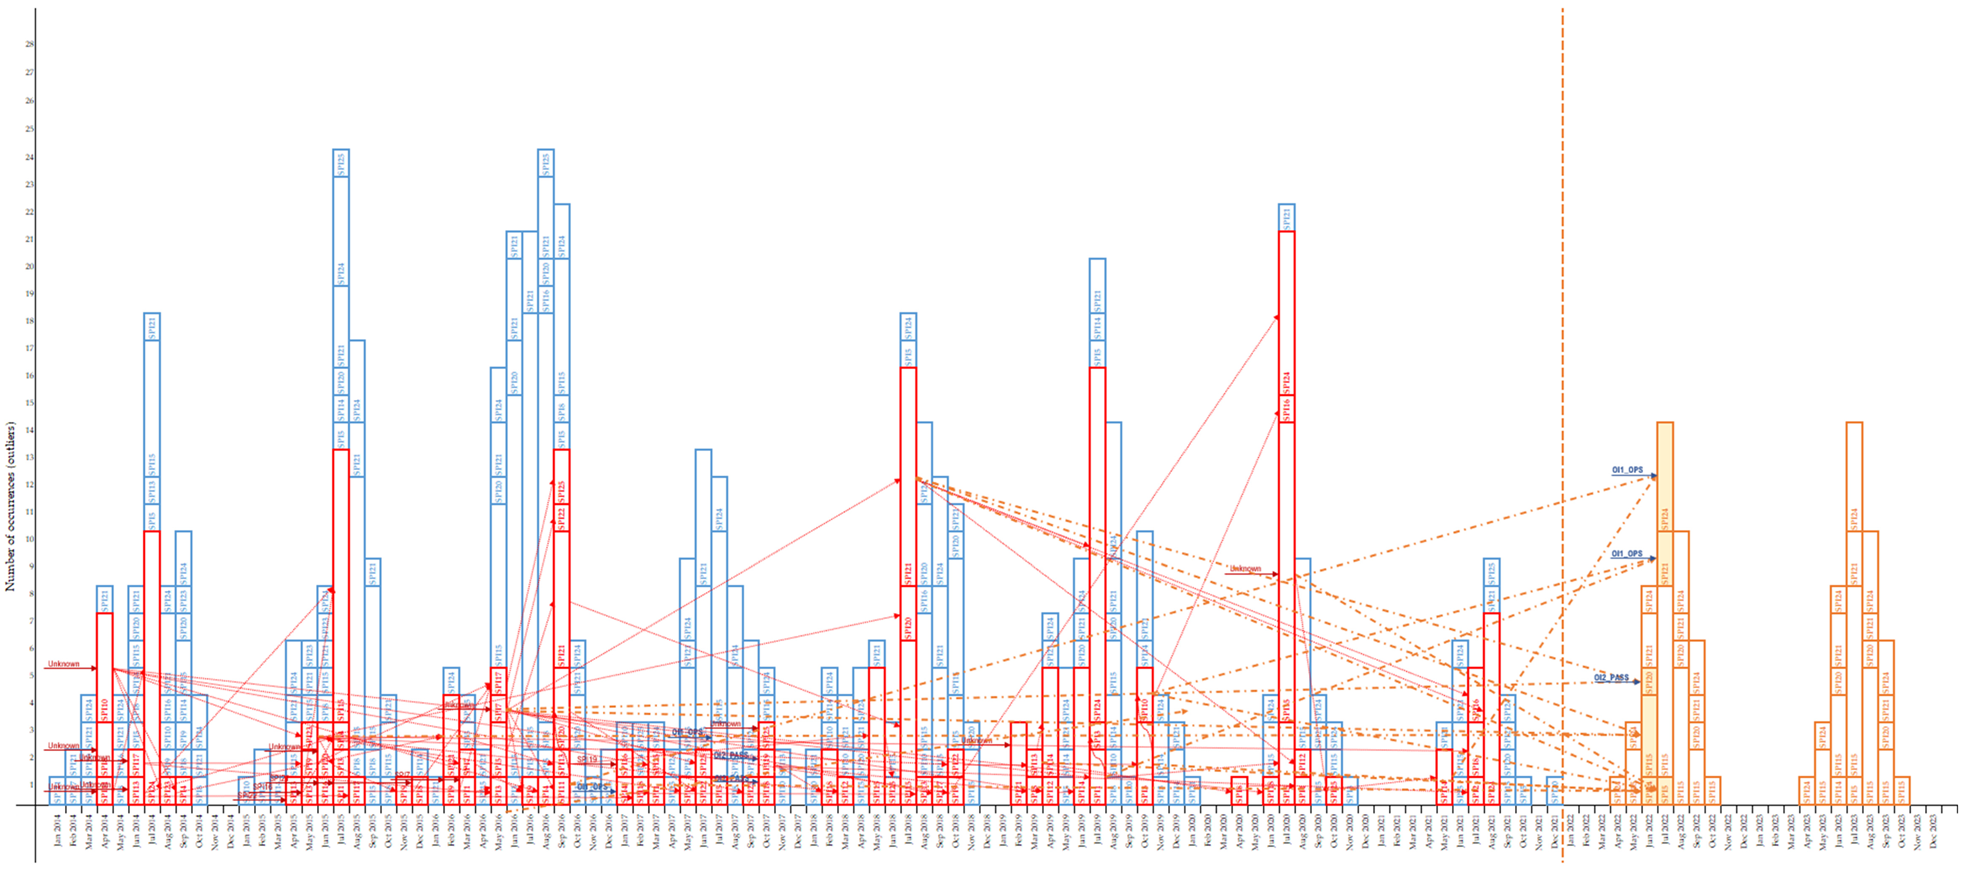
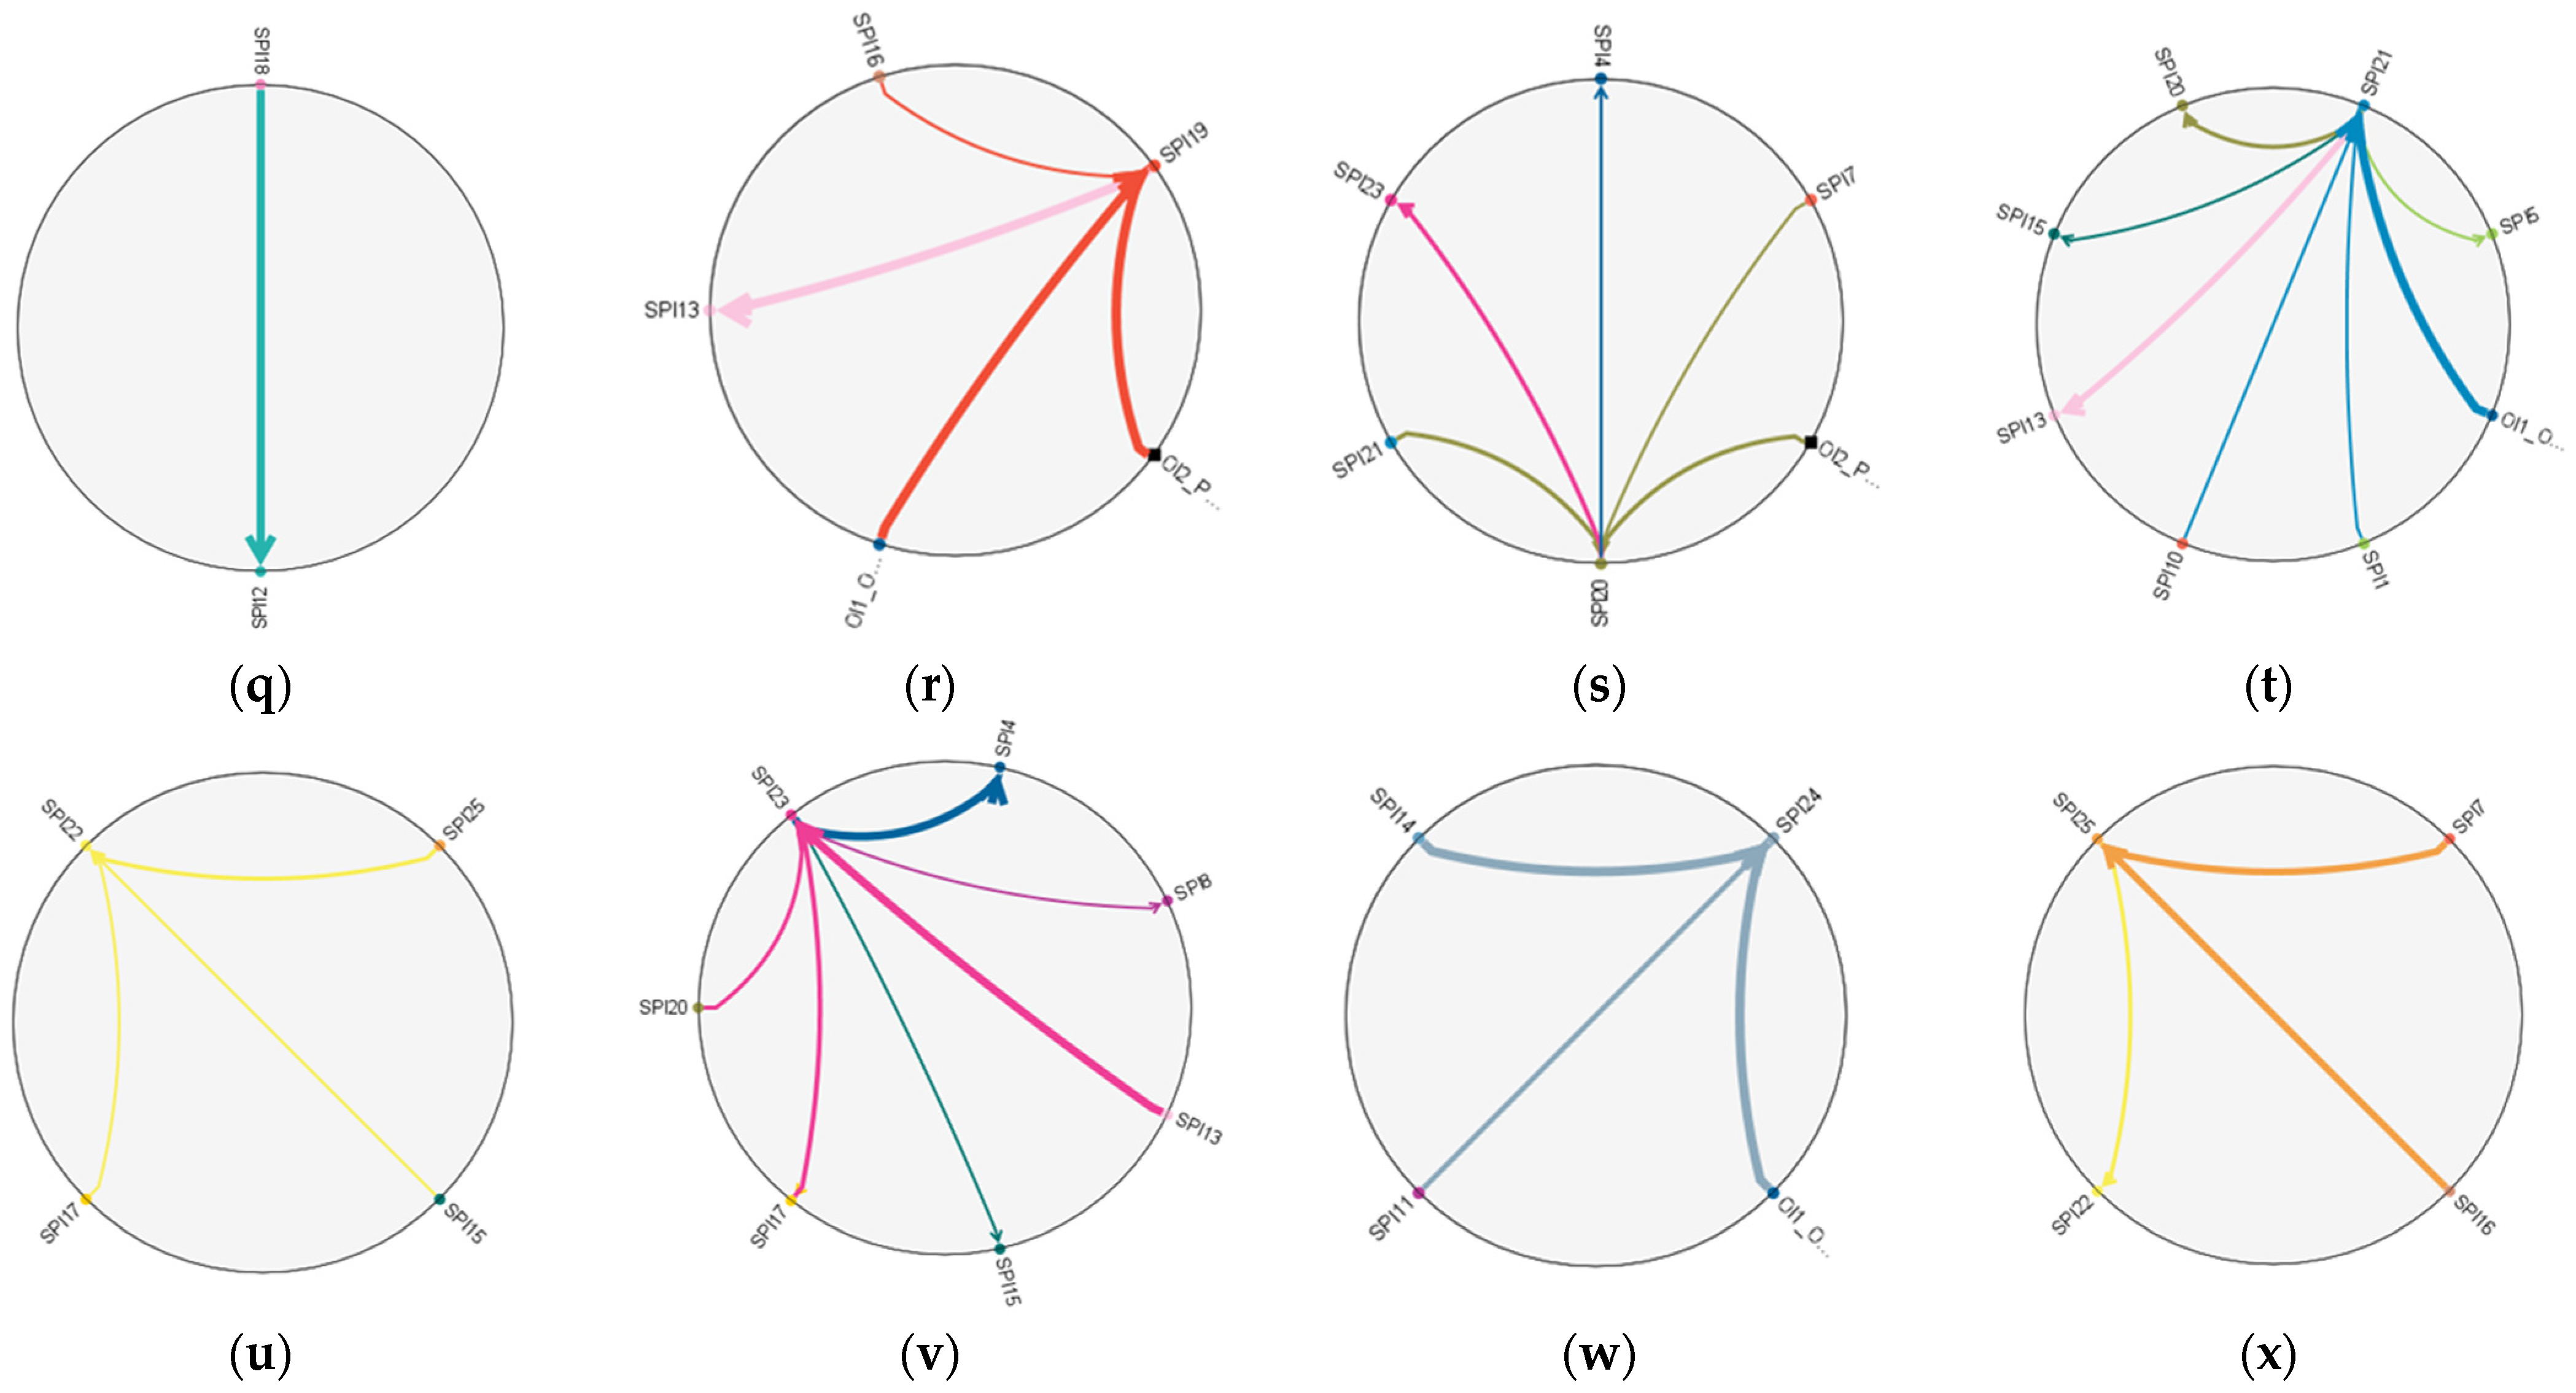
Figure 8 shows graphically the events which occurred over the observed time period from January 2014 to December 2021. The Figure shows all events (outliers) and their causes (the events that influenced them). It can be observed how previous events that occurred impacted the following, hence the connections that can be made between occurrences.
Figure 9 shows graphically the events which occurred over the observed time period from January 2014 to December 2021, caused by safety performance indicator SPI10—Number of occurrences related to maneuvering area maintenance, i.e., using events (incidents) related to maneuvering area maintenance. It can be observed that events related to maneuvering area maintenance (SPI10) affected events related to LIRF and loadsheet crosscheck (SPI1), events related to aircraft damage (SPI4), events related to vehicle maintenance (SPI9), events related to engine start-up (SPI23), and events related to fuel handling (SPI25), etc.
Hence, due to this analysis it can be concluded that introducing mitigating measures related to maneuvering area maintenance will positively reduce probability of adverse events in LIRF and loadsheet crosscheck procedures, in vehicle maintenance, reduce probability of aircraft damage or events related to engine start-up and fuel handling.
4.3. Forecasting of Split Airport Organizational and Safety Performance Indicators
In this part of the research, forecasts for each safety performance indicator are made, using the IBM SPSS Statistics 27 software. Forecasting of indicators is conducted using function Expert Modeler and Forecasting using Temporal Causal Model.
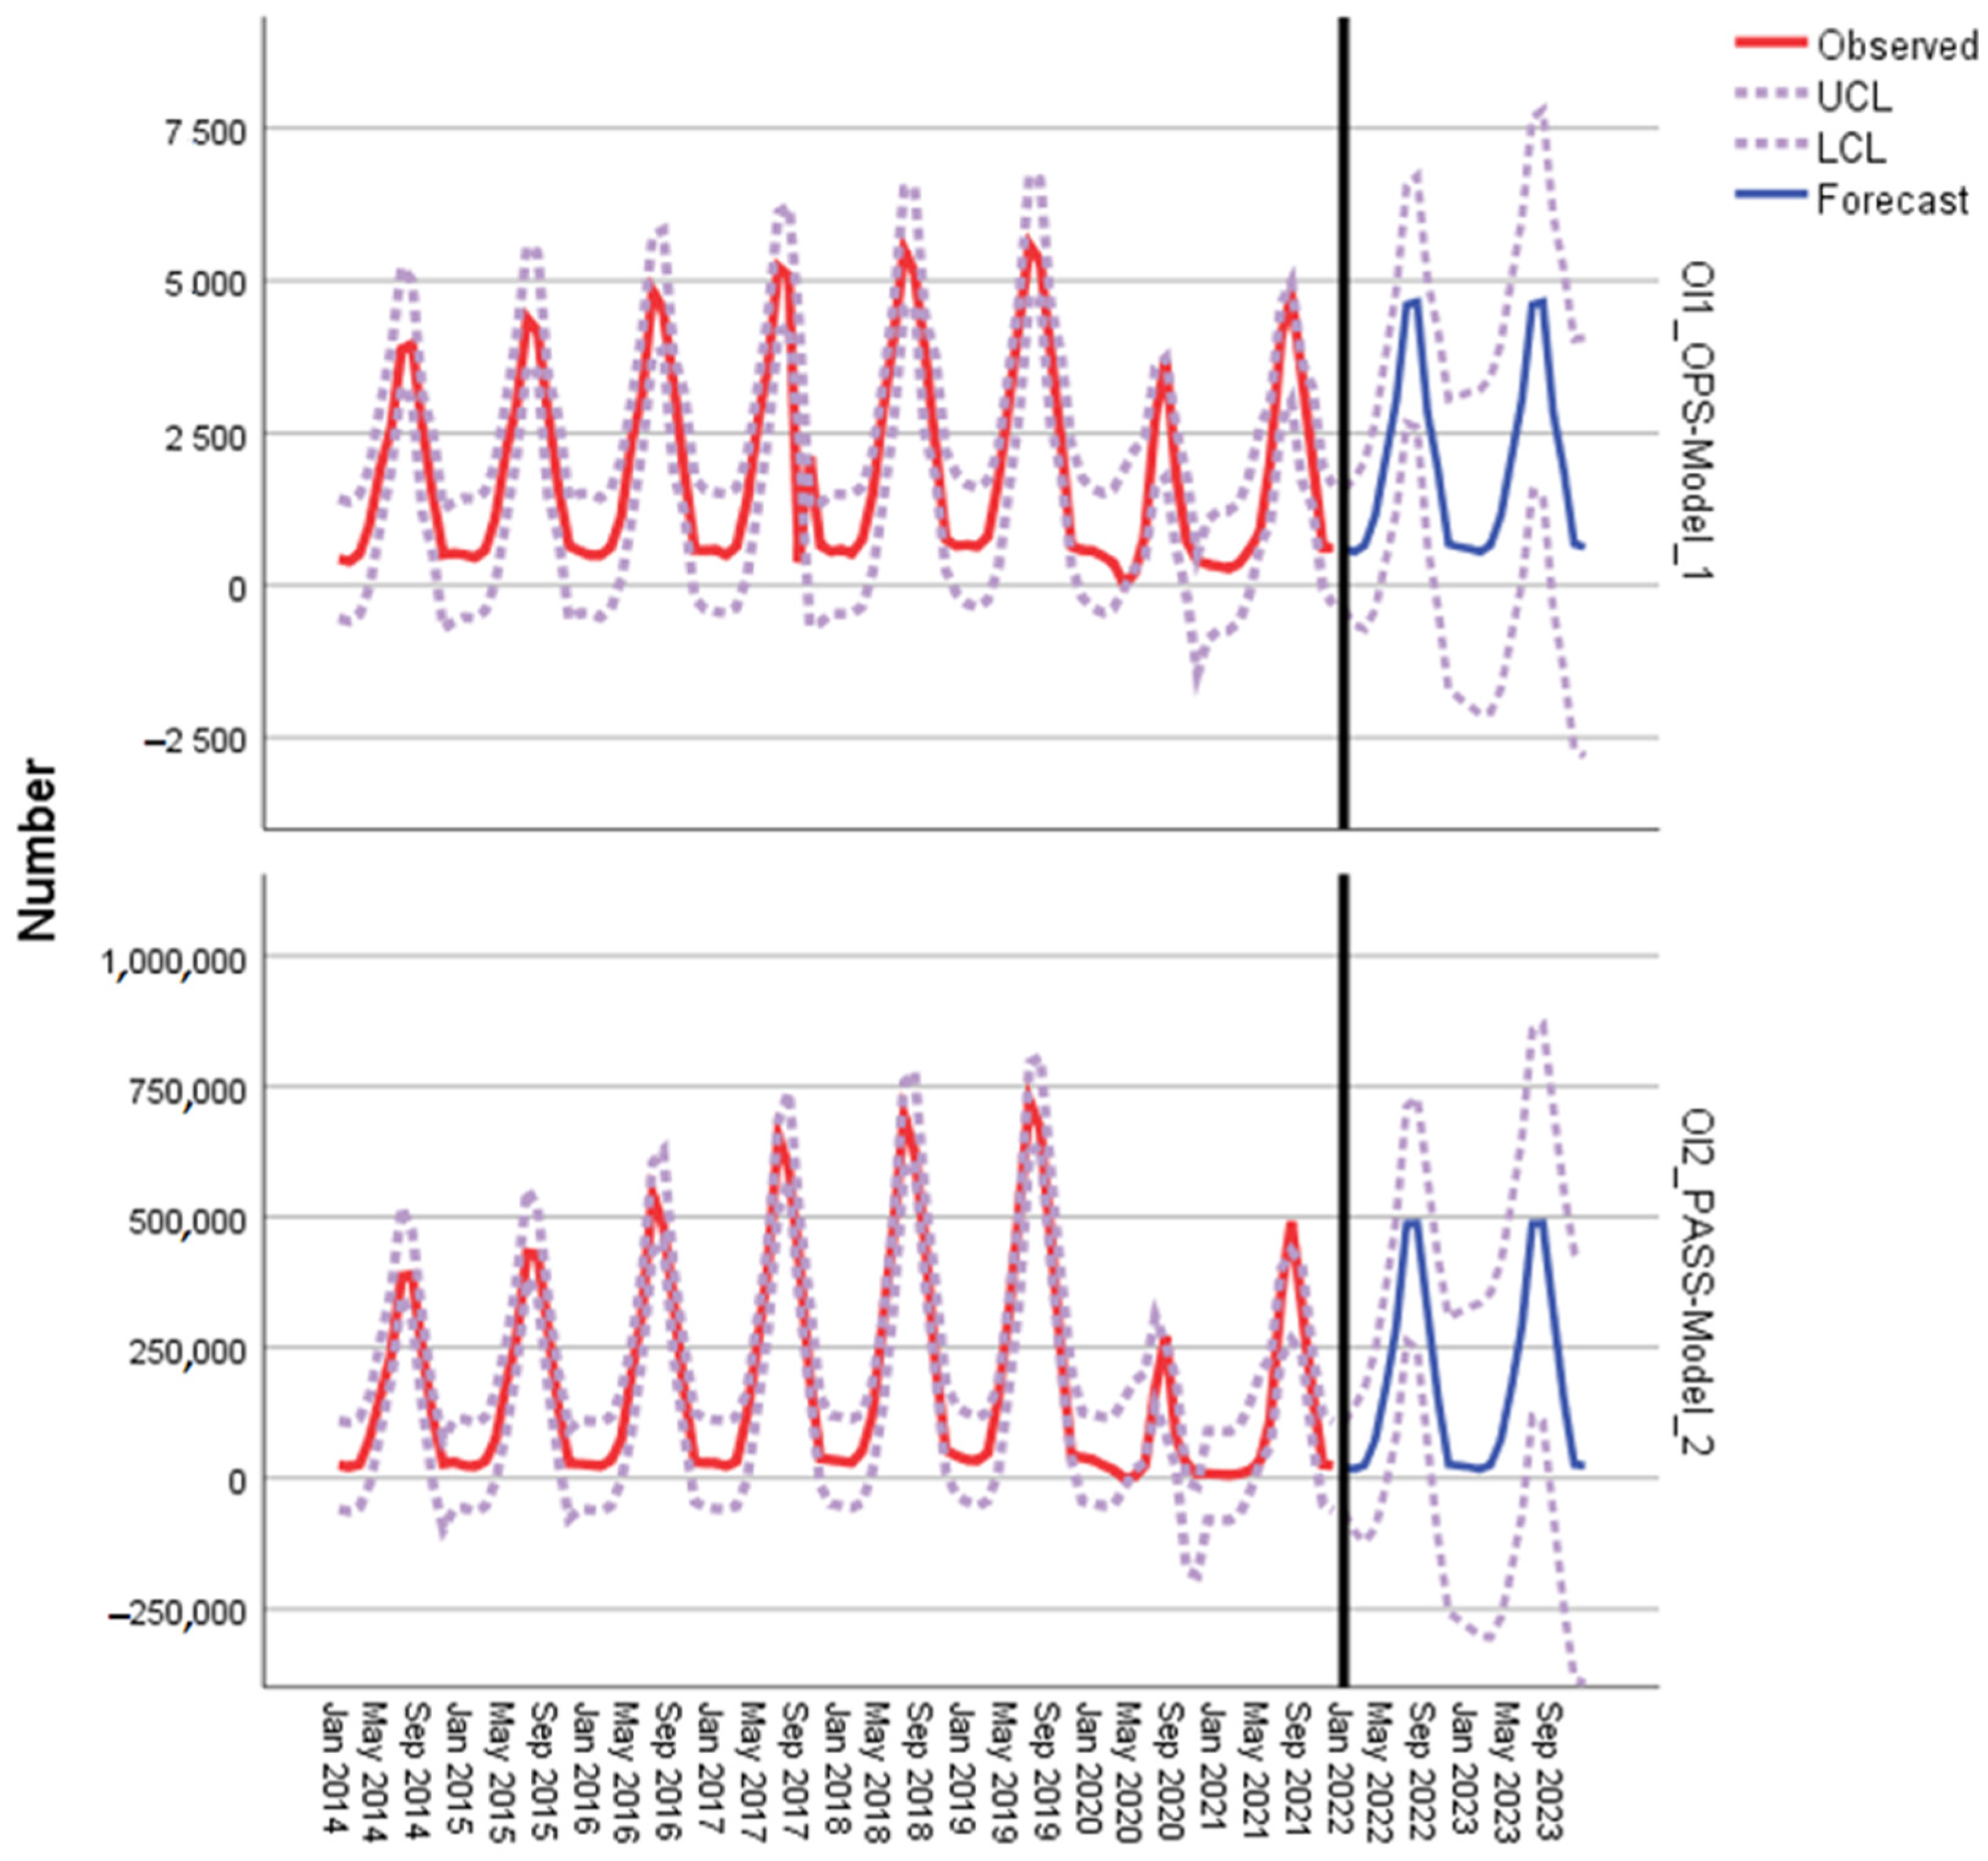
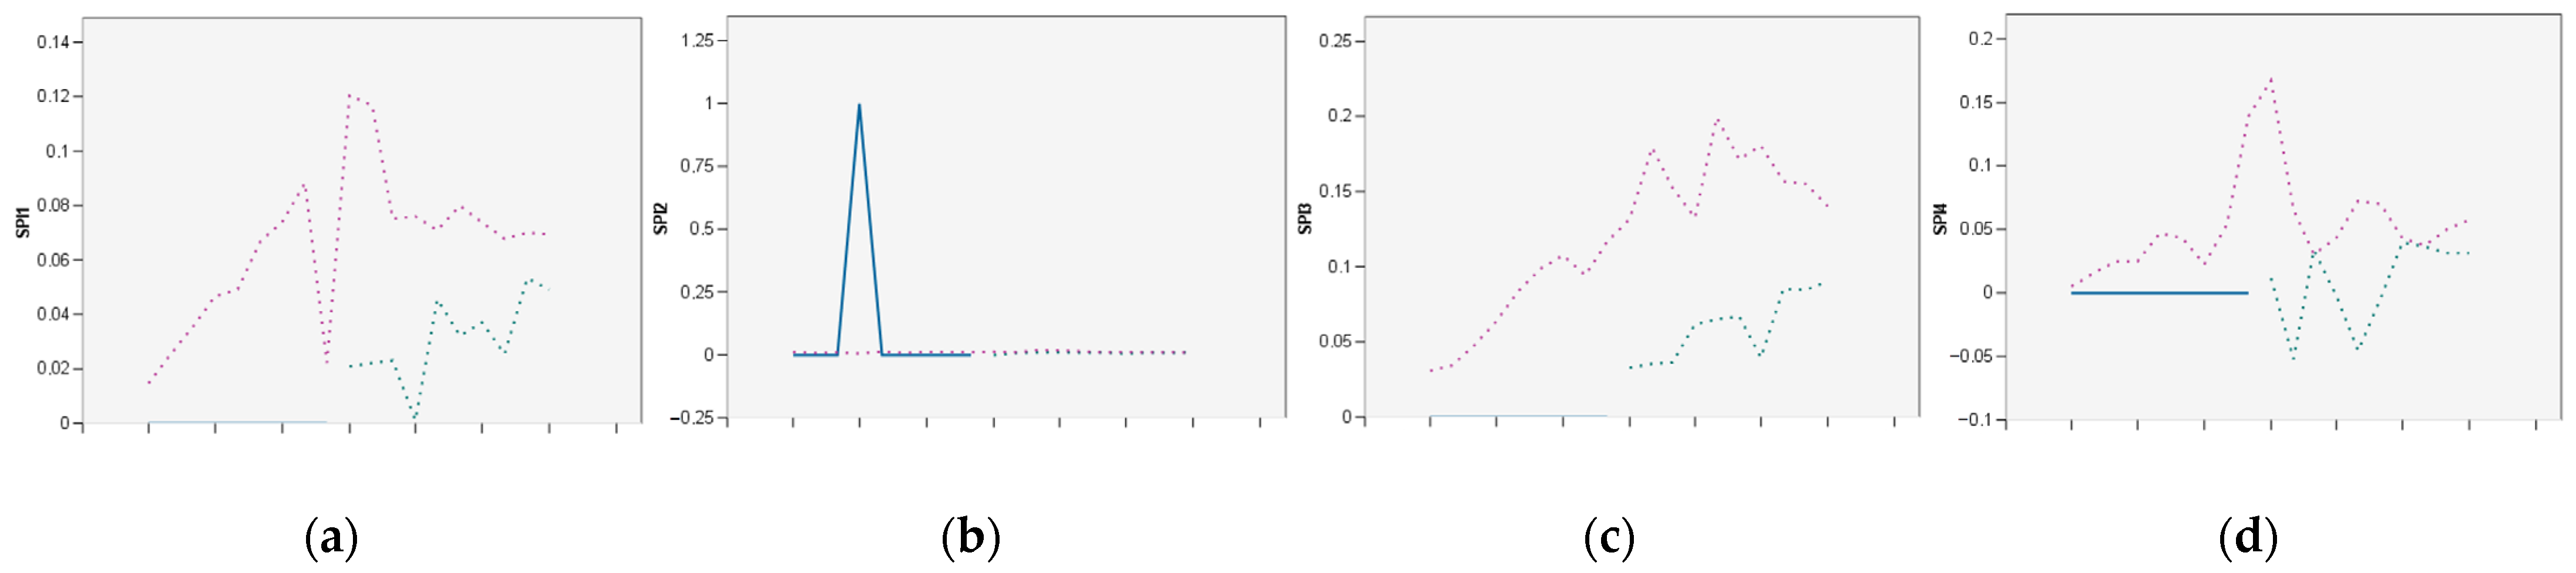
Figure 10 shows forecasted values for organizational indicators in an observed dataset from Split Airport, i.e., OI1—Number of aircraft operations and OI2—Number of passengers, using IBM SPSS simple exponential forecasting method with seasonal component. Details on forecasted values of organizational indicators can be found in the Appendix D.
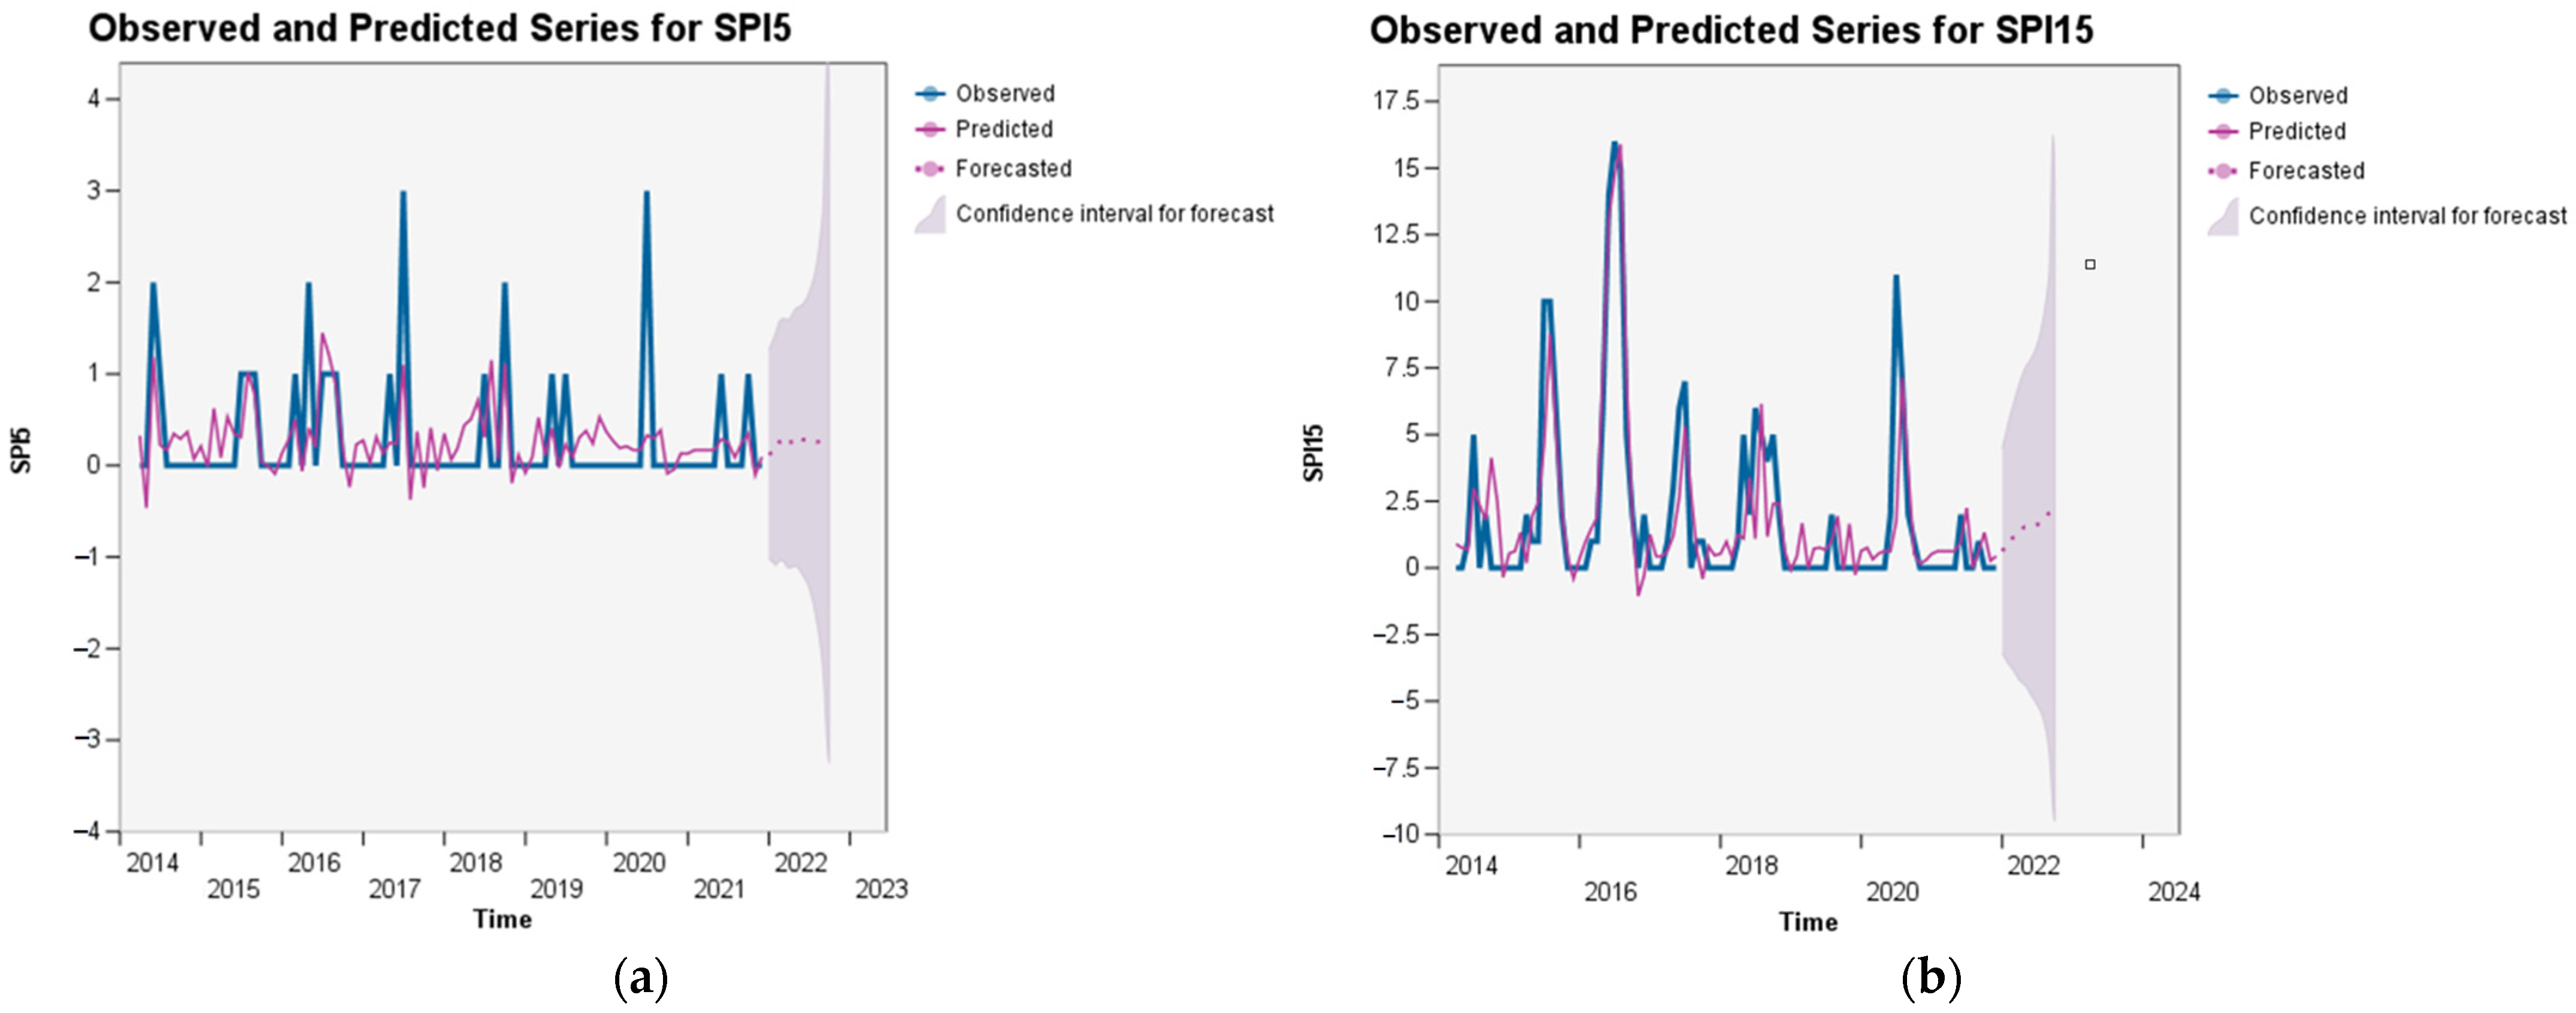
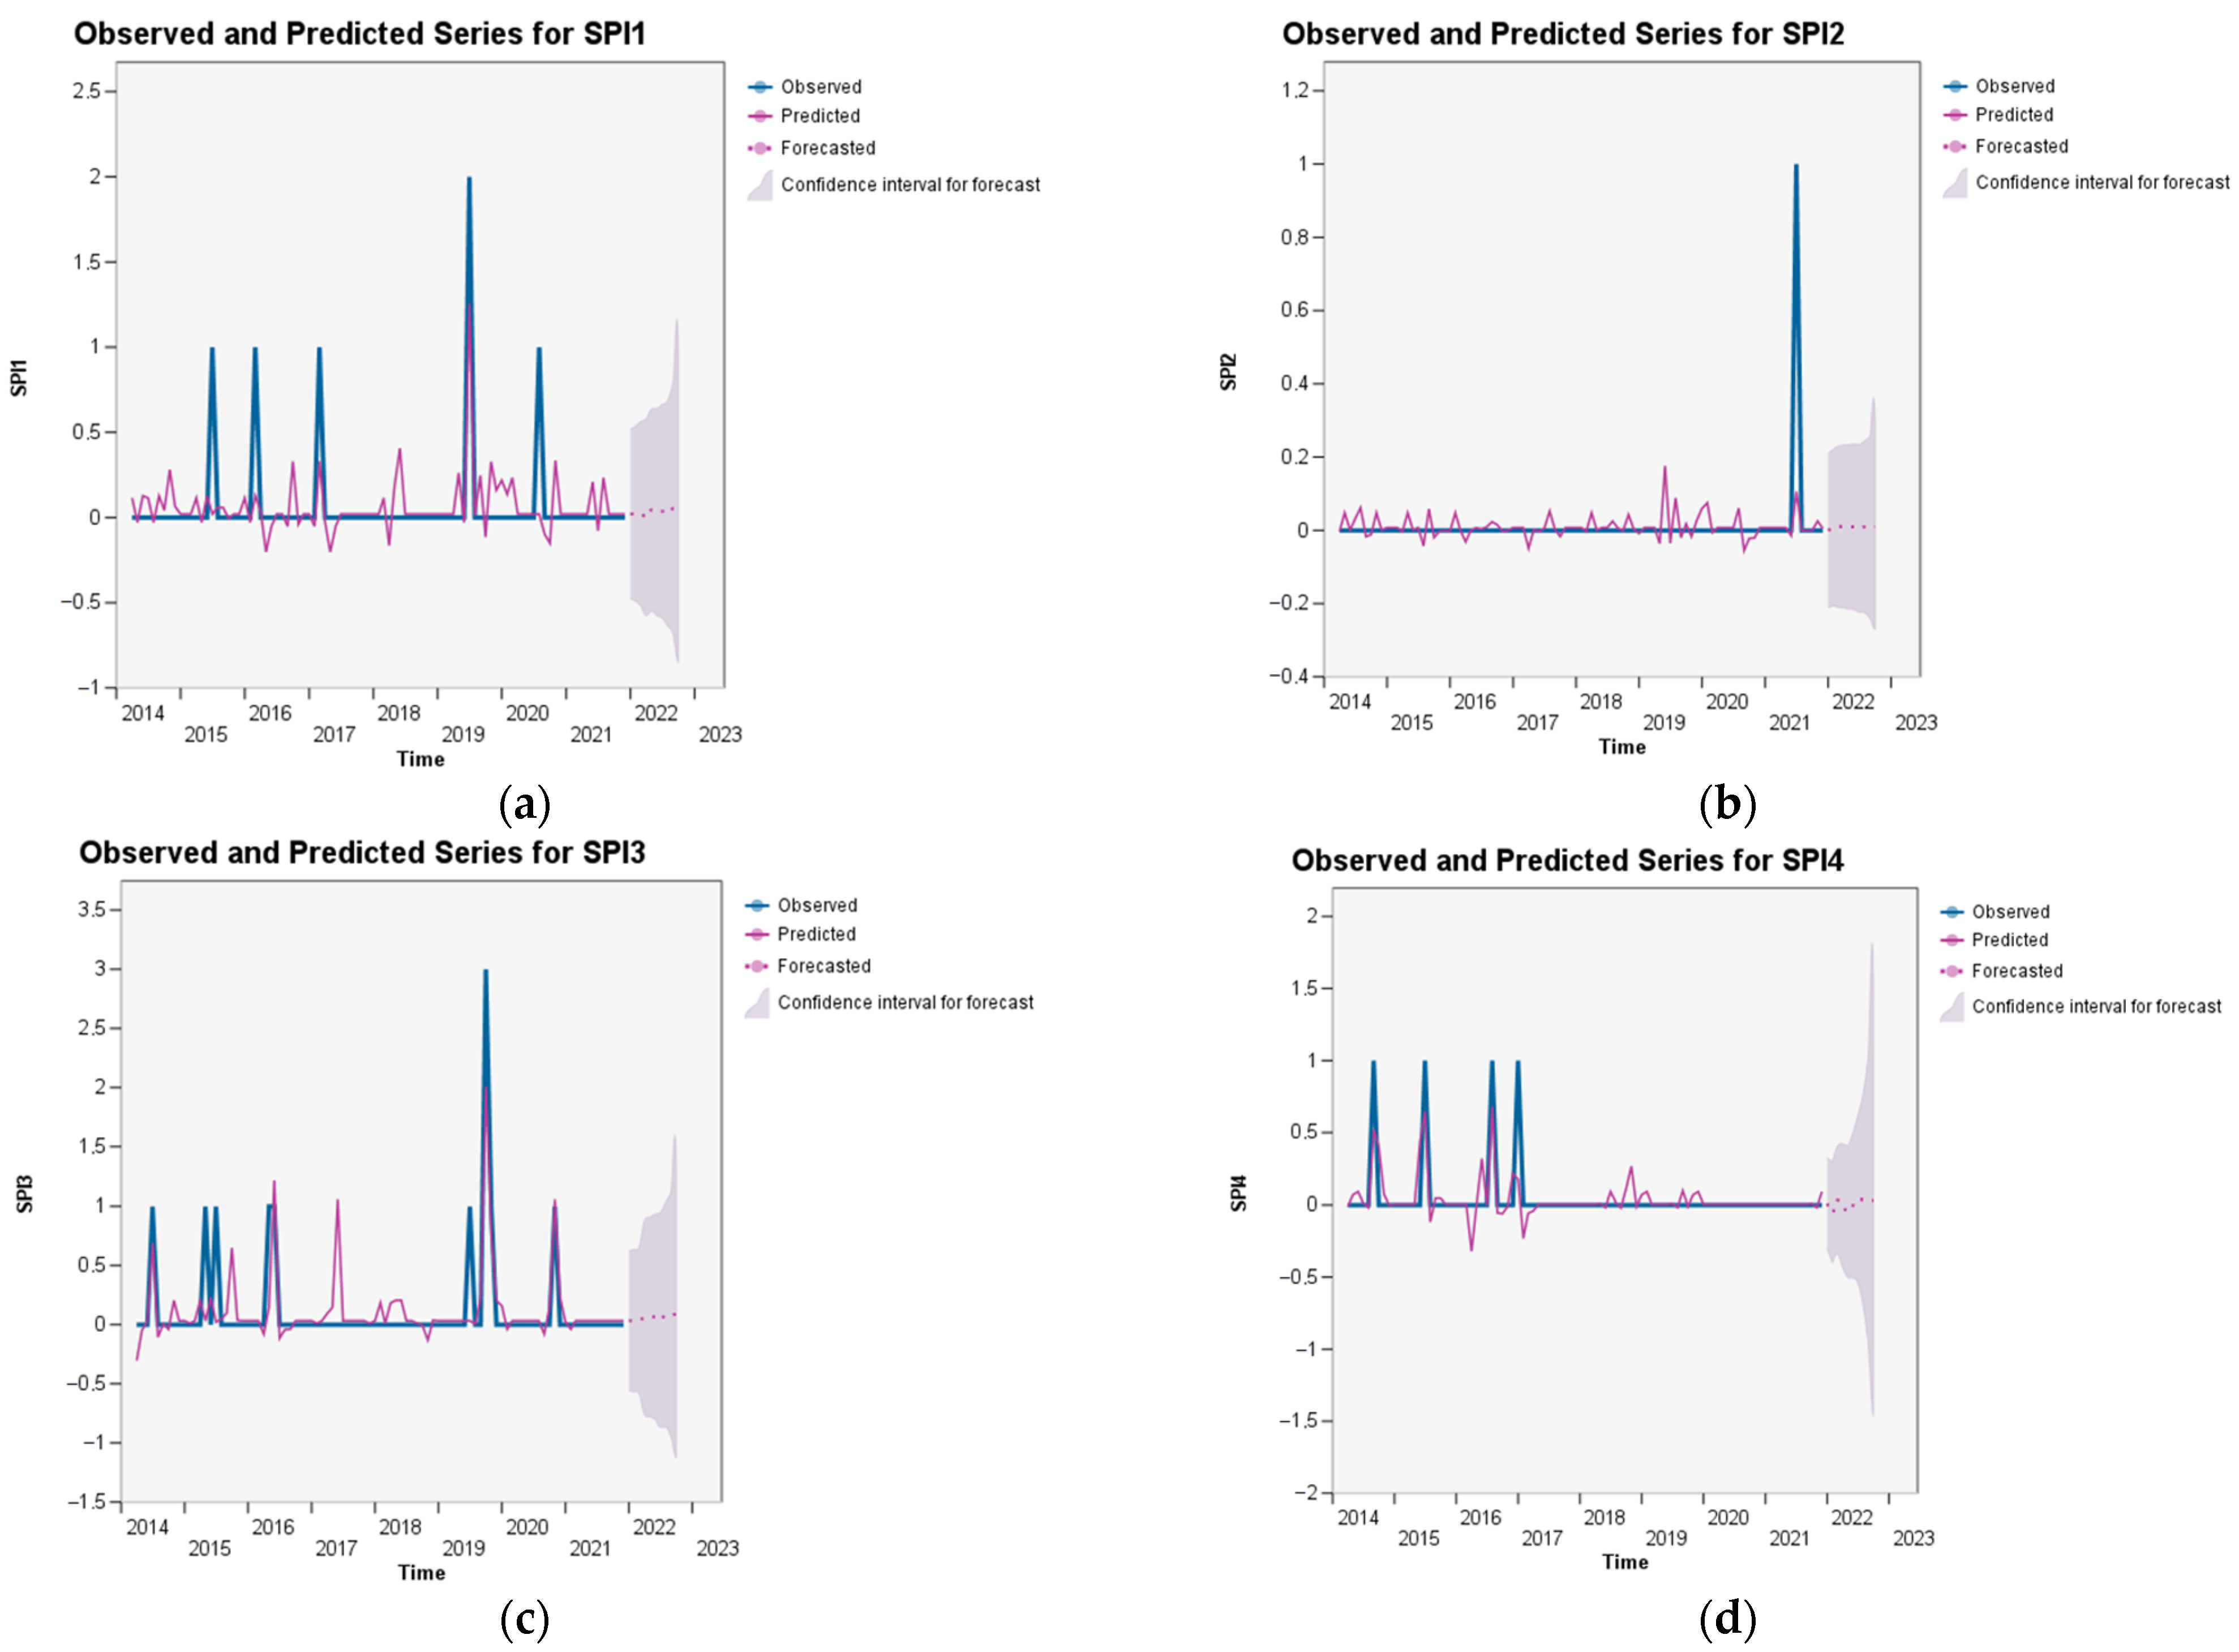
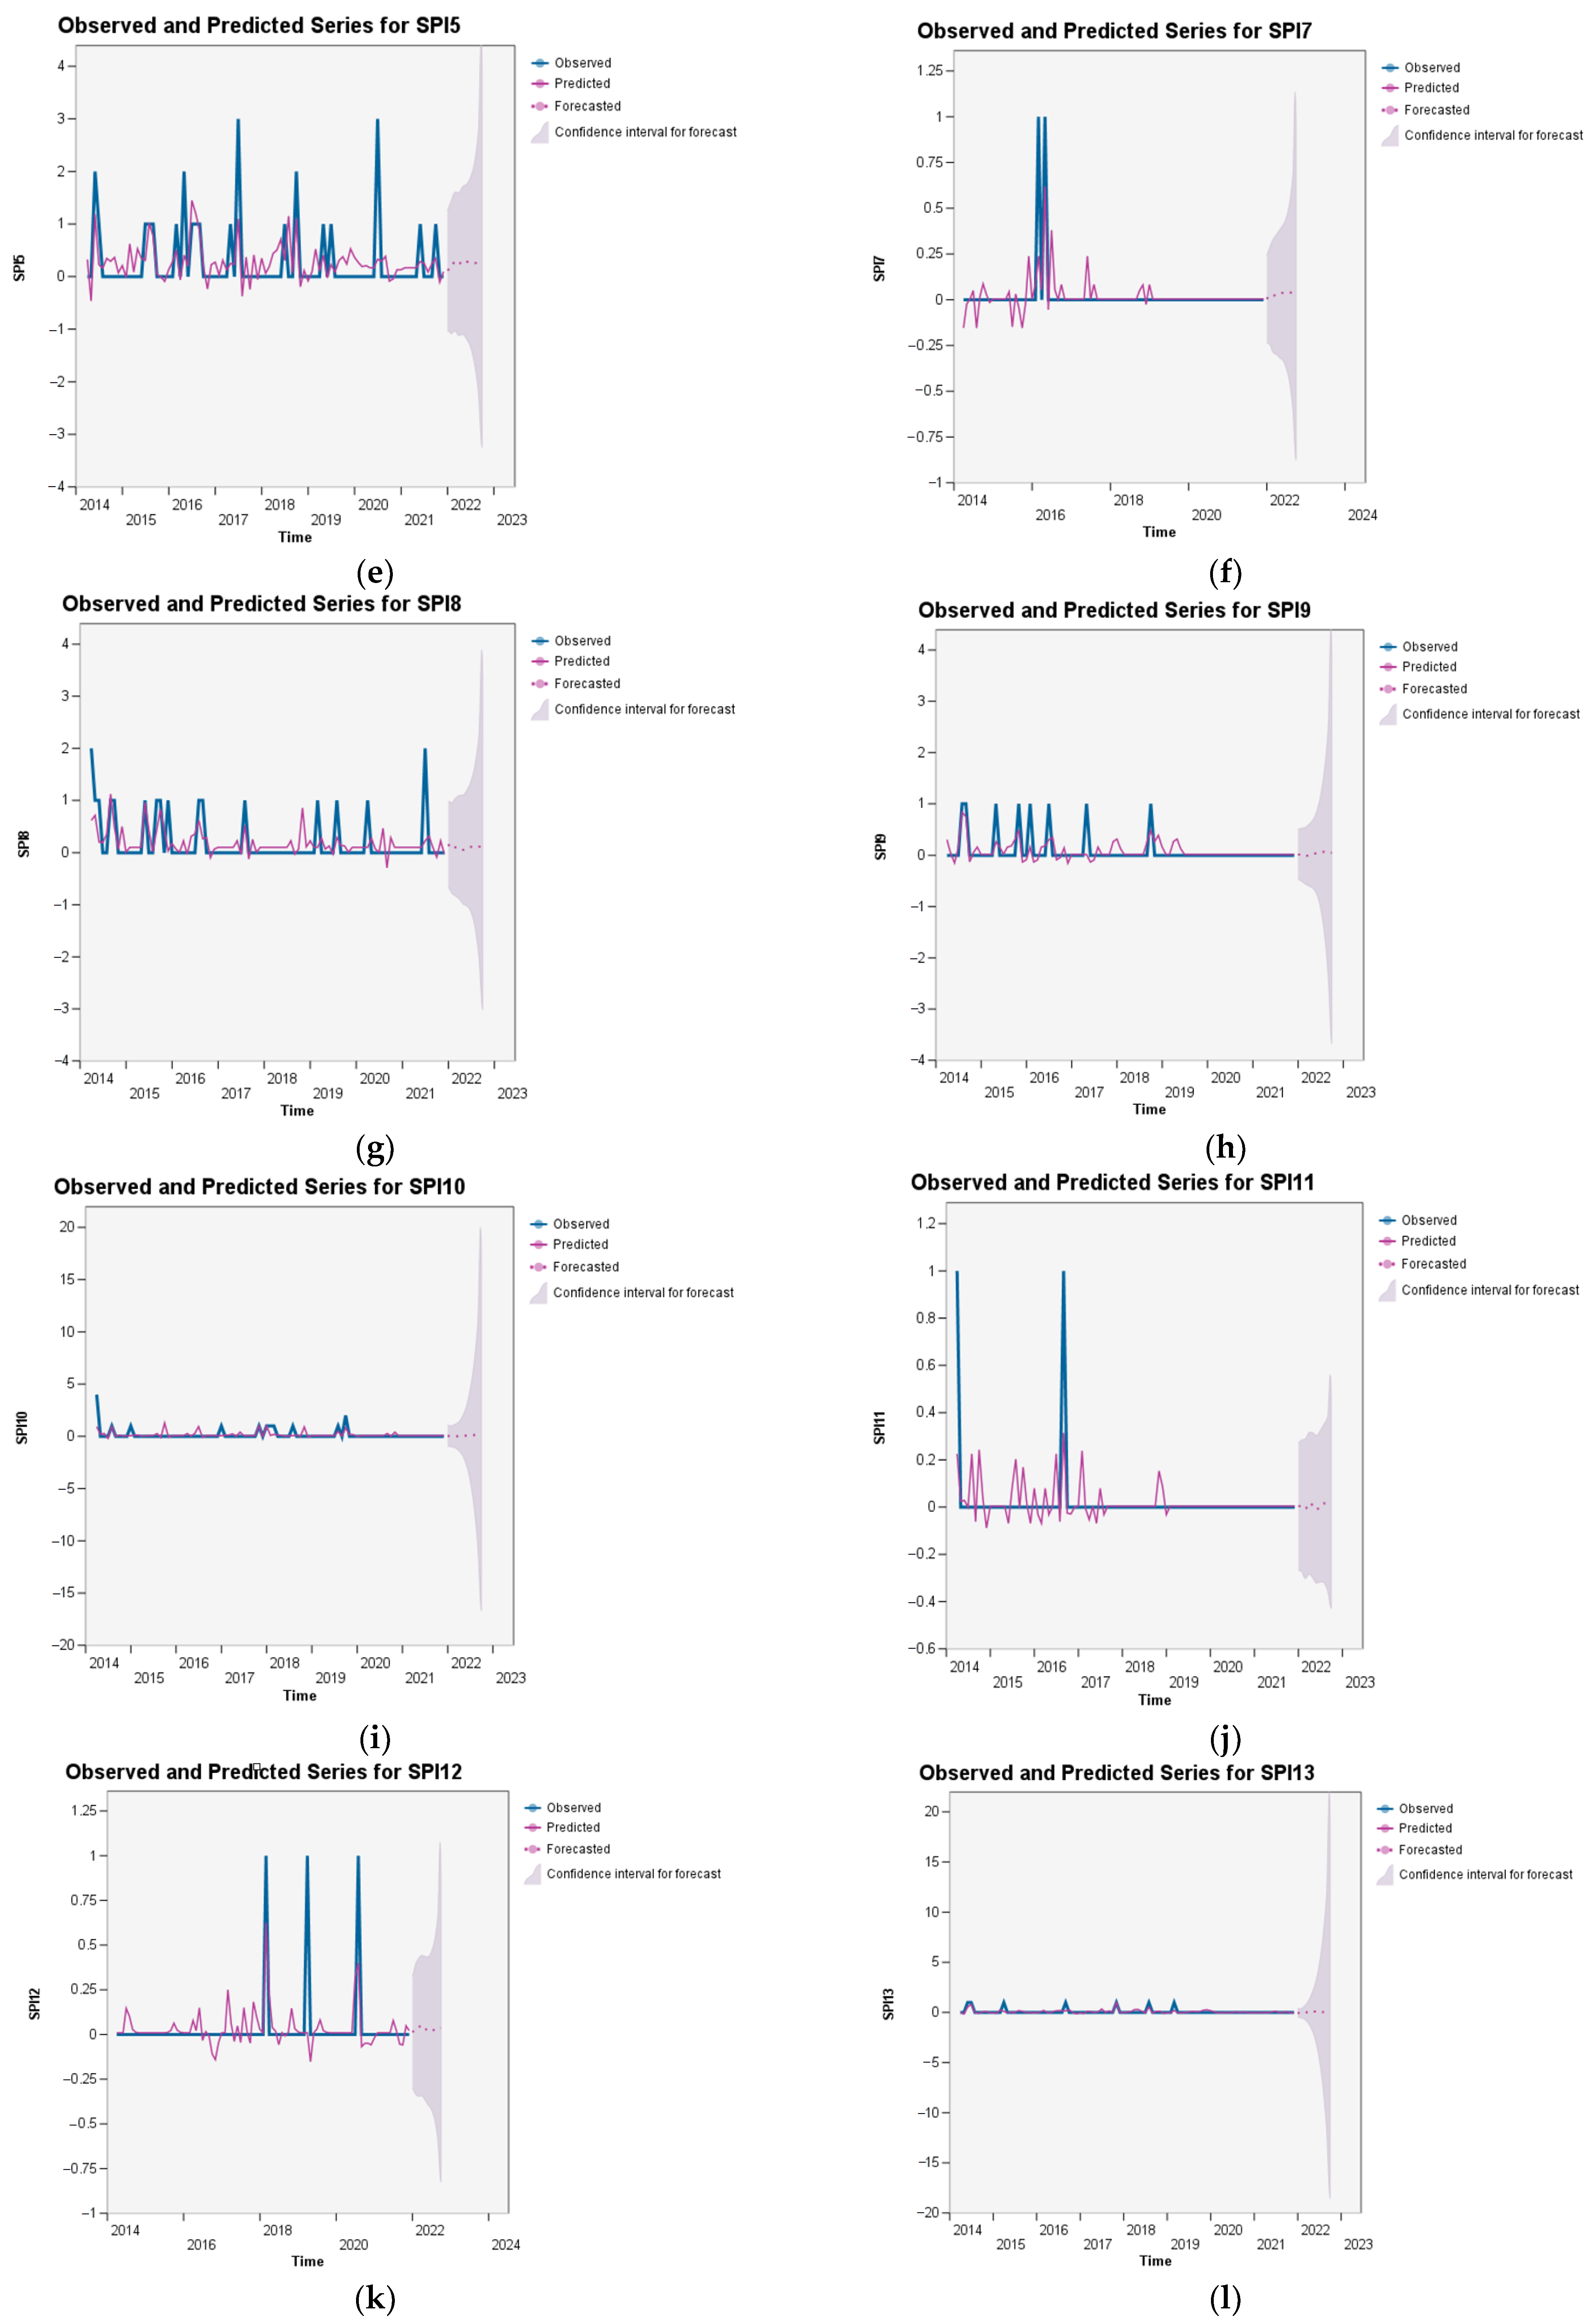
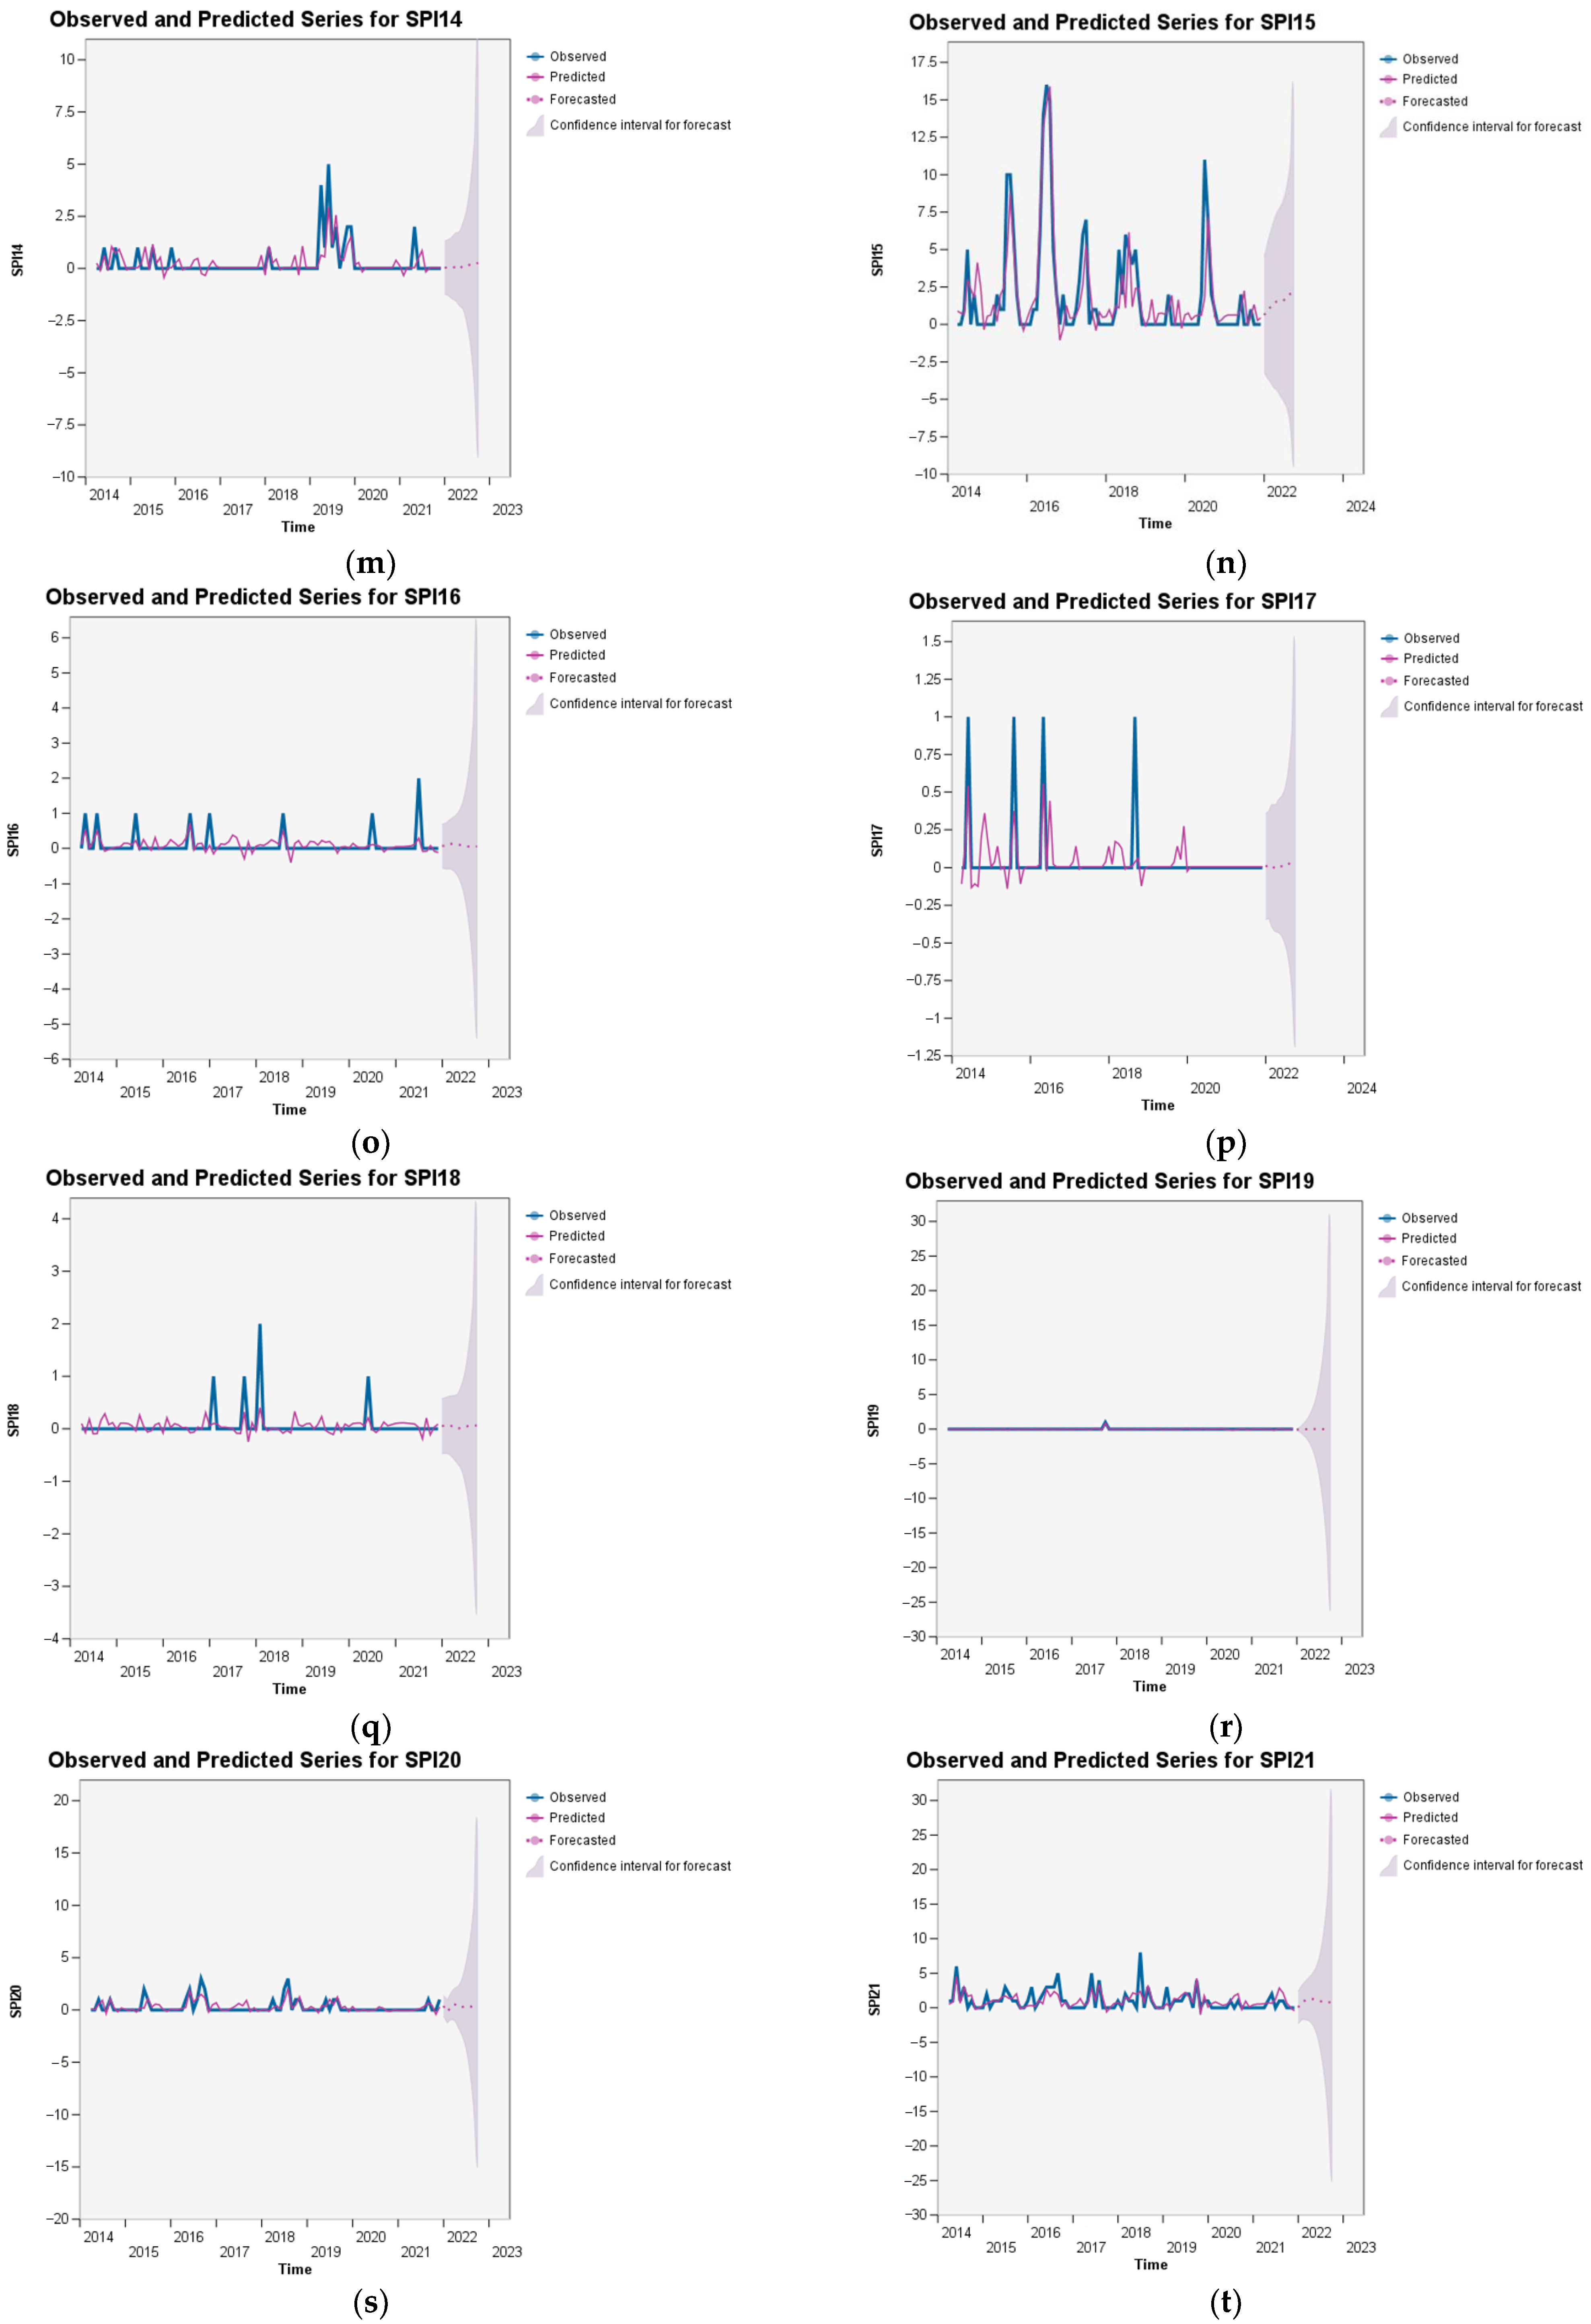
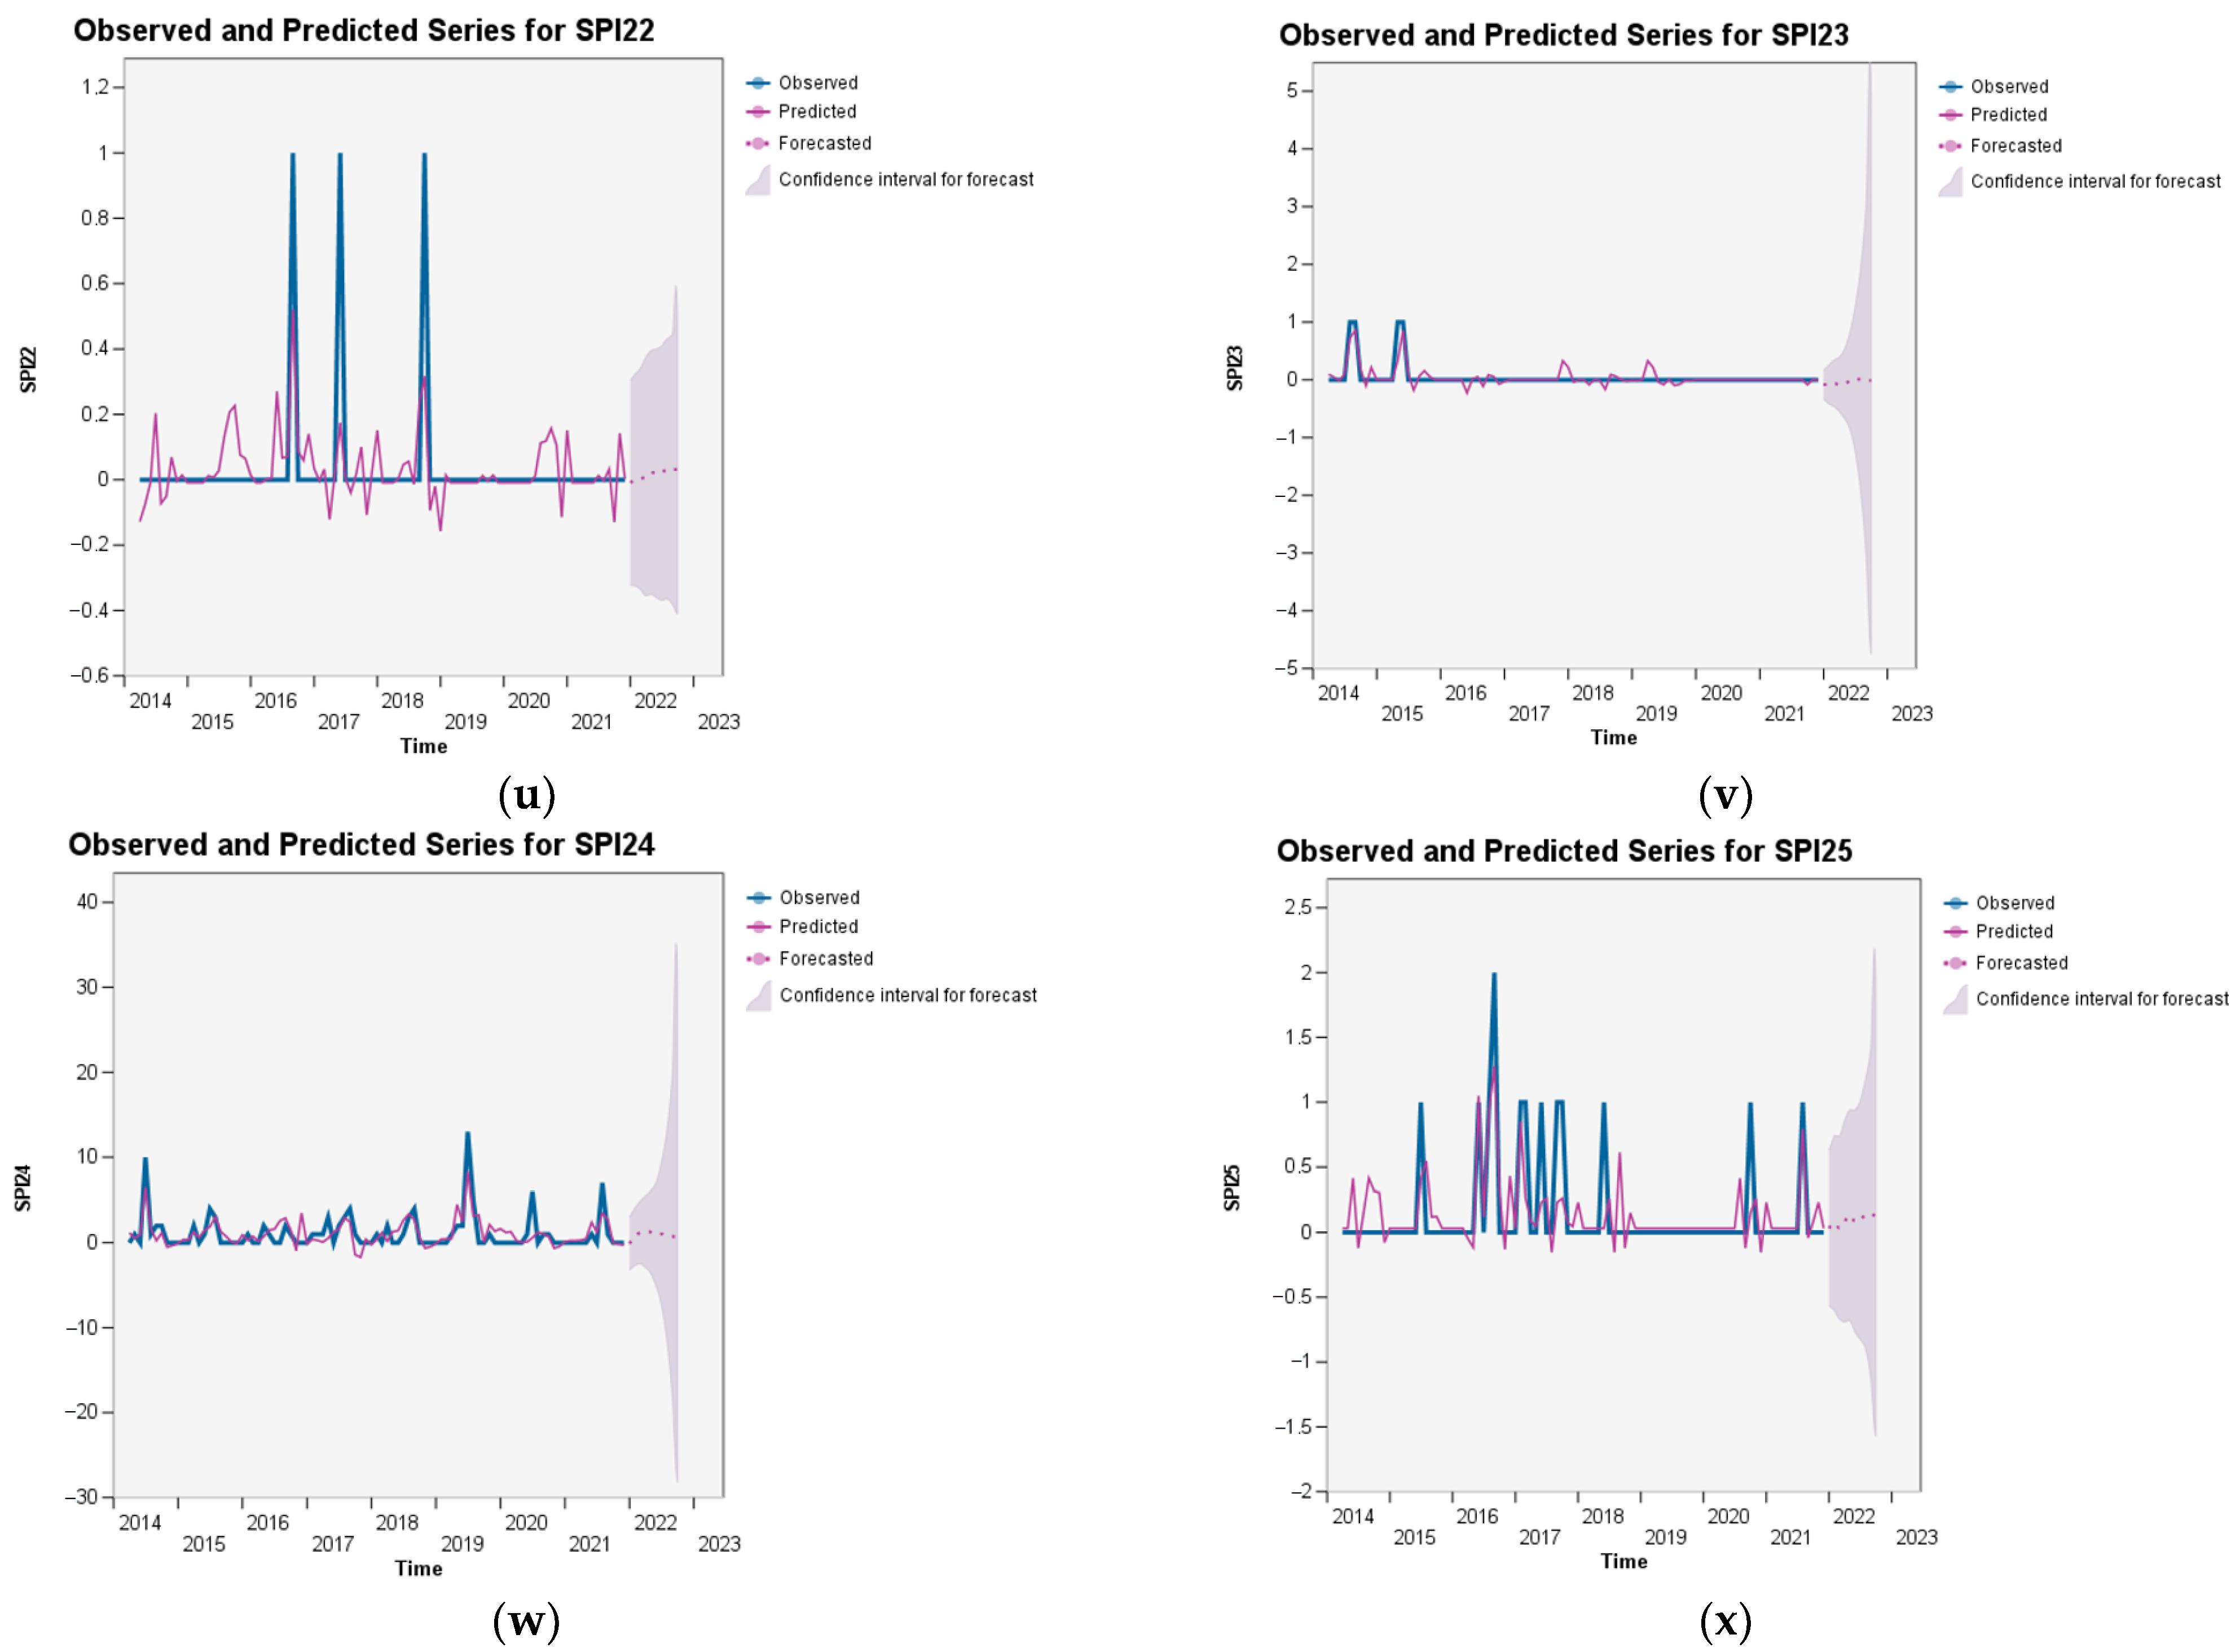
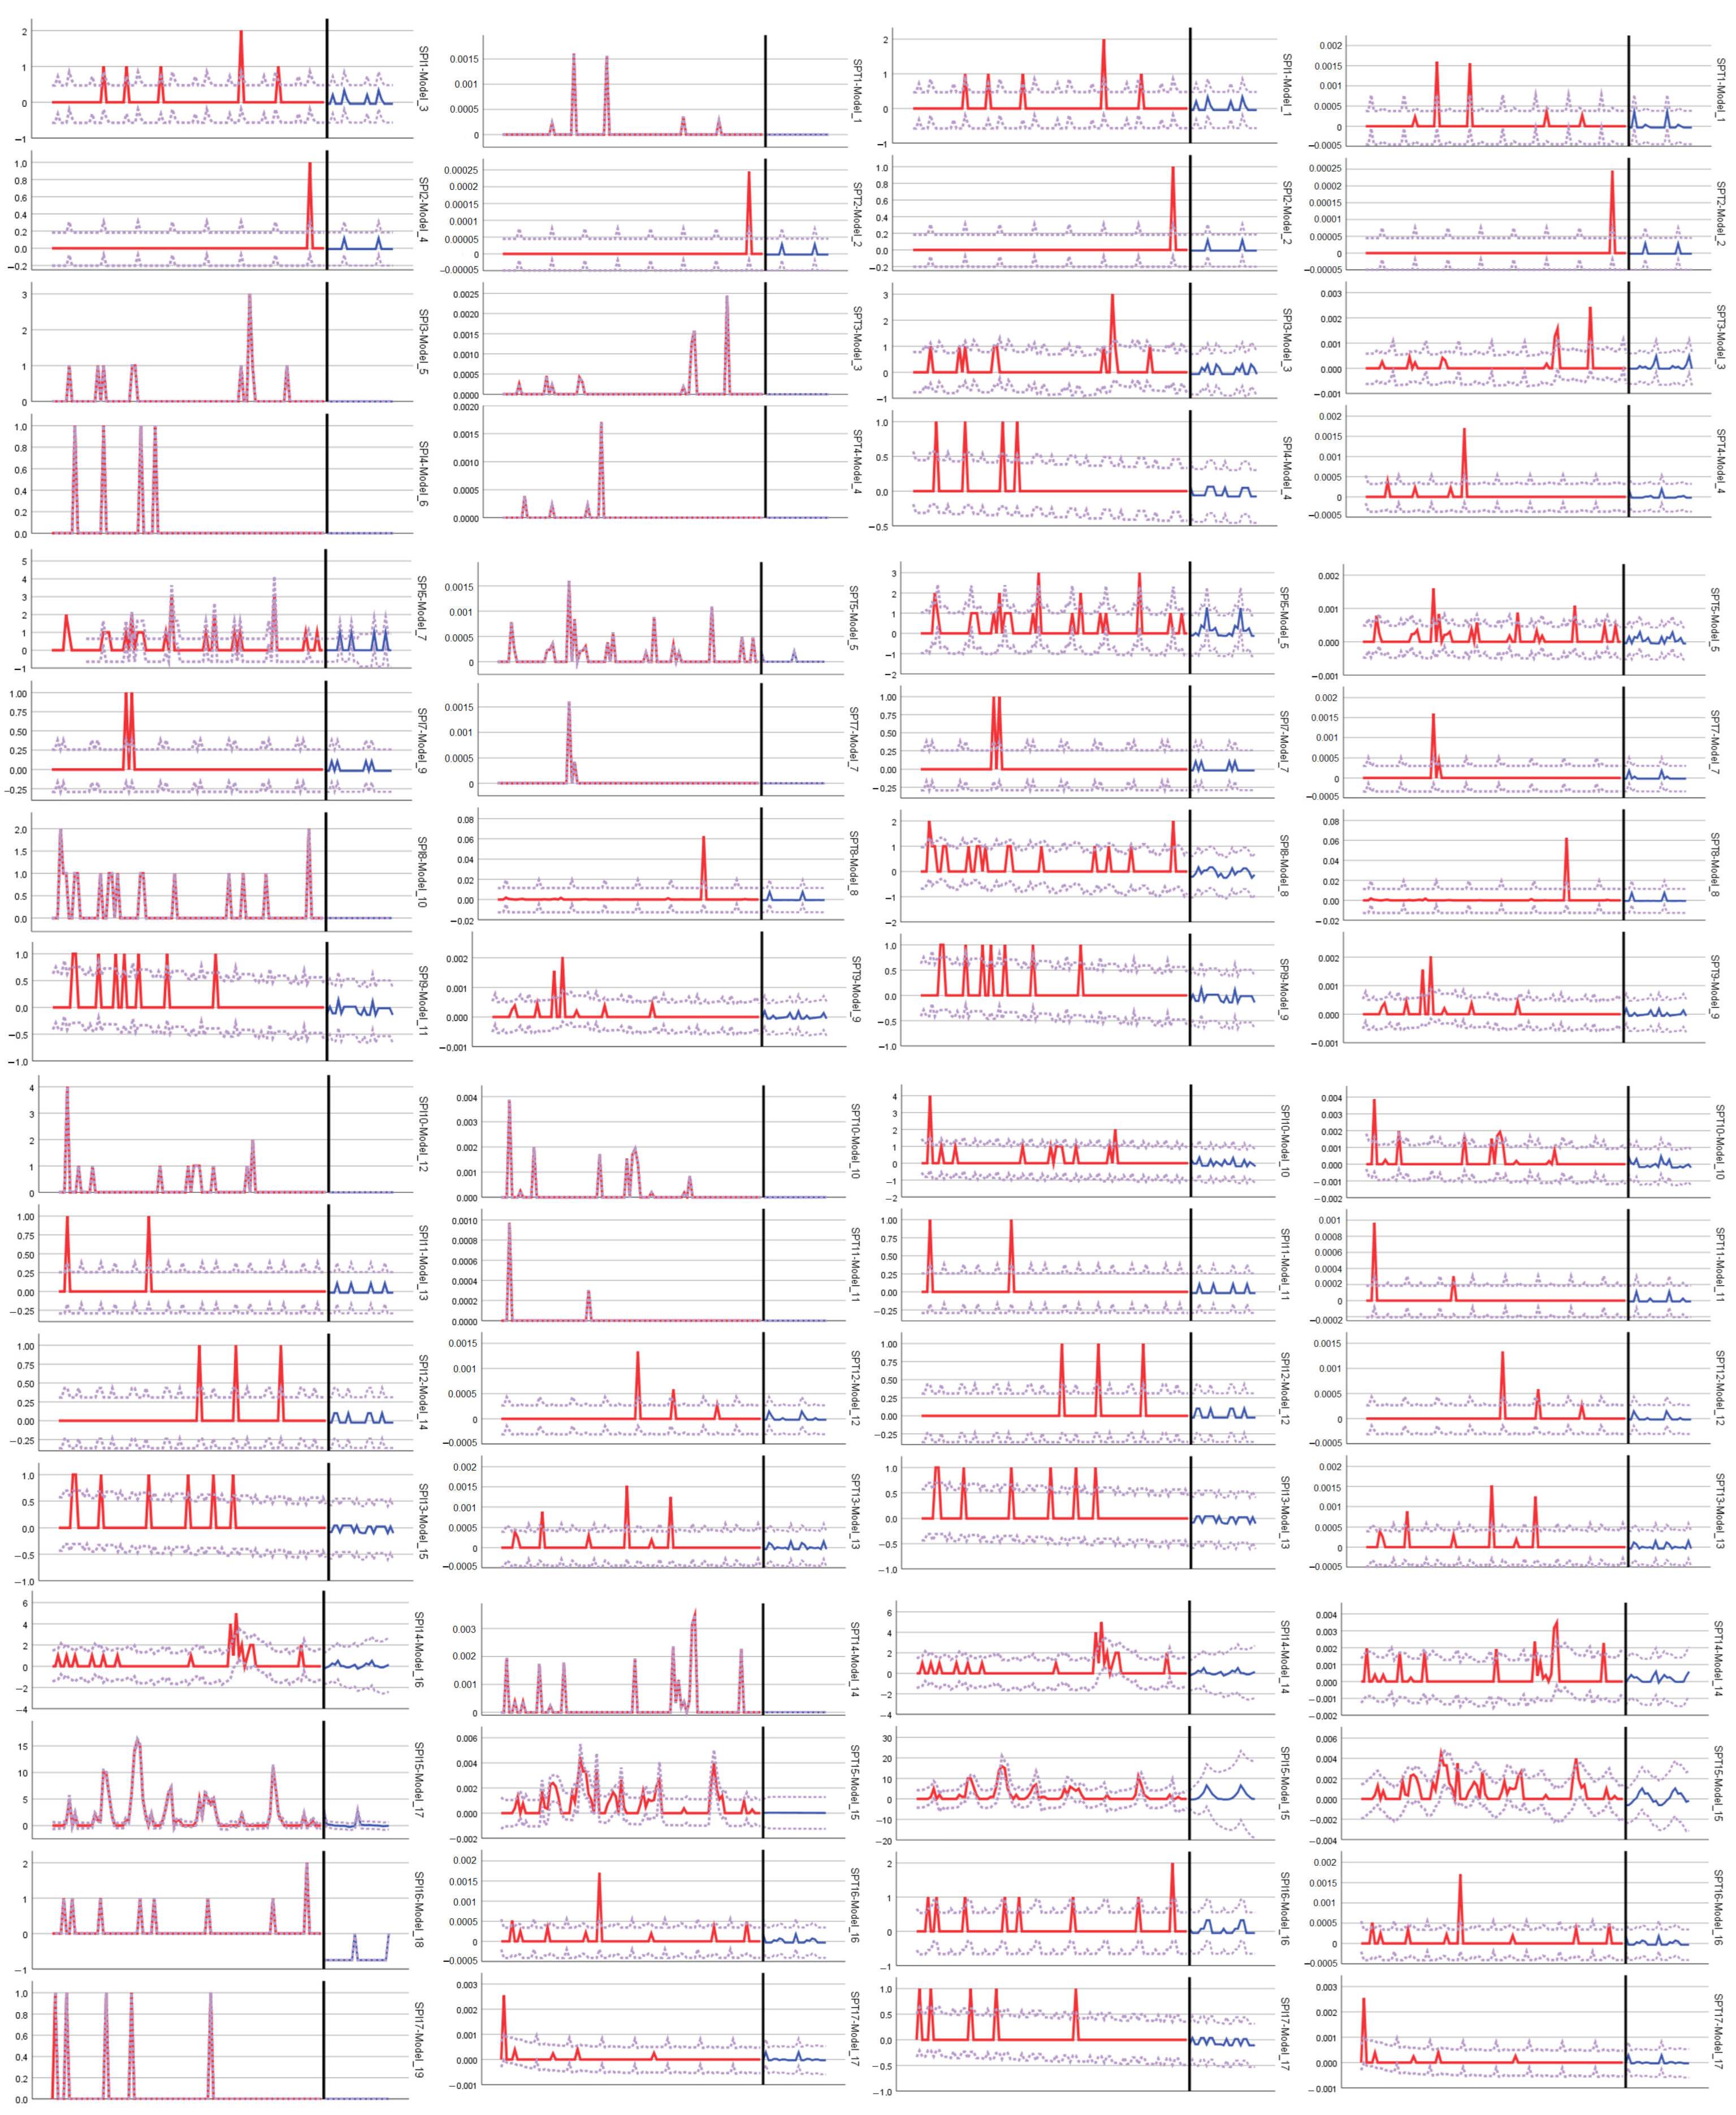
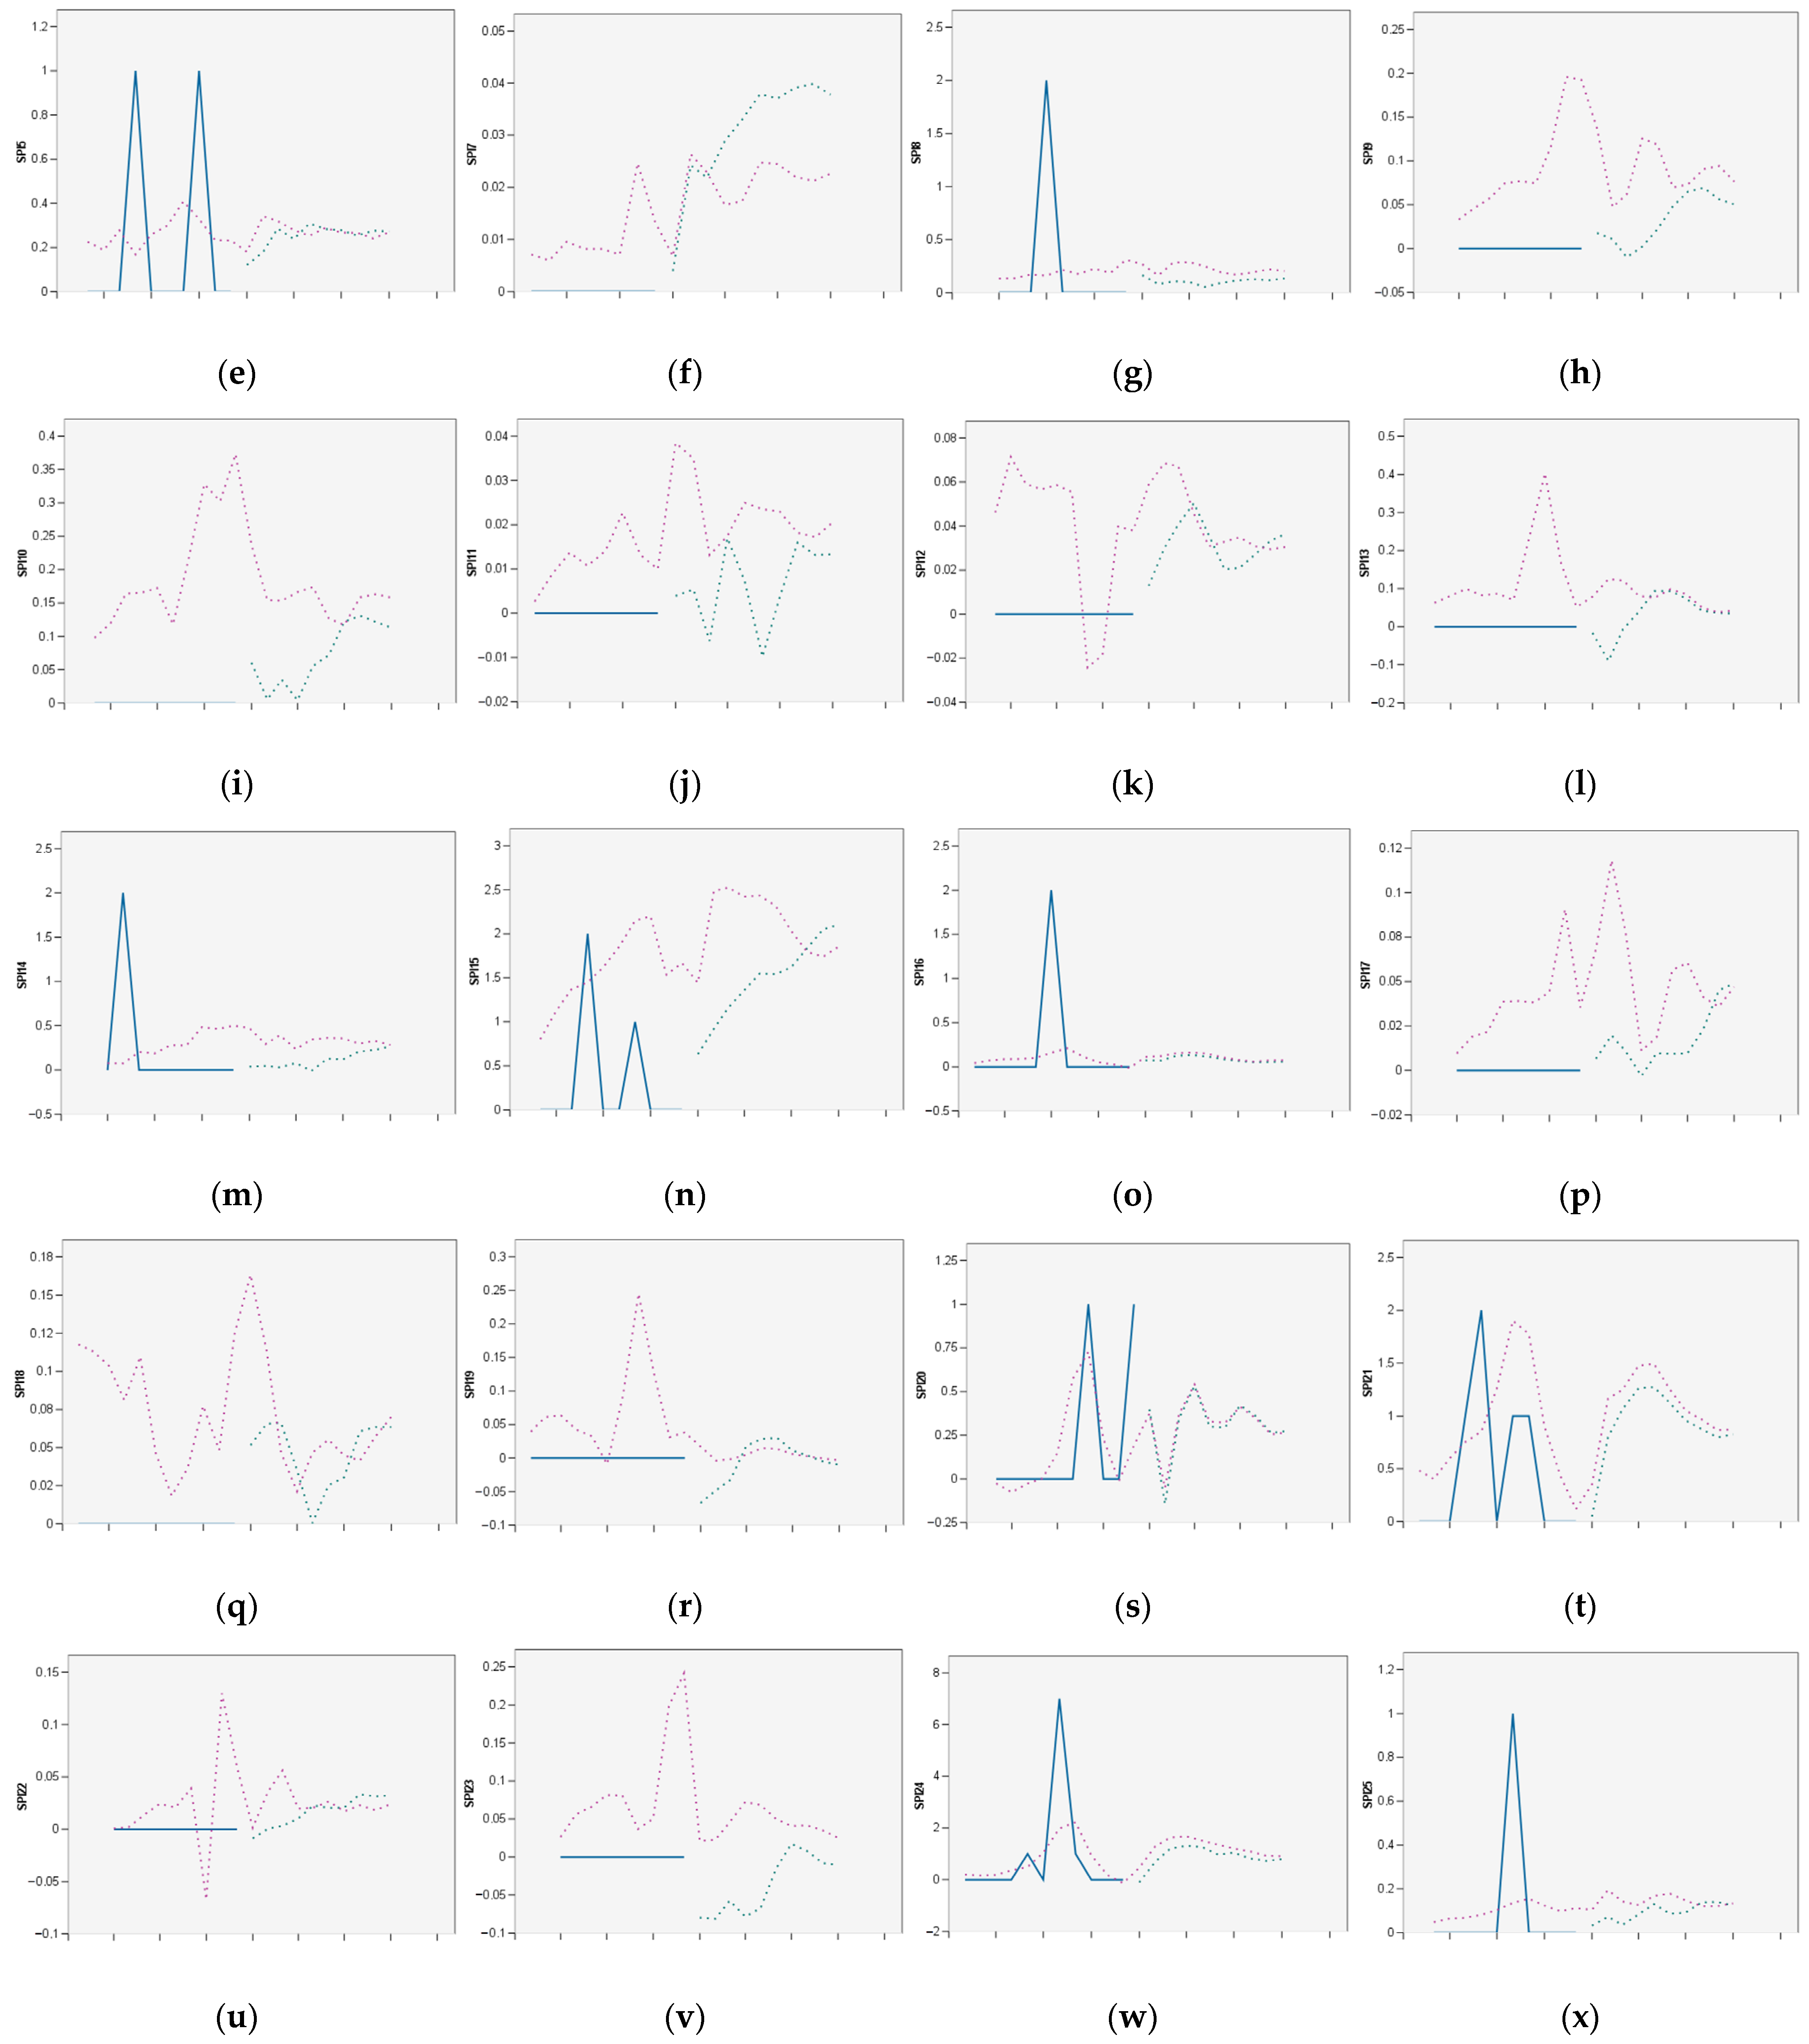
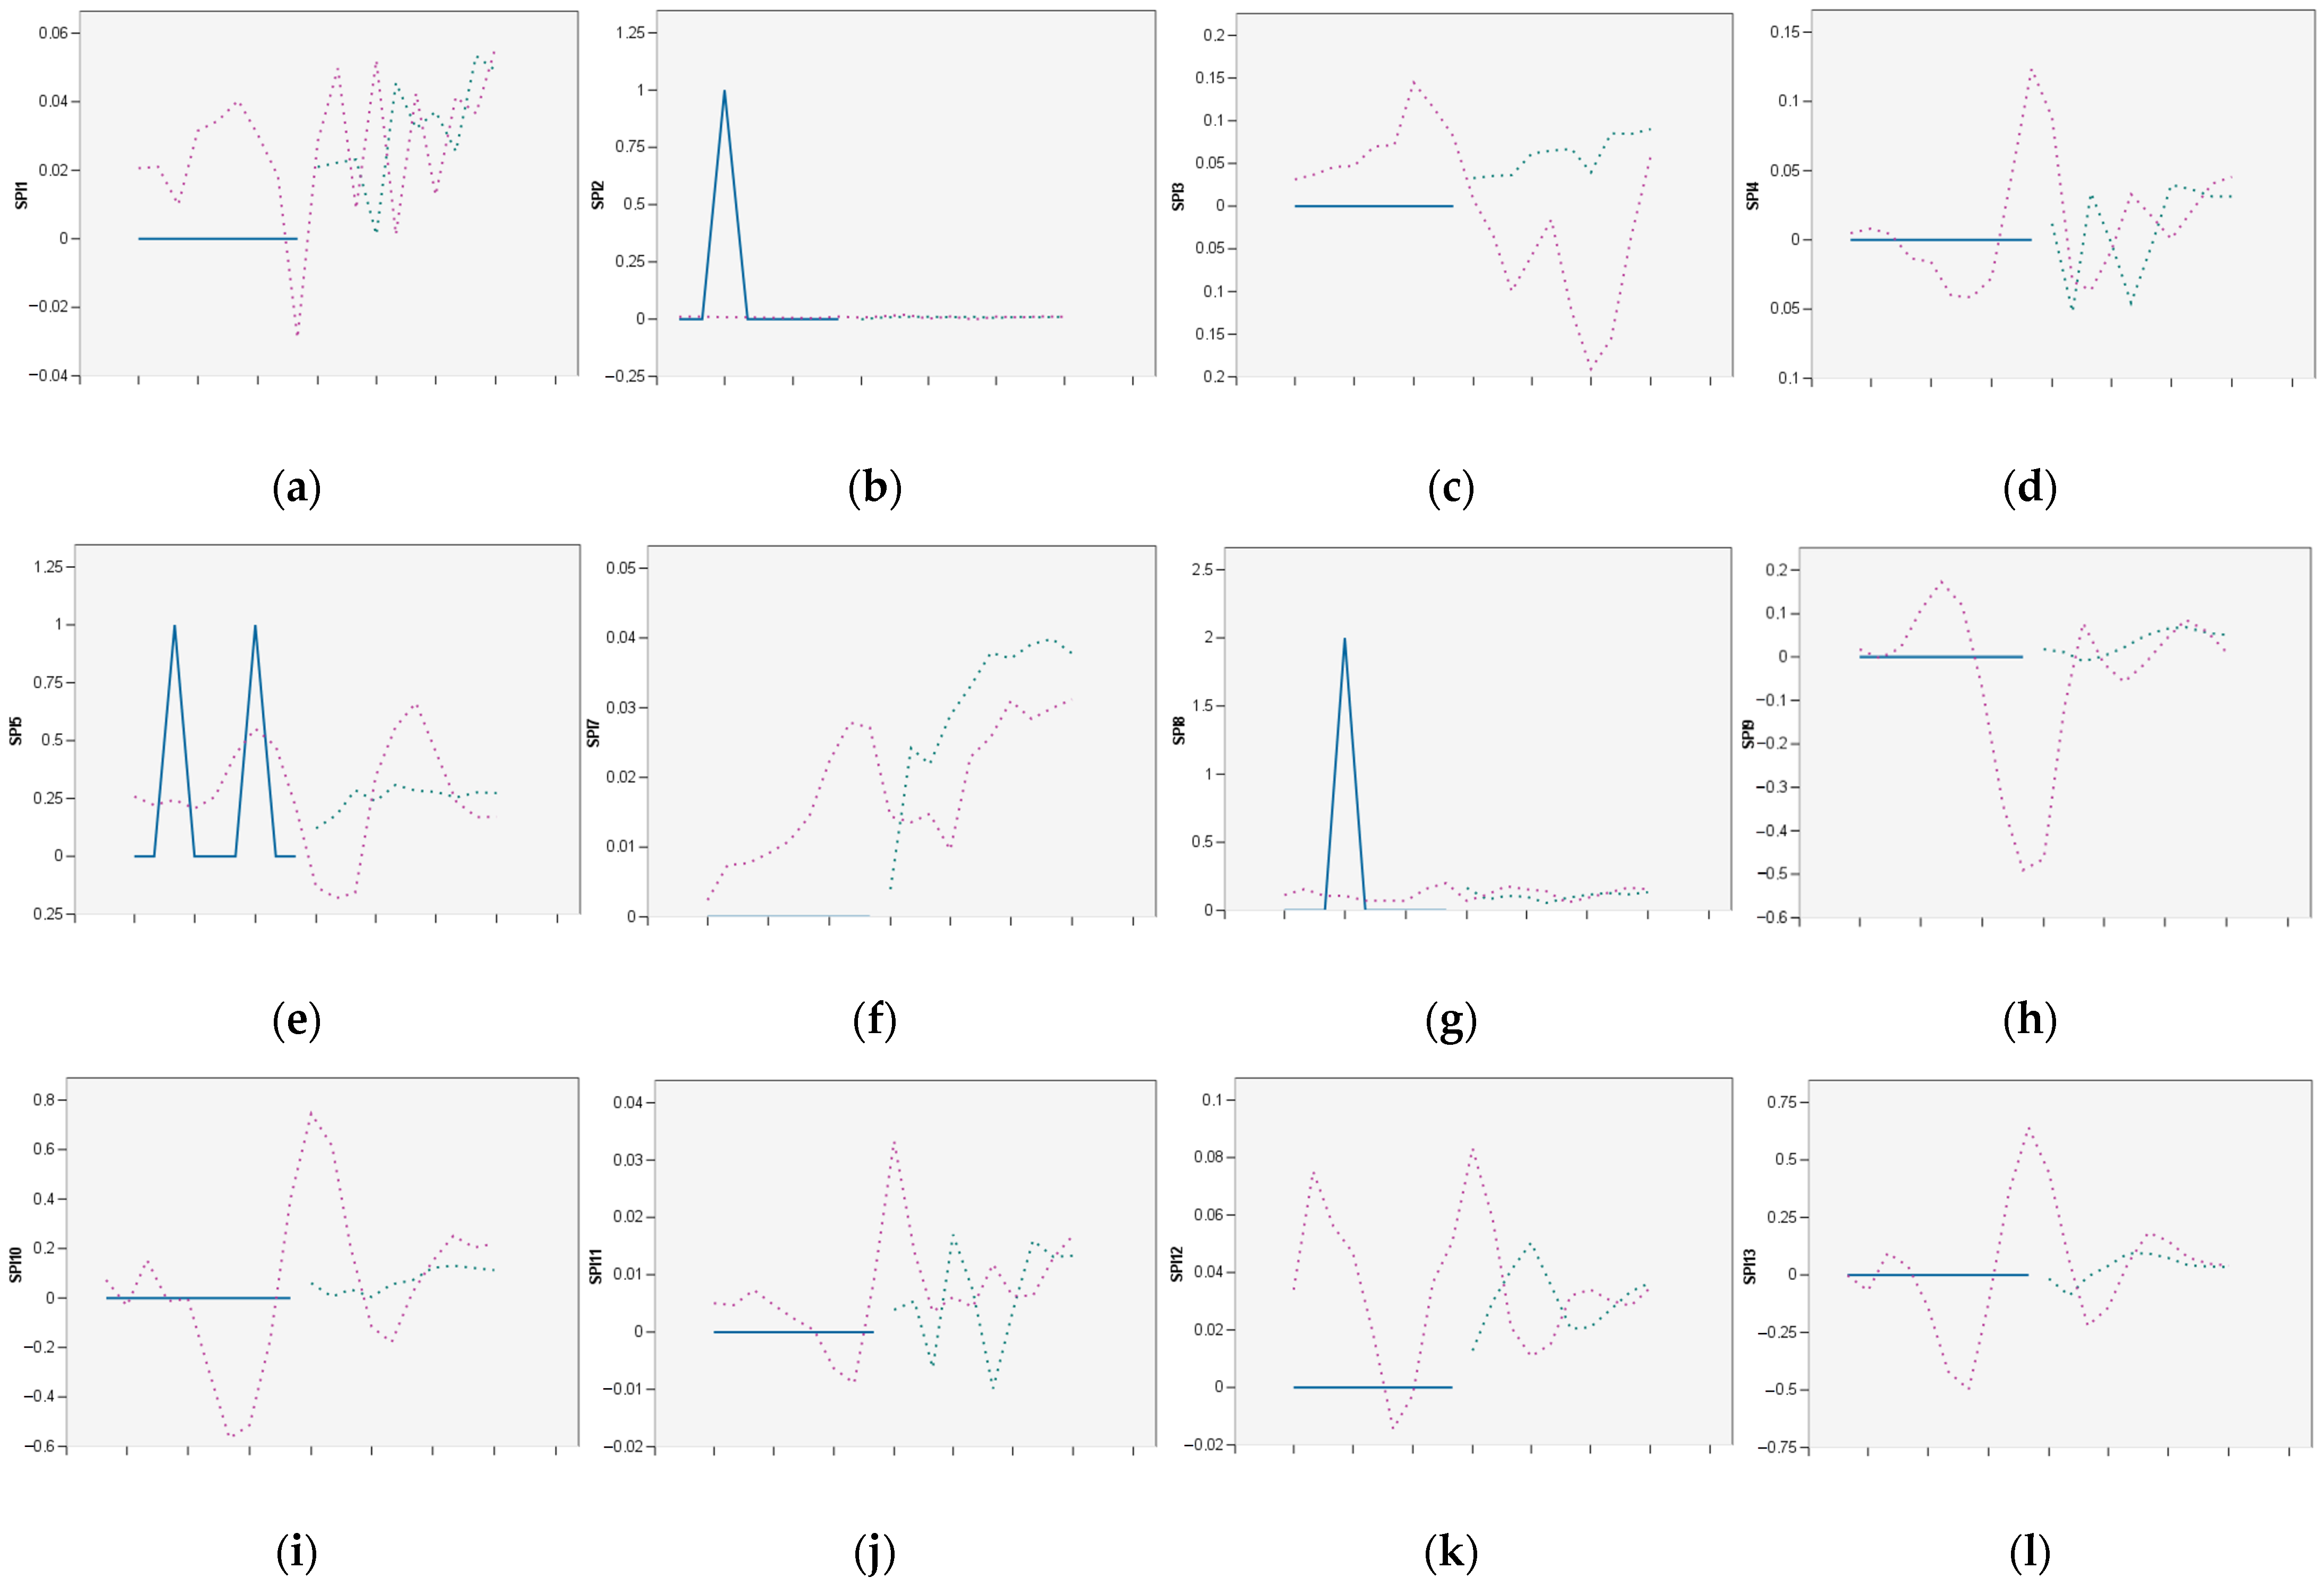
Figure 11 show examples of first initial forecast of Split Airport safety performance indicators using IBM SPSS function Forecasting using Temporal Causal Model. Details on first initial forecast of Split Airport safety performance indicators can be found in the Appendix D.
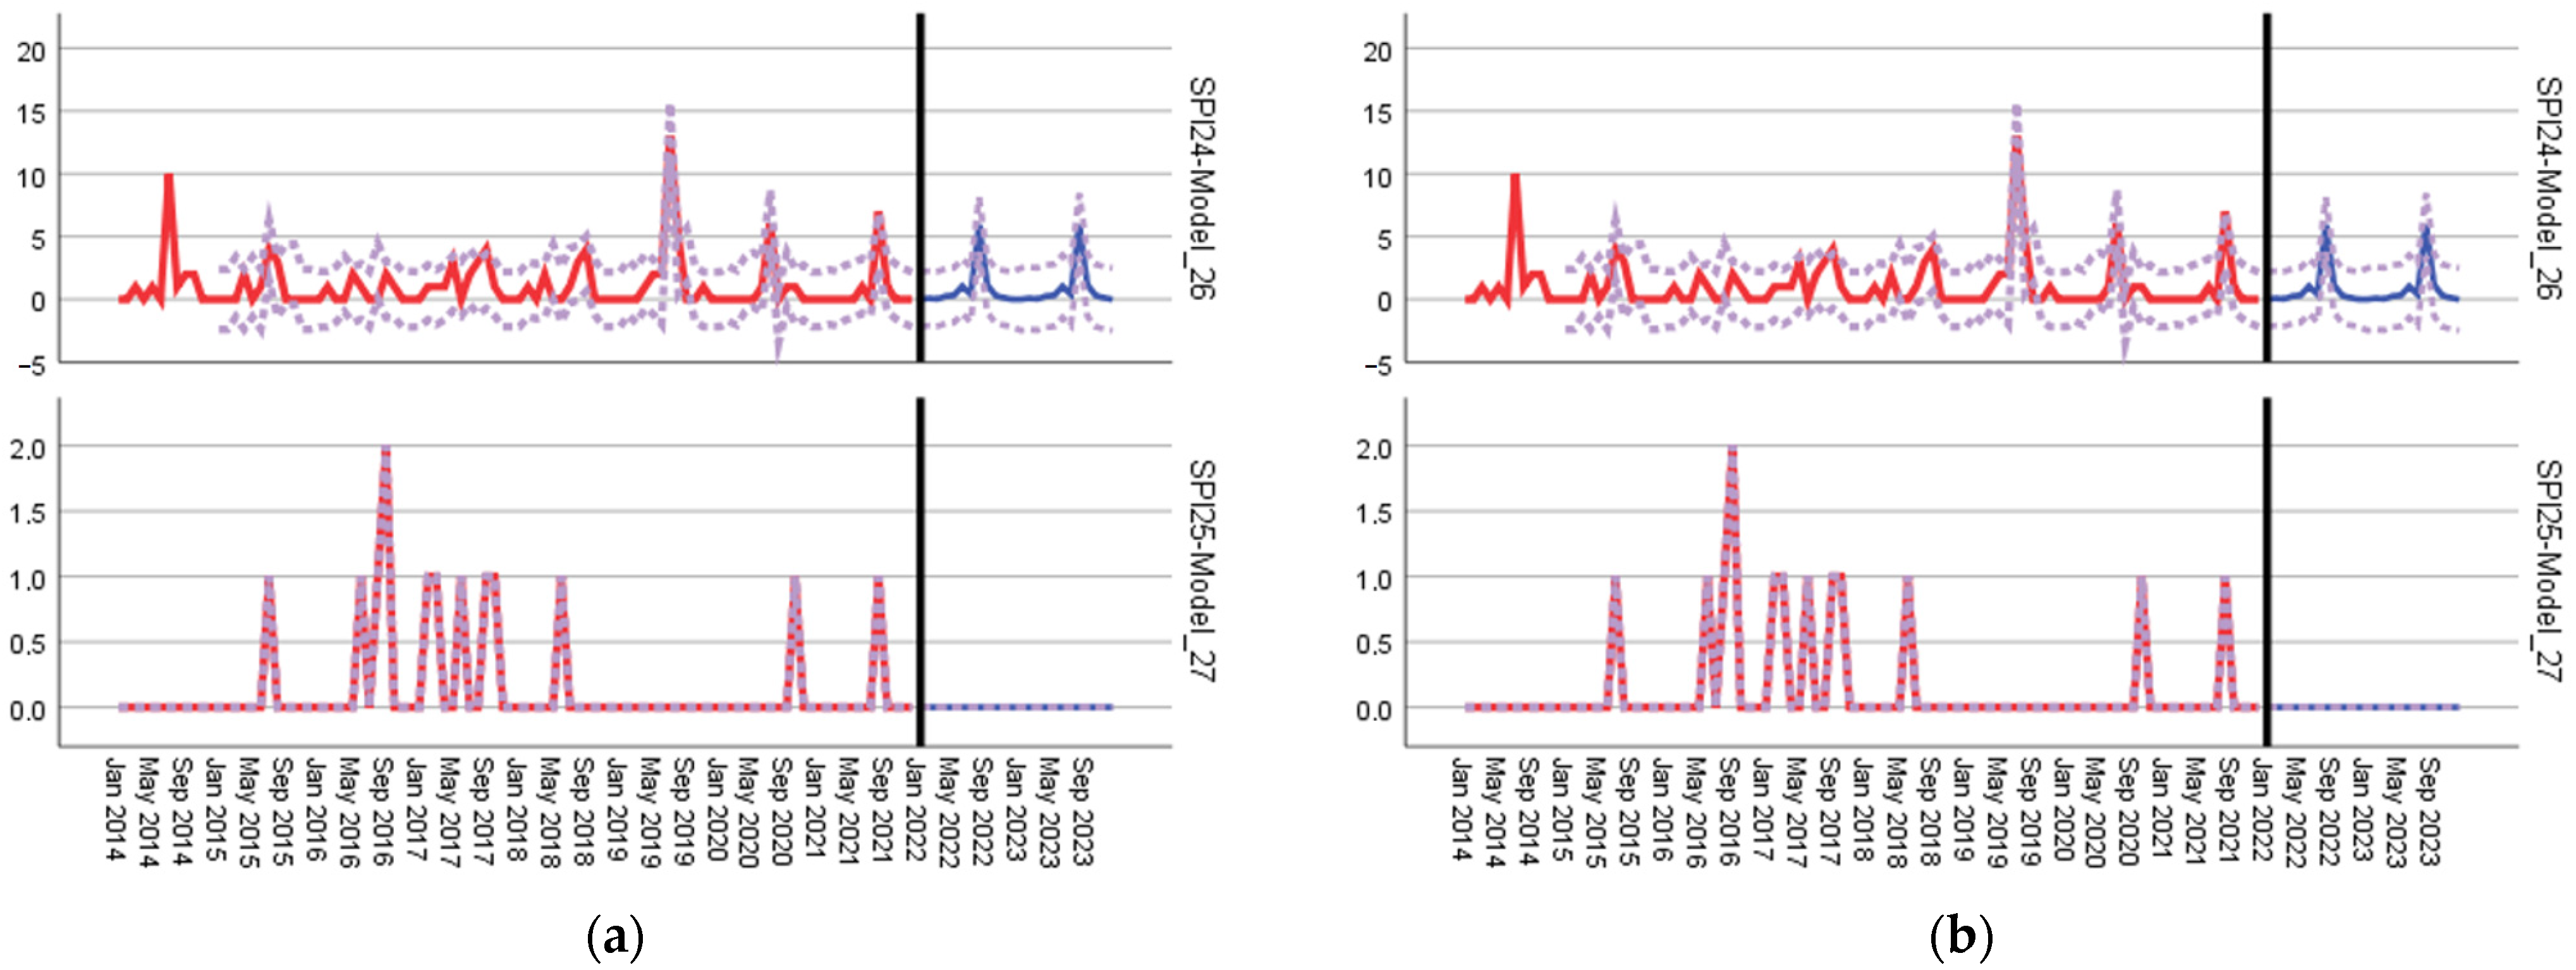
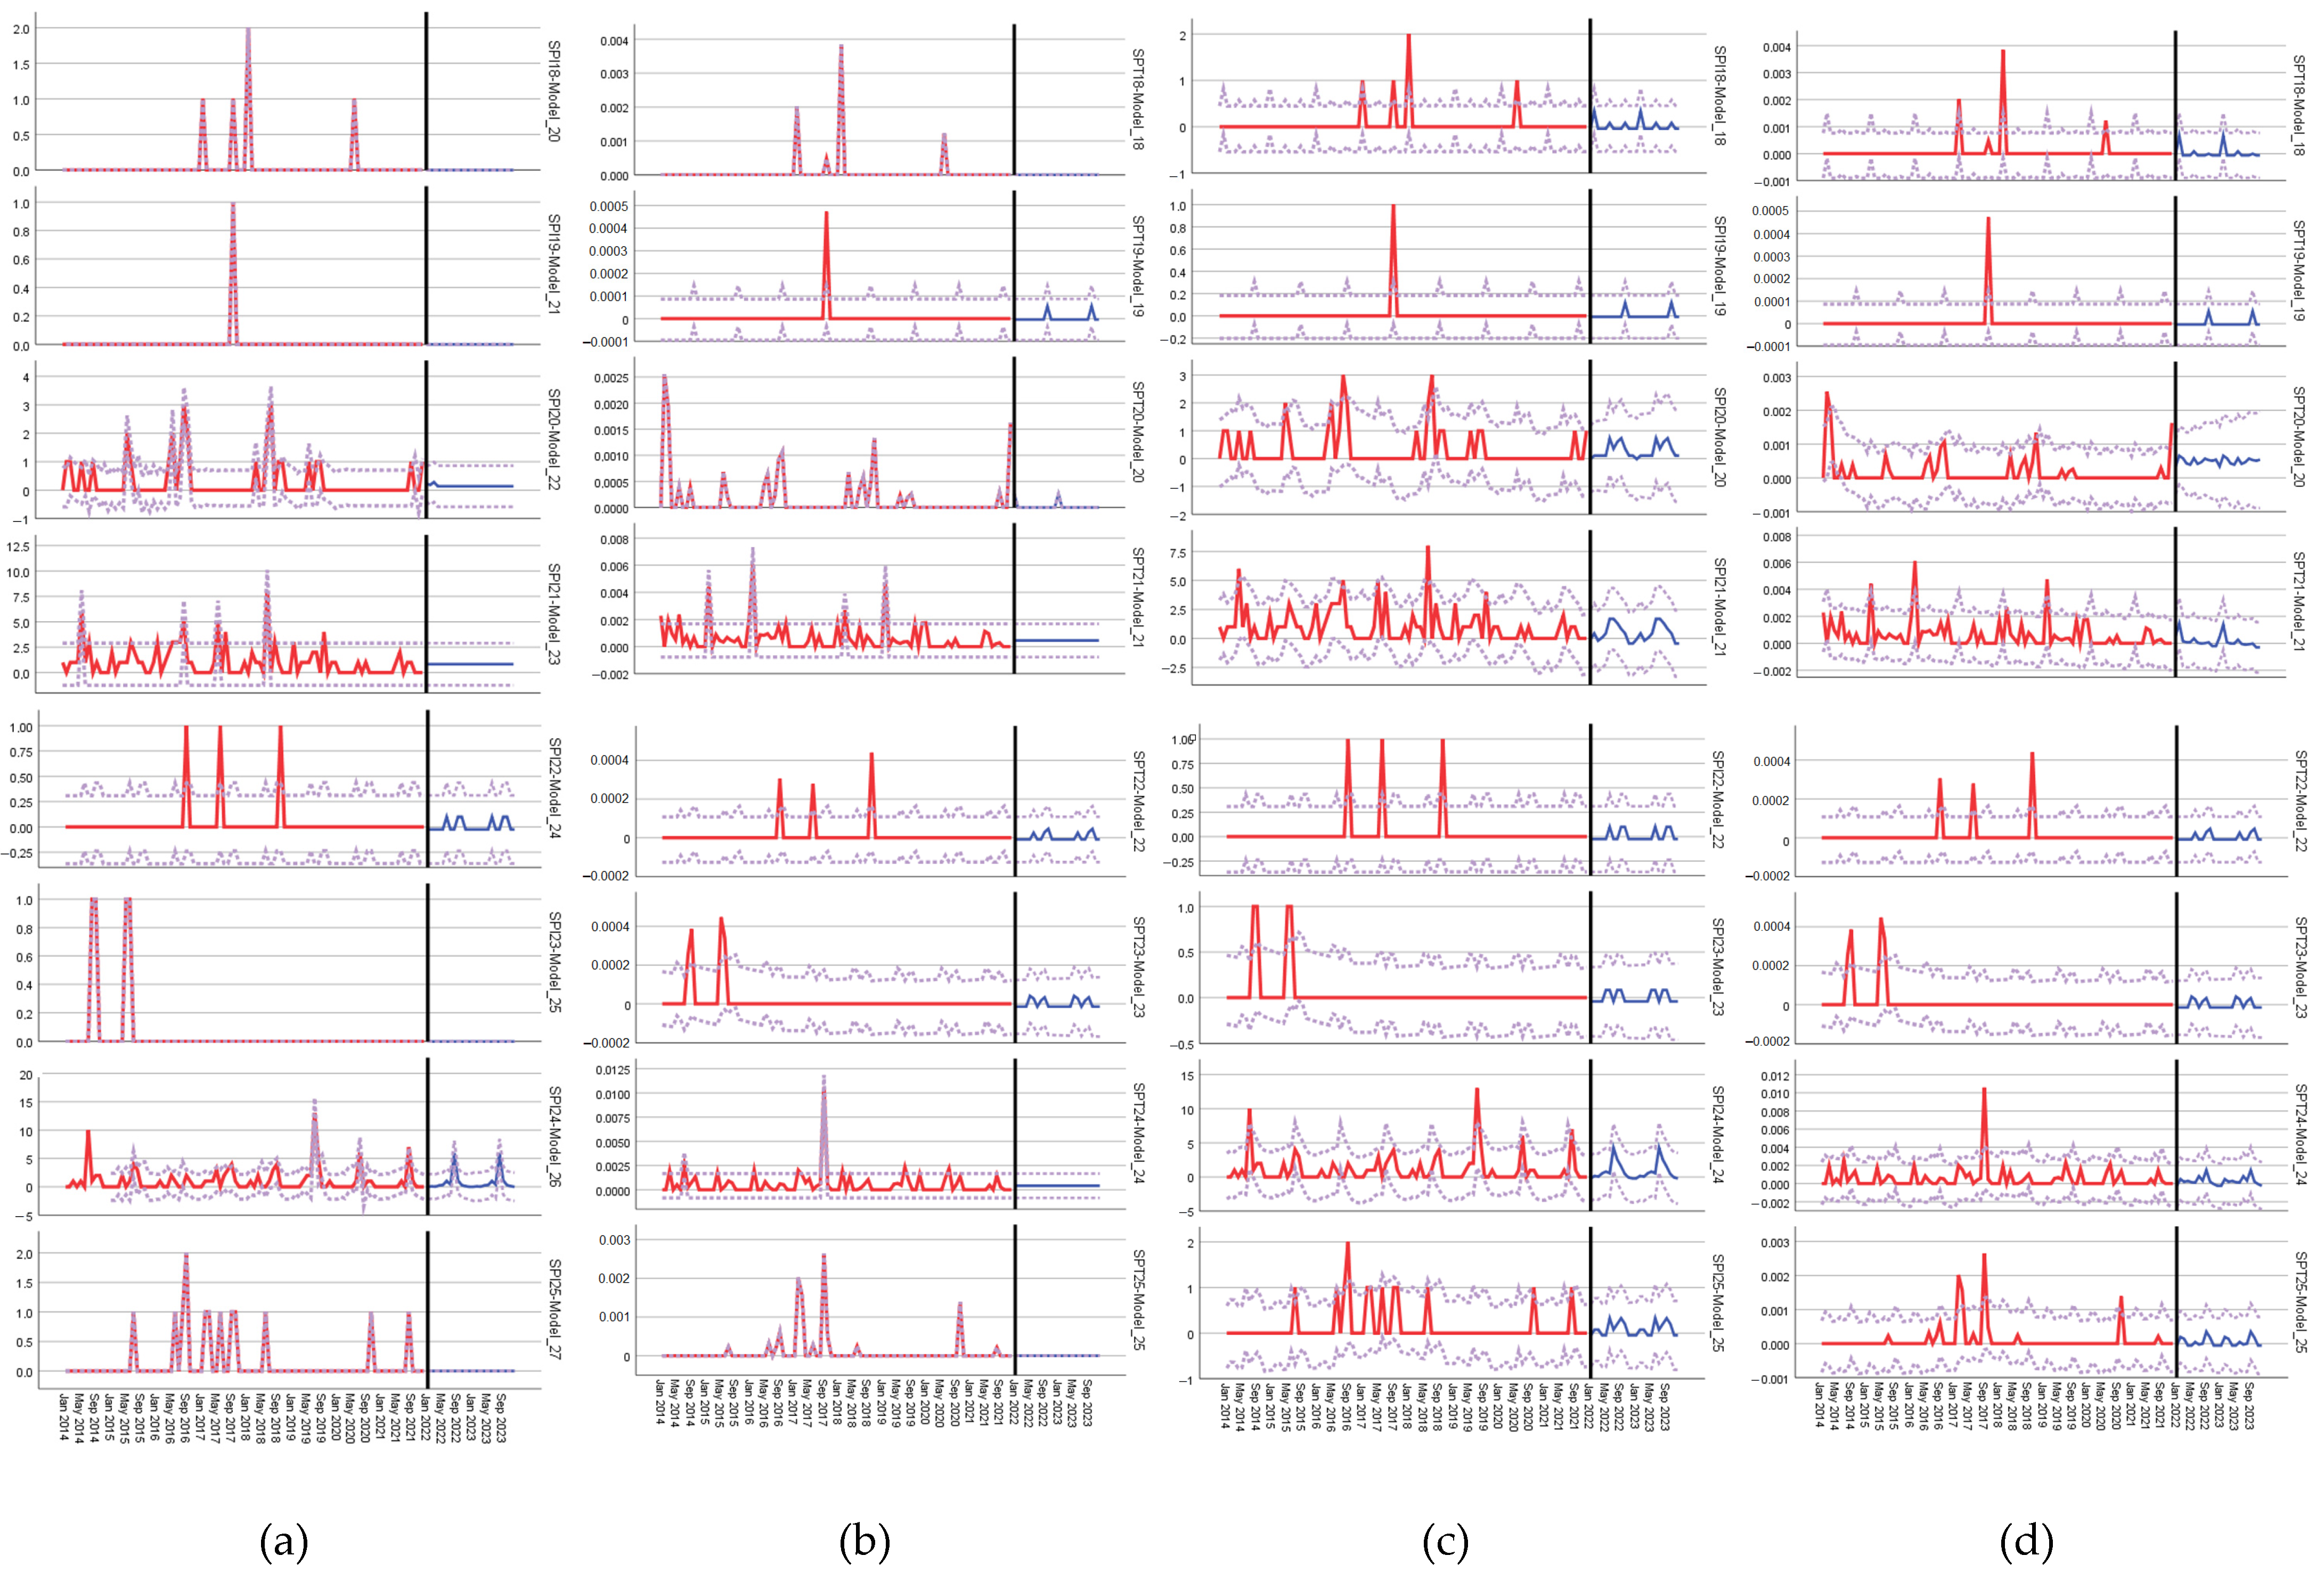
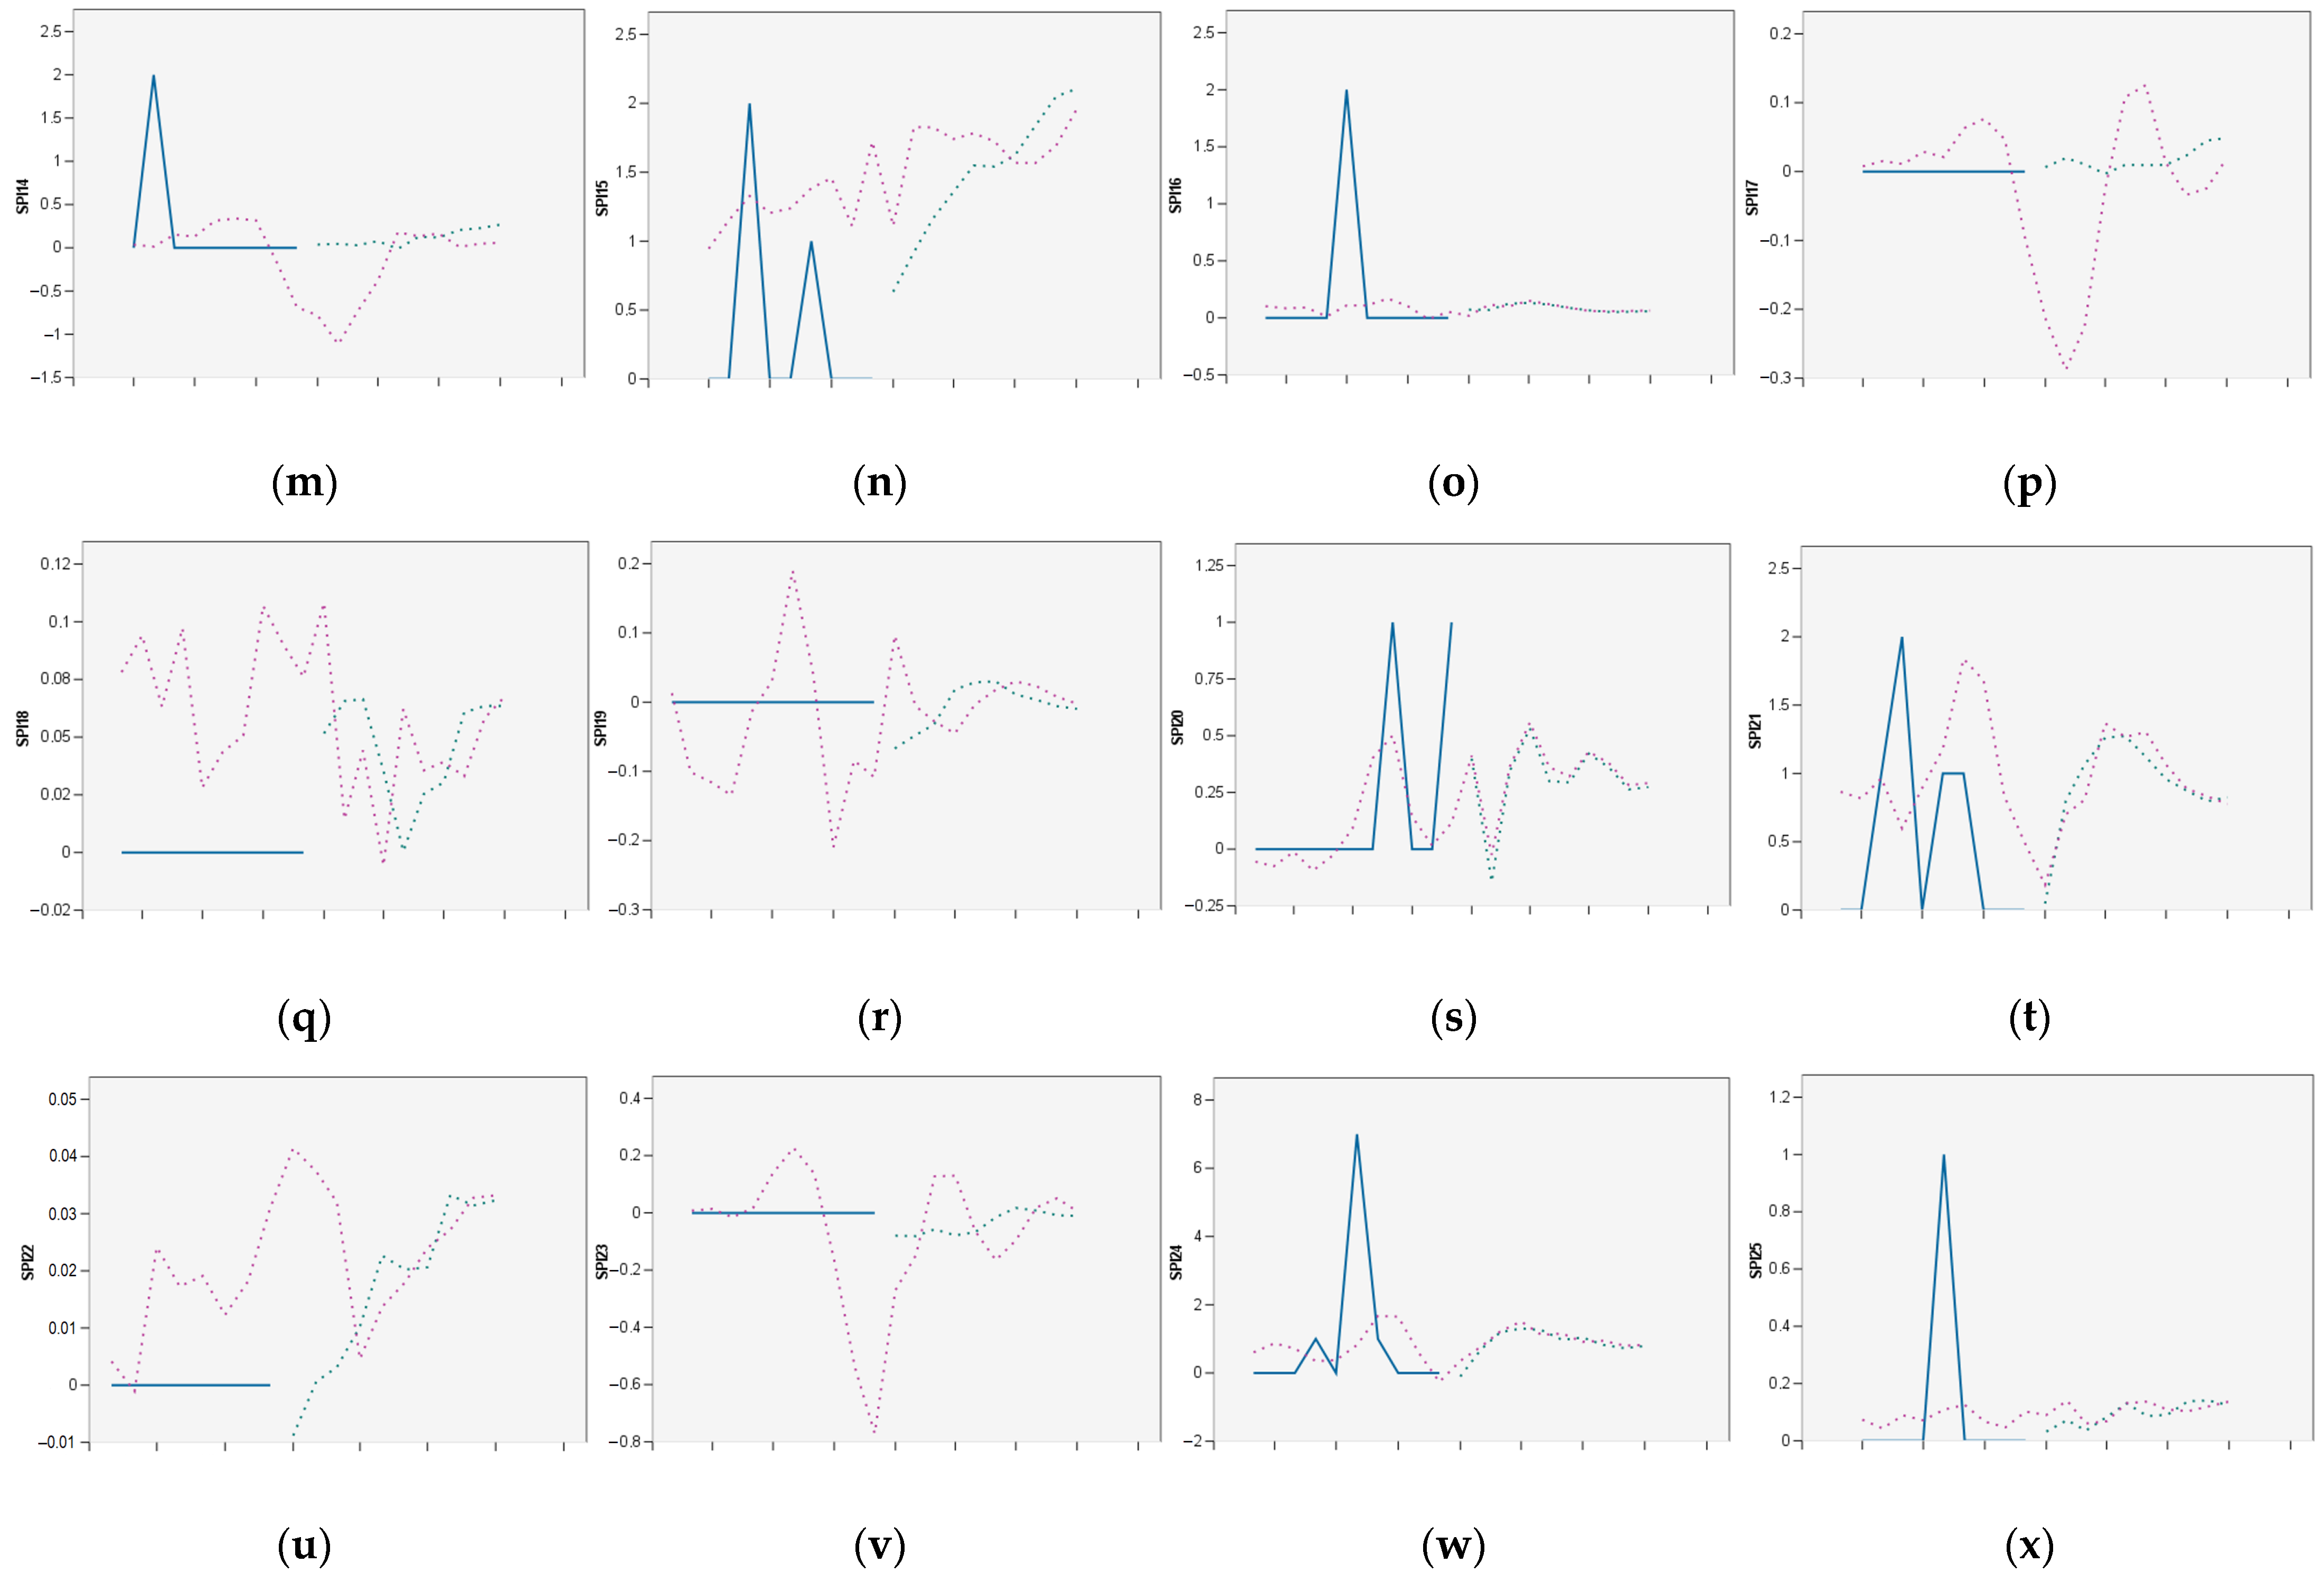
Figure 12 shows examples of a second set of initial forecasts from Split Airport safety performance indicators using IBM SPSS function Expert Modeler Forecasting. The first set uses ARIMA and exponential smoothing methods, while the second set uses exponential smoothing methods only. The set using smoothing methods could not build a model for safety performance indicator SPI6 because all of the values of the series are the same. The forecast period was set up to 24 months. Details on the second set of initial forecasts for Split Airport safety performance indicators with associated safety performance targets can be found in the Appendix D.
As per the results of the conducted research, i.e., from the predicted values of the safety performance indicators, it is evident that a higher number of potential occurrences (hazards) is anticipated in the near future, specifically for SPI15—Number of occurrences related to passenger handling at the gate, SPI21—Number of occurrences related to ground traffic (GSE) and vehicle driving, and SPI24—Number of occurrences related to wildlife. This can be explained by the fact that all of these indicators highlight higher values in summer months, due to a larger number of aircraft operations and a larger number of passenger, i.e., the seasonality component is strongly present at Split Airport. It also explains a larger number of wildlife occurrences, because in summer months wildlife activity is also higher.
4.4. Case Scenarios of Split Airport Safety Performance Indicators’ Behavior
Using the causal model presented in Section 3.1. (Figure 3), it can be learned which indicators (variables) should be modified in order to obtain the desired level in each safety performance indicator.
This part shows how values of organizational indicators (in this case two available organizational indicators OI1:Number of aircraft operations and OI2—Number of passengers) affect future behavior of safety performance indicators, i.e., how they can influence or trigger adverse events in airport operations.
Four case scenarios are built to show how different values of organizational indicators (lower of the higher than original values), due to established causal relations, impact future adverse occurrences at Split Airport.
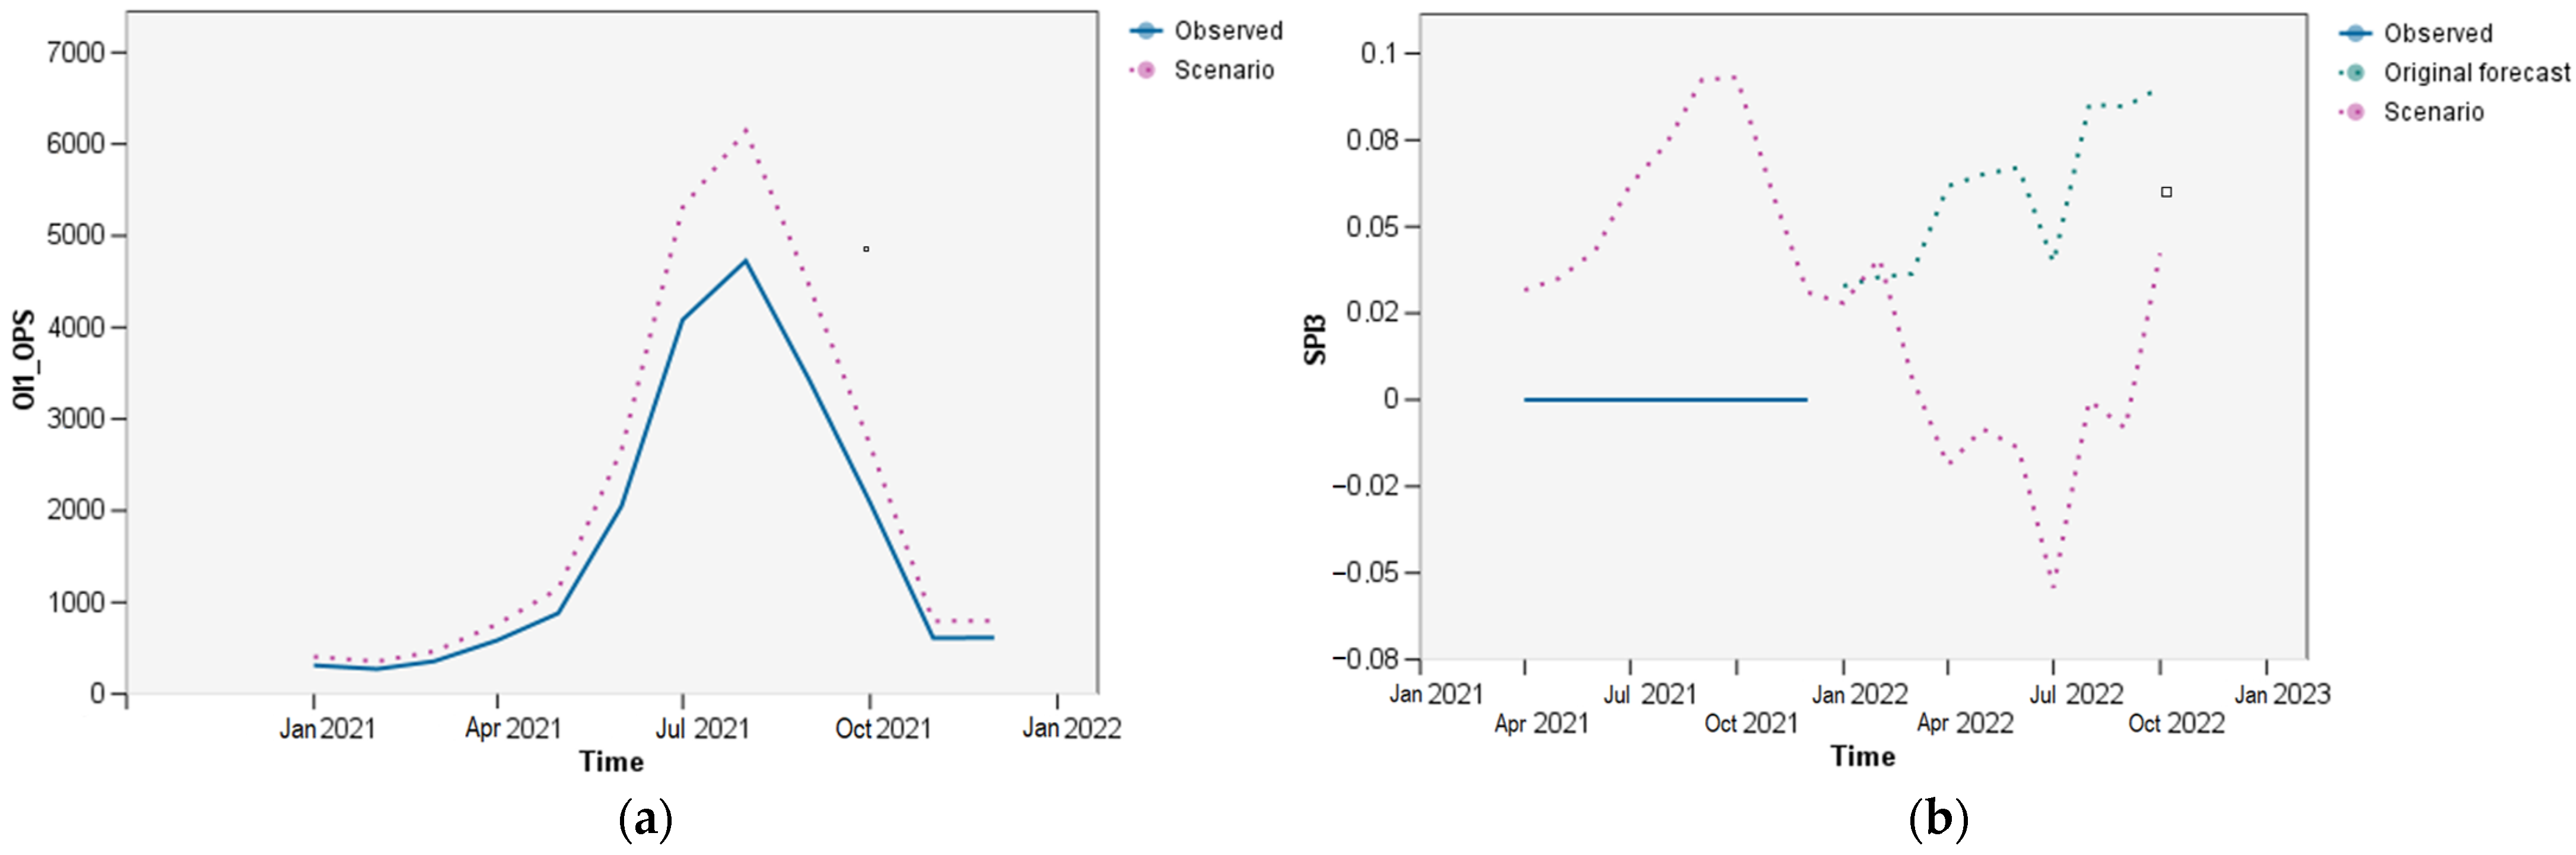
4.4.1. Scenario 1—Impact on Safety Performance Indicators Due to Increase of Aircraft Operations
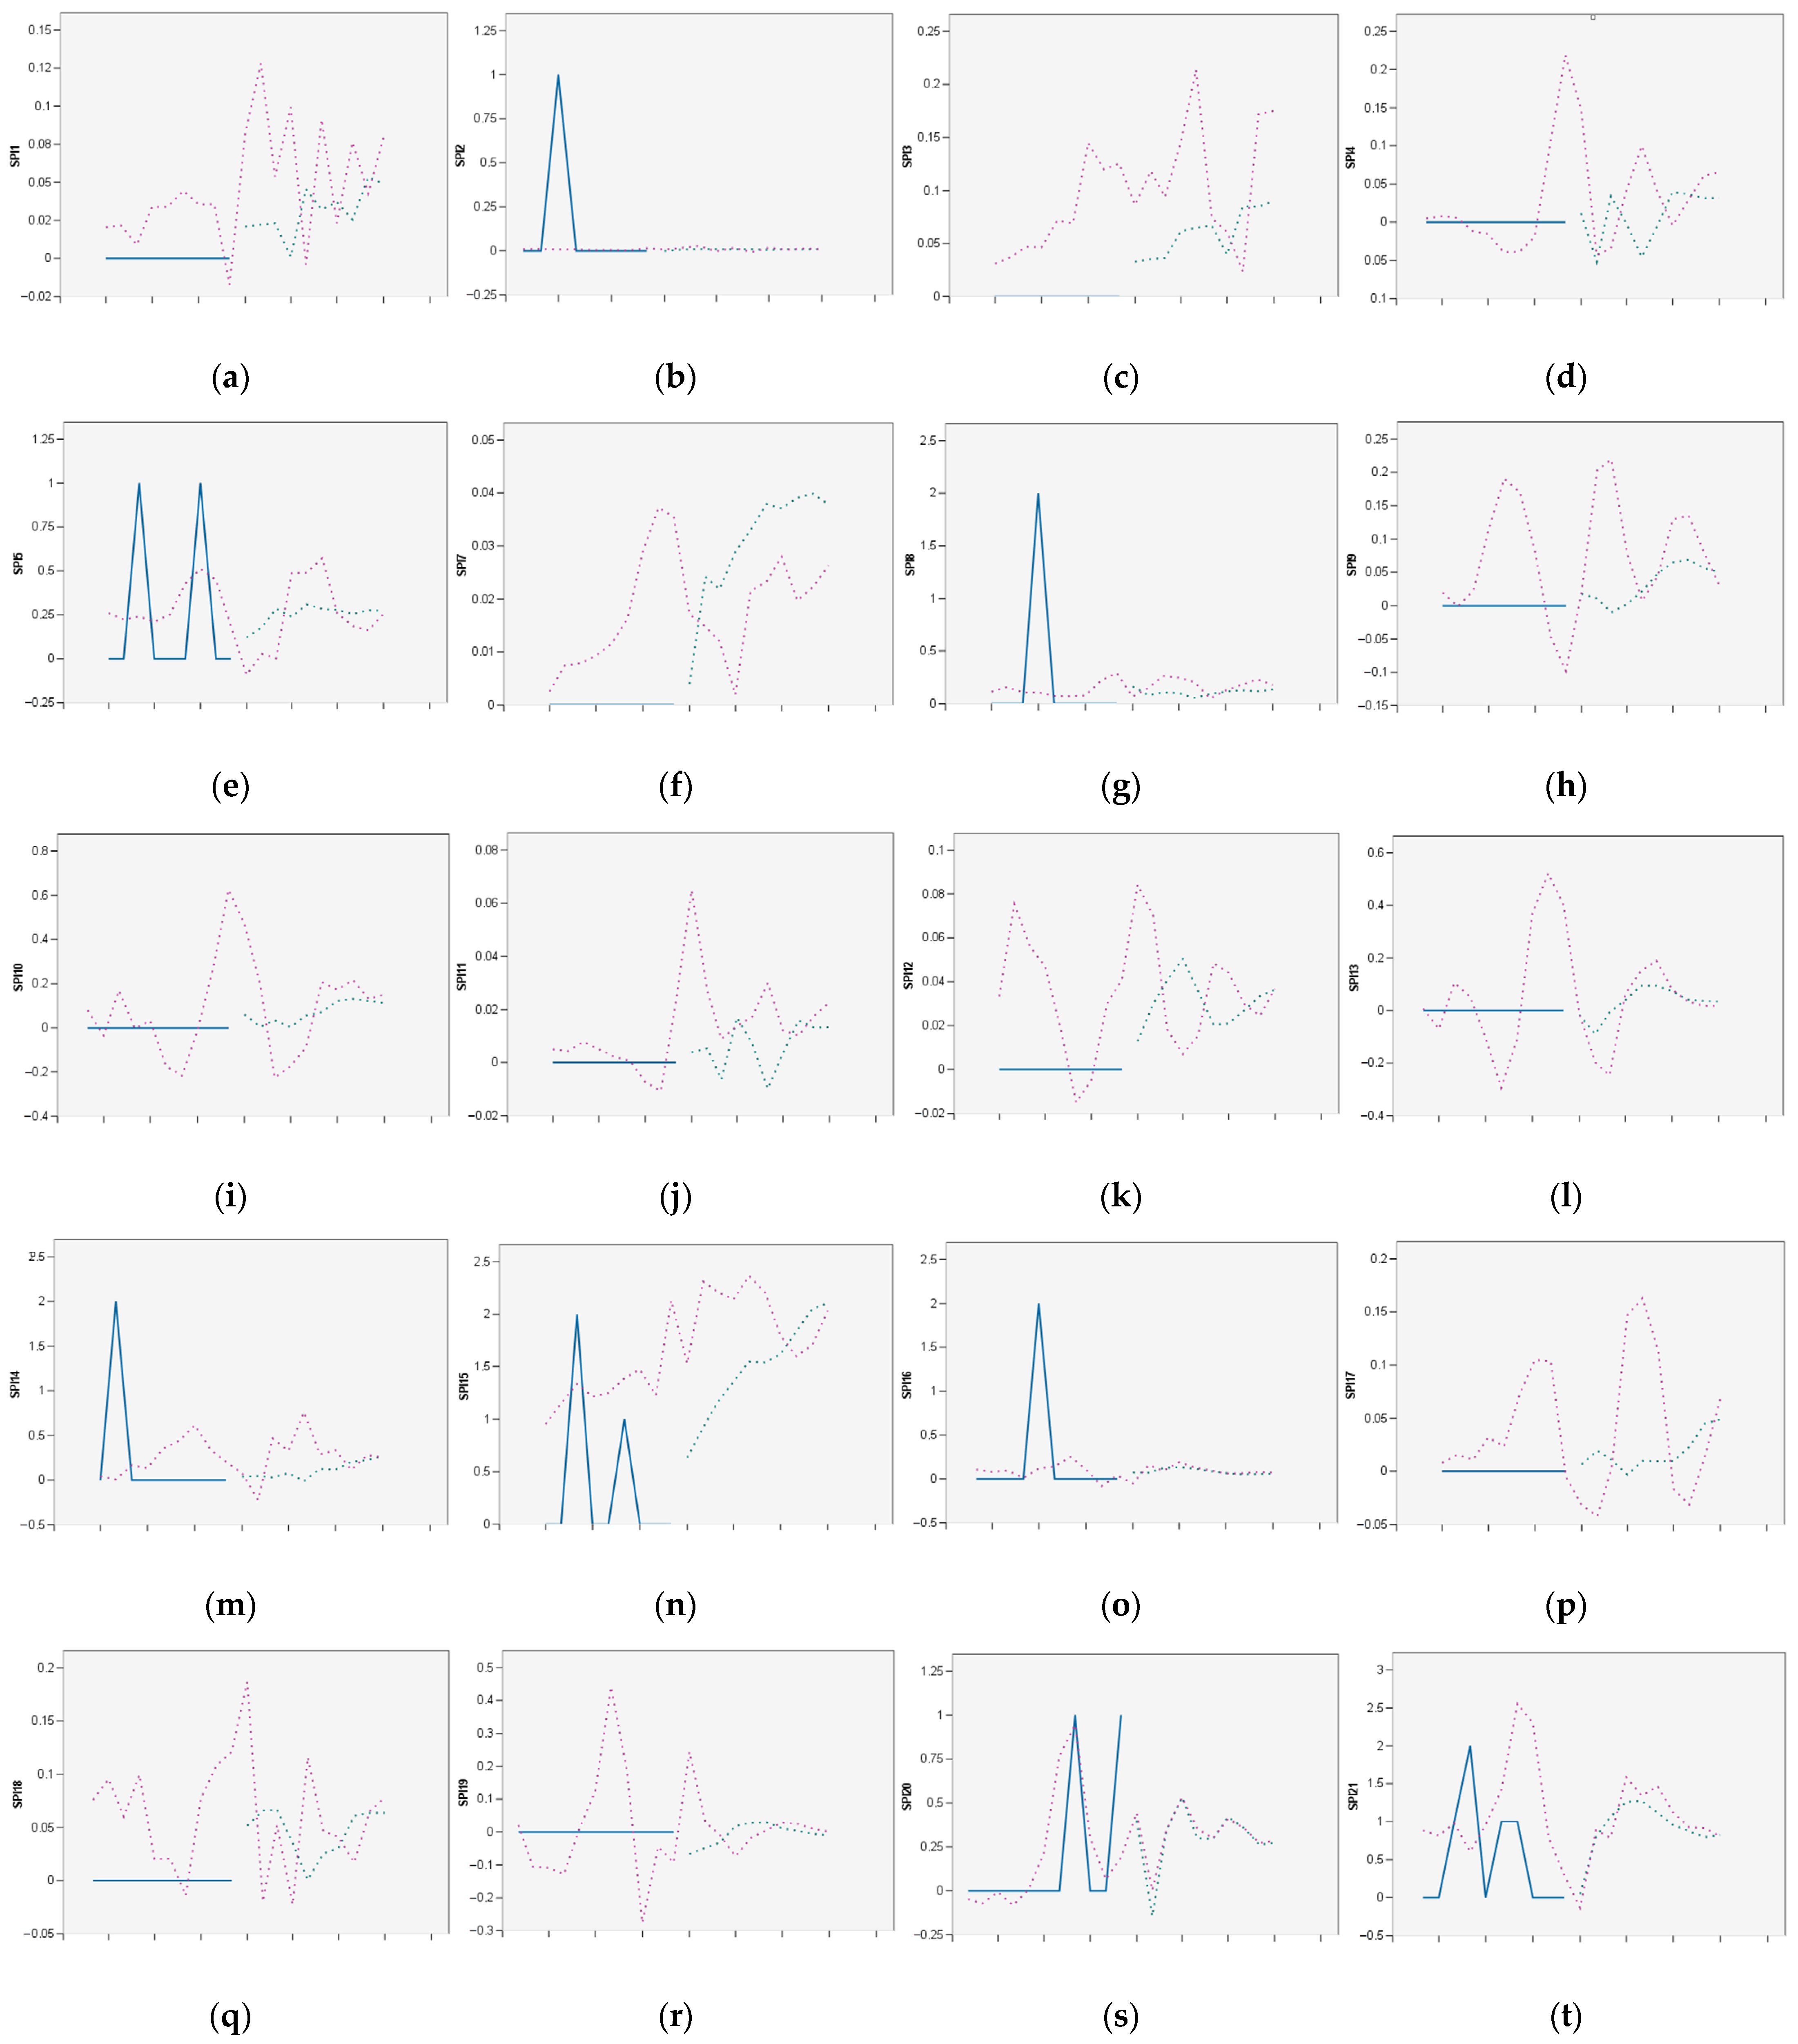
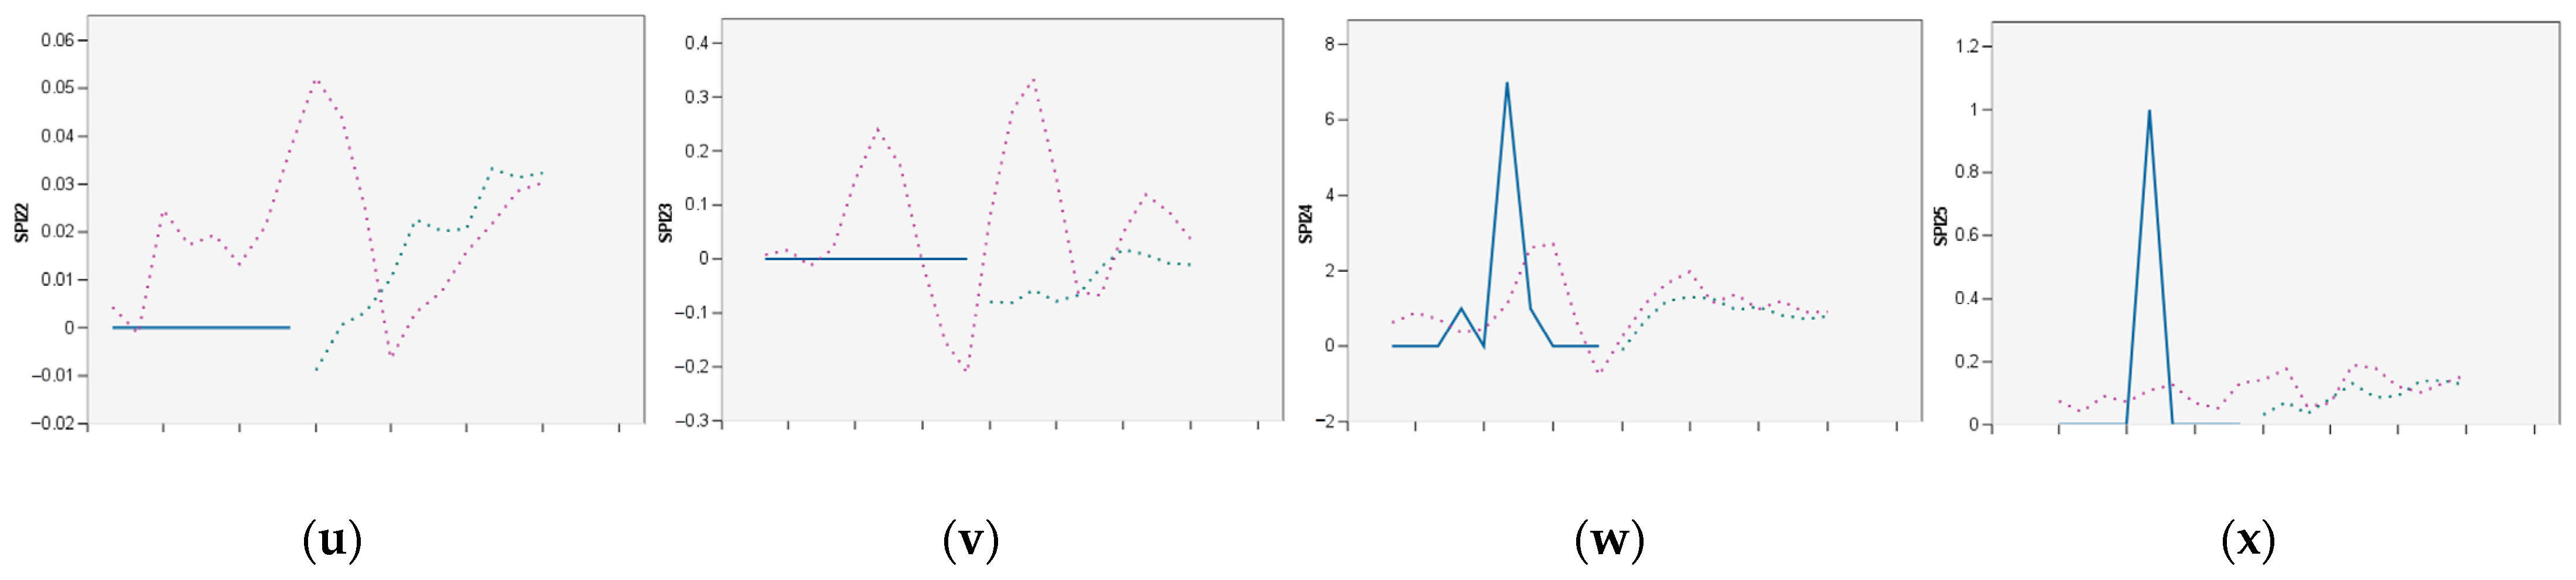
The first scenario shows an example of increasing the organizational indicator OI1—Number of aircraft operations and its impact on safety performance indicator, and SPI3—Number of dangerous goods incidents (Figure 13). Figure 13a shows original values of OI1 and increased values of OI1 by 30% and Figure 13b shows how changes in OI1 impacts the behavior of safety performance indicator SPI3. Details of how an increase in OI1 impacts the behavior of every safety performance indicator can be found in Appendix E.
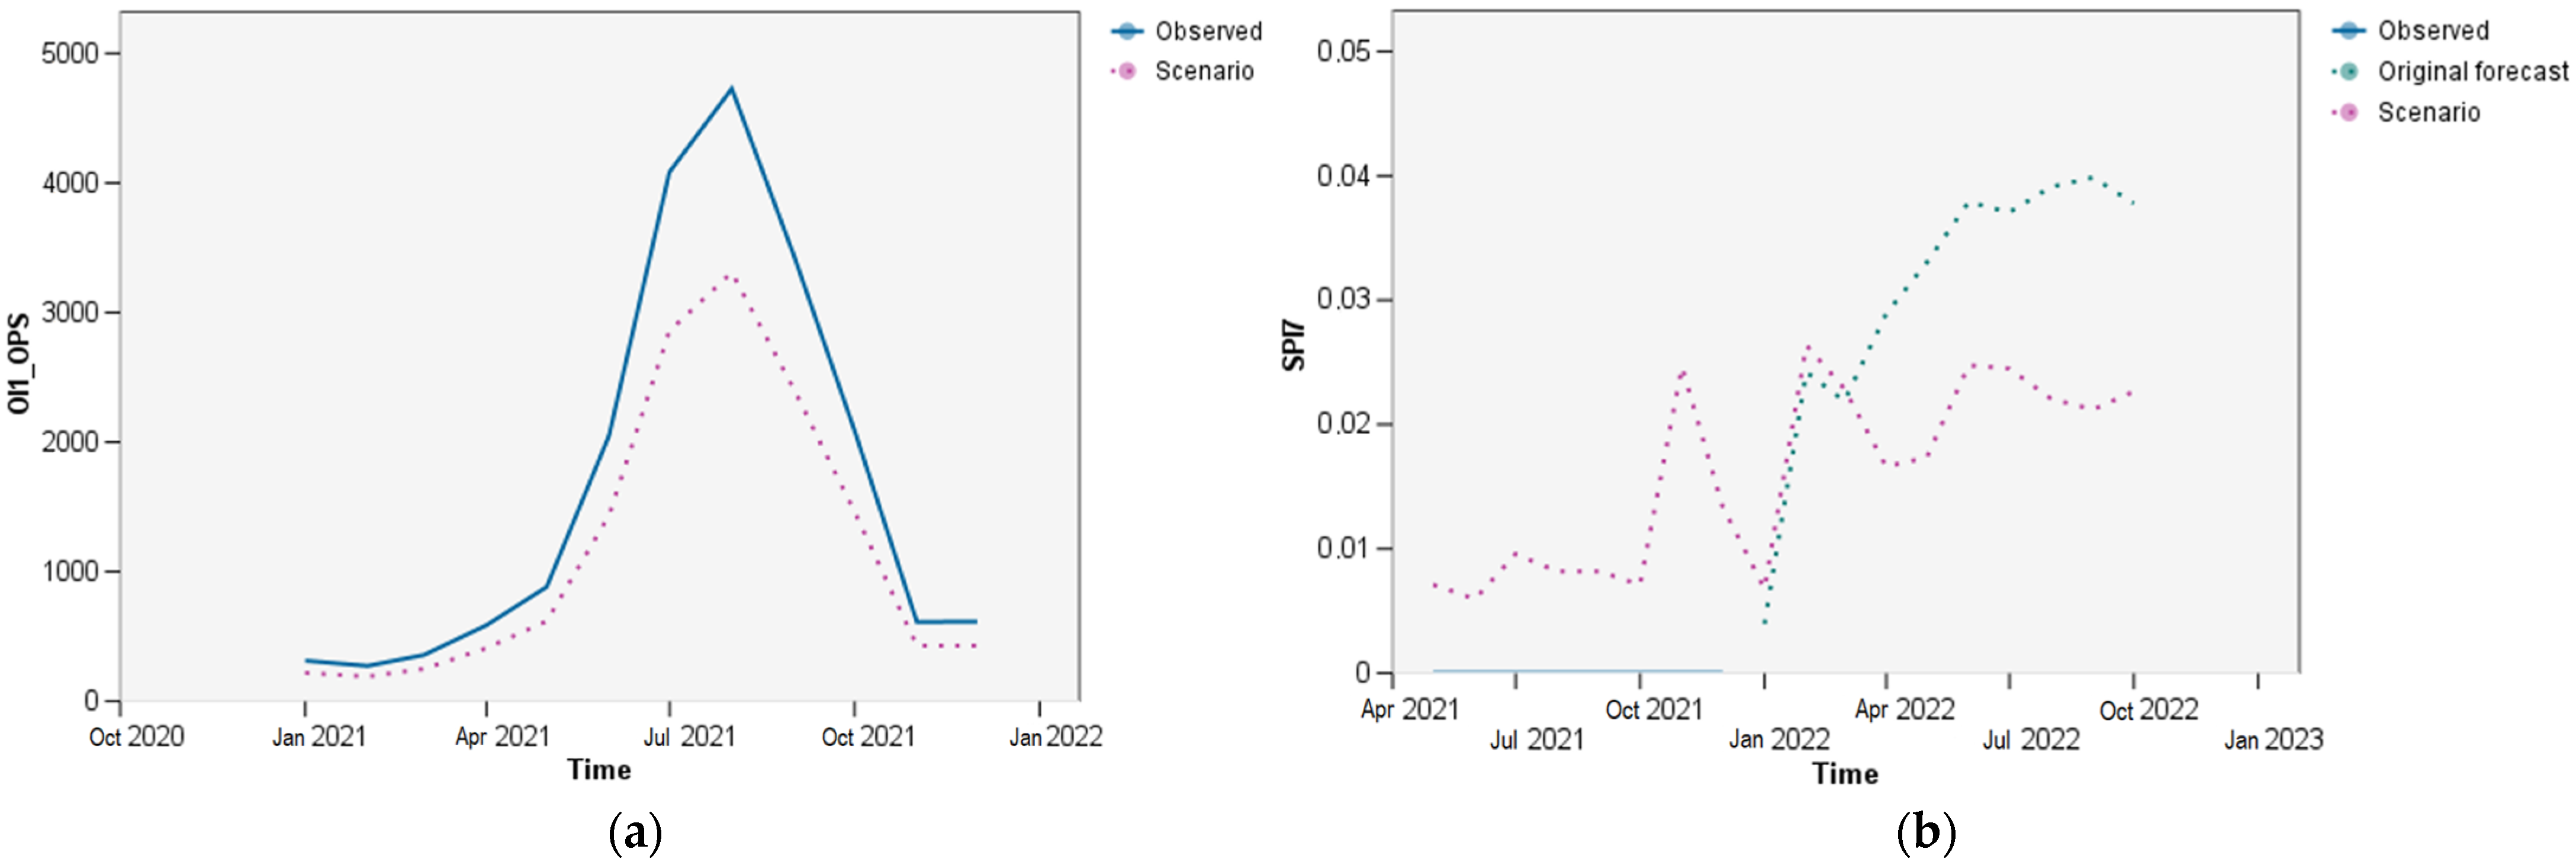
4.4.2. Scenario 2—Impact on Safety Performance Indicators Due to Decrease of Aircraft Operations
The second scenario shows an example of decreasing the organizational indicator OI1—Number of aircraft operations and its impact on safety performance indicator SPI7—Number of training deficiencies (Figure 14). Figure 14a shows the original values of OI1 and the decreased values of OI1 by 30% and Figure 14b shows how a change in OI1 impacts the behavior of the safety performance indicator SPI7. Details of how a decrease in OI1 impacts the behavior of every safety performance indicator can be found in Appendix E.
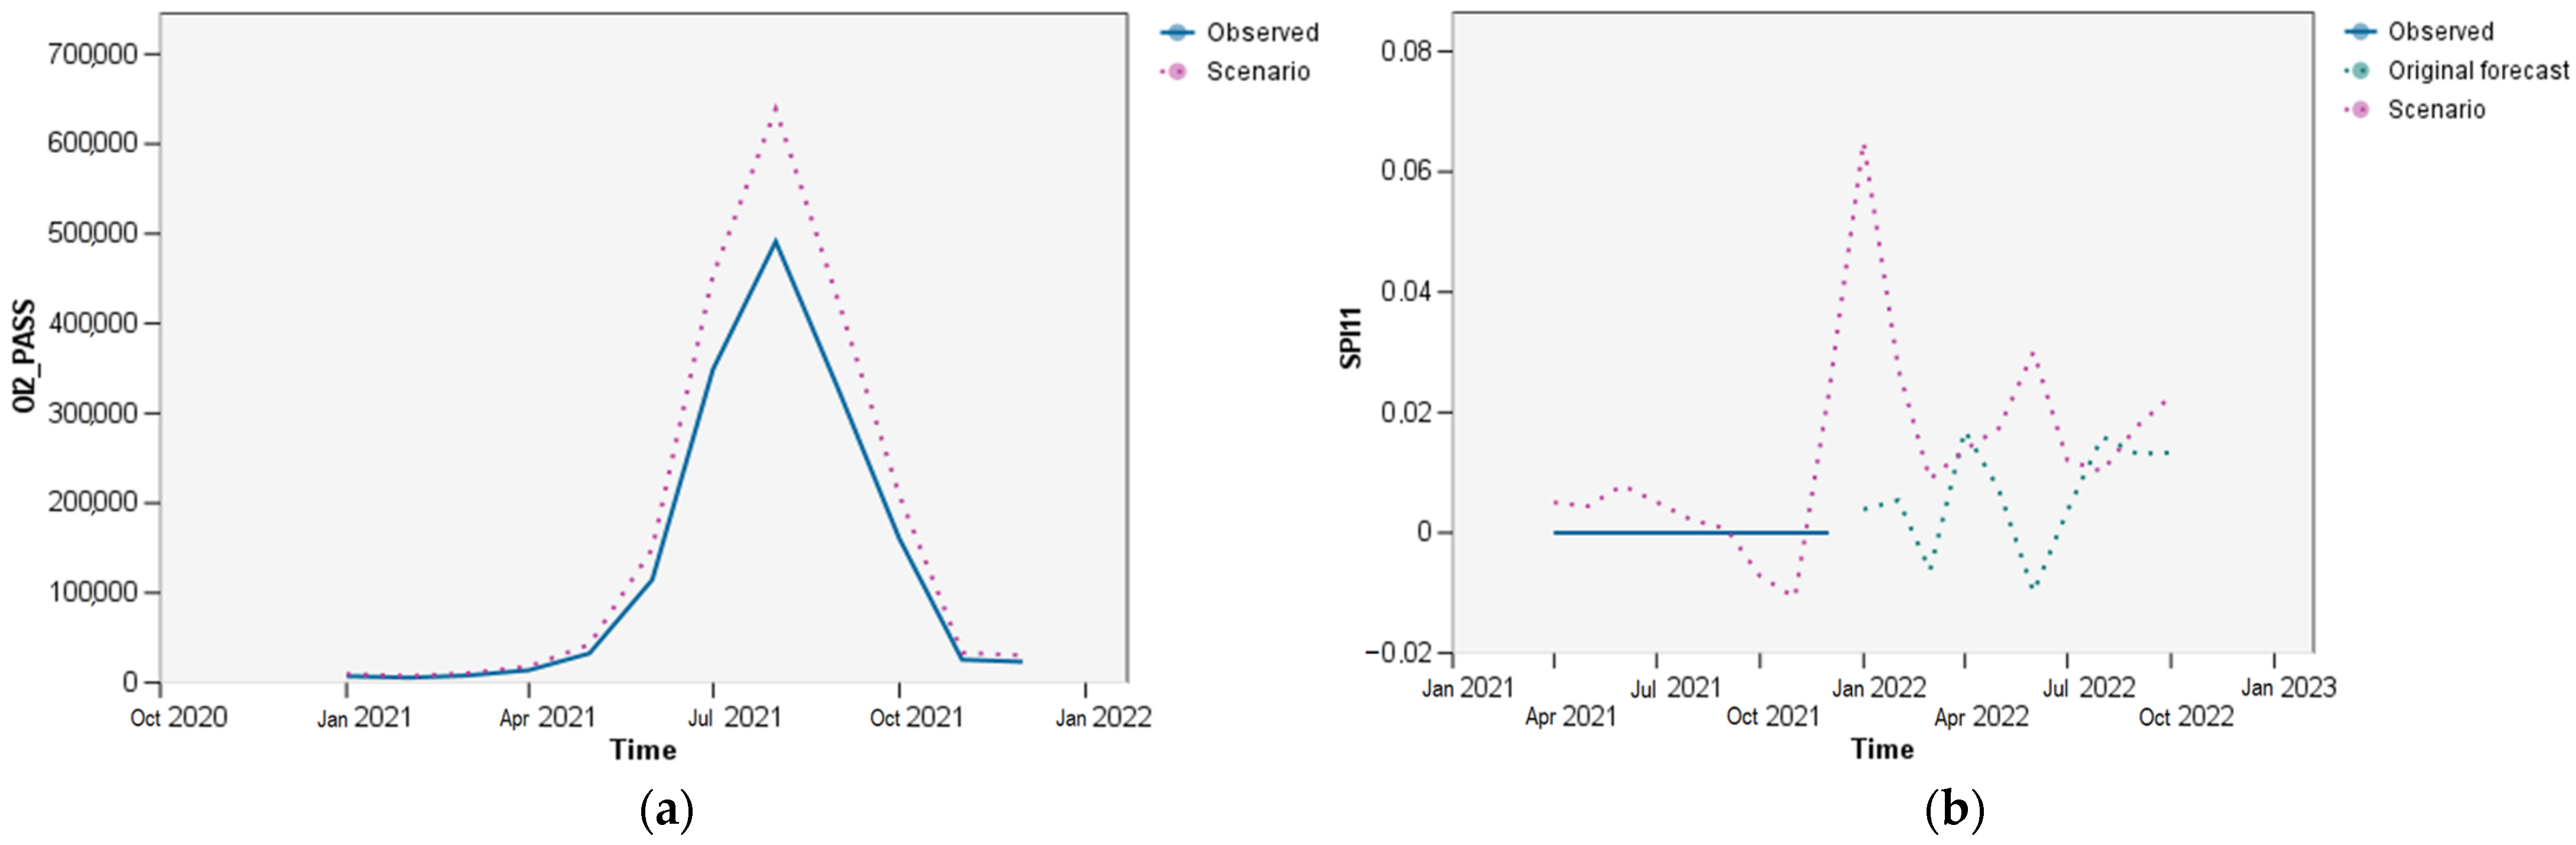
4.4.3. Scenario 3—Impact on Safety Performance Indicators Due to Increase of Number of Passengers
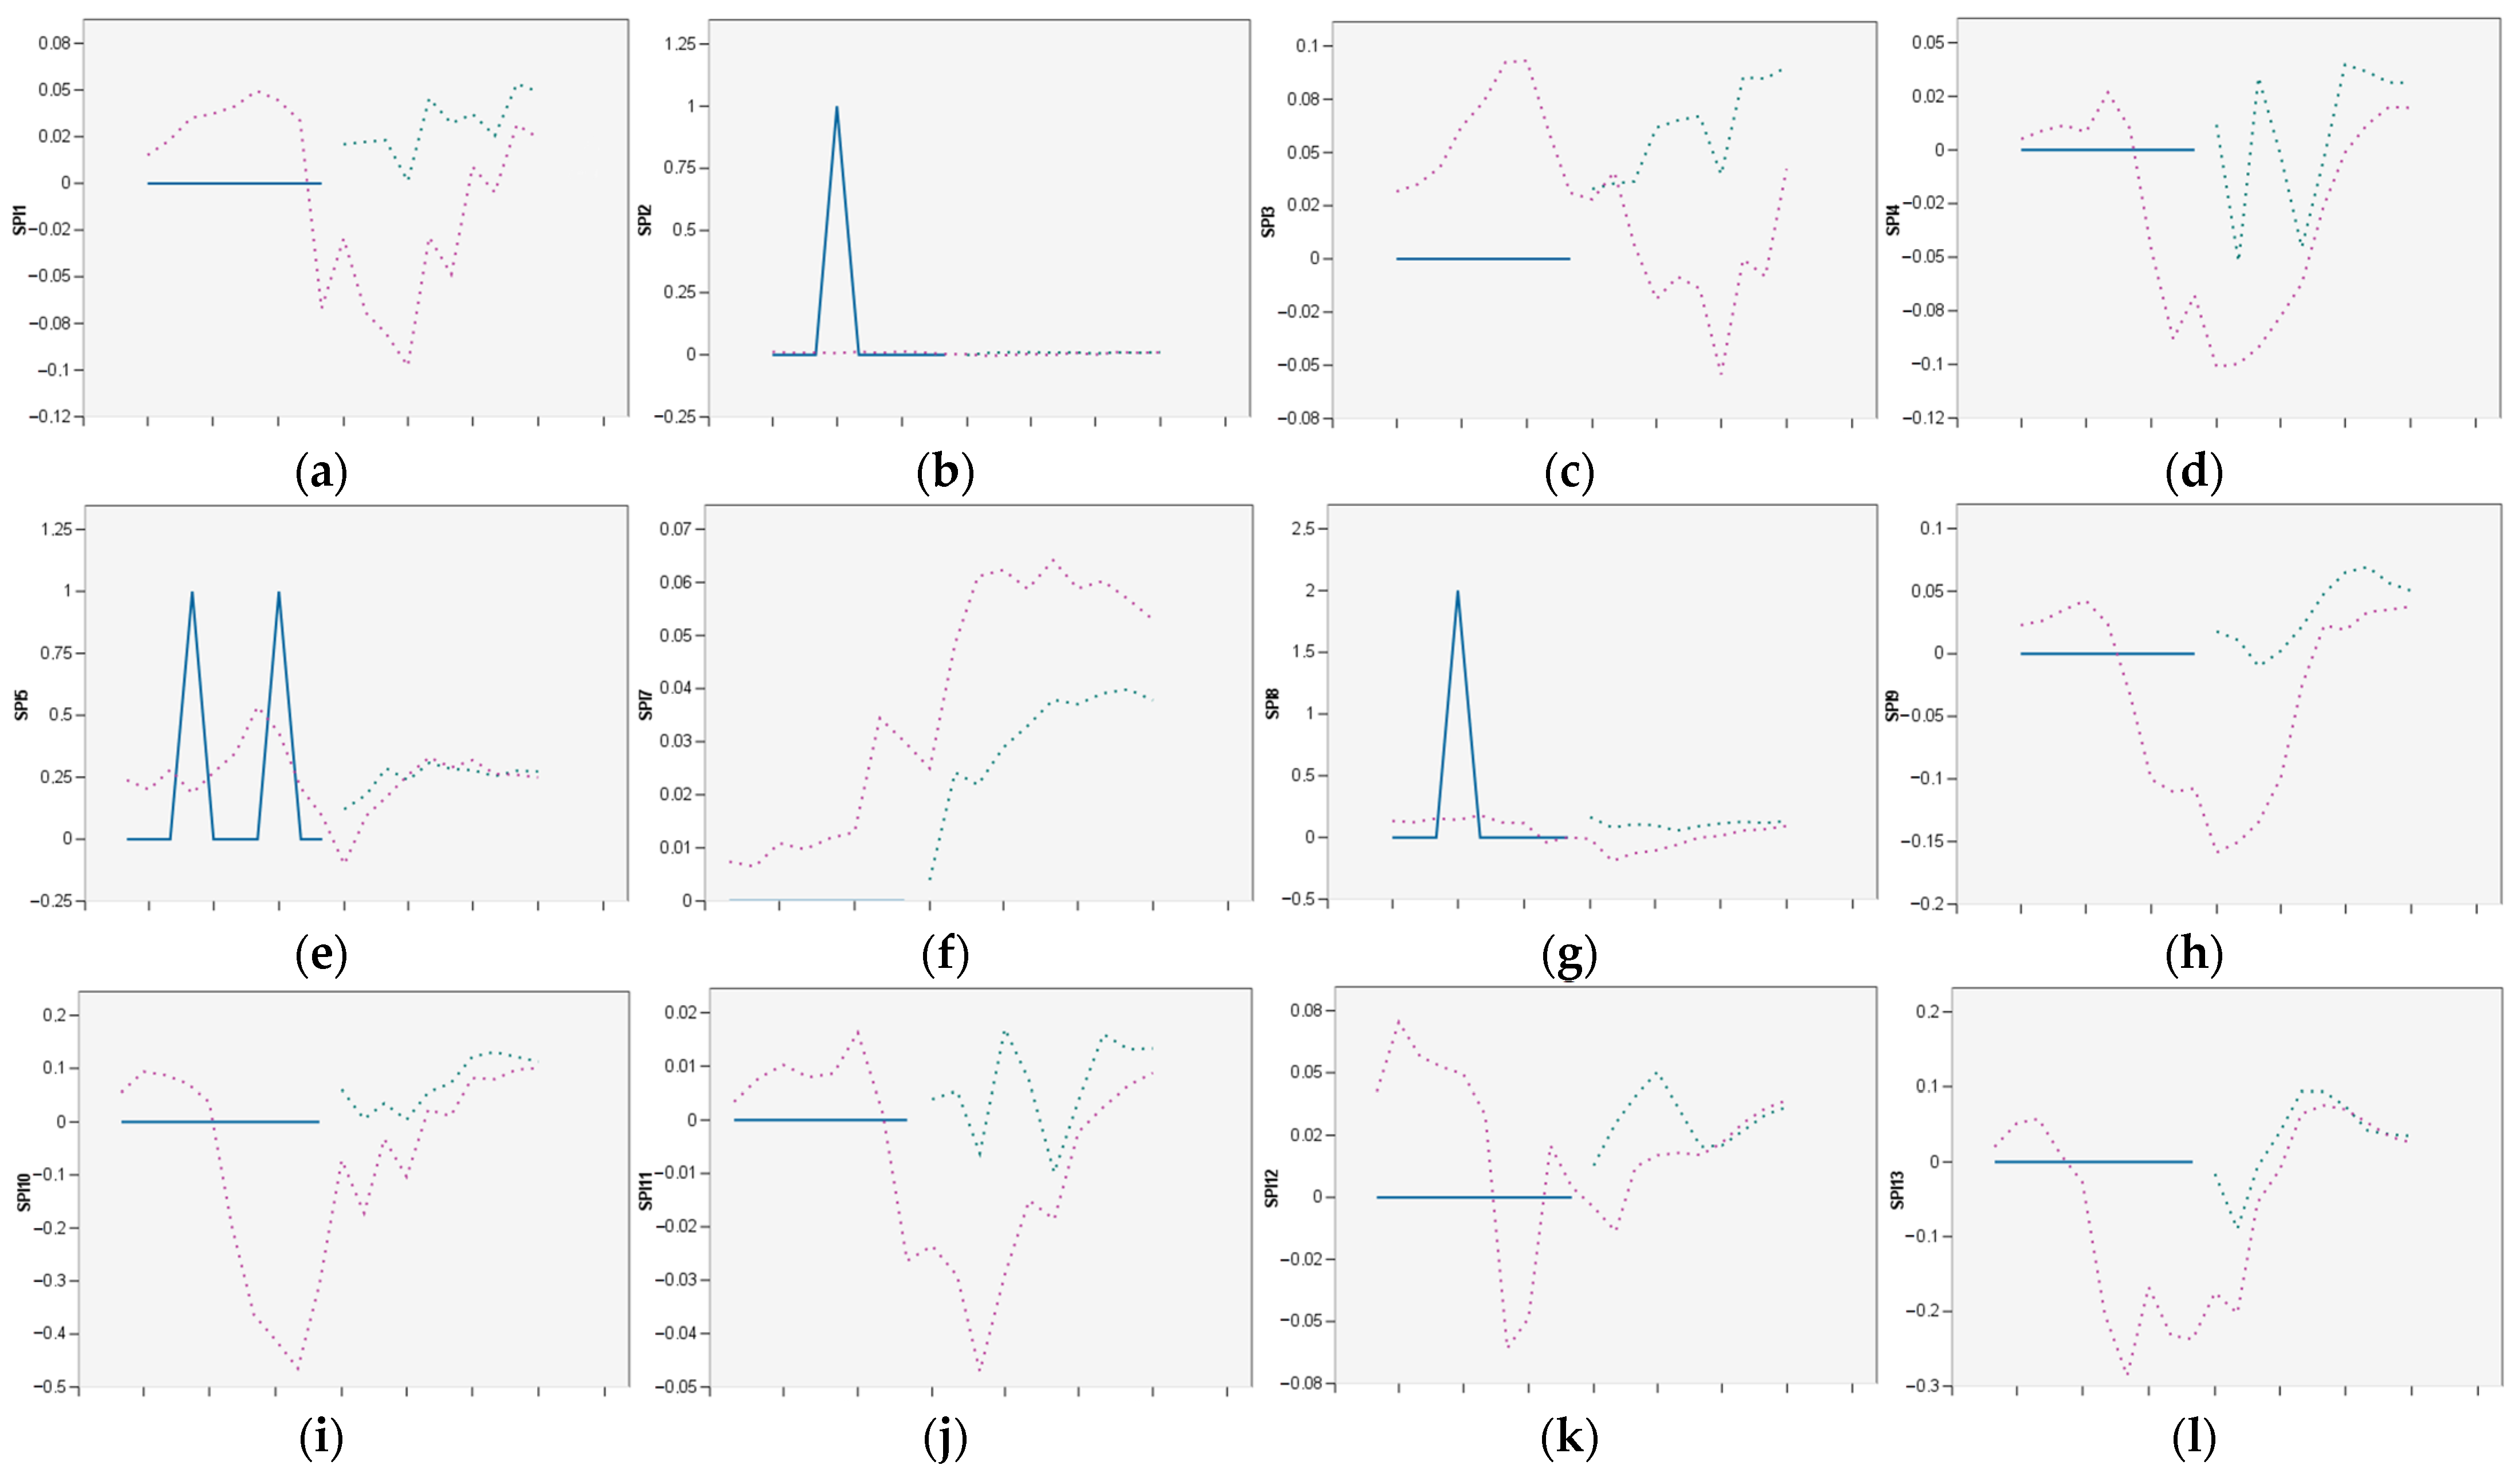
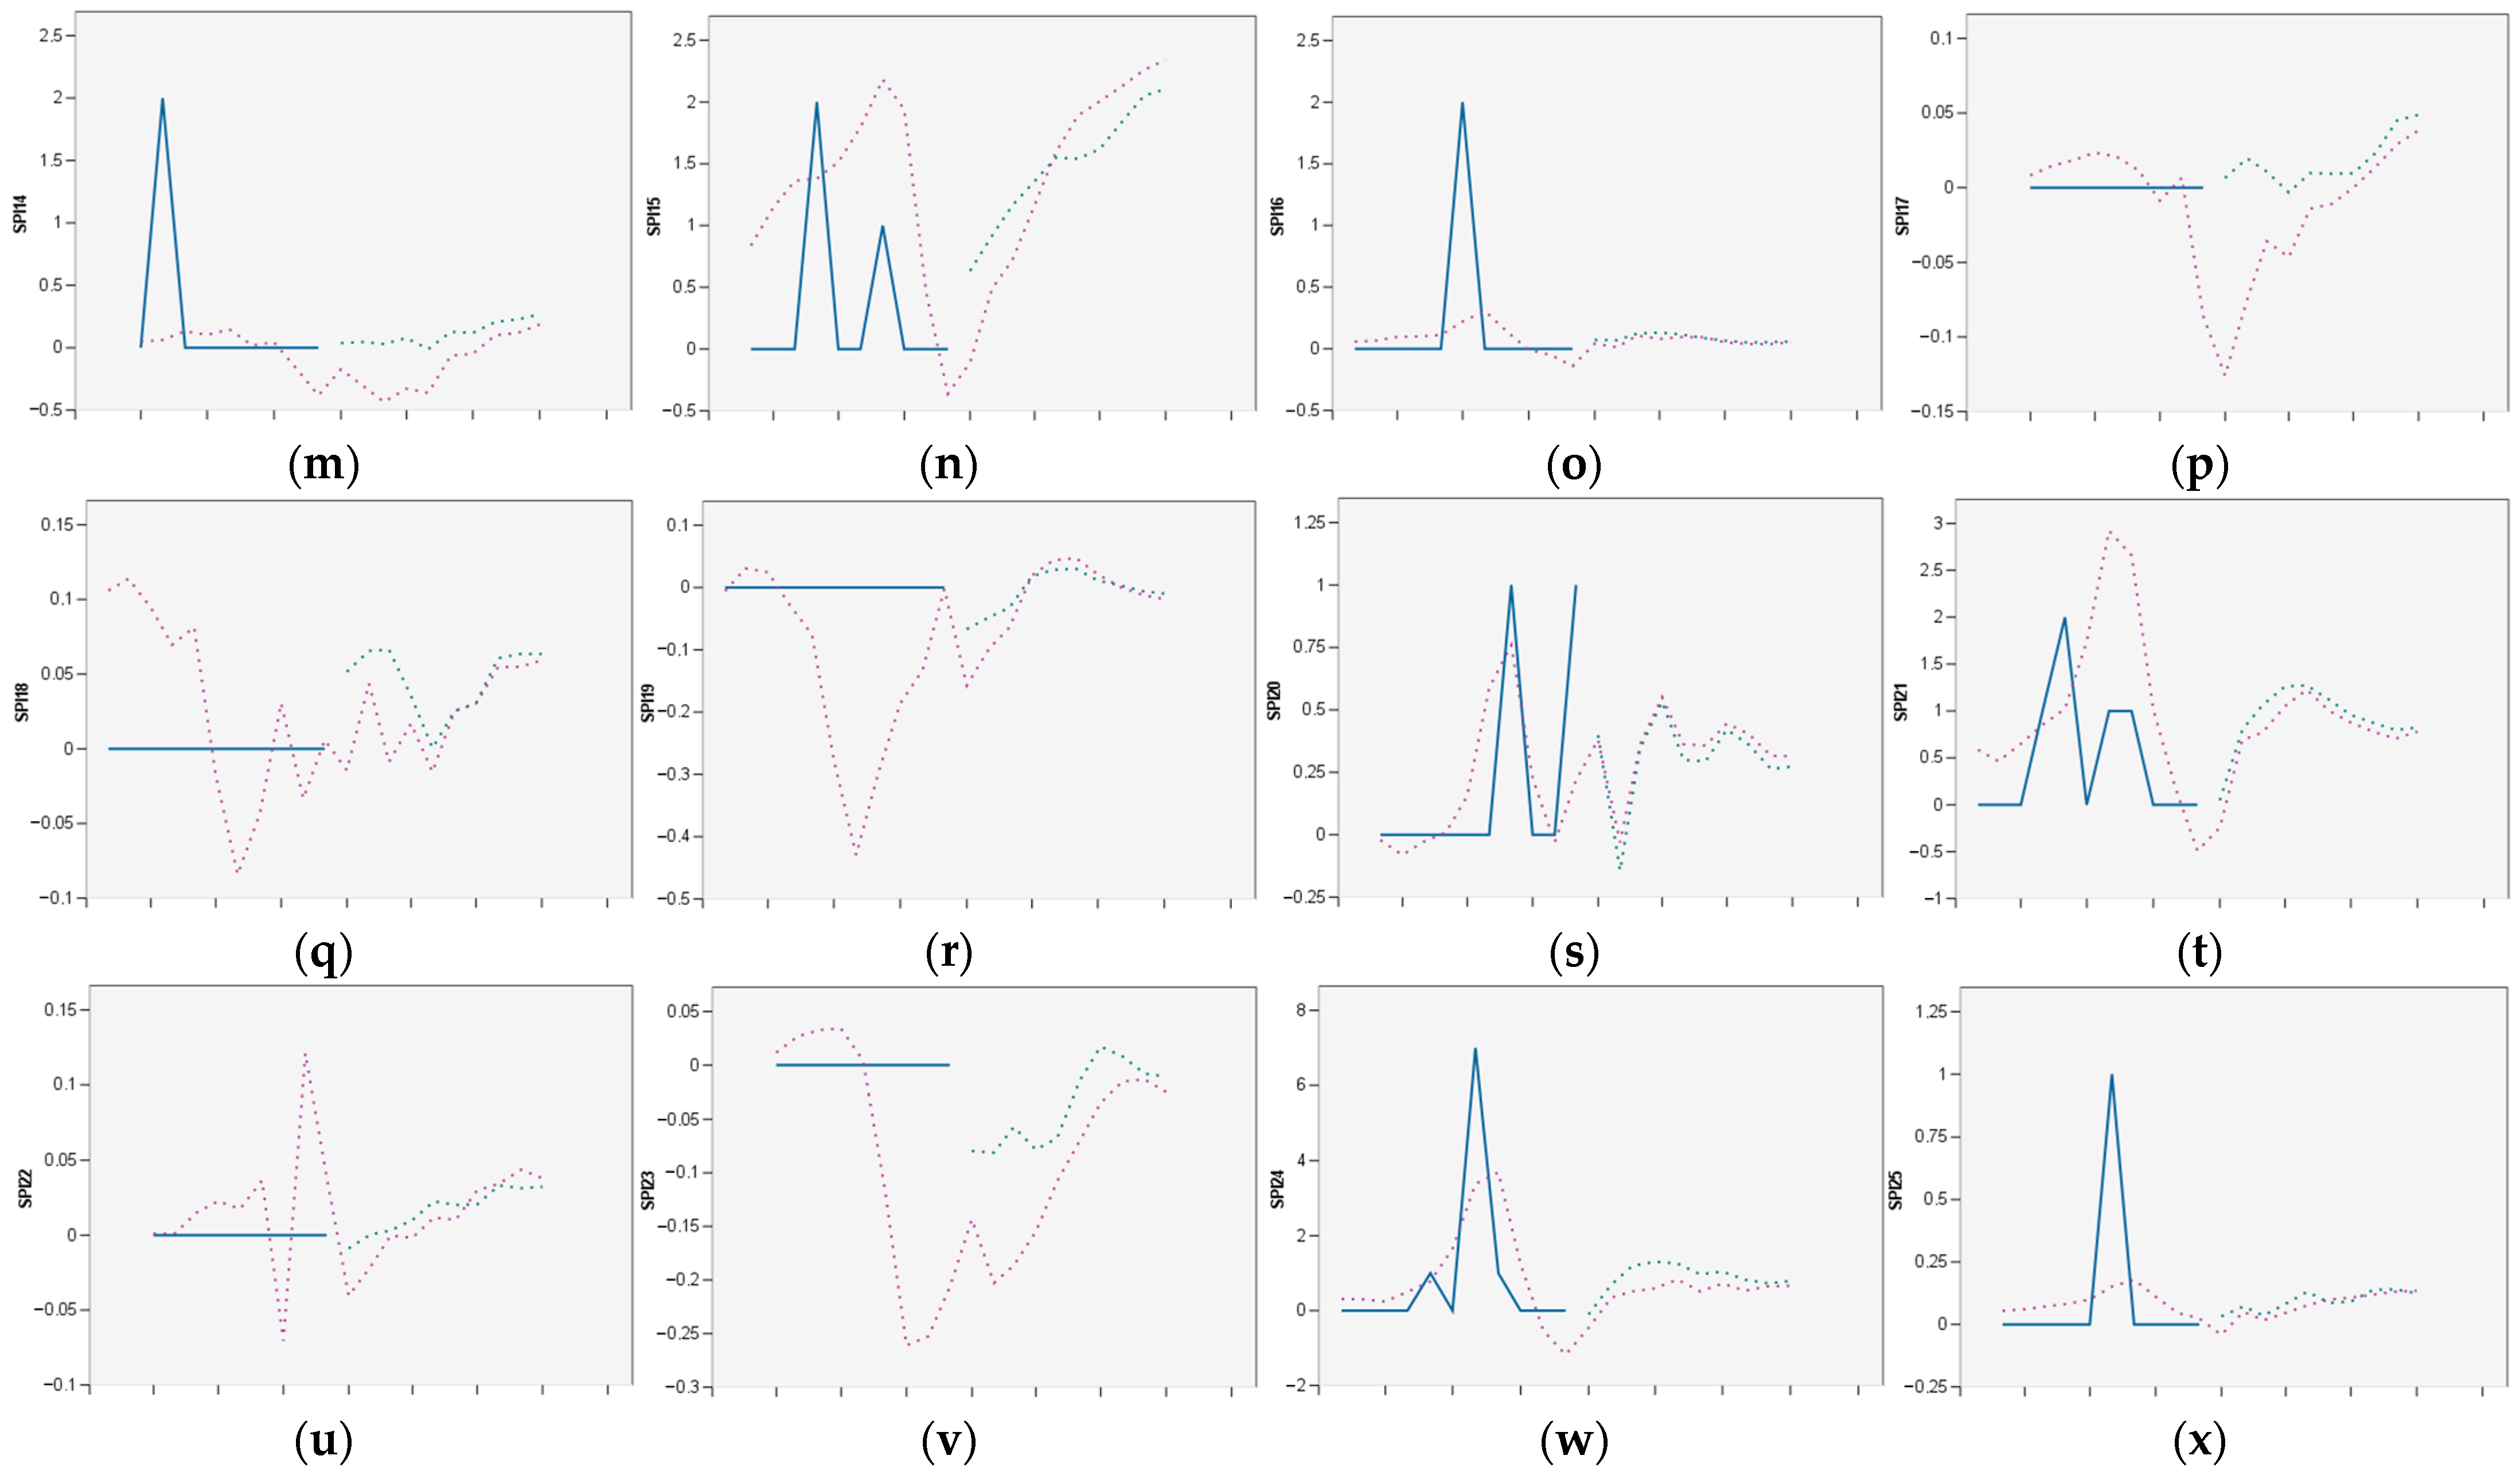
The third scenario shows an example of increasing the organizational indicator OI2—Number of passengers and its impact on safety performance indicator SPI11—Number of occurrences related to communication (Figure 15). Figure 15a shows the original values of OI2 and increased values of OI2 by 30% and Figure 15b shows how a change in OI2 impacts the behavior of the safety performance indicator SPI11. Details of how an increase in OI2 impacts the behavior of every safety performance indicator can be found in Appendix E.
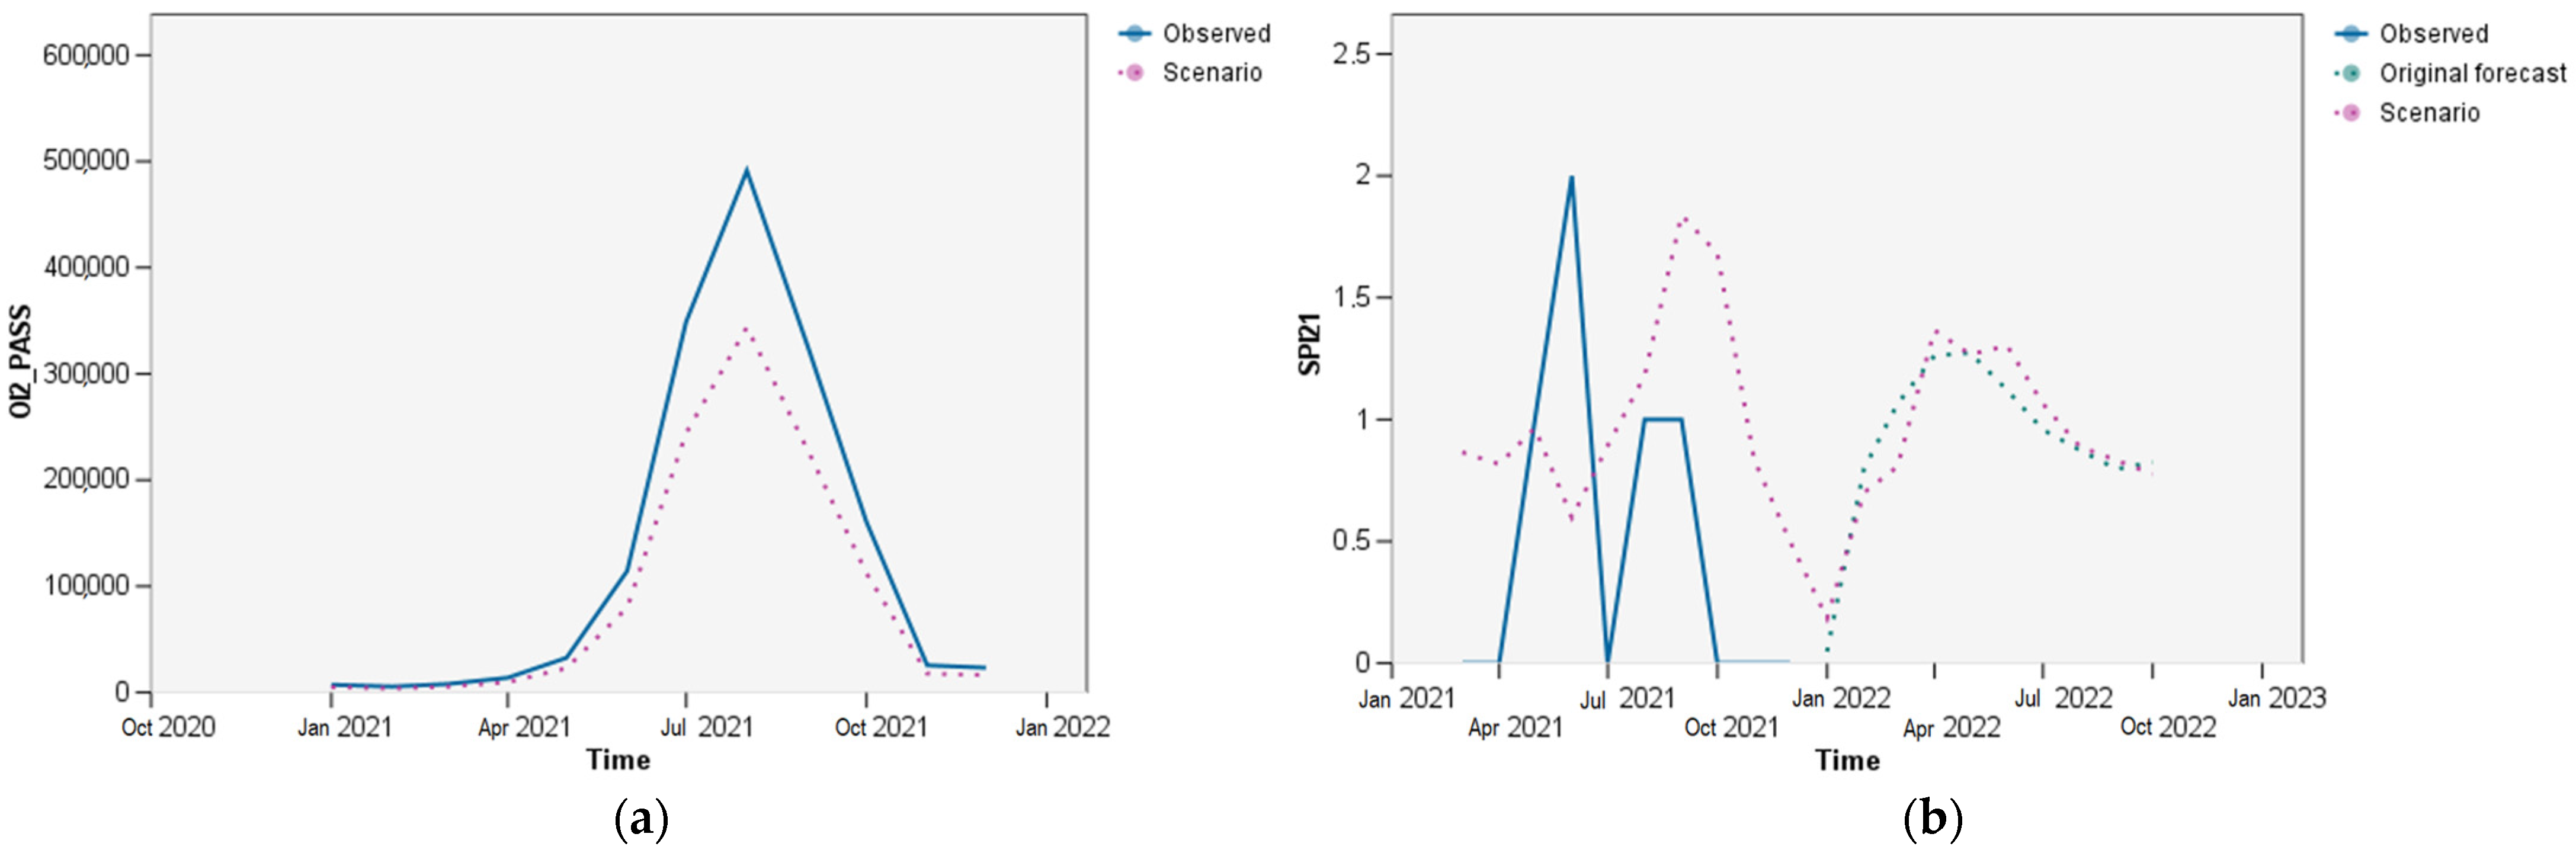
4.4.4. Scenario 4—Impact on Safety Performance Indicators Due to Decrease of Number of Passengers
The fourth scenario shows a decrease of the organizational indicator OI2—Number of passengers and its impact on safety performance indicators. Figure 16 shows an example of such impact on SPI21—Number of occurrences related to ground traffic (GSE) and vehicle driving. It shows original values of OI2 and decreased values of OI2 by 30% (Figure 16a) and Figure 16b shows how a change in OI2 impacts the behavior of the safety performance indicator SPI21. Details on every safety performance indicator can be found in Appendix E.
The fourth scenario shows an example of decreasing organizational indicator OI2—Number of passengers and its impact on safety performance indicator SPI21—Number of occurrences related to ground traffic (GSE) and vehicle driving (Figure 16). Figure 16a shows original values of OI2 and decreased values of OI2 by 30% and Figure 16b shows how a change in OI2 impacts the behavior of the safety performance indicator SPI21. Details of how decrease in OI2 impacts the behavior of every safety performance indicator can be found in Attachment E.
4.5. Summary of Results Based on Predictive Analysis of Airport Safety Performance
Figure 17 shows graphically all adverse events occurring over the observed time period from January 2014 to December 2021 and predicted time period from January 2022 to December 2023, at Split Airport, obtained by using the predictive safety management methodology in aviation. The Figure shows all events (past and future) and most probable causes of predicted events. Details can be found in Appendix F.
4.6. Proposal of Mitigation Measures Based on Predictive Analysis of Airport Safety Performance
Based on predictive analysis of airport safety performance conducted for Split Airport, and presented in this paper, a proposal for mitigation measures was generated, to improve the safety performance at Split Airport.
The layout of the proposed mitigation measures is based on a predictive analysis of airport safety performance, on the sample from Split Airport operations. The layout includes importance level, anticipated time of occurrence, tolerance interval of anticipated time of occurrence, detected SPI (area of occurrence), name of the detected SPI, area of concern, anticipated number of occurrences, proposed mitigation measures/actions (direct), causal factors (OIs and SPIs), area of causal impact and additional proposed mitigation measures/actions.
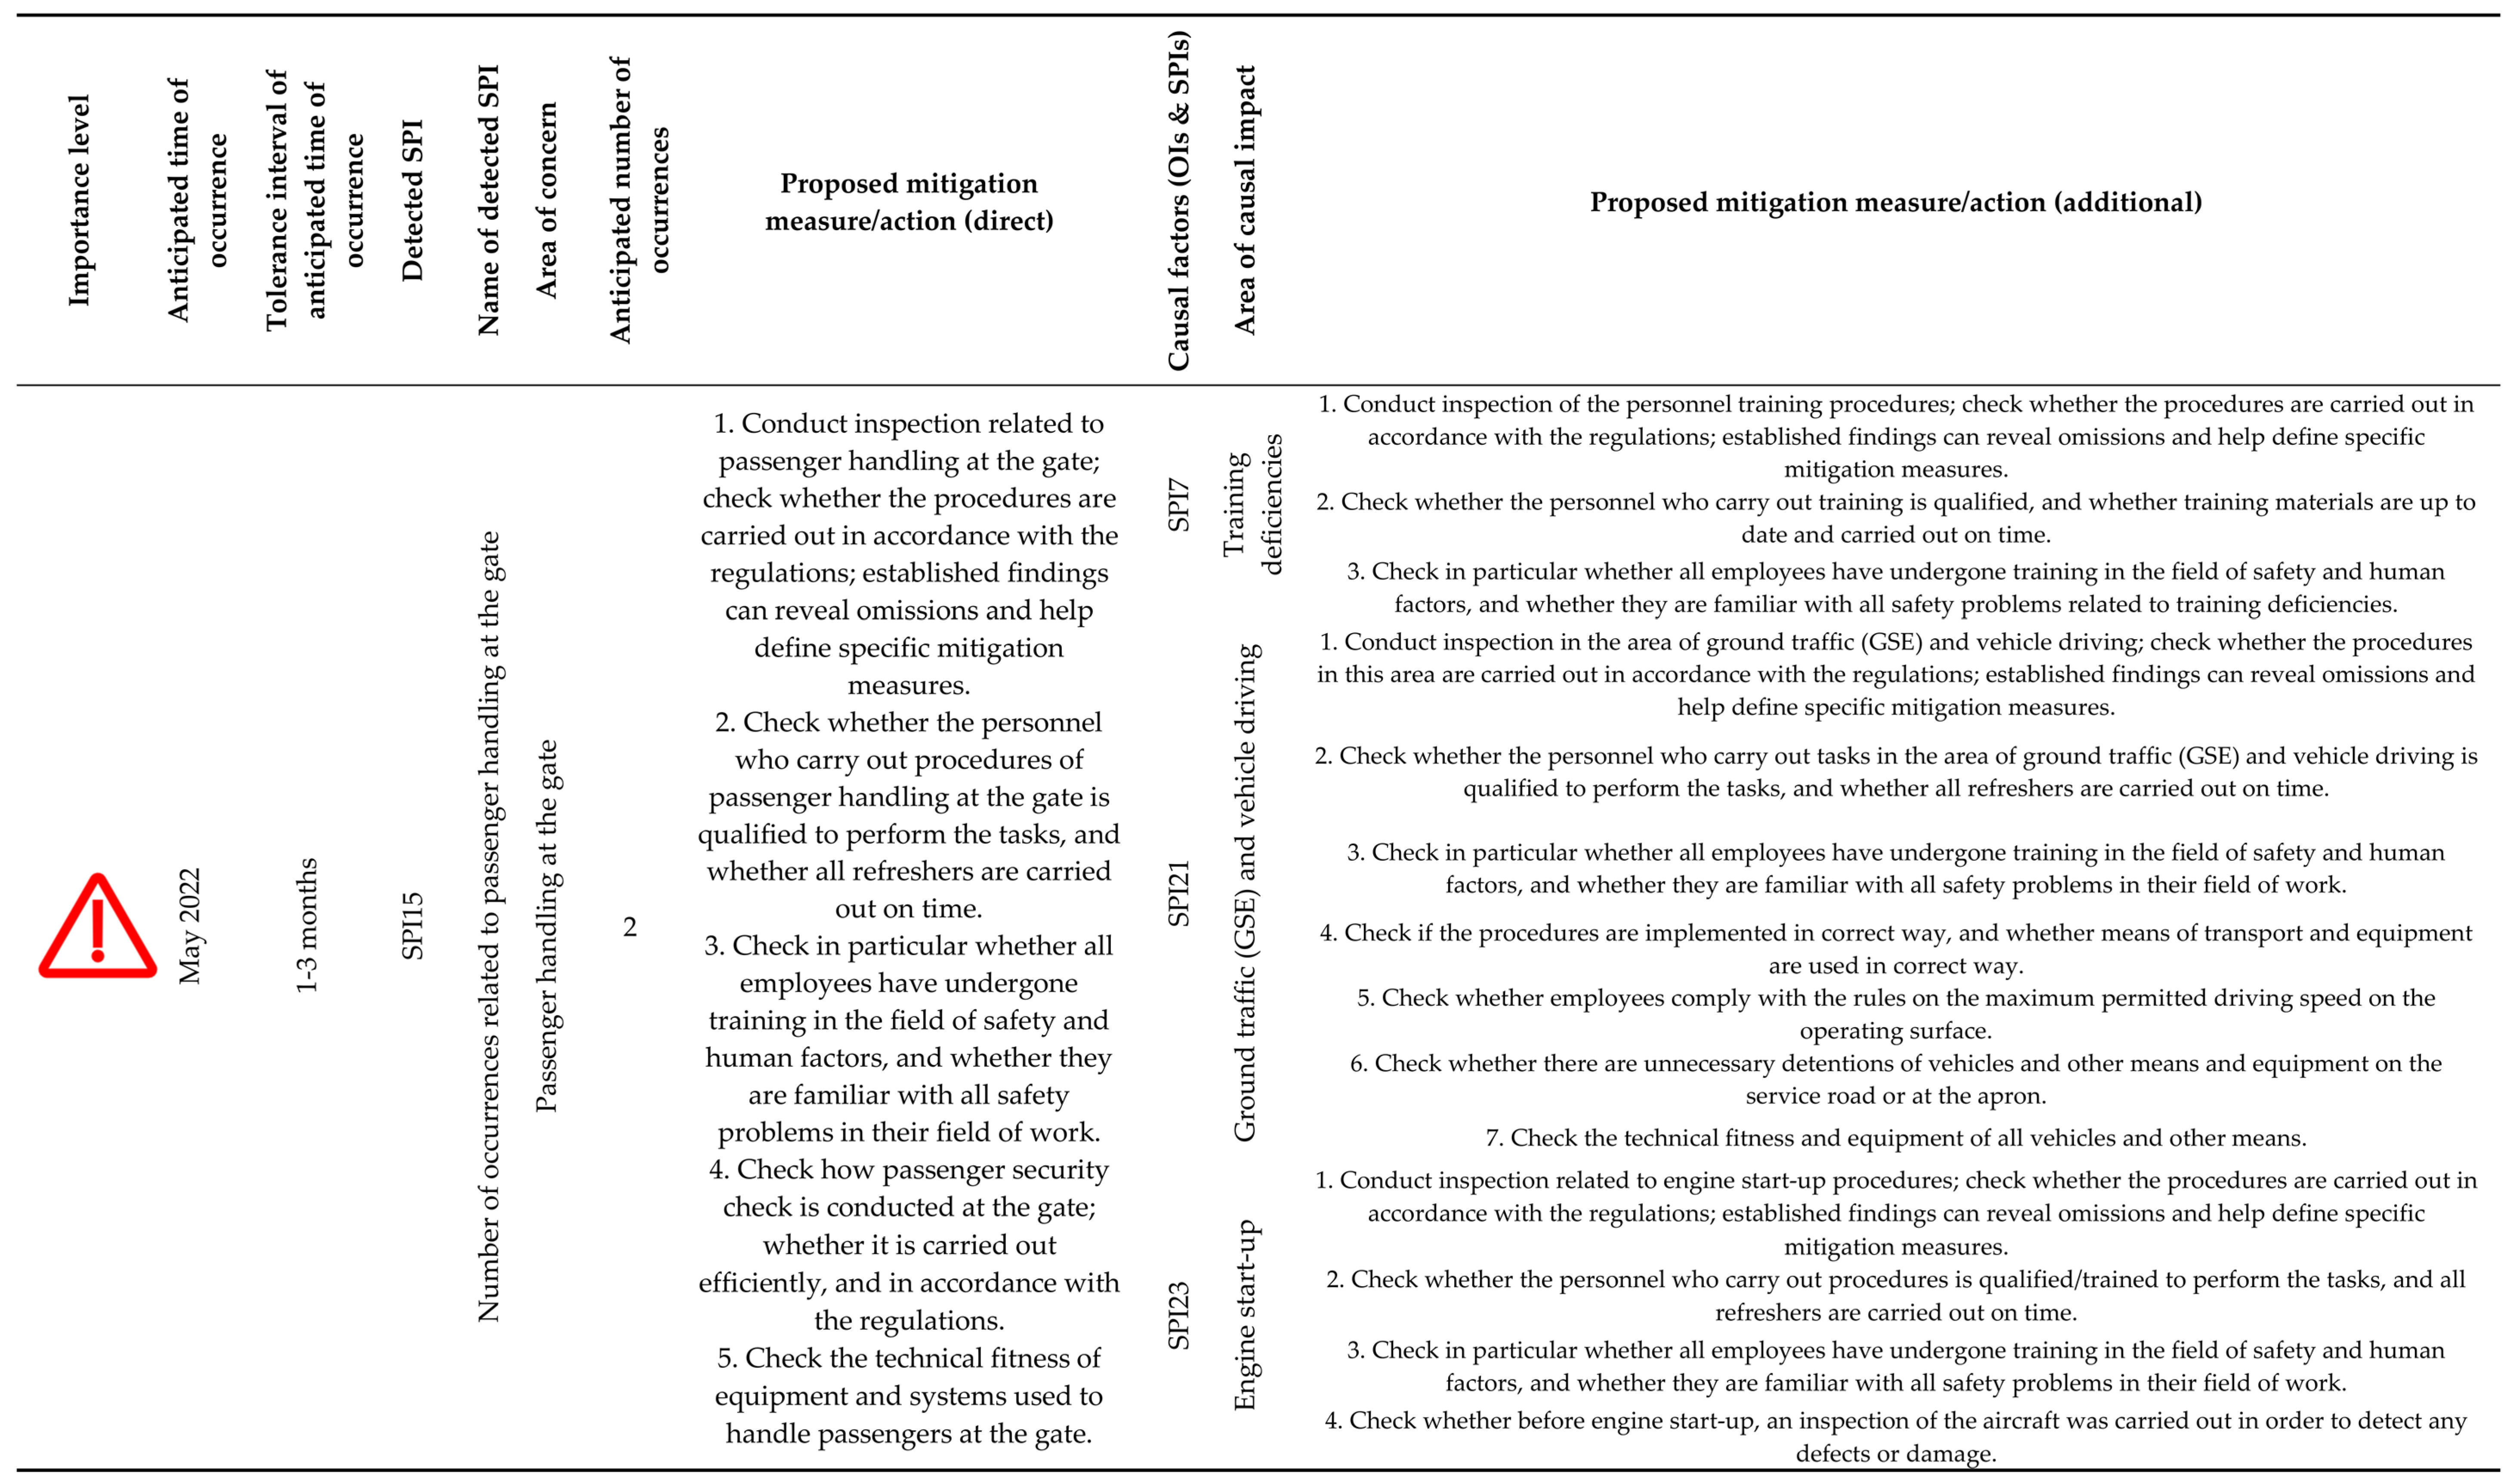
Figure 18 shows an example of the proposed mitigation measures for adverse occurrences predicted to happen in May 2022, in the area of passenger handling at the gate, obtained by using predictive analysis of airport safety performance, at Split Airport. The importance level for this predicted event was “red” because it was anticipated to happen very soon, from the perspective of when the time point predictive analysis took place. Direct proposed mitigation measures/actions included an conducting inspection related to passenger handling at the gate; checking whether the procedures were carried out in accordance with the regulations; checking whether the personnel who carry out procedures of passenger handling at the gate were qualified to perform the tasks, and whether all refreshers had been carried out on time; checking whether all employees have undergone training in the field of safety and human factors, and whether they were familiar with all safety problems in their field of work; checking how passenger security check was conducted at the gate; whether it was carried out efficiently, and in accordance with the regulations; checking the technical fitness of equipment and systems used to handle passengers at the gate, etc. Additional proposed mitigation measures/actions were generated in relation to secondary causal factors, i.e., in the area of training deficiencies (SPI7), ground traffic (GSE), vehicle driving (SPI21) and engine start-up (SPI23).
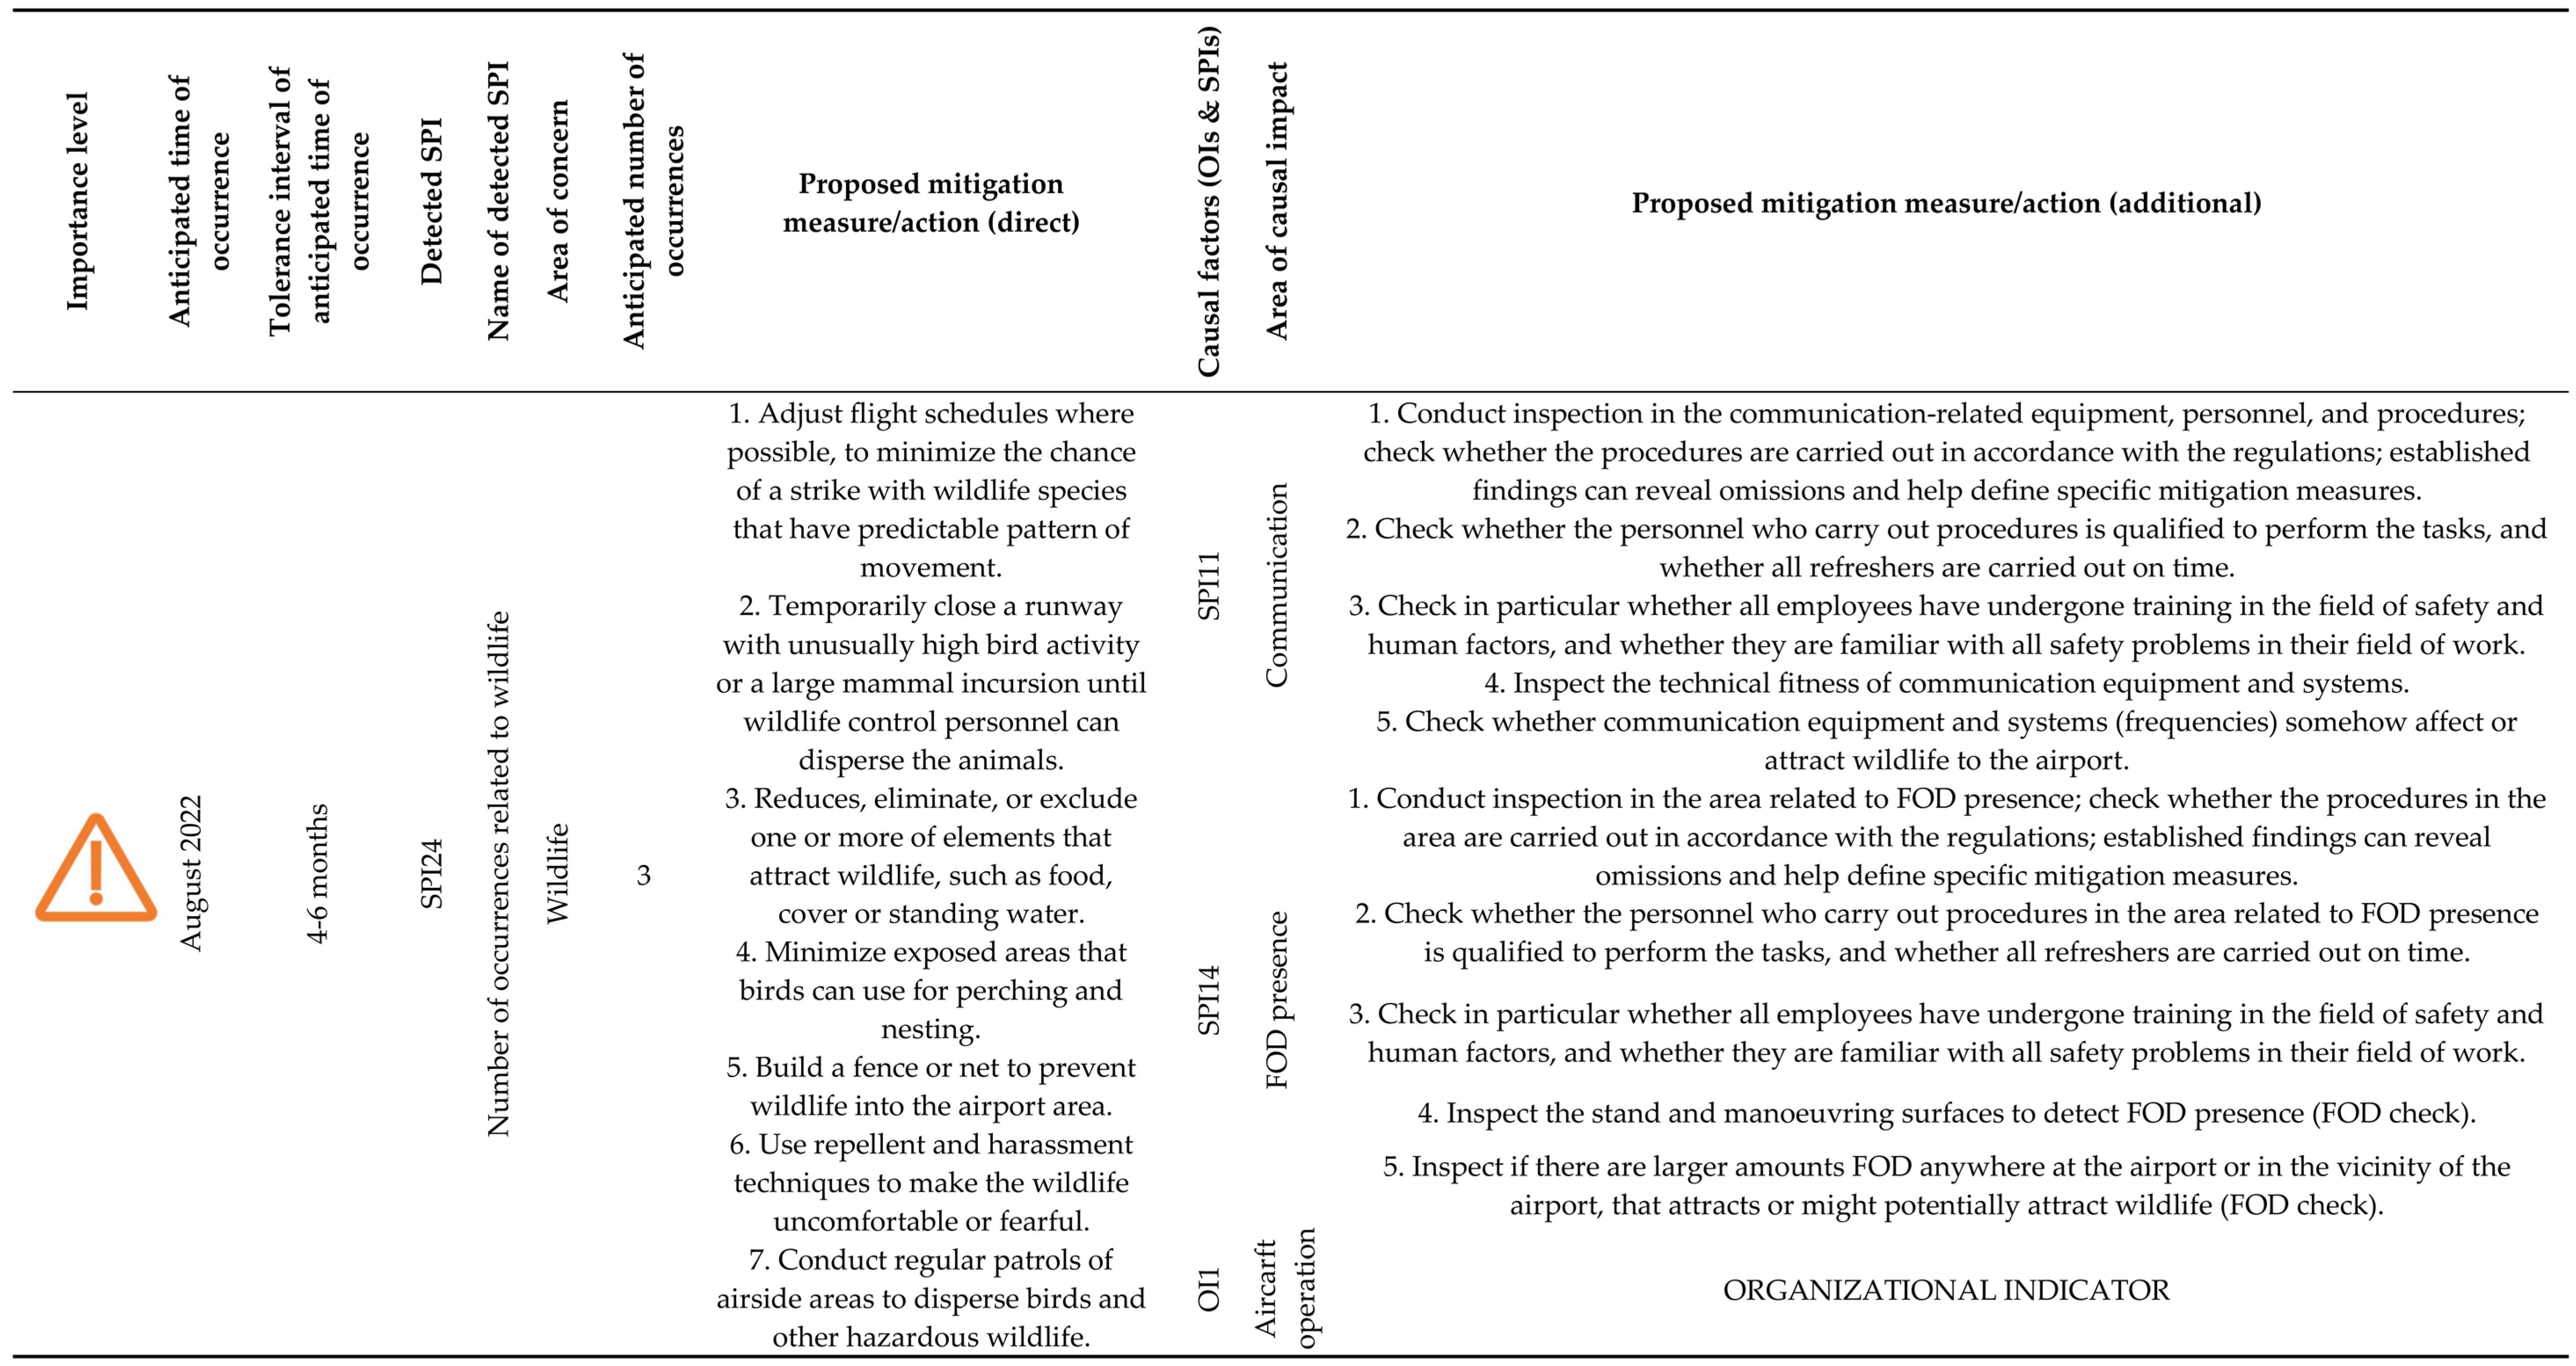
Figure 19 shows an example of proposed mitigation measures for adverse occurrences predicted to happen in August 2022, in the area of concern–wildlife–obtained by using predictive analysis of airport safety performance, at Split Airport. The importance level for this predicted event was “orange” because it was not anticipated to happen so soon, from the perspective of when the time point predictive analysis took place. Direct proposed mitigation measures/actions included adjusting flight schedules where possible, to minimize the chance of a strike with wildlife species that have a predictable pattern of movement; temporarily closing a runway with unusually high bird activity or a large mammal incursion until wildlife control personnel disperse the animals, reduce, eliminate, or exclude one or more elements that attract wildlife, such as food, cover or standing water; minimize exposed areas which birds can use for perching and nesting; build a fence or net (if there is none) to prevent wildlife encroaching into the airport area; using repellent and harassment techniques to make the wildlife uncomfortable or fearful; conducting regular patrols of airside areas to disperse birds and other hazardous wildlife, etc. Additional proposed mitigation measures/actions were generated in relation to secondary causal factors, i.e., in the area of communications (SPI11), and FOD presence (SPI14).
5. Discussion/Conclusions
This paper has presented how predictive safety management can be implemented and used, on the sample airport, i.e., Split Airport. A predictive analysis of the airport’s safety performance was conducted through the analysis of Split Airport safety database, causal modeling of Split Airport organizational and safety performance indicators, outlier root cause analysis of Split Airport safety performance indicators, predictive analysis of safety performance (forecasting of Split Airport organizational and safety performance indicators), and predictive analysis and causal modeling to generate scenario cases for future behavior of Split Airport safety performance indicators.
In the first step, the analysis showed which areas were most critical in the observed time period from January 2014 until December 2021, i.e., SPI15—Number of occurrences related to passenger handling at the gate (which even reached 16 occurrences per month in 2016), SPI21—Number of occurrences related to ground traffic (GSE) and vehicle driving (which reached eight occurrences per month in 2018), and SPI24—Number of occurrences related to wildlife (which reached 13 occurrences per month in 2019).
In the second step, a causal modeling of organizational and safety performance indicators was performed, using IBM SPSS Statistics 27 and a function called the Temporal Causal Model. With this model, causal relations were detected among each set of organizational and safety performance indicators at Split Airport. Causal relations of individual organizational indicators (OIs) and safety performance indicators (SPIs) at Split Airport, revealed which indicator influenced the others the most, i.e., SPI7—Number of training deficiencies, SPI13—Number of aircraft marshalling occurrences, SPI17—Number of occurrences related to personal protective equipment, SPI21—Number of occurrences related to ground traffic (GSE) and vehicle driving, and SPI23—Number of engine start-up incidents. Each of these SPIs impacted six or more other indicators. This suggests that certain mitigation measures should be implemented in these areas of airport operations, to generally prevent adverse effects. It can also be observed that all of these areas are related to the human factor element, hence measures such as additional training and more frequent inspections could be a good start in mitigating deficiencies in detected areas.
In the third step, outlier root cause analysis was performed, to analyze outliers more closely, which in fact represent extreme values of indicators, and which are, in fact, of most interest to any aviation operator because those extreme values (outliers) are exactly the ones that are of most concern to an operator and exactly the ones any operator wishes to mitigate. Applying root cause analysis of outliers can be very useful to determine which indicators caused these extreme values, and thereby mitigate or prevent them in the future. Outlier root cause analysis also revealed which indicators influence the others the most and helped to map out the path of each occurrence over the observed period of time, i.e., SPI7—Number of training deficiencies, SPI10—Number of occurrences related to maneuvering area maintenance, SPI13—Number of aircraft marshalling occurrences, SPI21—Number of occurrences related to ground traffic (GSE) and vehicle driving, and SPI23—Number of engine start-up incidents.
The next step was to perform forecasting (prediction) of each organizational and safety performance indicator, using the IBM SPSS Statistics 27 software. Forecasting of indicators was conducted using function Expert Modeler and Forecasting using the Temporal Causal Model. Three sets of forecasts were made, and the best fit was obtained by using exponential smoothing methods with a seasonal component. The significant events (ones that also showed they might cross safety performance target levels) were predicted to occur in July 2022 and July 2023, in the area SPI15—Number of occurrences related to passenger handling at the gate, and in September 2022 and September 2023, in the area SPI24—Number of occurrences related to wildlife. Other events were predicted to happen in areas SPI5—Number of personnel or passenger injuries, SPI14—Number of occurrences related to FOD presence, SPI20—Number of occurrences related to baggage loading/unloading, and SPI21—Number of occurrences related to ground traffic (GSE) and vehicle driving. All of these were anticipated to occur in summer months when the airport was the busiest, so more attention and additional mitigation measures should be implemented in those areas.
To mitigate or prevent anticipated occurrences, it was useful to use detected obtained causes that were known to have an impact on future events. Hence, per generated causal model, SPI5—Number of personnel or passenger injuries was impacted by SPI10—Number of occurrences related to maneuvering area maintenance, SPI15—Number of occurrences related to passenger handling at the gate and SPI21—Number of occurrences related to ground traffic (GSE) and vehicle driving. SPI14—Number of occurrences related to FOD presence was impacted by SPI3—Number of dangerous goods incidents, SPI11—Number of occurrences related to communication and SPI13—Number of aircraft marshalling occurrences. SPI15—Number of occurrences related to passenger handling at the gate was impacted by SPI7—Number of training deficiencies, SPI21—Number of occurrences related to ground traffic (GSE) and vehicle driving and SPI23—Number of engine start-up incidents. SPI20—Number of occurrences related to baggage loading/unloading was impacted by SPI7—Number of training deficiencies, SPI21—Number of occurrences related to ground traffic (GSE) and vehicle driving and OI2—Number of passengers. SPI21—Number of occurrences related to ground traffic (GSE) and vehicle driving was impacted by SPI1—Number of occurrences related to LIRF and loadsheet crosscheck, SPI10—Number of occurrences related to maneuvering area maintenance and OI1—Number of aircraft operations. SPI24—Number of occurrences related to wildlife was impacted by SPI11—Number of occurrences related to communication, SPI14—Number of occurrences related to FOD presence and OI1—Number of aircraft operations.
After conducting forecasting of each indicator at Split Airport, predictive analysis with causal impacts was performed, i.e., four scenario analyses were conducted to show how different values of organizational indicators (the lower of higher than original values), due to established causal relations, would impact future occurrences (SPIs) at Split Airport. Two organizational indicators were available for analysis, i.e., OI1—Number of aircraft operations and OI2—Number of passengers. Two scenarios were made for each organizational indicator (increase and decrease by 30%) to see how they would impact safety performance indicators. Since forecasts of OI1 and OI2 both anticipated an increase, scenarios showing how an increase in OI1 and OI2 impacted SPIs can be useful. Due to an increase in OI1—Number of aircraft operations, it can be observed that SPI1, SPI3, SPI4, SPI8, SPI9, SPI10, SPI11, SPI12, SPI13, SPI14, SPI17, SPI18, SPI23, SPI24 would decrease, SPI2, SPI5, SPI16, SPI19, SPI20, SPI21, SPI22, SPI25 would approximately remain the same, and only SPI7 and SPI15 would increase. Additional attention should be paid to these anticipated areas of increased occurrences. Due to an increase in OI2—Number of passengers, it can be observed that SPI1, SPI3, SPI4, SPI5, SPI9, SPI10, SPI11, SPI12, SPI14, SPI15, SPI17, SPI18, SPI19, SPI21, SPI23, SPI24 increased, SPI2, SPI8, SPI13, SPI16, SPI20, SPI22, SPI25 remained approximately the same, and only SPI7 decreased. Additional attention should be paid to these anticipated areas of increased occurrences. These two organizational indicators have opposite effects on safety performance indicators, hence in summary, attention should be paid to SPI5—Number of personnel or passenger injuries, SPI8—Number of apron maintenance incidents, and SPI15—Number of occurrences related to passenger handling at the gate. As a recommendation, conducting an analysis of additional organizational indicators could show what happens with safety performance indicators. This paper has shown how improved safety management, i.e., predictive safety management with use of predictive (forecasting) and causal modeling methods can identify potential and possible hazards in the future, as well as their causal factors, which can help define timely and efficient mitigation measures to prevent or restrain emerging hazards turning into adverse events. Based on detected future hazards, and their causal factors, the appropriate mitigation measures were generated for the purpose of improving and maintaining an acceptable level of safety at the airport.
Predictive analysis of airport safety performance was conducted on Split Airport, with a limited number of organizational and safety performance indicators, due to time and resource limitations, with the intention of verifying the quality and relevance of results that could be obtained with the implementation of proposed predictive safety management methodology. In future research, the focus will be to define improved cause-sequenced breakdown of hazard/occurrence categories (SPIs) in order to obtain specific safety performance indicators related to each specific organizational area of activity. These categories could help define an extensive set of organizational and safety performance indicators that can be monitored, analyzed and predicted to mitigate or prevent future emerging hazards in the organization. Improving safety data input process, in general, could make the predictive safety management methodology even more efficient and useful. Future research will be focused on implementing predictive and causal modelling methods in a total management system, at the organizational level as well. The intention is to capillary integrate safety management system within a total management system of the organization. This could allow an organization to consider a large set of interactions (causal relationships) throughout the whole organizational system, that impacts directly or indirectly the organization’s safety performance.
Author Contributions
Conceptualization, D.B.; methodology, D.B.; software, D.B. and S.S.; validation, D.B. and S.S.; formal analysis, D.B. and S.S.; investigation, D.B. and S.S.; data curation, D.B. and S.S.; writing—original draft preparation, D.B.; writing—review and editing, D.B. and S.S.; visualization, D.B.; supervision, S.S. All authors have read and agreed to the published version of the manuscript.
Funding
This research received no external funding.
Institutional Review Board Statement
Not applicable.
Informed Consent Statement
Not applicable.
Data Availability Statement
Data supporting reported results can be found in this paper, in the Attachments.
Acknowledgments
Special thanks goes to Split Airport Safety Department who provided safety data to conduct predictive analysis of airport safety performance.
Conflicts of Interest
The authors declare no conflict of interest.
Appendix A
Table A1 shows a dataset of monthly organizational indicators (OIs) and safety performance indicators (SPIs) of Split Airport, in the period from January 2014 to December 2021 [53]. There are 27 indicators in total: OI1—Number of aircraft operations, OI2—Number of passengers, SPI1—Number of occurrences related to LIRF and loadsheet crosscheck, SPI2—Number of occurrences related to wrong figures for loadsheet, SPI3—Number of dangerous goods incidents, SPI4—Number of aircraft damage occurrences, SPI5—Number of personnel or passenger injuries, SPI6—Number of runway incursions/excursions, SPI7—Number of training deficiencies, SPI8—Number of apron maintenance incidents, SPI9—Number of vehicle maintenance incidents, SPI10—Number of occurrences related to maneuvering area maintenance, SPI11—Number of occurrences related to communication, SPI12—Number of incidents related to taxiing to/from apron, SPI13—Number of aircraft marshalling occurrences, SPI14—Number of occurrences related to FOD presence, SPI15—Number of occurrences related to passenger handling at the gate, SPI16—Number of occurrences related to passenger handling—disembarking/embarking, SPI17—Number of occurrences related to personal protective equipment, SPI18—Number of aircraft chocking incidents, SPI19—Number of aircraft conning incidents, SPI20—Number of occurrences related to baggage loading/unloading, SPI21—Number of occurrences related to ground traffic (GSE) and vehicle driving, SPI22—Number of anti-collision occurrences, SPI23—Number of engine start-up incidents, SPI24—Number of occurrences related to wildlife, and SPI25—Number of occurrences related to fuel handling.

Table A1.
Dataset of organizational indicators (OIs) and safety performance indicators (SPIs) at Split Airport, in the observed time period. Adapted with permission from Ref. [53]. 2022, Split Airport.
Table A1.
Dataset of organizational indicators (OIs) and safety performance indicators (SPIs) at Split Airport, in the observed time period. Adapted with permission from Ref. [53]. 2022, Split Airport.
| Month | OI1 | OI2 | SPI1 | SPI2 | SPI3 | SPI4 | SPI5 | SPI6 | SPI7 | SPI8 | SPI9 | SPI10 | SPI11 | SPI12 | SPI13 | SPI14 | SPI15 | SPI16 | SPI17 | SPI18 | SPI19 | SPI20 | SPI21 | SPI22 | SPI23 | SPI24 | SPI25 |
|---|---|---|---|---|---|---|---|---|---|---|---|---|---|---|---|---|---|---|---|---|---|---|---|---|---|---|---|
| January 2014 | 438 | 24,900 | 0 | 0 | 0 | 0 | 0 | 0 | 0 | 0 | 0 | 0 | 0 | 0 | 0 | 0 | 0 | 0 | 0 | 0 | 0 | 0 | 1 | 0 | 0 | 0 | 0 |
| February 2014 | 392 | 20,825 | 0 | 0 | 0 | 0 | 0 | 0 | 0 | 0 | 0 | 0 | 0 | 0 | 0 | 0 | 0 | 0 | 1 | 0 | 0 | 1 | 0 | 0 | 0 | 0 | 0 |
| March 2014 | 514 | 26,410 | 0 | 0 | 0 | 0 | 0 | 0 | 0 | 0 | 0 | 0 | 0 | 0 | 0 | 1 | 0 | 0 | 0 | 0 | 0 | 1 | 1 | 0 | 0 | 1 | 0 |
| April 2014 | 1032 | 77,575 | 0 | 0 | 0 | 0 | 0 | 0 | 0 | 2 | 0 | 4 | 1 | 0 | 0 | 0 | 0 | 0 | 0 | 0 | 0 | 0 | 1 | 0 | 0 | 0 | 0 |
| May 2014 | 1942 | 157,070 | 0 | 0 | 0 | 0 | 0 | 0 | 0 | 1 | 0 | 0 | 0 | 0 | 0 | 0 | 0 | 1 | 0 | 0 | 0 | 0 | 1 | 0 | 0 | 1 | 0 |
| June 2014 | 2554 | 234,139 | 0 | 0 | 0 | 0 | 2 | 0 | 0 | 1 | 0 | 0 | 0 | 0 | 1 | 1 | 1 | 0 | 1 | 0 | 0 | 1 | 6 | 0 | 0 | 0 | 0 |
| July 2014 | 3872 | 386,039 | 0 | 0 | 1 | 0 | 1 | 0 | 0 | 0 | 0 | 0 | 0 | 0 | 1 | 0 | 5 | 0 | 0 | 0 | 0 | 0 | 1 | 0 | 0 | 10 | 0 |
| August 2014 | 3954 | 389,032 | 0 | 0 | 0 | 0 | 0 | 0 | 0 | 0 | 1 | 1 | 0 | 0 | 0 | 0 | 0 | 1 | 0 | 0 | 0 | 0 | 3 | 0 | 1 | 1 | 0 |
| September 2014 | 2592 | 240,991 | 0 | 0 | 0 | 1 | 0 | 0 | 0 | 1 | 1 | 0 | 0 | 0 | 0 | 1 | 2 | 0 | 0 | 0 | 0 | 1 | 0 | 0 | 1 | 2 | 0 |
| October 2014 | 1470 | 114,161 | 0 | 0 | 0 | 0 | 0 | 0 | 0 | 1 | 0 | 0 | 0 | 0 | 0 | 0 | 0 | 0 | 0 | 0 | 0 | 0 | 1 | 0 | 0 | 2 | 0 |
| November 2014 | 504 | 27,359 | 0 | 0 | 0 | 0 | 0 | 0 | 0 | 0 | 0 | 0 | 0 | 0 | 0 | 0 | 0 | 0 | 0 | 0 | 0 | 0 | 0 | 0 | 0 | 0 | 0 |
| December 2014 | 528 | 30,811 | 0 | 0 | 0 | 0 | 0 | 0 | 0 | 0 | 0 | 0 | 0 | 0 | 0 | 0 | 0 | 0 | 0 | 0 | 0 | 0 | 0 | 0 | 0 | 0 | 0 |
| January 2015 | 504 | 23,513 | 0 | 0 | 0 | 0 | 0 | 0 | 0 | 0 | 0 | 1 | 0 | 0 | 0 | 0 | 0 | 0 | 0 | 0 | 0 | 0 | 0 | 0 | 0 | 0 | 0 |
| February 2015 | 454 | 22,234 | 0 | 0 | 0 | 0 | 0 | 0 | 0 | 0 | 0 | 0 | 0 | 0 | 0 | 0 | 0 | 0 | 0 | 0 | 0 | 0 | 2 | 0 | 0 | 0 | 0 |
| March 2015 | 576 | 31,941 | 0 | 0 | 0 | 0 | 0 | 0 | 0 | 0 | 0 | 0 | 0 | 0 | 0 | 1 | 0 | 0 | 0 | 0 | 0 | 0 | 0 | 0 | 0 | 0 | 0 |
| April 2015 | 1132 | 73,149 | 0 | 0 | 0 | 0 | 0 | 0 | 0 | 0 | 0 | 0 | 0 | 0 | 1 | 0 | 2 | 0 | 0 | 0 | 0 | 0 | 1 | 0 | 0 | 2 | 0 |
| May 2015 | 2232 | 179,794 | 0 | 0 | 1 | 0 | 0 | 0 | 0 | 0 | 1 | 0 | 0 | 0 | 0 | 0 | 1 | 0 | 0 | 0 | 0 | 0 | 1 | 0 | 1 | 0 | 0 |
| June 2015 | 2942 | 267,755 | 0 | 0 | 0 | 0 | 0 | 0 | 0 | 1 | 0 | 0 | 0 | 0 | 0 | 0 | 1 | 1 | 0 | 0 | 0 | 2 | 1 | 0 | 1 | 1 | 0 |
| July 2015 | 4374 | 431,014 | 1 | 0 | 1 | 1 | 1 | 0 | 0 | 0 | 0 | 0 | 0 | 0 | 0 | 1 | 10 | 0 | 0 | 0 | 0 | 1 | 3 | 0 | 0 | 4 | 1 |
| August 2015 | 4162 | 427,830 | 0 | 0 | 0 | 0 | 1 | 0 | 0 | 0 | 0 | 0 | 0 | 0 | 0 | 0 | 10 | 0 | 1 | 0 | 0 | 0 | 2 | 0 | 0 | 3 | 0 |
| September 2015 | 2826 | 285,446 | 0 | 0 | 0 | 0 | 1 | 0 | 0 | 1 | 0 | 0 | 0 | 0 | 0 | 0 | 6 | 0 | 0 | 0 | 0 | 0 | 1 | 0 | 0 | 0 | 0 |
| October 2015 | 1582 | 133,129 | 0 | 0 | 0 | 0 | 0 | 0 | 0 | 1 | 0 | 0 | 0 | 0 | 0 | 0 | 2 | 0 | 0 | 0 | 0 | 0 | 1 | 0 | 0 | 0 | 0 |
| November 2015 | 640 | 27,938 | 0 | 0 | 0 | 0 | 0 | 0 | 0 | 0 | 1 | 0 | 0 | 0 | 0 | 0 | 0 | 0 | 0 | 0 | 0 | 0 | 0 | 0 | 0 | 0 | 0 |
| December 2015 | 564 | 27,137 | 0 | 0 | 0 | 0 | 0 | 0 | 0 | 1 | 0 | 0 | 0 | 0 | 0 | 1 | 0 | 0 | 0 | 0 | 0 | 0 | 0 | 0 | 0 | 0 | 0 |
| January 2016 | 492 | 25,028 | 0 | 0 | 0 | 0 | 0 | 0 | 0 | 0 | 0 | 0 | 0 | 0 | 0 | 0 | 0 | 0 | 0 | 0 | 0 | 0 | 1 | 0 | 0 | 0 | 0 |
| February 2016 | 494 | 22,782 | 0 | 0 | 0 | 0 | 0 | 0 | 0 | 0 | 1 | 0 | 0 | 0 | 0 | 0 | 0 | 0 | 0 | 0 | 0 | 0 | 3 | 0 | 0 | 1 | 0 |
| March 2016 | 624 | 33,477 | 1 | 0 | 0 | 0 | 1 | 0 | 1 | 0 | 0 | 0 | 0 | 0 | 0 | 0 | 1 | 0 | 0 | 0 | 0 | 0 | 0 | 0 | 0 | 0 | 0 |
| April 2016 | 1142 | 73,764 | 0 | 0 | 0 | 0 | 0 | 0 | 0 | 0 | 0 | 0 | 0 | 0 | 0 | 0 | 1 | 0 | 0 | 0 | 0 | 0 | 1 | 0 | 0 | 0 | 0 |
| May 2016 | 2390 | 201,906 | 0 | 0 | 1 | 0 | 2 | 0 | 1 | 0 | 0 | 0 | 0 | 0 | 0 | 0 | 6 | 0 | 1 | 0 | 0 | 1 | 2 | 0 | 0 | 2 | 0 |
| June 2016 | 3148 | 319,135 | 0 | 0 | 1 | 0 | 0 | 0 | 0 | 0 | 0 | 0 | 0 | 0 | 0 | 0 | 14 | 0 | 0 | 0 | 0 | 2 | 3 | 0 | 0 | 1 | 1 |
| July 2016 | 4824 | 540,778 | 0 | 0 | 0 | 0 | 1 | 0 | 0 | 0 | 1 | 0 | 0 | 0 | 0 | 0 | 16 | 0 | 0 | 0 | 0 | 0 | 3 | 0 | 0 | 0 | 0 |
| August 2016 | 4518 | 483,215 | 0 | 0 | 0 | 1 | 1 | 0 | 0 | 1 | 0 | 0 | 0 | 0 | 0 | 0 | 15 | 1 | 0 | 0 | 0 | 1 | 3 | 0 | 0 | 0 | 1 |
| September 2016 | 3280 | 337,967 | 0 | 0 | 0 | 0 | 1 | 0 | 0 | 1 | 0 | 0 | 1 | 0 | 1 | 0 | 5 | 0 | 0 | 0 | 0 | 3 | 5 | 1 | 0 | 2 | 2 |
| October 2016 | 1876 | 165,299 | 0 | 0 | 0 | 0 | 0 | 0 | 0 | 0 | 0 | 0 | 0 | 0 | 0 | 0 | 2 | 0 | 0 | 0 | 0 | 2 | 1 | 0 | 0 | 1 | 0 |
| November 2016 | 582 | 30,676 | 0 | 0 | 0 | 0 | 0 | 0 | 0 | 0 | 0 | 0 | 0 | 0 | 0 | 0 | 0 | 0 | 0 | 0 | 0 | 0 | 1 | 0 | 0 | 0 | 0 |
| December 2016 | 570 | 28,779 | 0 | 0 | 0 | 0 | 0 | 0 | 0 | 0 | 0 | 0 | 0 | 0 | 0 | 0 | 2 | 0 | 0 | 0 | 0 | 0 | 0 | 0 | 0 | 0 | 0 |
| January 2017 | 586 | 28,994 | 0 | 0 | 0 | 1 | 0 | 0 | 0 | 0 | 0 | 1 | 0 | 0 | 0 | 0 | 0 | 1 | 0 | 0 | 0 | 0 | 0 | 0 | 0 | 0 | 0 |
| February 2017 | 496 | 22,646 | 0 | 0 | 0 | 0 | 0 | 0 | 0 | 0 | 0 | 0 | 0 | 0 | 0 | 0 | 0 | 0 | 0 | 1 | 0 | 0 | 0 | 0 | 0 | 1 | 1 |
| March 2017 | 640 | 31,878 | 1 | 0 | 0 | 0 | 0 | 0 | 0 | 0 | 0 | 0 | 0 | 0 | 0 | 0 | 0 | 0 | 0 | 0 | 0 | 0 | 0 | 0 | 0 | 1 | 1 |
| April 2017 | 1378 | 120,980 | 0 | 0 | 0 | 0 | 0 | 0 | 0 | 0 | 0 | 0 | 0 | 0 | 0 | 0 | 1 | 0 | 0 | 0 | 0 | 0 | 0 | 0 | 0 | 1 | 0 |
| May 2017 | 2644 | 254,265 | 0 | 0 | 0 | 0 | 1 | 0 | 0 | 0 | 1 | 0 | 0 | 0 | 0 | 0 | 3 | 0 | 0 | 0 | 0 | 0 | 1 | 0 | 0 | 3 | 0 |
| June 2017 | 3594 | 401,347 | 0 | 0 | 0 | 0 | 0 | 0 | 0 | 0 | 0 | 0 | 0 | 0 | 0 | 0 | 6 | 0 | 0 | 0 | 0 | 0 | 5 | 1 | 0 | 0 | 1 |
| July 2017 | 5216 | 653,743 | 0 | 0 | 0 | 0 | 3 | 0 | 0 | 0 | 0 | 0 | 0 | 0 | 0 | 0 | 7 | 0 | 0 | 0 | 0 | 0 | 0 | 0 | 0 | 2 | 0 |
| August 2017 | 5078 | 590,830 | 0 | 0 | 0 | 0 | 0 | 0 | 0 | 1 | 0 | 0 | 0 | 0 | 0 | 0 | 0 | 0 | 0 | 0 | 0 | 0 | 4 | 0 | 0 | 3 | 0 |
| September 2017 | 378 | 418,836 | 0 | 0 | 0 | 0 | 0 | 0 | 0 | 0 | 0 | 0 | 0 | 0 | 0 | 0 | 1 | 0 | 0 | 0 | 0 | 0 | 0 | 0 | 0 | 4 | 1 |
| October 2017 | 2116 | 195,837 | 0 | 0 | 0 | 0 | 0 | 0 | 0 | 0 | 0 | 0 | 0 | 0 | 0 | 0 | 1 | 0 | 0 | 1 | 1 | 0 | 0 | 0 | 0 | 1 | 1 |
| November 2017 | 654 | 37,343 | 0 | 0 | 0 | 0 | 0 | 0 | 0 | 0 | 0 | 1 | 0 | 0 | 1 | 0 | 0 | 0 | 0 | 0 | 0 | 0 | 0 | 0 | 0 | 0 | 0 |
| December 2017 | 554 | 34,626 | 0 | 0 | 0 | 0 | 0 | 0 | 0 | 0 | 0 | 0 | 0 | 0 | 0 | 0 | 0 | 0 | 0 | 0 | 0 | 0 | 0 | 0 | 0 | 0 | 0 |
| January 2018 | 590 | 32,006 | 0 | 0 | 0 | 0 | 0 | 0 | 0 | 0 | 0 | 1 | 0 | 0 | 0 | 0 | 0 | 0 | 0 | 0 | 0 | 0 | 1 | 0 | 0 | 0 | 0 |
| February 2018 | 520 | 29,109 | 0 | 0 | 0 | 0 | 0 | 0 | 0 | 0 | 0 | 1 | 0 | 0 | 0 | 1 | 0 | 0 | 0 | 2 | 0 | 0 | 0 | 0 | 0 | 1 | 0 |
| March 2018 | 748 | 51,331 | 0 | 0 | 0 | 0 | 0 | 0 | 0 | 0 | 0 | 1 | 0 | 1 | 0 | 0 | 0 | 0 | 0 | 0 | 0 | 0 | 2 | 0 | 0 | 0 | 0 |
| April 2018 | 1486 | 121,372 | 0 | 0 | 0 | 0 | 0 | 0 | 0 | 0 | 0 | 0 | 0 | 0 | 0 | 0 | 1 | 0 | 0 | 0 | 0 | 1 | 1 | 0 | 0 | 2 | 0 |
| May 2018 | 2878 | 301,377 | 0 | 0 | 0 | 0 | 0 | 0 | 0 | 0 | 0 | 0 | 0 | 0 | 0 | 0 | 5 | 0 | 0 | 0 | 0 | 0 | 1 | 0 | 0 | 0 | 0 |
| June 2018 | 4052 | 471,962 | 0 | 0 | 0 | 0 | 0 | 0 | 0 | 0 | 0 | 0 | 0 | 0 | 0 | 0 | 2 | 0 | 0 | 0 | 0 | 0 | 0 | 0 | 0 | 0 | 1 |
| July 2018 | 5504 | 691,810 | 0 | 0 | 0 | 0 | 1 | 0 | 0 | 0 | 0 | 0 | 0 | 0 | 0 | 0 | 6 | 0 | 0 | 0 | 0 | 2 | 8 | 0 | 0 | 1 | 0 |
| August 2018 | 5136 | 625,209 | 0 | 0 | 0 | 0 | 0 | 0 | 0 | 0 | 0 | 1 | 0 | 0 | 1 | 0 | 5 | 1 | 0 | 0 | 0 | 3 | 0 | 0 | 0 | 3 | 0 |
| September 2018 | 3842 | 452,964 | 0 | 0 | 0 | 0 | 0 | 0 | 0 | 0 | 0 | 0 | 0 | 0 | 0 | 0 | 4 | 0 | 1 | 0 | 0 | 0 | 3 | 0 | 0 | 4 | 0 |
| October 2018 | 2272 | 223,092 | 0 | 0 | 0 | 0 | 2 | 0 | 0 | 0 | 1 | 0 | 0 | 0 | 0 | 0 | 5 | 0 | 0 | 0 | 0 | 1 | 1 | 1 | 0 | 0 | 0 |
| November 2018 | 750 | 52,942 | 0 | 0 | 0 | 0 | 0 | 0 | 0 | 0 | 0 | 0 | 0 | 0 | 0 | 0 | 2 | 0 | 0 | 0 | 0 | 1 | 0 | 0 | 0 | 0 | 0 |
| December 2018 | 646 | 42,434 | 0 | 0 | 0 | 0 | 0 | 0 | 0 | 0 | 0 | 0 | 0 | 0 | 0 | 0 | 0 | 0 | 0 | 0 | 0 | 0 | 0 | 0 | 0 | 0 | 0 |
| January 2019 | 664 | 34,694 | 0 | 0 | 0 | 0 | 0 | 0 | 0 | 0 | 0 | 0 | 0 | 0 | 0 | 0 | 0 | 0 | 0 | 0 | 0 | 0 | 0 | 0 | 0 | 0 | 0 |
| February 2019 | 634 | 33,087 | 0 | 0 | 0 | 0 | 0 | 0 | 0 | 0 | 0 | 0 | 0 | 0 | 0 | 0 | 0 | 0 | 0 | 0 | 0 | 0 | 3 | 0 | 0 | 0 | 0 |
| March 2019 | 800 | 48,095 | 0 | 0 | 0 | 0 | 0 | 0 | 0 | 1 | 0 | 0 | 0 | 0 | 1 | 0 | 0 | 0 | 0 | 0 | 0 | 0 | 0 | 0 | 0 | 0 | 0 |
| April 2019 | 1698 | 153,474 | 0 | 0 | 0 | 0 | 0 | 0 | 0 | 0 | 0 | 0 | 0 | 1 | 0 | 4 | 0 | 0 | 0 | 0 | 0 | 0 | 1 | 0 | 0 | 1 | 0 |
| May 2019 | 2992 | 308,447 | 0 | 0 | 0 | 0 | 1 | 0 | 0 | 0 | 0 | 0 | 0 | 0 | 0 | 1 | 0 | 0 | 0 | 0 | 0 | 0 | 1 | 0 | 0 | 2 | 0 |
| June 2019 | 4318 | 510,438 | 0 | 0 | 0 | 0 | 0 | 0 | 0 | 0 | 0 | 0 | 0 | 0 | 0 | 5 | 0 | 0 | 0 | 0 | 0 | 1 | 1 | 0 | 0 | 2 | 0 |
| July 2019 | 5576 | 719,796 | 2 | 0 | 1 | 0 | 1 | 0 | 0 | 0 | 0 | 0 | 0 | 0 | 0 | 1 | 0 | 0 | 0 | 0 | 0 | 0 | 2 | 0 | 0 | 13 | 0 |
| August 2019 | 5320 | 669,403 | 0 | 0 | 0 | 0 | 0 | 0 | 0 | 1 | 0 | 1 | 0 | 0 | 0 | 2 | 2 | 0 | 0 | 0 | 0 | 1 | 2 | 0 | 0 | 5 | 0 |
| September 2019 | 3848 | 467,544 | 0 | 0 | 0 | 0 | 0 | 0 | 0 | 0 | 0 | 0 | 0 | 0 | 0 | 0 | 0 | 0 | 0 | 0 | 0 | 1 | 0 | 0 | 0 | 0 | 0 |
| October 2019 | 2372 | 244,259 | 0 | 0 | 3 | 0 | 0 | 0 | 0 | 0 | 0 | 2 | 0 | 0 | 0 | 1 | 0 | 0 | 0 | 0 | 0 | 0 | 4 | 0 | 0 | 0 | 0 |
| November 2019 | 634 | 42,859 | 0 | 0 | 1 | 0 | 0 | 0 | 0 | 0 | 0 | 0 | 0 | 0 | 0 | 2 | 0 | 0 | 0 | 0 | 0 | 0 | 0 | 0 | 0 | 1 | 0 |
| December 2019 | 574 | 38,949 | 0 | 0 | 0 | 0 | 0 | 0 | 0 | 0 | 0 | 0 | 0 | 0 | 0 | 2 | 0 | 0 | 0 | 0 | 0 | 0 | 1 | 0 | 0 | 0 | 0 |
| January 2020 | 567 | 35,282 | 0 | 0 | 0 | 0 | 0 | 0 | 0 | 0 | 0 | 0 | 0 | 0 | 0 | 0 | 0 | 0 | 0 | 0 | 0 | 0 | 1 | 0 | 0 | 0 | 0 |
| February 2020 | 474 | 24,606 | 0 | 0 | 0 | 0 | 0 | 0 | 0 | 0 | 0 | 0 | 0 | 0 | 0 | 0 | 0 | 0 | 0 | 0 | 0 | 0 | 0 | 0 | 0 | 0 | 0 |
| March 2020 | 370 | 16,117 | 0 | 0 | 0 | 0 | 0 | 0 | 0 | 0 | 0 | 0 | 0 | 0 | 0 | 0 | 0 | 0 | 0 | 0 | 0 | 0 | 0 | 0 | 0 | 0 | 0 |
| April 2020 | 16 | 0 | 0 | 0 | 0 | 0 | 0 | 0 | 0 | 1 | 0 | 0 | 0 | 0 | 0 | 0 | 0 | 0 | 0 | 0 | 0 | 0 | 0 | 0 | 0 | 0 | 0 |
| May 2020 | 194 | 2319 | 0 | 0 | 0 | 0 | 0 | 0 | 0 | 0 | 0 | 0 | 0 | 0 | 0 | 0 | 0 | 0 | 0 | 0 | 0 | 0 | 0 | 0 | 0 | 0 | 0 |
| June 2020 | 818 | 24,929 | 0 | 0 | 0 | 0 | 0 | 0 | 0 | 0 | 0 | 0 | 0 | 0 | 0 | 0 | 2 | 0 | 0 | 1 | 0 | 0 | 0 | 0 | 0 | 1 | 0 |
| July 2020 | 2757 | 169,229 | 0 | 0 | 0 | 0 | 3 | 0 | 0 | 0 | 0 | 0 | 0 | 0 | 0 | 0 | 11 | 1 | 0 | 0 | 0 | 0 | 1 | 0 | 0 | 6 | 0 |
| August 2020 | 3676 | 271,362 | 1 | 0 | 0 | 0 | 0 | 0 | 0 | 0 | 0 | 0 | 0 | 1 | 0 | 0 | 7 | 0 | 0 | 0 | 0 | 0 | 0 | 0 | 0 | 0 | 0 |
| September 2020 | 1807 | 74,653 | 0 | 0 | 0 | 0 | 0 | 0 | 0 | 0 | 0 | 0 | 0 | 0 | 0 | 0 | 2 | 0 | 0 | 0 | 0 | 0 | 1 | 0 | 0 | 1 | 0 |
| October 2020 | 720 | 25,050 | 0 | 0 | 0 | 0 | 0 | 0 | 0 | 0 | 0 | 0 | 0 | 0 | 0 | 0 | 1 | 0 | 0 | 0 | 0 | 0 | 0 | 0 | 0 | 1 | 1 |
| November 2020 | 410 | 7658 | 0 | 0 | 1 | 0 | 0 | 0 | 0 | 0 | 0 | 0 | 0 | 0 | 0 | 0 | 0 | 0 | 0 | 0 | 0 | 0 | 0 | 0 | 0 | 0 | 0 |
| December 2020 | 341 | 8145 | 0 | 0 | 0 | 0 | 0 | 0 | 0 | 0 | 0 | 0 | 0 | 0 | 0 | 0 | 0 | 0 | 0 | 0 | 0 | 0 | 0 | 0 | 0 | 0 | 0 |
| January 2021 | 314 | 7415 | 0 | 0 | 0 | 0 | 0 | 0 | 0 | 0 | 0 | 0 | 0 | 0 | 0 | 0 | 0 | 0 | 0 | 0 | 0 | 0 | 0 | 0 | 0 | 0 | 0 |
| February 2021 | 274 | 5706 | 0 | 0 | 0 | 0 | 0 | 0 | 0 | 0 | 0 | 0 | 0 | 0 | 0 | 0 | 0 | 0 | 0 | 0 | 0 | 0 | 0 | 0 | 0 | 0 | 0 |
| March 2021 | 358 | 8031 | 0 | 0 | 0 | 0 | 0 | 0 | 0 | 0 | 0 | 0 | 0 | 0 | 0 | 0 | 0 | 0 | 0 | 0 | 0 | 0 | 0 | 0 | 0 | 0 | 0 |
| April 2021 | 587 | 13,964 | 0 | 0 | 0 | 0 | 0 | 0 | 0 | 0 | 0 | 0 | 0 | 0 | 0 | 0 | 0 | 0 | 0 | 0 | 0 | 0 | 0 | 0 | 0 | 0 | 0 |
| May 2021 | 883 | 32,754 | 0 | 0 | 0 | 0 | 0 | 0 | 0 | 0 | 0 | 0 | 0 | 0 | 0 | 2 | 0 | 0 | 0 | 0 | 0 | 0 | 1 | 0 | 0 | 0 | 0 |
| June 2021 | 2051 | 114,687 | 0 | 0 | 0 | 0 | 1 | 0 | 0 | 0 | 0 | 0 | 0 | 0 | 0 | 0 | 2 | 0 | 0 | 0 | 0 | 0 | 2 | 0 | 0 | 1 | 0 |
| July 2021 | 4084 | 349,042 | 0 | 1 | 0 | 0 | 0 | 0 | 0 | 2 | 0 | 0 | 0 | 0 | 0 | 0 | 0 | 2 | 0 | 0 | 0 | 0 | 0 | 0 | 0 | 0 | 0 |
| August 2021 | 4728 | 491,358 | 0 | 0 | 0 | 0 | 0 | 0 | 0 | 0 | 0 | 0 | 0 | 0 | 0 | 0 | 0 | 0 | 0 | 0 | 0 | 0 | 1 | 0 | 0 | 7 | 1 |
| September 2021 | 3435 | 326,347 | 0 | 0 | 0 | 0 | 0 | 0 | 0 | 0 | 0 | 0 | 0 | 0 | 0 | 0 | 1 | 0 | 0 | 0 | 0 | 1 | 1 | 0 | 0 | 1 | 0 |
| October 2021 | 2090 | 160,720 | 0 | 0 | 0 | 0 | 1 | 0 | 0 | 0 | 0 | 0 | 0 | 0 | 0 | 0 | 0 | 0 | 0 | 0 | 0 | 0 | 0 | 0 | 0 | 0 | 0 |
| November 2021 | 613 | 25,726 | 0 | 0 | 0 | 0 | 0 | 0 | 0 | 0 | 0 | 0 | 0 | 0 | 0 | 0 | 0 | 0 | 0 | 0 | 0 | 0 | 0 | 0 | 0 | 0 | 0 |
| December 2021 | 615 | 23,428 | 0 | 0 | 0 | 0 | 0 | 0 | 0 | 0 | 0 | 0 | 0 | 0 | 0 | 0 | 0 | 0 | 0 | 0 | 0 | 1 | 0 | 0 | 0 | 0 | 0 |
Table A2 shows achieved safety performance targets (SPTs) in the period from January 2014 to December 2021 [53]. All deviations (breaches) from defined (desired) targets are marked in red.
Table A2.
Dataset of achieved safety performance targets (SPTs) at Split Airport, in the observed time period. Adapted with permission from Ref. [53]. 2022, Split Airport.
Table A2.
Dataset of achieved safety performance targets (SPTs) at Split Airport, in the observed time period. Adapted with permission from Ref. [53]. 2022, Split Airport.
| Month | SPI1 | SPI2 | SPI3 | SPI4 | SPI5 | SPI6 | SPI7 | SPI8 | SPI9 | SPI10 | SPI11 | SPI12 | SPI13 | SPI14 | SPI15 | SPI16 | SPI17 | SPI18 | SPI19 | SPI20 | SPI21 | SPI22 | SPI23 | SPI24 | SPI25 |
|---|---|---|---|---|---|---|---|---|---|---|---|---|---|---|---|---|---|---|---|---|---|---|---|---|---|
| January 2014 | 0.0000 | 0.0000 | 0.0000 | 0.0000 | 0.0000 | 0.0000 | 0.0000 | 0.0000 | 0.0000 | 0.0000 | 0.0000 | 0.0000 | 0.0000 | 0.0000 | 0.0000 | 0.0000 | 0.0000 | 0.0000 | 0.0000 | 0.0000 | 0.00231 | 0.0000 | 0.0000 | 0.0000 | 0.0000 |
| February 2014 | 0.0000 | 0.0000 | 0.0000 | 0.0000 | 0.0000 | 0.0000 | 0.0000 | 0.0000 | 0.0000 | 0.0000 | 0.0000 | 0.0000 | 0.0000 | 0.0000 | 0.0000 | 0.0000 | 0.0026 | 0.0000 | 0.0000 | 0.0026 | 0.0000 | 0.0000 | 0.0000 | 0.0000 | 0.0000 |
| March 2014 | 0.0000 | 0.0000 | 0.0000 | 0.0000 | 0.0000 | 0.0000 | 0.0000 | 0.0000 | 0.0000 | 0.0000 | 0.0000 | 0.0000 | 0.0000 | 0.0019 | 0.0000 | 0.0000 | 0.0000 | 0.0000 | 0.0000 | 0.0019 | 0.0019 | 0.0000 | 0.0000 | 0.0019 | 0.0000 |
| April 2014 | 0.0000 | 0.0000 | 0.0000 | 0.0000 | 0.0000 | 0.0000 | 0.0000 | 0.0019 | 0.0000 | 0.0039 | 0.0010 | 0.0000 | 0.0000 | 0.0000 | 0.0000 | 0.0000 | 0.0000 | 0.0000 | 0.0000 | 0.0000 | 0.0010 | 0.0000 | 0.0000 | 0.0000 | 0.0000 |
| May 2014 | 0.0000 | 0.0000 | 0.0000 | 0.0000 | 0.0000 | 0.0000 | 0.0000 | 0.0005 | 0.0000 | 0.0000 | 0.0000 | 0.0000 | 0.0000 | 0.0000 | 0.0000 | 0.0005 | 0.0000 | 0.0000 | 0.0000 | 0.0000 | 0.0005 | 0.0000 | 0.0000 | 0.0005 | 0.0000 |
| June 2014 | 0.0000 | 0.0000 | 0.0000 | 0.0000 | 0.0008 | 0.0000 | 0.0000 | 0.0004 | 0.0000 | 0.0000 | 0.0000 | 0.0000 | 0.0004 | 0.0004 | 0.0004 | 0.0000 | 0.0004 | 0.0000 | 0.0000 | 0.0004 | 0.0023 | 0.0000 | 0.0000 | 0.0000 | 0.0000 |
| July 2014 | 0.0000 | 0.0000 | 0.0003 | 0.0000 | 0.0003 | 0.0000 | 0.0000 | 0.0000 | 0.0000 | 0.0000 | 0.0000 | 0.0000 | 0.0003 | 0.0000 | 0.0013 | 0.0000 | 0.0000 | 0.0000 | 0.0000 | 0.0000 | 0.0003 | 0.0000 | 0.0000 | 0.0026 | 0.0000 |
| August 2014 | 0.0000 | 0.0000 | 0.0000 | 0.0000 | 0.0000 | 0.0000 | 0.0000 | 0.0000 | 0.0003 | 0.0003 | 0.0000 | 0.0000 | 0.0000 | 0.0000 | 0.0000 | 0.0003 | 0.0000 | 0.0000 | 0.0000 | 0.0000 | 0.0008 | 0.0000 | 0.0003 | 0.0003 | 0.0000 |
| September 2014 | 0.0000 | 0.0000 | 0.0000 | 0.0004 | 0.0000 | 0.0000 | 0.0000 | 0.0004 | 0.0004 | 0.0000 | 0.0000 | 0.0000 | 0.0000 | 0.0004 | 0.0008 | 0.0000 | 0.0000 | 0.0000 | 0.0000 | 0.0004 | 0.0000 | 0.0000 | 0.0004 | 0.0008 | 0.0000 |
| October 2014 | 0.0000 | 0.0000 | 0.0000 | 0.0000 | 0.0000 | 0.0000 | 0.0000 | 0.0007 | 0.0000 | 0.0000 | 0.0000 | 0.0000 | 0.0000 | 0.0000 | 0.0000 | 0.0000 | 0.0000 | 0.0000 | 0.0000 | 0.0000 | 0.0007 | 0.0000 | 0.0000 | 0.0014 | 0.0000 |
| November 2014 | 0.0000 | 0.0000 | 0.0000 | 0.0000 | 0.0000 | 0.0000 | 0.0000 | 0.0000 | 0.0000 | 0.0000 | 0.0000 | 0.0000 | 0.0000 | 0.0000 | 0.0000 | 0.0000 | 0.0000 | 0.0000 | 0.0000 | 0.0000 | 0.0000 | 0.0000 | 0.0000 | 0.0000 | 0.0000 |
| December 2014 | 0.0000 | 0.0000 | 0.0000 | 0.0000 | 0.0000 | 0.0000 | 0.0000 | 0.0000 | 0.0000 | 0.0000 | 0.0000 | 0.0000 | 0.0000 | 0.0000 | 0.0000 | 0.0000 | 0.0000 | 0.0000 | 0.0000 | 0.0000 | 0.0000 | 0.0000 | 0.0000 | 0.0000 | 0.0000 |
| January 2015 | 0.0000 | 0.0000 | 0.0000 | 0.0000 | 0.0000 | 0.0000 | 0.0000 | 0.0000 | 0.0000 | 0.0020 | 0.0000 | 0.0000 | 0.0000 | 0.0000 | 0.0000 | 0.0000 | 0.0000 | 0.0000 | 0.0000 | 0.0000 | 0.0000 | 0.0000 | 0.0000 | 0.0000 | 0.0000 |
| February 2015 | 0.0000 | 0.0000 | 0.0000 | 0.0000 | 0.0000 | 0.0000 | 0.0000 | 0.0000 | 0.0000 | 0.0000 | 0.0000 | 0.0000 | 0.0000 | 0.0000 | 0.0000 | 0.0000 | 0.0000 | 0.0000 | 0.0000 | 0.0000 | 0.0044 | 0.0000 | 0.0000 | 0.0000 | 0.0000 |
| March 2015 | 0.0000 | 0.0000 | 0.0000 | 0.0000 | 0.0000 | 0.0000 | 0.0000 | 0.0000 | 0.0000 | 0.0000 | 0.0000 | 0.0000 | 0.0000 | 0.0017 | 0.0000 | 0.0000 | 0.0000 | 0.0000 | 0.0000 | 0.0000 | 0.0000 | 0.0000 | 0.0000 | 0.0000 | 0.0000 |
| April 2015 | 0.0000 | 0.0000 | 0.0000 | 0.0000 | 0.0000 | 0.0000 | 0.0000 | 0.0000 | 0.0000 | 0.0000 | 0.0000 | 0.0000 | 0.0009 | 0.0000 | 0.0018 | 0.0000 | 0.0000 | 0.0000 | 0.0000 | 0.0000 | 0.0009 | 0.0000 | 0.0000 | 0.0018 | 0.0000 |
| May 2015 | 0.0000 | 0.0000 | 0.0004 | 0.0000 | 0.0000 | 0.0000 | 0.0000 | 0.0000 | 0.0004 | 0.0000 | 0.0000 | 0.0000 | 0.0000 | 0.0000 | 0.0004 | 0.0000 | 0.0000 | 0.0000 | 0.0000 | 0.0000 | 0.0004 | 0.0000 | 0.0004 | 0.0000 | 0.0000 |
| June 2015 | 0.0000 | 0.0000 | 0.0000 | 0.0000 | 0.0000 | 0.0000 | 0.0000 | 0.0003 | 0.0000 | 0.0000 | 0.0000 | 0.0000 | 0.0000 | 0.0000 | 0.0003 | 0.0003 | 0.0000 | 0.0000 | 0.0000 | 0.0007 | 0.0003 | 0.0000 | 0.0003 | 0.0003 | 0.0000 |
| July 2015 | 0.0002 | 0.0000 | 0.0002 | 0.0002 | 0.0002 | 0.0000 | 0.0000 | 0.0000 | 0.0000 | 0.0000 | 0.0000 | 0.0000 | 0.0000 | 0.0002 | 0.0023 | 0.0000 | 0.0000 | 0.0000 | 0.0000 | 0.0002 | 0.0007 | 0.0000 | 0.0000 | 0.0009 | 0.0002 |
| August 2015 | 0.0000 | 0.0000 | 0.0000 | 0.0000 | 0.0002 | 0.0000 | 0.0000 | 0.0000 | 0.0000 | 0.0000 | 0.0000 | 0.0000 | 0.0000 | 0.0000 | 0.0024 | 0.0000 | 0.0002 | 0.0000 | 0.0000 | 0.0000 | 0.0005 | 0.0000 | 0.0000 | 0.0007 | 0.0000 |
| September 2015 | 0.0000 | 0.0000 | 0.0000 | 0.0000 | 0.0004 | 0.0000 | 0.0000 | 0.0004 | 0.0000 | 0.0000 | 0.0000 | 0.0000 | 0.0000 | 0.0000 | 0.0021 | 0.0000 | 0.0000 | 0.0000 | 0.0000 | 0.0000 | 0.0004 | 0.0000 | 0.0000 | 0.0000 | 0.0000 |
| October 2015 | 0.0000 | 0.0000 | 0.0000 | 0.0000 | 0.0000 | 0.0000 | 0.0000 | 0.0006 | 0.0000 | 0.0000 | 0.0000 | 0.0000 | 0.0000 | 0.0000 | 0.0013 | 0.0000 | 0.0000 | 0.0000 | 0.0000 | 0.0000 | 0.0006 | 0.0000 | 0.0000 | 0.0000 | 0.0000 |
| November 2015 | 0.0000 | 0.0000 | 0.0000 | 0.0000 | 0.0000 | 0.0000 | 0.0000 | 0.0000 | 0.0016 | 0.0000 | 0.0000 | 0.0000 | 0.0000 | 0.0000 | 0.0000 | 0.0000 | 0.0000 | 0.0000 | 0.0000 | 0.0000 | 0.0000 | 0.0000 | 0.0000 | 0.0000 | 0.0000 |
| December 2015 | 0.0000 | 0.0000 | 0.0000 | 0.0000 | 0.0000 | 0.0000 | 0.0000 | 0.0018 | 0.0000 | 0.0000 | 0.0000 | 0.0000 | 0.0000 | 0.0018 | 0.0000 | 0.0000 | 0.0000 | 0.0000 | 0.0000 | 0.0000 | 0.0000 | 0.0000 | 0.0000 | 0.0000 | 0.0000 |
| January 2016 | 0.0000 | 0.0000 | 0.0000 | 0.0000 | 0.0000 | 0.0000 | 0.0000 | 0.0000 | 0.0000 | 0.0000 | 0.0000 | 0.0000 | 0.0000 | 0.0000 | 0.0000 | 0.0000 | 0.0000 | 0.0000 | 0.0000 | 0.0000 | 0.0020 | 0.0000 | 0.0000 | 0.0000 | 0.0000 |
| February 2016 | 0.0000 | 0.0000 | 0.0000 | 0.0000 | 0.0000 | 0.0000 | 0.0000 | 0.0000 | 0.0020 | 0.0000 | 0.0000 | 0.0000 | 0.0000 | 0.0000 | 0.0000 | 0.0000 | 0.0000 | 0.0000 | 0.0000 | 0.0000 | 0.0061 | 0.0000 | 0.0000 | 0.0020 | 0.0000 |
| March 2016 | 0.0016 | 0.0000 | 0.0000 | 0.0000 | 0.0016 | 0.0000 | 0.0016 | 0.0000 | 0.0000 | 0.0000 | 0.0000 | 0.0000 | 0.0000 | 0.0000 | 0.0016 | 0.0000 | 0.0000 | 0.0000 | 0.0000 | 0.0000 | 0.0000 | 0.0000 | 0.0000 | 0.0000 | 0.0000 |
| April 2016 | 0.0000 | 0.0000 | 0.0000 | 0.0000 | 0.0000 | 0.0000 | 0.0000 | 0.0000 | 0.0000 | 0.0000 | 0.0000 | 0.0000 | 0.0000 | 0.0000 | 0.0009 | 0.0000 | 0.0000 | 0.0000 | 0.0000 | 0.0000 | 0.0009 | 0.0000 | 0.0000 | 0.0000 | 0.0000 |
| May 2016 | 0.0000 | 0.0000 | 0.0004 | 0.0000 | 0.0008 | 0.0000 | 0.0004 | 0.0000 | 0.0000 | 0.0000 | 0.0000 | 0.0000 | 0.0000 | 0.0000 | 0.0025 | 0.0000 | 0.0004 | 0.0000 | 0.0000 | 0.0004 | 0.0008 | 0.0000 | 0.0000 | 0.0008 | 0.0000 |
| June 2016 | 0.0000 | 0.0000 | 0.0003 | 0.0000 | 0.0000 | 0.0000 | 0.0000 | 0.0000 | 0.0000 | 0.0000 | 0.0000 | 0.0000 | 0.0000 | 0.0000 | 0.0044 | 0.0000 | 0.0000 | 0.0000 | 0.0000 | 0.0006 | 0.0010 | 0.0000 | 0.0000 | 0.0003 | 0.0003 |
| July 2016 | 0.0000 | 0.0000 | 0.0000 | 0.0000 | 0.0002 | 0.0000 | 0.0000 | 0.0000 | 0.0002 | 0.0000 | 0.0000 | 0.0000 | 0.0000 | 0.0000 | 0.0033 | 0.0000 | 0.0000 | 0.0000 | 0.0000 | 0.0000 | 0.0006 | 0.0000 | 0.0000 | 0.0000 | 0.0000 |
| August 2016 | 0.0000 | 0.0000 | 0.0000 | 0.0002 | 0.0002 | 0.0000 | 0.0000 | 0.0002 | 0.0000 | 0.0000 | 0.0000 | 0.0000 | 0.0000 | 0.0000 | 0.0033 | 0.0002 | 0.0000 | 0.0000 | 0.0000 | 0.0002 | 0.0007 | 0.0000 | 0.0000 | 0.0000 | 0.0002 |
| September 2016 | 0.0000 | 0.0000 | 0.0000 | 0.0000 | 0.0003 | 0.0000 | 0.0000 | 0.0003 | 0.0000 | 0.0000 | 0.0003 | 0.0000 | 0.0003 | 0.0000 | 0.0015 | 0.0000 | 0.0000 | 0.0000 | 0.0000 | 0.0009 | 0.0015 | 0.0003 | 0.0000 | 0.0006 | 0.0006 |
| October 2016 | 0.0000 | 0.0000 | 0.0000 | 0.0000 | 0.0000 | 0.0000 | 0.0000 | 0.0000 | 0.0000 | 0.0000 | 0.0000 | 0.0000 | 0.0000 | 0.0000 | 0.0011 | 0.0000 | 0.0000 | 0.0000 | 0.0000 | 0.0011 | 0.0005 | 0.0000 | 0.0000 | 0.0005 | 0.0000 |
| November 2016 | 0.0000 | 0.0000 | 0.0000 | 0.0000 | 0.0000 | 0.0000 | 0.0000 | 0.0000 | 0.0000 | 0.0000 | 0.0000 | 0.0000 | 0.0000 | 0.0000 | 0.0000 | 0.0000 | 0.0000 | 0.0000 | 0.0000 | 0.0000 | 0.0017 | 0.0000 | 0.0000 | 0.0000 | 0.0000 |
| December 2016 | 0.0000 | 0.0000 | 0.0000 | 0.0000 | 0.0000 | 0.0000 | 0.0000 | 0.0000 | 0.0000 | 0.0000 | 0.0000 | 0.0000 | 0.0000 | 0.0000 | 0.0035 | 0.0000 | 0.0000 | 0.0000 | 0.0000 | 0.0000 | 0.0000 | 0.0000 | 0.0000 | 0.0000 | 0.0000 |
| January 2017 | 0.0000 | 0.0000 | 0.0000 | 0.0017 | 0.0000 | 0.0000 | 0.0000 | 0.0000 | 0.0000 | 0.0017 | 0.0000 | 0.0000 | 0.0000 | 0.0000 | 0.0000 | 0.0017 | 0.0000 | 0.0000 | 0.0000 | 0.0000 | 0.0000 | 0.0000 | 0.0000 | 0.0000 | 0.0000 |
| February 2017 | 0.0000 | 0.0000 | 0.0000 | 0.0000 | 0.0000 | 0.0000 | 0.0000 | 0.0000 | 0.0000 | 0.0000 | 0.0000 | 0.0000 | 0.0000 | 0.0000 | 0.0000 | 0.0000 | 0.0000 | 0.0020 | 0.0000 | 0.0000 | 0.0000 | 0.0000 | 0.0000 | 0.0020 | 0.0020 |
| March 2017 | 0.0016 | 0.0000 | 0.0000 | 0.0000 | 0.0000 | 0.0000 | 0.0000 | 0.0000 | 0.0000 | 0.0000 | 0.0000 | 0.0000 | 0.0000 | 0.0000 | 0.0000 | 0.0000 | 0.0000 | 0.0000 | 0.0000 | 0.0000 | 0.0000 | 0.0000 | 0.0000 | 0.0016 | 0.0016 |
| April 2017 | 0.0000 | 0.0000 | 0.0000 | 0.0000 | 0.0000 | 0.0000 | 0.0000 | 0.0000 | 0.0000 | 0.0000 | 0.0000 | 0.0000 | 0.0000 | 0.0000 | 0.0007 | 0.0000 | 0.0000 | 0.0000 | 0.0000 | 0.0000 | 0.0000 | 0.0000 | 0.0000 | 0.0007 | 0.0000 |
| May 2017 | 0.0000 | 0.0000 | 0.0000 | 0.0000 | 0.0004 | 0.0000 | 0.0000 | 0.0000 | 0.0004 | 0.0000 | 0.0000 | 0.0000 | 0.0000 | 0.0000 | 0.0011 | 0.0000 | 0.0000 | 0.0000 | 0.0000 | 0.0000 | 0.0004 | 0.0000 | 0.0000 | 0.0011 | 0.0000 |
| June 2017 | 0.0000 | 0.0000 | 0.0000 | 0.0000 | 0.0000 | 0.0000 | 0.0000 | 0.0000 | 0.0000 | 0.0000 | 0.0000 | 0.0000 | 0.0000 | 0.0000 | 0.0017 | 0.0000 | 0.0000 | 0.0000 | 0.0000 | 0.0000 | 0.0014 | 0.0003 | 0.0000 | 0.0000 | 0.0003 |
| July 2017 | 0.0000 | 0.0000 | 0.0000 | 0.0000 | 0.0006 | 0.0000 | 0.0000 | 0.0000 | 0.0000 | 0.0000 | 0.0000 | 0.0000 | 0.0000 | 0.0000 | 0.0013 | 0.0000 | 0.0000 | 0.0000 | 0.0000 | 0.0000 | 0.0000 | 0.0000 | 0.0000 | 0.0004 | 0.0000 |
| August 2017 | 0.0000 | 0.0000 | 0.0000 | 0.0000 | 0.0000 | 0.0000 | 0.0000 | 0.0002 | 0.0000 | 0.0000 | 0.0000 | 0.0000 | 0.0000 | 0.0000 | 0.0000 | 0.0000 | 0.0000 | 0.0000 | 0.0000 | 0.0000 | 0.0008 | 0.0000 | 0.0000 | 0.0006 | 0.0000 |
| September 2017 | 0.0000 | 0.0000 | 0.0000 | 0.0000 | 0.0000 | 0.0000 | 0.0000 | 0.0000 | 0.0000 | 0.0000 | 0.0000 | 0.0000 | 0.0000 | 0.0000 | 0.0026 | 0.0000 | 0.0000 | 0.0000 | 0.0000 | 0.0000 | 0.0000 | 0.0000 | 0.0000 | 0.0106 | 0.0026 |
| October 2017 | 0.0000 | 0.0000 | 0.0000 | 0.0000 | 0.0000 | 0.0000 | 0.0000 | 0.0000 | 0.0000 | 0.0000 | 0.0000 | 0.0000 | 0.0000 | 0.0000 | 0.0005 | 0.0000 | 0.0000 | 0.0005 | 0.0005 | 0.0000 | 0.0000 | 0.0000 | 0.0000 | 0.0005 | 0.0005 |
| November 2017 | 0.0000 | 0.0000 | 0.0000 | 0.0000 | 0.0000 | 0.0000 | 0.0000 | 0.0000 | 0.0000 | 0.0015 | 0.0000 | 0.0000 | 0.0015 | 0.0000 | 0.0000 | 0.0000 | 0.0000 | 0.0000 | 0.0000 | 0.0000 | 0.0000 | 0.0000 | 0.0000 | 0.0000 | 0.0000 |
| December 2017 | 0.0000 | 0.0000 | 0.0000 | 0.0000 | 0.0000 | 0.0000 | 0.0000 | 0.0000 | 0.0000 | 0.0000 | 0.0000 | 0.0000 | 0.0000 | 0.0000 | 0.0000 | 0.0000 | 0.0000 | 0.0000 | 0.0000 | 0.0000 | 0.0000 | 0.0000 | 0.0000 | 0.0000 | 0.0000 |
| January 2018 | 0.0000 | 0.0000 | 0.0000 | 0.0000 | 0.0000 | 0.0000 | 0.0000 | 0.0000 | 0.0000 | 0.0017 | 0.0000 | 0.0000 | 0.0000 | 0.0000 | 0.0000 | 0.0000 | 0.0000 | 0.0000 | 0.0000 | 0.0000 | 0.0017 | 0.0000 | 0.0000 | 0.0000 | 0.0000 |
| February 2018 | 0.0000 | 0.0000 | 0.0000 | 0.0000 | 0.0000 | 0.0000 | 0.0000 | 0.0000 | 0.0000 | 0.0019 | 0.0000 | 0.0000 | 0.0000 | 0.0019 | 0.0000 | 0.0000 | 0.0000 | 0.0038 | 0.0000 | 0.0000 | 0.0000 | 0.0000 | 0.0000 | 0.0019 | 0.0000 |
| March 2018 | 0.0000 | 0.0000 | 0.0000 | 0.0000 | 0.0000 | 0.0000 | 0.0000 | 0.0000 | 0.0000 | 0.0013 | 0.0000 | 0.0013 | 0.0000 | 0.0000 | 0.0000 | 0.0000 | 0.0000 | 0.0000 | 0.0000 | 0.0000 | 0.0027 | 0.0000 | 0.0000 | 0.0000 | 0.0000 |
| April 2018 | 0.0000 | 0.0000 | 0.0000 | 0.0000 | 0.0000 | 0.0000 | 0.0000 | 0.0000 | 0.0000 | 0.0000 | 0.0000 | 0.0000 | 0.0000 | 0.0000 | 0.0007 | 0.0000 | 0.0000 | 0.0000 | 0.0000 | 0.0007 | 0.0007 | 0.0000 | 0.0000 | 0.0013 | 0.0000 |
| May 2018 | 0.0000 | 0.0000 | 0.0000 | 0.0000 | 0.0000 | 0.0000 | 0.0000 | 0.0000 | 0.0000 | 0.0000 | 0.0000 | 0.0000 | 0.0000 | 0.0000 | 0.0017 | 0.0000 | 0.0000 | 0.0000 | 0.0000 | 0.0000 | 0.0003 | 0.0000 | 0.0000 | 0.0000 | 0.0000 |
| June 2018 | 0.0000 | 0.0000 | 0.0000 | 0.0000 | 0.0000 | 0.0000 | 0.0000 | 0.0000 | 0.0000 | 0.0000 | 0.0000 | 0.0000 | 0.0000 | 0.0000 | 0.0005 | 0.0000 | 0.0000 | 0.0000 | 0.0000 | 0.0000 | 0.0000 | 0.0000 | 0.0000 | 0.0000 | 0.0002 |
| July 2018 | 0.0000 | 0.0000 | 0.0000 | 0.0000 | 0.0002 | 0.0000 | 0.0000 | 0.0000 | 0.0000 | 0.0000 | 0.0000 | 0.0000 | 0.0000 | 0.0000 | 0.0011 | 0.0000 | 0.0000 | 0.0000 | 0.0000 | 0.0004 | 0.0015 | 0.0000 | 0.0000 | 0.0002 | 0.0000 |
| August 2018 | 0.0000 | 0.0000 | 0.0000 | 0.0000 | 0.0000 | 0.0000 | 0.0000 | 0.0000 | 0.0000 | 0.0002 | 0.0000 | 0.0000 | 0.0002 | 0.0000 | 0.0010 | 0.0002 | 0.0000 | 0.0000 | 0.0000 | 0.0006 | 0.0000 | 0.0000 | 0.0000 | 0.0006 | 0.0000 |
| September 2018 | 0.0000 | 0.0000 | 0.0000 | 0.0000 | 0.0000 | 0.0000 | 0.0000 | 0.0000 | 0.0000 | 0.0000 | 0.0000 | 0.0000 | 0.0000 | 0.0000 | 0.0010 | 0.0000 | 0.0003 | 0.0000 | 0.0000 | 0.0000 | 0.0008 | 0.0000 | 0.0000 | 0.0010 | 0.0000 |
| October 2018 | 0.0000 | 0.0000 | 0.0000 | 0.0000 | 0.0009 | 0.0000 | 0.0000 | 0.0000 | 0.0004 | 0.0000 | 0.0000 | 0.0000 | 0.0000 | 0.0000 | 0.0022 | 0.0000 | 0.0000 | 0.0000 | 0.0000 | 0.0004 | 0.0004 | 0.0004 | 0.0000 | 0.0000 | 0.0000 |
| November 2018 | 0.0000 | 0.0000 | 0.0000 | 0.0000 | 0.0000 | 0.0000 | 0.0000 | 0.0000 | 0.0000 | 0.0000 | 0.0000 | 0.0000 | 0.0000 | 0.0000 | 0.0027 | 0.0000 | 0.0000 | 0.0000 | 0.0000 | 0.0013 | 0.0000 | 0.0000 | 0.0000 | 0.0000 | 0.0000 |
| December 2018 | 0.0000 | 0.0000 | 0.0000 | 0.0000 | 0.0000 | 0.0000 | 0.0000 | 0.0000 | 0.0000 | 0.0000 | 0.0000 | 0.0000 | 0.0000 | 0.0000 | 0.0000 | 0.0000 | 0.0000 | 0.0000 | 0.0000 | 0.0000 | 0.0000 | 0.0000 | 0.0000 | 0.0000 | 0.0000 |
| January 2019 | 0.0000 | 0.0000 | 0.0000 | 0.0000 | 0.0000 | 0.0000 | 0.0000 | 0.0000 | 0.0000 | 0.0000 | 0.0000 | 0.0000 | 0.0000 | 0.0000 | 0.0000 | 0.0000 | 0.0000 | 0.0000 | 0.0000 | 0.0000 | 0.0000 | 0.0000 | 0.0000 | 0.0000 | 0.0000 |
| February 2019 | 0.0000 | 0.0000 | 0.0000 | 0.0000 | 0.0000 | 0.0000 | 0.0000 | 0.0000 | 0.0000 | 0.0000 | 0.0000 | 0.0000 | 0.0000 | 0.0000 | 0.0000 | 0.0000 | 0.0000 | 0.0000 | 0.0000 | 0.0000 | 0.0047 | 0.0000 | 0.0000 | 0.0000 | 0.0000 |
| March 2019 | 0.0000 | 0.0000 | 0.0000 | 0.0000 | 0.0000 | 0.0000 | 0.0000 | 0.0013 | 0.0000 | 0.0000 | 0.0000 | 0.0000 | 0.0013 | 0.0000 | 0.0000 | 0.0000 | 0.0000 | 0.0000 | 0.0000 | 0.0000 | 0.0000 | 0.0000 | 0.0000 | 0.0000 | 0.0000 |
| April 2019 | 0.0000 | 0.0000 | 0.0000 | 0.0000 | 0.0000 | 0.0000 | 0.0000 | 0.0000 | 0.0000 | 0.0000 | 0.0000 | 0.0006 | 0.0000 | 0.0024 | 0.0000 | 0.0000 | 0.0000 | 0.0000 | 0.0000 | 0.0000 | 0.0006 | 0.0000 | 0.0000 | 0.0006 | 0.0000 |
| May 2019 | 0.0000 | 0.0000 | 0.0000 | 0.0000 | 0.0003 | 0.0000 | 0.0000 | 0.0000 | 0.0000 | 0.0000 | 0.0000 | 0.0000 | 0.0000 | 0.0003 | 0.0000 | 0.0000 | 0.0000 | 0.0000 | 0.0000 | 0.0000 | 0.0003 | 0.0000 | 0.0000 | 0.0007 | 0.0000 |
| June 2019 | 0.0000 | 0.0000 | 0.0000 | 0.0000 | 0.0000 | 0.0000 | 0.0000 | 0.0000 | 0.0000 | 0.0000 | 0.0000 | 0.0000 | 0.0000 | 0.0012 | 0.0000 | 0.0000 | 0.0000 | 0.0000 | 0.0000 | 0.0002 | 0.0002 | 0.0000 | 0.0000 | 0.0005 | 0.0000 |
| July 2019 | 0.0004 | 0.0000 | 0.0002 | 0.0000 | 0.0002 | 0.0000 | 0.0000 | 0.0000 | 0.0000 | 0.0000 | 0.0000 | 0.0000 | 0.0000 | 0.0002 | 0.0000 | 0.0000 | 0.0000 | 0.0000 | 0.0000 | 0.0000 | 0.0004 | 0.0000 | 0.0000 | 0.0023 | 0.0000 |
| August 2019 | 0.0000 | 0.0000 | 0.0000 | 0.0000 | 0.0000 | 0.0000 | 0.0000 | 0.0002 | 0.0000 | 0.0002 | 0.0000 | 0.0000 | 0.0000 | 0.0004 | 0.0004 | 0.0000 | 0.0000 | 0.0000 | 0.0000 | 0.0002 | 0.0004 | 0.0000 | 0.0000 | 0.0009 | 0.0000 |
| September 2019 | 0.0000 | 0.0000 | 0.0000 | 0.0000 | 0.0000 | 0.0000 | 0.0000 | 0.0000 | 0.0000 | 0.0000 | 0.0000 | 0.0000 | 0.0000 | 0.0000 | 0.0000 | 0.0000 | 0.0000 | 0.0000 | 0.0000 | 0.0003 | 0.0000 | 0.0000 | 0.0000 | 0.0000 | 0.0000 |
| October 2019 | 0.0000 | 0.0000 | 0.0013 | 0.0000 | 0.0000 | 0.0000 | 0.0000 | 0.0000 | 0.0000 | 0.0008 | 0.0000 | 0.0000 | 0.0000 | 0.0004 | 0.0000 | 0.0000 | 0.0000 | 0.0000 | 0.0000 | 0.0000 | 0.0017 | 0.0000 | 0.0000 | 0.0000 | 0.0000 |
| November 2019 | 0.0000 | 0.0000 | 0.0016 | 0.0000 | 0.0000 | 0.0000 | 0.0000 | 0.0000 | 0.0000 | 0.0000 | 0.0000 | 0.0000 | 0.0000 | 0.0032 | 0.0000 | 0.0000 | 0.0000 | 0.0000 | 0.0000 | 0.0000 | 0.0000 | 0.0000 | 0.0000 | 0.0016 | 0.0000 |
| December 2019 | 0.0000 | 0.0000 | 0.0000 | 0.0000 | 0.0000 | 0.0000 | 0.0000 | 0.0000 | 0.0000 | 0.0000 | 0.0000 | 0.0000 | 0.0000 | 0.0035 | 0.0000 | 0.0000 | 0.0000 | 0.0000 | 0.0000 | 0.0000 | 0.0017 | 0.0000 | 0.0000 | 0.0000 | 0.0000 |
| January 2020 | 0.0000 | 0.0000 | 0.0000 | 0.0000 | 0.0000 | 0.0000 | 0.0000 | 0.0000 | 0.0000 | 0.0000 | 0.0000 | 0.0000 | 0.0000 | 0.0000 | 0.0000 | 0.0000 | 0.0000 | 0.0000 | 0.0000 | 0.0000 | 0.0018 | 0.0000 | 0.0000 | 0.0000 | 0.0000 |
| February 2020 | 0.0000 | 0.0000 | 0.0000 | 0.0000 | 0.0000 | 0.0000 | 0.0000 | 0.0000 | 0.0000 | 0.0000 | 0.0000 | 0.0000 | 0.0000 | 0.0000 | 0.0000 | 0.0000 | 0.0000 | 0.0000 | 0.0000 | 0.0000 | 0.0000 | 0.0000 | 0.0000 | 0.0000 | 0.0000 |
| March 2020 | 0.0000 | 0.0000 | 0.0000 | 0.0000 | 0.0000 | 0.0000 | 0.0000 | 0.0000 | 0.0000 | 0.0000 | 0.0000 | 0.0000 | 0.0000 | 0.0000 | 0.0000 | 0.0000 | 0.0000 | 0.0000 | 0.0000 | 0.0000 | 0.0000 | 0.0000 | 0.0000 | 0.0000 | 0.0000 |
| April 2020 | 0.0000 | 0.0000 | 0.0000 | 0.0000 | 0.0000 | 0.0000 | 0.0000 | 0.0625 | 0.0000 | 0.0000 | 0.0000 | 0.0000 | 0.0000 | 0.0000 | 0.0000 | 0.0000 | 0.0000 | 0.0000 | 0.0000 | 0.0000 | 0.0000 | 0.0000 | 0.0000 | 0.0000 | 0.0000 |
| May 2020 | 0.0000 | 0.0000 | 0.0000 | 0.0000 | 0.0000 | 0.0000 | 0.0000 | 0.0000 | 0.0000 | 0.0000 | 0.0000 | 0.0000 | 0.0000 | 0.0000 | 0.0000 | 0.0000 | 0.0000 | 0.0000 | 0.0000 | 0.0000 | 0.0000 | 0.0000 | 0.0000 | 0.0000 | 0.0000 |
| June 2020 | 0.0000 | 0.0000 | 0.0000 | 0.0000 | 0.0000 | 0.0000 | 0.0000 | 0.0000 | 0.0000 | 0.0000 | 0.0000 | 0.0000 | 0.0000 | 0.0000 | 0.0024 | 0.0000 | 0.0000 | 0.0012 | 0.0000 | 0.0000 | 0.0000 | 0.0000 | 0.0000 | 0.0012 | 0.0000 |
| July 2020 | 0.0000 | 0.0000 | 0.0000 | 0.0000 | 0.0011 | 0.0000 | 0.0000 | 0.0000 | 0.0000 | 0.0000 | 0.0000 | 0.0000 | 0.0000 | 0.0000 | 0.0040 | 0.0004 | 0.0000 | 0.0000 | 0.0000 | 0.0000 | 0.0004 | 0.0000 | 0.0000 | 0.0022 | 0.0000 |
| August 2020 | 0.0003 | 0.0000 | 0.0000 | 0.0000 | 0.0000 | 0.0000 | 0.0000 | 0.0000 | 0.0000 | 0.0000 | 0.0000 | 0.0003 | 0.0000 | 0.0000 | 0.0019 | 0.0000 | 0.0000 | 0.0000 | 0.0000 | 0.0000 | 0.0000 | 0.0000 | 0.0000 | 0.0000 | 0.0000 |
| September 2020 | 0.0000 | 0.0000 | 0.0000 | 0.0000 | 0.0000 | 0.0000 | 0.0000 | 0.0000 | 0.0000 | 0.0000 | 0.0000 | 0.0000 | 0.0000 | 0.0000 | 0.0011 | 0.0000 | 0.0000 | 0.0000 | 0.0000 | 0.0000 | 0.0006 | 0.0000 | 0.0000 | 0.0006 | 0.0000 |
| October 2020 | 0.0000 | 0.0000 | 0.0000 | 0.0000 | 0.0000 | 0.0000 | 0.0000 | 0.0000 | 0.0000 | 0.0000 | 0.0000 | 0.0000 | 0.0000 | 0.0000 | 0.0014 | 0.0000 | 0.0000 | 0.0000 | 0.0000 | 0.0000 | 0.0000 | 0.0000 | 0.0000 | 0.0014 | 0.0014 |
| November 2020 | 0.0000 | 0.0000 | 0.0024 | 0.0000 | 0.0000 | 0.0000 | 0.0000 | 0.0000 | 0.0000 | 0.0000 | 0.0000 | 0.0000 | 0.0000 | 0.0000 | 0.0000 | 0.0000 | 0.0000 | 0.0000 | 0.0000 | 0.0000 | 0.0000 | 0.0000 | 0.0000 | 0.0000 | 0.0000 |
| December 2020 | 0.0000 | 0.0000 | 0.0000 | 0.0000 | 0.0000 | 0.0000 | 0.0000 | 0.0000 | 0.0000 | 0.0000 | 0.0000 | 0.0000 | 0.0000 | 0.0000 | 0.0000 | 0.0000 | 0.0000 | 0.0000 | 0.0000 | 0.0000 | 0.0000 | 0.0000 | 0.0000 | 0.0000 | 0.0000 |
| January 2021 | 0.0000 | 0.0000 | 0.0000 | 0.0000 | 0.0000 | 0.0000 | 0.0000 | 0.0000 | 0.0000 | 0.0000 | 0.0000 | 0.0000 | 0.0000 | 0.0000 | 0.0000 | 0.0000 | 0.0000 | 0.0000 | 0.0000 | 0.0000 | 0.0000 | 0.0000 | 0.0000 | 0.0000 | 0.0000 |
| February 2021 | 0.0000 | 0.0000 | 0.0000 | 0.0000 | 0.0000 | 0.0000 | 0.0000 | 0.0000 | 0.0000 | 0.0000 | 0.0000 | 0.0000 | 0.0000 | 0.0000 | 0.0000 | 0.0000 | 0.0000 | 0.0000 | 0.0000 | 0.0000 | 0.0000 | 0.0000 | 0.0000 | 0.0000 | 0.0000 |
| March 2021 | 0.0000 | 0.0000 | 0.0000 | 0.0000 | 0.0000 | 0.0000 | 0.0000 | 0.0000 | 0.0000 | 0.0000 | 0.0000 | 0.0000 | 0.0000 | 0.0000 | 0.0000 | 0.0000 | 0.0000 | 0.0000 | 0.0000 | 0.0000 | 0.0000 | 0.0000 | 0.0000 | 0.0000 | 0.0000 |
| April 2021 | 0.0000 | 0.0000 | 0.0000 | 0.0000 | 0.0000 | 0.0000 | 0.0000 | 0.0000 | 0.0000 | 0.0000 | 0.0000 | 0.0000 | 0.0000 | 0.0000 | 0.0000 | 0.0000 | 0.0000 | 0.0000 | 0.0000 | 0.0000 | 0.0000 | 0.0000 | 0.0000 | 0.0000 | 0.0000 |
| May 2021 | 0.0000 | 0.0000 | 0.0000 | 0.0000 | 0.0000 | 0.0000 | 0.0000 | 0.0000 | 0.0000 | 0.0000 | 0.0000 | 0.0000 | 0.0000 | 0.0023 | 0.0000 | 0.0000 | 0.0000 | 0.0000 | 0.0000 | 0.0000 | 0.0011 | 0.0000 | 0.0000 | 0.0000 | 0.0000 |
| June 2021 | 0.0000 | 0.0000 | 0.0000 | 0.0000 | 0.0005 | 0.0000 | 0.0000 | 0.0000 | 0.0000 | 0.0000 | 0.0000 | 0.0000 | 0.0000 | 0.0000 | 0.0010 | 0.0000 | 0.0000 | 0.0000 | 0.0000 | 0.0000 | 0.0010 | 0.0000 | 0.0000 | 0.0005 | 0.0000 |
| July 2021 | 0.0000 | 0.0002 | 0.0000 | 0.0000 | 0.0000 | 0.0000 | 0.0000 | 0.0005 | 0.0000 | 0.0000 | 0.0000 | 0.0000 | 0.0000 | 0.0000 | 0.0000 | 0.0005 | 0.0000 | 0.0000 | 0.0000 | 0.0000 | 0.0000 | 0.0000 | 0.0000 | 0.0000 | 0.0000 |
| August 2021 | 0.0000 | 0.0000 | 0.0000 | 0.0000 | 0.0000 | 0.0000 | 0.0000 | 0.0000 | 0.0000 | 0.0000 | 0.0000 | 0.0000 | 0.0000 | 0.0000 | 0.0000 | 0.0000 | 0.0000 | 0.0000 | 0.0000 | 0.0000 | 0.0002 | 0.0000 | 0.0000 | 0.0015 | 0.0002 |
| September 2021 | 0.0000 | 0.0000 | 0.0000 | 0.0000 | 0.0000 | 0.0000 | 0.0000 | 0.0000 | 0.0000 | 0.0000 | 0.0000 | 0.0000 | 0.0000 | 0.0000 | 0.0003 | 0.0000 | 0.0000 | 0.0000 | 0.0000 | 0.0003 | 0.0003 | 0.0000 | 0.0000 | 0.0003 | 0.0000 |
| October 2021 | 0.0000 | 0.0000 | 0.0000 | 0.0000 | 0.0005 | 0.0000 | 0.0000 | 0.0000 | 0.0000 | 0.0000 | 0.0000 | 0.0000 | 0.0000 | 0.0000 | 0.0000 | 0.0000 | 0.0000 | 0.0000 | 0.0000 | 0.0000 | 0.0000 | 0.0000 | 0.0000 | 0.0000 | 0.0000 |
| November 2021 | 0.0000 | 0.0000 | 0.0000 | 0.0000 | 0.0000 | 0.0000 | 0.0000 | 0.0000 | 0.0000 | 0.0000 | 0.0000 | 0.0000 | 0.0000 | 0.0000 | 0.0000 | 0.0000 | 0.0000 | 0.0000 | 0.0000 | 0.0000 | 0.0000 | 0.0000 | 0.0000 | 0.0000 | 0.0000 |
| December 2021 | 0.0000 | 0.0000 | 0.0000 | 0.0000 | 0.0000 | 0.0000 | 0.0000 | 0.0000 | 0.0000 | 0.0000 | 0.0000 | 0.0000 | 0.0000 | 0.0000 | 0.0000 | 0.0000 | 0.0000 | 0.0000 | 0.0000 | 0.0016 | 0.0000 | 0.0000 | 0.0000 | 0.0000 | 0.0000 |
1 All deviations (breaches) from defined (desired) targets are marked in red.
Appendix B
Figure A1 shows causal relationships of all individual organizational indicators (OIs) and safety performance indicators (SPIs) at Split Airport.
Figure A1.
Impacts of individual safety performance indicators: (a) SPI1—Number of occurrences related to LIRF and loadsheet crosscheck; (b) SPI2—Number of occurrences related to wrong figures for loadsheet; (c) SPI3—Number of dangerous goods incidents; (d) SPI4—Number of aircraft damage occurrences; (e) SPI5—Number of personnel or passenger injuries; (f) SPI7—Number of training deficiencies; (g) SPI8—Number of apron maintenance incidents; (h) SPI9—Number of vehicle maintenance incidents; (i) SPI10—Number of occurrences related to maneuvering area maintenance; (j) SPI11—Number of occurrences related to communication; (k) SPI12—Number of incidents related to taxiing to/from apron; (l) SPI13—Number of aircraft marshalling occurrences; (m) SPI14—Number of occurrences related to FOD presence; (n) SPI15—Number of occurrences related to passenger handling at the gate; (o) SPI16—Number of occurrences related to passenger handling—disembarking/embarking; (p) SPI17—Number of occurrences related to personal protective equipment; (q) SPI18—Number of aircraft chocking incidents; (r) SPI19—Number of aircraft conning incidents; (s) SPI20—Number of occurrences related to baggage loading/unloading; (t) SPI21—Number of occurrences related to ground traffic (GSE) and vehicle driving; (u) SPI22—Number of anti-collision occurrences; (v) SPI23—Number of engine start-up incidents; (w) SPI24—Number of occurrences related to wildlife; (x) SPI25—Number of occurrences related to fuel handling.


Figure A2 shows all impact diagrams of causes and effects of each organizational indicators (OIs) and safety performance indicators (SPIs) in the observed dataset, at Split Airport.
Figure A2.
Impact diagrams of causes and effects of all indicators in the observed dataset: (a) causes of OI1; (b) effects of OI1; (c) causes of OI2; (d) effects of OI2; (e) causes of SPI1; (f) effects of SPI1; (g) causes of SPI2; (h) effects of SPI2; (i) causes of SPI3; (j) effects of SPI3; (k) causes of SPI4; (l) effects of SPI4; (m) causes of SPI5; (n) effects of SPI5; (o) causes of SPI7; (p) effects of SPI7; (q) causes of SPI8; (r) effects of SPI8; (s) causes of SPI9; (t) effects of SPI9; (u) causes of SPI10; (v) effects of SPI10; (w) causes of SPI11; (x) effects of SPI11; (y) causes of SPI12; (z) effects of SPI12; (aa) causes of SPI13; (bb) effects of SPI13; (cc) causes of SPI14; (dd) effects of SPI14; (ee) causes of SPI15; (ff) effects of SPI15; (gg) causes of SPI16; (hh) effects of SPI16; (ii) causes of SPI17; (jj) effects of SPI17; (kk) causes of SPI18; (ll) effects of SPI18; (mm) causes of SPI19; (nn) effects of SPI19; (oo) causes of SPI20; (pp) effects of SPI20; (qq) causes of SPI21; (rr) effects of SPI21; (ss) causes of SPI22; (tt) effects of SPI22; (uu) causes of SPI23; (vv) effects of SPI23; (ww) causes of SPI24; (xx) effects of SPI24; (yy) causes of SPI25; (zz) effects of SPI25.


Appendix C
Figure A3 shows outlier root cause analyses conducted for each indicator (where causal links were found) in the observed dataset from January 2014 to December 2021.
Figure A3.
Outlier root cause analyses of all indicators in the observed dataset: (a) OI1; (b) SPI1; (c) SPI2; (d) SPI4; (e) SPI5; (f) SPI7; (g) SPI8; (h) SPI9; (i) SPI10; (j) SPI11; (k) SPI12; (l) SPI13; (m) SPI14; (n) SPI15; (o) SPI16; (p) SPI17; (q) SPI18; (r) SPI19; (s) SPI20; (t) SPI21; (u) SPI22; (v) SPI23; (w) SPI24; (x) SPI25.


Table A3 shows all outliers occurring at Split Airport over the observed time period, from January 2014 to December 2021.
Table A3.
Outliers and their root causes for Split Airport safety performance indicators over observed time period.
Table A3.
Outliers and their root causes for Split Airport safety performance indicators over observed time period.
| Time Point | SPIs | Outliers | Root Causes | Time Point | SPIs | Outliers | Root Causes | Time Point | SPIs | Outliers | Root Causes |
|---|---|---|---|---|---|---|---|---|---|---|---|
| April 2014 | SPI8 | 2 | Unknown | July 2016 | SPI9 | 1 | SPI7 | September 2018 | SPI17 | 1 | SPI7 |
| April 2014 | SPI10 | 4 | Unknown | August 2016 | SPI4 | 1 | SPI10 | October 2018 | SPI9 | 1 | SPI10 |
| April 2014 | SPI11 | 1 | Unknown | September 2016 | SPI11 | 1 | SPI7 | October 2018 | SPI22 | 1 | SPI23 |
| June 2014 | SPI13 | 1 | Unknown | September 2016 | SPI13 | 1 | SPI21 | February 2019 | SPI21 | 3 | Unknown |
| June 2014 | SPI17 | 1 | Unknown | September 2016 | SPI20 | 3 | SPI11 | March 2019 | SPI8 | 1 | SPI19 |
| July 2014 | SPI24 | 10 | SPI11 | September 2016 | SPI21 | 5 | SPI5 | March 2019 | SPI13 | 1 | SPI22 |
| August 2014 | SPI23 | 1 | SPI10 | September 2016 | SPI22 | 1 | SPI7 | April 2019 | SPI12 | 1 | SPI7 |
| September 2014 | SPI4 | 1 | SPI10 | September 2016 | SPI25 | 2 | SPI17 | April 2019 | SPI14 | 4 | SPI13 |
| April 2015 | SPI13 | 1 | SPI22 | January 2017 | SPI4 | 1 | OI1_OPS | June 2019 | SPI14 | 5 | SPI12 |
| May 2015 | SPI3 | 1 | SPI16 | January 2017 | SPI16 | 1 | SPI19 | July 2019 | SPI1 | 2 | SPI10 |
| May 2015 | SPI9 | 1 | SPI17 | February 2017 | SPI18 | 1 | SPI1 | July 2019 | SPI3 | 1 | SPI1 |
| May 2015 | SPI23 | 1 | SPI10 | March 2017 | SPI1 | 1 | SPI4 | July 2019 | SPI24 | 13 | SPI21 |
| June 2015 | SPI16 | 1 | SPI21 | March 2017 | SPI25 | 1 | SPI10 | October 2019 | SPI3 | 3 | SPI13 |
| June 2015 | SPI20 | 2 | Unknown | May 2017 | SPI9 | 1 | SPI23 | October 2019 | SPI10 | 2 | SPI3 |
| July 2015 | SPI1 | 1 | SPI21 | June 2017 | SPI22 | 1 | SPI20 | April 2020 | SPI8 | 1 | SPI13 |
| July 2015 | SPI3 | 1 | SPI23 | June 2017 | SPI25 | 1 | SPI7 | June 2020 | SPI18 | 1 | SPI7 |
| July 2015 | SPI4 | 1 | SPI13 | July 2017 | SPI5 | 3 | OI1_OPS | July 2020 | SPI5 | 3 | SPI1 |
| July 2015 | SPI15 | 10 | SPI13 | September 2017 | SPI25 | 1 | SPI16 | July 2020 | SPI15 | 11 | Unknown |
| August 2015 | SPI17 | 1 | SPI13 | October 2017 | SPI18 | 1 | OI2_PASS | July 2020 | SPI16 | 1 | SPI10 |
| November 2015 | SPI9 | 1 | SPI20 | October 2017 | SPI19 | 1 | OI2_PASS | July 2020 | SPI24 | 6 | SPI17 |
| December 2015 | SPI8 | 1 | SPI21 | October 2017 | SPI25 | 1 | Unknown | August 2020 | SPI1 | 1 | SPI8 |
| February 2016 | SPI9 | 1 | SPI7 | February 2018 | SPI18 | 2 | SPI19 | August 2020 | SPI12 | 1 | SPI21 |
| February 2016 | SPI21 | 3 | SPI23 | March 2018 | SPI12 | 1 | SPI23 | October 2020 | SPI25 | 1 | SPI15 |
| March 2016 | SPI1 | 1 | SPI7 | May 2018 | SPI15 | 5 | SPI13 | May 2021 | SPI14 | 2 | SPI1 |
| March 2016 | SPI7 | 1 | SPI4 | June 2018 | SPI25 | 1 | SPI15 | July 2021 | SPI2 | 1 | SPI19 |
| May 2016 | SPI3 | 1 | SPI17 | July 2018 | SPI15 | 6 | SPI21 | July 2021 | SPI8 | 2 | SPI23 |
| May 2016 | SPI5 | 2 | SPI1 | July 2018 | SPI20 | 2 | SPI23 | July 2021 | SPI16 | 2 | SPI21 |
| May 2016 | SPI7 | 1 | Unknown | July 2018 | SPI21 | 8 | SPI7 | August 2021 | SPI24 | 7 | SPI21 |
| May 2016 | SPI17 | 1 | SPI9 | August 2018 | SPI13 | 1 | SPI4 |
Appendix D
Table A4 shows the obtained forecasted values of organizational indicators in an observed dataset from Split Airport, i.e., OI1—Number of aircraft operations and OI2—Number of passengers using IBM SPSS simple exponential forecasting method with seasonal component.
Table A4.
Forecasts of organizational indicators of Split Airport.
| Time Point | OI1_Model_1 | OI2_Model_2 |
|---|---|---|
| January 2022 | 599 | 20,618 |
| February 2022 | 546 | 16,764 |
| March 2022 | 658 | 25,049 |
| April 2022 | 1138 | 73,424 |
| May 2022 | 2099 | 173,881 |
| June 2022 | 3014 | 287,188 |
| July 2022 | 4605 | 486,821 |
| August 2022 | 4651 | 487,669 |
| September 2022 | 2830 | 319,733 |
| October 2022 | 1891 | 151,833 |
| November 2022 | 678 | 25,702 |
| December 2022 | 628 | 23,428 |
| January 2023 | 599 | 20,618 |
| February 2023 | 546 | 16,764 |
| March 2023 | 658 | 25,049 |
| April 2023 | 1138 | 73,424 |
| May 2023 | 2099 | 173,881 |
| June 2023 | 3014 | 287,188 |
| July 2023 | 4605 | 486,821 |
| August 2023 | 4651 | 487,669 |
| September 2023 | 2830 | 319,733 |
| October 2023 | 1891 | 151,833 |
| November 2023 | 678 | 25,702 |
| December 2023 | 628 | 23,428 |
Table A5 shows the obtained forecasted values of organizational indicator (OI1) in an observed dataset from Split Airport, i.e., Number of aircraft operations, using IBM SPSS function Forecasting using the Temporal Causal Model.
Table A5.
Initial forecast of organizational indicator OI1 Number of aircraft operations.
| Time Point | OI1_TCM_Model_1 | Graph |
|---|---|---|
| January 2022 | 993 |  |
| February 2022 | 1687 | |
| March 2022 | 2184 | |
| April 2022 | 2519 | |
| May 2022 | 2544 | |
| June 2022 | 2399 | |
| July 2022 | 2116 | |
| August 2022 | 1869 | |
| September 2022 | 1715 | |
| October 2022 | 1666 |
Table A6 and Figure A4 show complete first initial forecast of all Split Airport safety performance indicators using IBM SPSS function Forecasting using Temporal Causal Model.
Table A6.
First initial forecast of Split Airport safety performance indicators (forecasting using temporal causal model).
Table A6.
First initial forecast of Split Airport safety performance indicators (forecasting using temporal causal model).
| Month | SPI1 | SPI2 | SPI3 | SPI4 | SPI5 | SPI7 | SPI8 | SPI9 | SPI10 | SPI11 | SPI12 | SPI13 | SPI14 | SPI15 | SPI16 | SPI17 | SPI18 | SPI19 | SPI20 | SPI21 | SPI22 | SPI23 | SPI24 | SPI25 |
|---|---|---|---|---|---|---|---|---|---|---|---|---|---|---|---|---|---|---|---|---|---|---|---|---|
| January 2022 | 0.02 | 0.00 | 0.03 | 0.01 | 0.12 | 0.00 | 0.17 | 0.02 | 0.06 | 0.00 | 0.01 | –0.02 | 0.04 | 0.63 | 0.07 | 0.01 | 0.05 | –0.07 | 0.40 | 0.05 | –0.01 | –0.08 | –0.10 | 0.03 |
| February 2022 | 0.02 | 0.01 | 0.04 | –0.05 1 | 0.18 | 0.02 | 0.08 | 0.01 | 0.01 | 0.01 | 0.03 | –0.09 | 0.05 | 0.92 | 0.07 | 0.02 | 0.07 | –0.05 | –0.14 | 0.80 | 0.00 | –0.08 | 0.70 | 0.07 |
| March 2022 | 0.02 | 0.01 | 0.04 | 0.03 | 0.29 | 0.02 | 0.11 | –0.01 | 0.04 | –0.01 | 0.04 | –0.01 | 0.03 | 1.162 | 0.12 | 0.01 | 0.07 | –0.03 | 0.35 | 1.06 | 0.00 | –0.06 | 1.19 | 0.04 |
| April 2022 | 0.00 | 0.01 | 0.06 | 0.00 | 0.24 | 0.03 | 0.10 | 0.00 | 0.00 | 0.02 | 0.05 | 0.04 | 0.08 | 1.36 | 0.13 | 0.00 | 0.04 | 0.02 | 0.53 | 1.26 | 0.01 | –0.08 | 1.31 | 0.08 |
| May 2022 | 0.05 | 0.01 | 0.07 | –0.05 | 0.31 | 0.03 | 0.06 | 0.02 | 0.06 | 0.01 | 0.04 | 0.09 | –0.01 | 1.55 | 0.12 | 0.01 | 0.00 | 0.03 | 0.30 | 1.27 | 0.02 | –0.07 | 1.26 | 0.13 |
| June 2022 | 0.03 | 0.01 | 0.07 | 0.00 | 0.28 | 0.04 | 0.09 | 0.05 | 0.07 | –0.01 | 0.02 | 0.09 | 0.13 | 1.54 | 0.09 | 0.01 | 0.03 | 0.03 | 0.29 | 1.12 | 0.02 | –0.02 | 0.97 | 0.09 |
| July 2022 | 0.04 | 0.01 | 0.04 | 0.04 | 0.28 | 0.04 | 0.11 | 0.07 | 0.12 | 0.00 | 0.02 | 0.07 | 0.12 | 1.62 | 0.07 | 0.01 | 0.03 | 0.01 | 0.42 | 0.96 | 0.02 | 0.02 | 1.04 | 0.09 |
| August 2022 | 0.03 | 0.01 | 0.09 | 0.04 | 0.25 | 0.04 | 0.13 | 0.07 | 0.13 | 0.02 | 0.03 | 0.04 | 0.21 | 1.84 | 0.05 | 0.02 | 0.06 | 0.00 | 0.36 | 0.87 | 0.03 | 0.01 | 0.82 | 0.14 |
| September 2022 | 0.05 | 0.01 | 0.08 | 0.03 | 0.28 | 0.04 | 0.12 | 0.06 | 0.12 | 0.01 | 0.03 | 0.04 | 0.23 | 2.05 | 0.05 | 0.05 | 0.06 | –0.01 | 0.26 | 0.80 | 0.03 | –0.01 | 0.73 | 0.14 |
| October 2022 | 0.05 | 0.01 | 0.09 | 0.03 | 0.27 | 0.04 | 0.13 | 0.05 | 0.11 | 0.00 | 0.04 | 0.03 | 0.27 | 2.10 | 0.06 | 0.05 | 0.06 | –0.01 | 0.27 | 0.83 | 0.03 | –0.01 | 0.79 | 0.12 |
1 Negative values are perceived as 0. 2 Bold and colored values present predicted adverse events.
Figure A4.
Forecasts of Split Airport safety performance indicators (forecasting using temporal causal model): (a) SPI1—Number of occurrences related to LIRF and loadsheet crosscheck; (b) SPI2—Number of occurrences related to wrong figures for loadsheet; (c) SPI3—Number of dangerous goods incidents; (d) SPI4—Number of aircraft damage occurrences; (e) SPI5—Number of personnel or passenger injuries; (f) SPI7—Number of training deficiencies; (g) SPI8—Number of apron maintenance incidents; (h) SPI9—Number of vehicle maintenance incidents; (i) SPI10—Number of occurrences related to maneuvering area maintenance; (j) SPI11—Number of occurrences related to communication; (k) SPI12—Number of incidents related to taxiing to/from apron; (l) SPI13—Number of aircraft marshalling occurrences; (m) SPI14—Number of occurrences related to FOD presence; (n) SPI15—Number of occurrences related to passenger handling at the gate; (o) SPI16—Number of occurrences related to passenger handling—disembarking/embarking; (p) SPI17—Number of occurrences related to personal protective equipment; (q) SPI18—Number of aircraft chocking incidents; (r) SPI19—Number of aircraft conning incidents; (s) SPI20—Number of occurrences related to baggage loading/unloading; (t) SPI21—Number of occurrences related to ground traffic (GSE) and vehicle driving; (u) SPI22—Number of anti-collision occurrences; (v) SPI23—Number of engine start-up incidents; (w) SPI24—Number of occurrences related to wildlife; (x) SPI25—Number of occurrences related to fuel handling.


Table A7, Table A8, Table A9 and Table A10 and Figure A5 show a second set of initial forecasts for Split Airport safety performance indicators (SPIs) with associated safety performance targets (SPTs) using IBM SPSS function Expert Modeler Forecasting. The first set uses ARIMA and exponential smoothing methods, while the second set uses exponential smoothing methods only. A model for safety performance indicator SPI6 could not be built because all of the values of the series are the same (constant). The forecast period is set up to 24 months.
Table A7.
Second initial forecast of Split Airport safety performance indicators (ARIMA and smoothing methods).
Table A7.
Second initial forecast of Split Airport safety performance indicators (ARIMA and smoothing methods).
| Month | SPI1 | SPI2 | SPI3 | SPI4 | SPI5 | SPI7 | SPI8 | SPI9 | SPI10 | SPI11 | SPI12 | SPI13 | SPI14 | SPI15 | SPI16 | SPI17 | SPI18 | SPI19 | SPI20 | SPI21 | SPI22 | SPI23 | SPI24 | SPI25 |
|---|---|---|---|---|---|---|---|---|---|---|---|---|---|---|---|---|---|---|---|---|---|---|---|---|
| Method | Simple Seasonal | Simple Seasonal | ARIMA (0,0,2)(1,0,0) | ARIMA (0,1,1)(0,0,0) | ARIMA (0,0,0)(0,1,0) | Simple Seasonal | ARIMA (0,0,0)(1,0,0) | Winters’ Additive | ARIMA (0,0,0)(0,0,0) | Simple Seasonal | Simple Seasonal | Winters’ Additive | Simple Seasonal | ARIMA (1,0,0)(1,0,0) | ARIMA (0,1,1)(0,0,0) | ARIMA (0,1,1)(0,0,0) | ARIMA (0,0,0)(0,0,1) | ARIMA (0,1,0)(0,0,0) | ARIMA (0,0,3)(0,0,0) | ARIMA (0,0,0)(0,0,0) | Simple Seasonal | ARIMA (0,0,0)(0,0,0) | ARIMA (0,0,0)(0,1,1) | ARIMA (0,0,0)(0,0,0) |
| January 2022 | 0 | 0 | 0 | 0 | 0 | 0 | 0 | 0 | 0 | 0 | 0 | 0 | 0 | 3 | –11 | 0 | 0 | 0 | 0 | 1 | 0 | 0 | 0 | 0 |
| February 2022 | 0 | 0 | 0 | 0 | 0 | 0 | 0 | 0 | 0 | 0 | 0 | 0 | 0 | 0 | –1 | 0 | 0 | 0 | 0 | 1 | 0 | 0 | 0 | 0 |
| March 2022 | 0 | 0 | 0 | 0 | 0 | 0 | 0 | 0 | 0 | 0 | 0 | 0 | 0 | 0 | –1 | 0 | 0 | 0 | 0 | 1 | 0 | 0 | 0 | 0 |
| April 2022 | 0 | 0 | 0 | 0 | 0 | 0 | 0 | 0 | 0 | 0 | 0 | 0 | 0 | 0 | –1 | 0 | 0 | 0 | 0 | 1 | 0 | 0 | 0 | 0 |
| May 2022 | 0 | 0 | 0 | 0 | 0 | 0 | 0 | 0 | 0 | 0 | 0 | 0 | 0 | 0 | –1 | 0 | 0 | 0 | 0 | 1 | 0 | 0 | 0 | 0 |
| June 2022 | 0 | 0 | 0 | 0 | 12 | 0 | 0 | 0 | 0 | 0 | 0 | 0 | 1 | 0 | –1 | 0 | 0 | 0 | 0 | 1 | 0 | 0 | 1 | 0 |
| July 2022 | 0 | 0 | 0 | 0 | 0 | 0 | 0 | 0 | 0 | 0 | 0 | 0 | 0 | 0 | –1 | 0 | 0 | 0 | 0 | 1 | 0 | 0 | 0 | 0 |
| August 2022 | 0 | 0 | 0 | 0 | 0 | 0 | 0 | 0 | 0 | 0 | 0 | 0 | 0 | 0 | –1 | 0 | 0 | 0 | 0 | 1 | 0 | 0 | 6 | 0 |
| September 2022 | 0 | 0 | 0 | 0 | 0 | 0 | 0 | 0 | 0 | 0 | 0 | 0 | 0 | 0 | –1 | 0 | 0 | 0 | 0 | 1 | 0 | 0 | 1 | 0 |
| October 2022 | 0 | 0 | 0 | 0 | 1 | 0 | 0 | 0 | 0 | 0 | 0 | 0 | 0 | 0 | –1 | 0 | 0 | 0 | 0 | 1 | 0 | 0 | 0 | 0 |
| November 2022 | 0 | 0 | 0 | 0 | 0 | 0 | 0 | 0 | 0 | 0 | 0 | 0 | 0 | 0 | –1 | 0 | 0 | 0 | 0 | 1 | 0 | 0 | 0 | 0 |
| December 2022 | 0 | 0 | 0 | 0 | 0 | 0 | 0 | 0 | 0 | 0 | 0 | 0 | 0 | 0 | 0 | 0 | 0 | 0 | 0 | 1 | 0 | 0 | 0 | 0 |
| January 2023 | 0 | 0 | 0 | 0 | 0 | 0 | 0 | 0 | 0 | 0 | 0 | 0 | 0 | 3 | –1 | 0 | 0 | 0 | 0 | 1 | 0 | 0 | 0 | 0 |
| February 2023 | 0 | 0 | 0 | 0 | 0 | 0 | 0 | 0 | 0 | 0 | 0 | 0 | 0 | 0 | –1 | 0 | 0 | 0 | 0 | 1 | 0 | 0 | 0 | 0 |
| March 2023 | 0 | 0 | 0 | 0 | 0 | 0 | 0 | 0 | 0 | 0 | 0 | 0 | 0 | 0 | –1 | 0 | 0 | 0 | 0 | 1 | 0 | 0 | 0 | 0 |
| April 2023 | 0 | 0 | 0 | 0 | 0 | 0 | 0 | 0 | 0 | 0 | 0 | 0 | 0 | 0 | –1 | 0 | 0 | 0 | 0 | 1 | 0 | 0 | 0 | 0 |
| May 2023 | 0 | 0 | 0 | 0 | 0 | 0 | 0 | 0 | 0 | 0 | 0 | 0 | 0 | 0 | –1 | 0 | 0 | 0 | 0 | 1 | 0 | 0 | 0 | 0 |
| June 2023 | 0 | 0 | 0 | 0 | 1 | 0 | 0 | 0 | 0 | 0 | 0 | 0 | 1 | 0 | –1 | 0 | 0 | 0 | 0 | 1 | 0 | 0 | 1 | 0 |
| July 2023 | 0 | 0 | 0 | 0 | 0 | 0 | 0 | 0 | 0 | 0 | 0 | 0 | 0 | 0 | –1 | 0 | 0 | 0 | 0 | 1 | 0 | 0 | 0 | 0 |
| August 2023 | 0 | 0 | 0 | 0 | 0 | 0 | 0 | 0 | 0 | 0 | 0 | 0 | 0 | 0 | –1 | 0 | 0 | 0 | 0 | 1 | 0 | 0 | 6 | 0 |
| September 2023 | 0 | 0 | 0 | 0 | 0 | 0 | 0 | 0 | 0 | 0 | 0 | 0 | 0 | 0 | –1 | 0 | 0 | 0 | 0 | 1 | 0 | 0 | 1 | 0 |
| October 2023 | 0 | 0 | 0 | 0 | 1 | 0 | 0 | 0 | 0 | 0 | 0 | 0 | 0 | 0 | –1 | 0 | 0 | 0 | 0 | 1 | 0 | 0 | 0 | 0 |
| November 2023 | 0 | 0 | 0 | 0 | 0 | 0 | 0 | 0 | 0 | 0 | 0 | 0 | 0 | 0 | –1 | 0 | 0 | 0 | 0 | 1 | 0 | 0 | 0 | 0 |
| December 2023 | 0 | 0 | 0 | 0 | 0 | 0 | 0 | 0 | 0 | 0 | 0 | 0 | 0 | 0 | 0 | 0 | 0 | 0 | 0 | 1 | 0 | 0 | 0 | 0 |
1 Negative values are perceived as 0. 2 Bold and colored values present predicted adverse events.
Table A8.
Associated forecast of Split Airport safety performance targets (ARIMA and smoothing methods).
Table A8.
Associated forecast of Split Airport safety performance targets (ARIMA and smoothing methods).
| Month | SPI1 | SPI2 | SPI3 | SPI4 | SPI5 | SPI7 | SPI8 | SPI9 | SPI10 | SPI11 | SPI12 | SPI13 | SPI14 | SPI15 | SPI16 | SPI17 | SPI18 | SPI19 | SPI20 | SPI21 | SPI22 | SPI23 | SPI24 | SPI25 |
|---|---|---|---|---|---|---|---|---|---|---|---|---|---|---|---|---|---|---|---|---|---|---|---|---|
| Method | ARIMA (0,0,0)(0,0,0) | Simple Seasonal | ARIMA (0,0,0)(0,0,1) | ARIMA (0,0,11)(1,0,2) | ARIMA (0,0,0)(0,0,0) | ARIMA (0,0,0)(0,0,0) | Simple Seasonal | Simple Seasonal | ARIMA (0,0,0)(1,0,0) | ARIMA (0,1,1)(0,0,0) | Simple Seasonal | Simple Seasonal | ARIMA (0,0,3)(0,0,0) | ARIMA (1,0,0)(0,0,0) | Simple Seasonal | Simple Seasonal | ARIMA (0,0,0)(0,0,0) | Simple Seasonal | ARIMA (0,0,0)(0,0,0) | ARIMA (0,0,0)(0,0,0) | Simple Seasonal | Simple Seasonal | ARIMA (0,0,0)(0,0,0) | ARIMA (0,0,0)(0,0,0) |
| January 2022 | 0.0000 | 0.0000 | 0.0000 | 0.0000 | 0.0002 | 0.0000 | –0.00061 | –0.0001 | 0.0000 | 0.0000 | 0.0000 | 0.0000 | 0.0000 | 0.0000 | 0.0002 | 0.0000 | 0.0000 | 0.0000 | 0.0003 | 0.0005 | 0.0000 | 0.0000 | 0.0004 | 0.0000 |
| February 2022 | 0.0000 | 0.0000 | 0.0000 | 0.0000 | 0.0000 | 0.0000 | –0.0006 | 0.0002 | 0.0000 | 0.0000 | 0.0000 | 0.0000 | 0.0000 | 0.0000 | 0.0000 | 0.0003 | 0.0000 | 0.0000 | 0.0000 | 0.0005 | 0.0000 | 0.0000 | 0.0004 | 0.0000 |
| March 2022 | 0.0000 | 0.0000 | 0.0000 | 0.0000 | 0.0000 | 0.0000 | –0.0005 | –0.0001 | 0.0000 | 0.0000 | 0.0001 | 0.0001 | 0.0000 | 0.0000 | 0.0000 | 0.0000 | 0.0000 | 0.0000 | 0.0000 | 0.0005 | 0.0000 | 0.0000 | 0.0004 | 0.0000 |
| April 2022 | 0.0000 | 0.0000 | 0.0000 | 0.0000 | 0.0000 | 0.0000 | 0.00742 | –0.0001 | 0.0000 | 0.0000 | 0.0001 | 0.0001 | 0.0000 | 0.0000 | 0.0000 | 0.0000 | 0.0000 | 0.0000 | 0.0000 | 0.0005 | 0.0000 | 0.0000 | 0.0004 | 0.0000 |
| May 2022 | 0.0000 | 0.0000 | 0.0000 | 0.0000 | 0.0000 | 0.0000 | –0.0005 | 0.0000 | 0.0000 | 0.0000 | 0.0000 | 0.0000 | 0.0000 | 0.0000 | 0.0000 | 0.0000 | 0.0000 | 0.0000 | 0.0000 | 0.0005 | 0.0000 | 0.0000 | 0.0004 | 0.0000 |
| June 2022 | 0.0000 | 0.0000 | 0.0000 | 0.0000 | 0.0000 | 0.0000 | –0.0005 | –0.0001 | 0.0000 | 0.0000 | 0.0000 | 0.0000 | 0.0000 | 0.0000 | 0.0000 | 0.0000 | 0.0000 | 0.0000 | 0.0000 | 0.0005 | 0.0000 | 0.0000 | 0.0004 | 0.0000 |
| July 2022 | 0.0000 | 0.0000 | 0.0000 | 0.0000 | 0.0000 | 0.0000 | –0.0006 | 0.0000 | 0.0000 | 0.0000 | 0.0000 | 0.0000 | 0.0000 | 0.0000 | 0.0001 | 0.0000 | 0.0000 | 0.0000 | 0.0000 | 0.0005 | 0.0000 | 0.0000 | 0.0004 | 0.0000 |
| August 2022 | 0.0000 | 0.0000 | 0.0000 | 0.0000 | 0.0000 | 0.0000 | –0.0005 | 0.0000 | 0.0000 | 0.0000 | 0.0000 | 0.0000 | 0.0000 | 0.0000 | 0.0001 | 0.0000 | 0.0000 | 0.0000 | 0.0000 | 0.0005 | 0.0000 | 0.0000 | 0.0004 | 0.0000 |
| September 2022 | 0.0000 | 0.0000 | 0.0000 | 0.0000 | 0.0000 | 0.0000 | –0.0005 | 0.0000 | 0.0000 | 0.0000 | 0.0000 | 0.0000 | 0.0000 | 0.0000 | 0.0000 | 0.0000 | 0.0000 | 0.0000 | 0.0000 | 0.0005 | 0.0000 | 0.0000 | 0.0004 | 0.0000 |
| October 2022 | 0.0000 | 0.0000 | 0.0000 | 0.0000 | 0.0000 | 0.0000 | –0.0004 | 0.0000 | 0.0000 | 0.0000 | 0.0000 | 0.0000 | 0.0000 | 0.0000 | 0.0000 | 0.0000 | 0.0000 | 0.0001 | 0.0000 | 0.0005 | 0.0000 | 0.0000 | 0.0004 | 0.0000 |
| November 2022 | 0.0000 | 0.0000 | 0.0000 | 0.0000 | 0.0000 | 0.0000 | –0.0006 | 0.0001 | 0.0000 | 0.0000 | 0.0000 | 0.0002 | 0.0000 | 0.0000 | 0.0000 | 0.0000 | 0.0000 | 0.0000 | 0.0000 | 0.0005 | 0.0000 | 0.0000 | 0.0004 | 0.0000 |
| December 2022 | 0.0000 | 0.0000 | 0.0000 | 0.0000 | 0.0000 | 0.0000 | –0.0004 | –0.0001 | 0.0000 | 0.0000 | 0.0000 | 0.0000 | 0.0000 | 0.0000 | 0.0000 | 0.0000 | 0.0000 | 0.0000 | 0.0000 | 0.0005 | 0.0000 | 0.0000 | 0.0004 | 0.0000 |
| January 2023 | 0.0000 | 0.0000 | 0.0000 | 0.0000 | 0.0002 | 0.0000 | –0.0006 | –0.0001 | 0.0000 | 0.0000 | 0.0000 | 0.0000 | 0.0000 | 0.0000 | 0.0002 | 0.0000 | 0.0000 | 0.0000 | 0.0003 | 0.0005 | 0.0000 | 0.0000 | 0.0004 | 0.0000 |
| February 2023 | 0.0000 | 0.0000 | 0.0000 | 0.0000 | 0.0000 | 0.0000 | –0.0006 | 0.0002 | 0.0000 | 0.0000 | 0.0000 | 0.0000 | 0.0000 | 0.0000 | 0.0000 | 0.0003 | 0.0000 | 0.0000 | 0.0000 | 0.0005 | 0.0000 | 0.0000 | 0.0004 | 0.0000 |
| March 2023 | 0.0000 | 0.0000 | 0.0000 | 0.0000 | 0.0000 | 0.0000 | –0.0005 | –0.0001 | 0.0000 | 0.0000 | 0.0001 | 0.0001 | 0.0000 | 0.0000 | 0.0000 | 0.0000 | 0.0000 | 0.0000 | 0.0000 | 0.0005 | 0.0000 | 0.0000 | 0.0004 | 0.0000 |
| April 2023 | 0.0000 | 0.0000 | 0.0000 | 0.0000 | 0.0000 | 0.0000 | 0.0074 | –0.0001 | 0.0000 | 0.0000 | 0.0001 | 0.0001 | 0.0000 | 0.0000 | 0.0000 | 0.0000 | 0.0000 | 0.0000 | 0.0000 | 0.0005 | 0.0000 | 0.0000 | 0.0004 | 0.0000 |
| May 2023 | 0.0000 | 0.0000 | 0.0000 | 0.0000 | 0.0000 | 0.0000 | –0.0005 | 0.0000 | 0.0000 | 0.0000 | 0.0000 | 0.0000 | 0.0000 | 0.0000 | 0.0000 | 0.0000 | 0.0000 | 0.0000 | 0.0000 | 0.0005 | 0.0000 | 0.0000 | 0.0004 | 0.0000 |
| June 2023 | 0.0000 | 0.0000 | 0.0000 | 0.0000 | 0.0000 | 0.0000 | –0.0005 | –0.0001 | 0.0000 | 0.0000 | 0.0000 | 0.0000 | 0.0000 | 0.0000 | 0.0000 | 0.0000 | 0.0000 | 0.0000 | 0.0000 | 0.0005 | 0.0000 | 0.0000 | 0.0004 | 0.0000 |
| July 2023 | 0.0000 | 0.0000 | 0.0000 | 0.0000 | 0.0000 | 0.0000 | –0.0006 | 0.0000 | 0.0000 | 0.0000 | 0.0000 | 0.0000 | 0.0000 | 0.0000 | 0.0001 | 0.0000 | 0.0000 | 0.0000 | 0.0000 | 0.0005 | 0.0000 | 0.0000 | 0.0004 | 0.0000 |
| August 2023 | 0.0000 | 0.0000 | 0.0000 | 0.0000 | 0.0000 | 0.0000 | –0.0005 | 0.0000 | 0.0000 | 0.0000 | 0.0000 | 0.0000 | 0.0000 | 0.0000 | 0.0001 | 0.0000 | 0.0000 | 0.0000 | 0.0000 | 0.0005 | 0.0000 | 0.0000 | 0.0004 | 0.0000 |
| September 2023 | 0.0000 | 0.0000 | 0.0000 | 0.0000 | 0.0000 | 0.0000 | –0.0005 | 0.0000 | 0.0000 | 0.0000 | 0.0000 | 0.0000 | 0.0000 | 0.0000 | 0.0000 | 0.0000 | 0.0000 | 0.0000 | 0.0000 | 0.0005 | 0.0000 | 0.0000 | 0.0004 | 0.0000 |
| October 2023 | 0.0000 | 0.0000 | 0.0000 | 0.0000 | 0.0000 | 0.0000 | –0.0004 | 0.0000 | 0.0000 | 0.0000 | 0.0000 | 0.0000 | 0.0000 | 0.0000 | 0.0000 | 0.0000 | 0.0000 | 0.0001 | 0.0000 | 0.0005 | 0.0000 | 0.0000 | 0.0004 | 0.0000 |
| November 2023 | 0.0000 | 0.0000 | 0.0000 | 0.0000 | 0.0000 | 0.0000 | –0.0006 | 0.0001 | 0.0000 | 0.0000 | 0.0000 | 0.0002 | 0.0000 | 0.0000 | 0.0000 | 0.0000 | 0.0000 | 0.0000 | 0.0000 | 0.0005 | 0.0000 | 0.0000 | 0.0004 | 0.0000 |
| December 2023 | 0.0000 | 0.0000 | 0.0000 | 0.0000 | 0.0000 | 0.0000 | –0.0004 | –0.0001 | 0.0000 | 0.0000 | 0.0000 | 0.0000 | 0.0000 | 0.0000 | 0.0000 | 0.0000 | 0.0000 | 0.0000 | 0.0000 | 0.0005 | 0.0000 | 0.0000 | 0.0004 | 0.0000 |
1 Negative values are perceived as 0. 2 Bold and colored values present predicted breaches of safety performance targets.
Table A9.
Second initial forecast of Split Airport safety performance indicators (smoothing methods only).
Table A9.
Second initial forecast of Split Airport safety performance indicators (smoothing methods only).
| Month | SPI1 | SPI2 | SPI3 | SPI4 | SPI5 | SPI7 | SPI8 | SPI9 | SPI10 | SPI11 | SPI12 | SPI13 | SPI14 | SPI15 | SPI16 | SPI17 | SPI18 | SPI19 | SPI20 | SPI21 | SPI22 | SPI23 | SPI24 | SPI25 |
|---|---|---|---|---|---|---|---|---|---|---|---|---|---|---|---|---|---|---|---|---|---|---|---|---|
| Method | Simple Seasonal | Simple Seasonal | Simple Seasonal | Winters’ Additive | Winters’ Additive | Simple Seasonal | Winters’ Additive | Winters’ Additive | Winters’ Additive | Simple Seasonal | Simple Seasonal | Winters’ Additive | Simple Seasonal | Simple Seasonal | Simple Seasonal | Winters’ Additive | Simple Seasonal | Simple Seasonal | Simple Seasonal | Simple Seasonal | Simple Seasonal | Simple Seasonal | Simple Seasonal | Simple Seasonal |
| January 2022 | 0 | 0 | 0 | 0 | 0 | 0 | 0 | 0 | 0 | 0 | 0 | 0 | 0 | 0 | 0 | 0 | 0 | 0 | 0 | 0 | 0 | 0 | 0 | 0 |
| February 2022 | 0 | 0 | 0 | 0 | 0 | 0 | 0 | 0 | 0 | 0 | 0 | 0 | 0 | 0 | 0 | 0 | 0 | 0 | 0 | 0 | 0 | 0 | 0 | 0 |
| March 2022 | 0 | 0 | 0 | 0 | 0 | 0 | 0 | 0 | 0 | 0 | 0 | 0 | 0 | 0 | 0 | 0 | 0 | 0 | 0 | 0 | 0 | 0 | 0 | 0 |
| April 2022 | 0 | 0 | 0 | 0 | 0 | 0 | 0 | 0 | 0 | 0 | 0 | 0 | 0 | 0 | 0 | 0 | 0 | 0 | 0 | 0 | 0 | 0 | 1 | 0 |
| May 2022 | 0 | 0 | 0 | 0 | 0 | 0 | 0 | 0 | 0 | 0 | 0 | 0 | 0 | 2 | 0 | 0 | 0 | 0 | 0 | 0 | 0 | 0 | 1 | 0 |
| June 2022 | 0 | 0 | 0 | 0 | 0 | 0 | 0 | 0 | 0 | 0 | 0 | 0 | 1 | 3 | 0 | 0 | 0 | 0 | 1 | 2 | 0 | 0 | 1 | 0 |
| July 2022 | 0 | 0 | 0 | 0 | 1 1 | 0 | 0 | 0 | 0 | 0 | 0 | 0 | 0 | 7 | 0 | 0 | 0 | 0 | 0 | 2 | 0 | 0 | 4 | 0 |
| August 2022 | 0 | 0 | 0 | 0 | 0 | 0 | 0 | 0 | 0 | 0 | 0 | 0 | 0 | 5 | 0 | 0 | 0 | 0 | 1 | 1 | 0 | 0 | 3 | 0 |
| September 2022 | 0 | 0 | 0 | 0 | 0 | 0 | 0 | 0 | 0 | 0 | 0 | 0 | 0 | 2 | 0 | 0 | 0 | 0 | 1 | 1 | 0 | 0 | 2 | 0 |
| October 2022 | 0 | 0 | 0 | 0 | 0 | 0 | 0 | 0 | 0 | 0 | 0 | 0 | 0 | 1 | 0 | 0 | 0 | 0 | 0 | 0 | 0 | 0 | 0 | 0 |
| November 2022 | 0 | 0 | 0 | 0 | 0 | 0 | 0 | 0 | 0 | 0 | 0 | 0 | 0 | 0 | 0 | 0 | 0 | 0 | 0 | 0 | 0 | 0 | 0 | 0 |
| December 2022 | 0 | 0 | 0 | 0 | 0 | 0 | 0 | 0 | 0 | 0 | 0 | 0 | 0 | 0 | 0 | 0 | 0 | 0 | 0 | 0 | 0 | 0 | 0 | 0 |
| January 2023 | 0 | 0 | 0 | 0 | 0 | 0 | 0 | 0 | 0 | 0 | 0 | 0 | 0 | 0 | 0 | 0 | 0 | 0 | 0 | 0 | 0 | 0 | 0 | 0 |
| February 2023 | 0 | 0 | 0 | 0 | 0 | 0 | 0 | 0 | 0 | 0 | 0 | 0 | 0 | 0 | 0 | 0 | 0 | 0 | 0 | 0 | 0 | 0 | 0 | 0 |
| March 2023 | 0 | 0 | 0 | 0 | 0 | 0 | 0 | 0 | 0 | 0 | 0 | 0 | 0 | 0 | 0 | 0 | 0 | 0 | 0 | 0 | 0 | 0 | 0 | 0 |
| April 2023 | 0 | 0 | 0 | 0 | 0 | 0 | 0 | 0 | 0 | 0 | 0 | 0 | 0 | 0 | 0 | 0 | 0 | 0 | 0 | 0 | 0 | 0 | 1 | 0 |
| May 2023 | 0 | 0 | 0 | 0 | 0 | 0 | 0 | 0 | 0 | 0 | 0 | 0 | 0 | 2 | 0 | 0 | 0 | 0 | 0 | 0 | 0 | 0 | 1 | 0 |
| June 2023 | 0 | 0 | 0 | 0 | 0 | 0 | 0 | 0 | 0 | 0 | 0 | 0 | 1 | 3 | 0 | 0 | 0 | 0 | 1 | 2 | 0 | 0 | 1 | 0 |
| July 2023 | 0 | 0 | 0 | 0 | 1 | 0 | 0 | 0 | 0 | 0 | 0 | 0 | 0 | 7 | 0 | 0 | 0 | 0 | 0 | 2 | 0 | 0 | 4 | 0 |
| August 2023 | 0 | 0 | 0 | 0 | 0 | 0 | 0 | 0 | 0 | 0 | 0 | 0 | 0 | 5 | 0 | 0 | 0 | 0 | 1 | 1 | 0 | 0 | 3 | 0 |
| September 2023 | 0 | 0 | 0 | 0 | 0 | 0 | 0 | 0 | 0 | 0 | 0 | 0 | 0 | 2 | 0 | 0 | 0 | 0 | 1 | 1 | 0 | 0 | 2 | 0 |
| October 2023 | 0 | 0 | 0 | 0 | 0 | 0 | 0 | 0 | 0 | 0 | 0 | 0 | 0 | 1 | 0 | 0 | 0 | 0 | 0 | 0 | 0 | 0 | 0 | 0 |
| November 2023 | 0 | 0 | 0 | 0 | 0 | 0 | 0 | 0 | 0 | 0 | 0 | 0 | 0 | 0 | 0 | 0 | 0 | 0 | 0 | 0 | 0 | 0 | 0 | 0 |
| December 2023 | 0 | 0 | 0 | 0 | 0 | 0 | 0 | 0 | 0 | 0 | 0 | 0 | 0 | 0 | 0 | 0 | 0 | 0 | 0 | 0 | 0 | 0 | 0 | 0 |
1 Bold and colored values present predicted adverse events.
Table A10.
Associated forecast of Split Airport safety performance targets (smoothing methods only).
Table A10.
Associated forecast of Split Airport safety performance targets (smoothing methods only).
| Month | SPI1 | SPI2 | SPI3 | SPI4 | SPI5 | SPI7 | SPI8 | SPI9 | SPI10 | SPI11 | SPI12 | SPI13 | SPI14 | SPI15 | SPI16 | SPI17 | SPI18 | SPI19 | SPI20 | SPI21 | SPI22 | SPI23 | SPI24 | SPI25 |
|---|---|---|---|---|---|---|---|---|---|---|---|---|---|---|---|---|---|---|---|---|---|---|---|---|
| Method | Simple Seasonal | Simple Seasonal | Simple Seasonal | Simple Seasonal | Winters’ Additive | Simple Seasonal | Simple Seasonal | Simple Seasonal | Winters’ Additive | Simple Seasonal | Simple Seasonal | Simple Seasonal | Simple Seasonal | Simple Seasonal | Simple Seasonal | Simple Seasonal | Simple Seasonal | Simple Seasonal | Simple Seasonal | Winters’ Additive | Simple Seasonal | Simple Seasonal | Simple Seasonal | Simple Seasonal |
| January 2022 | 0.0000 | 0.0000 | 0.0000 | 0.0002 | 0.0000 | 0.0000 | −0.0006 | −0.0001 | 0.0005 | 0.0000 | 0.0000 | 0.0000 | −0.0001 | −0.0006 | 0.0002 | 0.0000 | −0.0001 | 0.0000 | 0.0003 | 0.0005 | 0.0000 | 0.0000 | −0.0003 | −0.0001 |
| February 2022 | 0.0000 | 0.0000 | 0.0000 | 0.0000 | 0.0000 | 0.0000 | −0.0006 | 0.0002 | 0.0001 | 0.0000 | 0.0000 | 0.0000 | 0.0002 | −0.0006 | 0.0000 | 0.0003 | 0.0007 | 0.0000 | 0.0007 | 0.0015 | 0.0000 | 0.0000 | 0.0005 | 0.0002 |
| March 2022 | 0.00042 | 0.0000 | 0.0000 | 0.0000 | 0.0002 | 0.0002 | −0.0005 | −0.0001 | 0.0000 | 0.0000 | 0.0001 | 0.0001 | 0.0004 | −0.0004 | 0.0000 | 0.0000 | −0.0001 | 0.0000 | 0.0006 | 0.0002 | 0.0000 | 0.0000 | 0.0002 | 0.0001 |
| April 2022 | 0.0000 | 0.0000 | 0.0000 | 0.0000 | 0.0000 | 0.0000 | 0.0074 | −0.0001 | 0.0003 | 0.0001 | 0.0001 | 0.0001 | 0.0002 | −0.0001 | 0.0000 | 0.0000 | −0.0001 | 0.0000 | 0.0004 | 0.0001 | 0.0000 | 0.0000 | 0.0003 | −0.0001 |
| May 2022 | 0.0000 | 0.0000 | 0.0001 | 0.0000 | 0.0001 | 0.0000 | −0.0005 | 0.0000 | −0.0002 | 0.0000 | 0.0000 | 0.0000 | 0.0003 | 0.0001 | 0.0000 | 0.0000 | −0.0001 | 0.0000 | 0.0004 | 0.0001 | 0.0000 | 0.0000 | 0.0001 | −0.0001 |
| June 2022 | 0.0000 | 0.0000 | 0.0000 | 0.0000 | 0.0001 | 0.0000 | −0.0005 | −0.0001 | −0.0002 | 0.0000 | 0.0000 | 0.0000 | 0.0001 | 0.0007 | 0.0000 | 0.0000 | 0.0001 | 0.0000 | 0.0006 | 0.0004 | 0.0000 | 0.0000 | 0.0001 | 0.0000 |
| July 2022 | 0.0000 | 0.0000 | 0.0001 | 0.0000 | 0.0003 | 0.0000 | −0.0006 | 0.0000 | −0.0002 | 0.0000 | 0.0000 | 0.0000 | 0.0000 | 0.0010 | 0.0001 | 0.0000 | −0.0001 | 0.0000 | 0.0004 | 0.0000 | 0.0000 | 0.0000 | 0.0008 | 0.0000 |
| August 2022 | 0.0000 | 0.0000 | 0.0000 | 0.0000 | 0.0000 | 0.0000 | −0.0005 | 0.0000 | −0.0001 | 0.0000 | 0.0000 | 0.0000 | 0.0000 | 0.0005 | 0.0001 | 0.0000 | −0.0001 | 0.0000 | 0.0005 | 0.0000 | 0.0000 | 0.0000 | 0.0003 | 0.0000 |
| September 2022 | 0.0000 | 0.0000 | 0.0000 | 0.0000 | 0.0000 | 0.0000 | −0.0005 | 0.0000 | −0.0002 | 0.0000 | 0.0000 | 0.0000 | 0.0000 | 0.0006 | 0.0000 | 0.0000 | −0.0001 | 0.0000 | 0.0006 | 0.0000 | 0.0000 | 0.0000 | 0.0015 | 0.0003 |
| October 2022 | 0.0000 | 0.0000 | 0.0001 | 0.0000 | 0.0001 | 0.0000 | −0.0004 | 0.0000 | −0.0001 | 0.0000 | 0.0000 | 0.0000 | 0.0000 | 0.0002 | 0.0000 | 0.0000 | 0.0000 | 0.0001 | 0.0005 | 0.0001 | 0.0000 | 0.0000 | 0.0002 | 0.0002 |
| November 2022 | 0.0000 | 0.0000 | 0.0005 | 0.0000 | 0.0000 | 0.0000 | −0.0006 | 0.0001 | 0.0000 | 0.0000 | 0.0000 | 0.0002 | 0.0003 | −0.0003 | 0.0000 | 0.0000 | −0.0001 | 0.0000 | 0.0005 | −0.0002 | 0.0000 | 0.0000 | −0.0001 | −0.0001 |
| December 2022 | 0.0000 | 0.0000 | 0.0000 | 0.0000 | 0.0000 | 0.0000 | −0.0004 | −0.0001 | −0.0002 | 0.0000 | 0.0000 | 0.0000 | 0.0006 | −0.0002 | 0.0000 | 0.0000 | −0.0001 | 0.0000 | 0.0005 | −0.0002 | 0.0000 | 0.0000 | −0.0003 | −0.0001 |
| January 2023 | 0.0000 | 0.0000 | 0.0000 | 0.0002 | −0.00011 | 0.0000 | −0.0006 | −0.0001 | 0.0005 | 0.0000 | 0.0000 | 0.0000 | −0.0001 | −0.0006 | 0.0002 | 0.0000 | −0.0001 | 0.0000 | 0.0003 | 0.0005 | 0.0000 | 0.0000 | −0.0003 | −0.0001 |
| February 2023 | 0.0000 | 0.0000 | 0.0000 | 0.0000 | −0.0001 | 0.0000 | −0.0006 | 0.0002 | 0.0000 | 0.0000 | 0.0000 | 0.0000 | 0.0002 | −0.0006 | 0.0000 | 0.0003 | 0.0007 | 0.0000 | 0.0007 | 0.0014 | 0.0000 | 0.0000 | 0.0005 | 0.0002 |
| March 2023 | 0.0004 | 0.0000 | 0.0000 | 0.0000 | 0.0001 | 0.0002 | −0.0005 | −0.0001 | 0.0000 | 0.0000 | 0.0001 | 0.0001 | 0.0004 | −0.0004 | 0.0000 | 0.0000 | −0.0001 | 0.0000 | 0.0006 | 0.0001 | 0.0000 | 0.0000 | 0.0002 | 0.0001 |
| April 2023 | 0.0000 | 0.0000 | 0.0000 | 0.0000 | −0.0001 | 0.0000 | 0.0074 | −0.0001 | 0.0003 | 0.0001 | 0.0001 | 0.0001 | 0.0002 | −0.0001 | 0.0000 | 0.0000 | −0.0001 | 0.0000 | 0.0004 | 0.0000 | 0.0000 | 0.0000 | 0.0003 | −0.0001 |
| May 2023 | 0.0000 | 0.0000 | 0.0001 | 0.0000 | 0.0001 | 0.0000 | −0.0005 | 0.0000 | −0.0002 | 0.0000 | 0.0000 | 0.0000 | 0.0003 | 0.0001 | 0.0000 | 0.0000 | −0.0001 | 0.0000 | 0.0004 | 0.0000 | 0.0000 | 0.0000 | 0.0001 | −0.0001 |
| June 2023 | 0.0000 | 0.0000 | 0.0000 | 0.0000 | 0.0001 | 0.0000 | −0.0005 | −0.0001 | −0.0002 | 0.0000 | 0.0000 | 0.0000 | 0.0001 | 0.0007 | 0.0000 | 0.0000 | 0.0001 | 0.0000 | 0.0006 | 0.0003 | 0.0000 | 0.0000 | 0.0001 | 0.0000 |
| July 2023 | 0.0000 | 0.0000 | 0.0001 | 0.0000 | 0.0003 | 0.0000 | −0.0006 | 0.0000 | −0.0002 | 0.0000 | 0.0000 | 0.0000 | 0.0000 | 0.0010 | 0.0001 | 0.0000 | −0.0001 | 0.0000 | 0.0004 | 0.0000 | 0.0000 | 0.0000 | 0.0008 | 0.0000 |
| August 2023 | 0.0000 | 0.0000 | 0.0000 | 0.0000 | 0.0000 | 0.0000 | −0.0005 | 0.0000 | −0.0001 | 0.0000 | 0.0000 | 0.0000 | 0.0000 | 0.0005 | 0.0001 | 0.0000 | −0.0001 | 0.0000 | 0.0005 | −0.0001 | 0.0000 | 0.0000 | 0.0003 | 0.0000 |
| September 2023 | 0.0000 | 0.0000 | 0.0000 | 0.0000 | 0.0000 | 0.0000 | −0.0005 | 0.0000 | −0.0002 | 0.0000 | 0.0000 | 0.0000 | 0.0000 | 0.0006 | 0.0000 | 0.0000 | −0.0001 | 0.0000 | 0.0006 | −0.0001 | 0.0000 | 0.0000 | 0.0015 | 0.0003 |
| October 2023 | 0.0000 | 0.0000 | 0.0001 | 0.0000 | 0.0001 | 0.0000 | −0.0004 | 0.0000 | −0.0001 | 0.0000 | 0.0000 | 0.0000 | 0.0000 | 0.0002 | 0.0000 | 0.0000 | 0.0000 | 0.0001 | 0.0005 | 0.0000 | 0.0000 | 0.0000 | 0.0002 | 0.0002 |
| November 2023 | 0.0000 | 0.0000 | 0.0005 | 0.0000 | −0.0001 | 0.0000 | −0.0006 | 0.0001 | 0.0000 | 0.0000 | 0.0000 | 0.0002 | 0.0003 | −0.0003 | 0.0000 | 0.0000 | −0.0001 | 0.0000 | 0.0005 | −0.0003 | 0.0000 | 0.0000 | −0.0001 | −0.0001 |
| December 2023 | 0.0000 | 0.0000 | 0.0000 | 0.0000 | −0.0001 | 0.0000 | −0.0004 | −0.0001 | −0.0002 | 0.0000 | 0.0000 | 0.0000 | 0.0006 | −0.0002 | 0.0000 | 0.0000 | −0.0001 | 0.0000 | 0.0005 | −0.0003 | 0.0000 | 0.0000 | −0.0003 | −0.0001 |
1 Negative values are perceived as 0. 2 Bold and colored values present predicted breaches of safety performance targets.
Figure A5.
Forecasts of Split Airport safety performance indicators and associated targets (ARIMA and smoothing methods/smoothing methods only): (a) SPIs—ARIMA and smoothing methods; (b) SPTs—ARIMA and smoothing methods; (c) SPIs—smoothing methods only; (d) SPTs—smoothing methods only.
Figure A5.
Forecasts of Split Airport safety performance indicators and associated targets (ARIMA and smoothing methods/smoothing methods only): (a) SPIs—ARIMA and smoothing methods; (b) SPTs—ARIMA and smoothing methods; (c) SPIs—smoothing methods only; (d) SPTs—smoothing methods only.


Appendix E
- Scenario 1
Table A11 shows original values of OI1 and increased values of OI1 for 30%, as well the graph.
Table A11.
Increase of organizational indicator OI1—Number of aircraft operations.
| Time Point | OI1_OPS Initial | OI1_OPS Increased for 30% | Graph |
|---|---|---|---|
| January 2022 | 314 | 408 |  |
| February 2022 | 274 | 356 | |
| March 2022 | 358 | 465 | |
| April 2022 | 587 | 763 | |
| May 2022 | 883 | 1148 | |
| June 2022 | 2051 | 2666 | |
| July 2022 | 4084 | 5309 | |
| August 2022 | 4728 | 6146 | |
| September 2022 | 3435 | 4466 | |
| October 2022 | 2090 | 2717 | |
| November 2022 | 613 | 797 | |
| December 2022 | 615 | 800 |
Figure A6 shows an impact diagram of increased organizational indicator OI1 on other safety performance indicators.
Figure A6.
Impact diagram of increased organizational indicator OI1 on safety performance indicators.
Figure A6.
Impact diagram of increased organizational indicator OI1 on safety performance indicators.

Figure A7 shows a complete set of all cases in Scenario 1 set-up, showing how increased organizational indicator OI1 influences other safety performance indicators in the observed dataset, i.e., changing their behavior (increase, decrease, no impact), using IBM SPSS function Forecasting using Temporal Causal Model—Run Scenarios. All graphs show three curves. The blue curve shows observed values of (each) safety performance indicator in the dataset. The green curve shows original forecasted values of (each) safety performance indicator. The pink curve shows scenario forecasted values of (each) safety performance indicator due to the influence of a change in organizational indicator. Comparison of green and pink curves shows direct influences between indicators and can be very useful in planning and decision-making processes.
Figure A7.
Predicted safety performance indicators due to increased organizational indicator OI1: (a) SPI1—Number of occurrences related to LIRF and loadsheet crosscheck; (b) SPI2—Number of occurrences related to wrong figures for loadsheet; (c) SPI3—Number of dangerous goods incidents; (d) SPI4—Number of aircraft damage occurrences; (e) SPI5—Number of personnel or passenger injuries; (f) SPI7—Number of training deficiencies; (g) SPI8—Number of apron maintenance incidents; (h) SPI9—Number of vehicle maintenance incidents; (i) SPI10—Number of occurrences related to maneuvering area maintenance; (j) SPI11—Number of occurrences related to communication; (k) SPI12—Number of incidents related to taxiing to/from apron; (l) SPI13—Number of aircraft marshalling occurrences; (m) SPI14—Number of occurrences related to FOD presence; (n) SPI15—Number of occurrences related to passenger handling at the gate; (o) SPI16—Number of occurrences related to passenger handling—disembarking/embarking; (p) SPI17—Number of occurrences related to personal protective equipment; (q) SPI18—Number of aircraft chocking incidents; (r) SPI19—Number of aircraft conning incidents; (s) SPI20—Number of occurrences related to baggage loading/unloading; (t) SPI21—Number of occurrences related to ground traffic (GSE) and vehicle driving; (u) SPI22—Number of anti-collision occurrences; (v) SPI23—Number of engine start-up incidents; (w) SPI24—Number of occurrences related to wildlife; (x) SPI25—Number of occurrences related to fuel handling.


- Scenario 2
Table A12 shows original values of OI1 and decreased values of OI1 for 30%, as well the graph.
Table A12.
Decrease of organizational indicator OI1—Number of aircraft operations.
| Time Point | OI1_OPS Initial | OI1_OPS Decreased for 30% | Graph |
|---|---|---|---|
| January 2022 | 314 | 220 |  |
| February 2022 | 274 | 192 | |
| March 2022 | 358 | 251 | |
| April 2022 | 587 | 411 | |
| May 2022 | 883 | 618 | |
| June 2022 | 2051 | 1436 | |
| July 2022 | 4084 | 2859 | |
| August 2022 | 4728 | 3310 | |
| September 2022 | 3435 | 2405 | |
| October 2022 | 2090 | 1463 | |
| November 2022 | 613 | 429 | |
| December 2022 | 615 | 431 |
Figure A8 shows impact diagram of decreased organizational indicator OI1 on other safety performance indicators.
Figure A8.
Impact diagram of decreased organizational indicator OI1 on safety performance indicators.
Figure A8.
Impact diagram of decreased organizational indicator OI1 on safety performance indicators.

Figure A9 shows a complete set of all cases in Scenario 2 set-up, showing how the decreased organizational indicator OI1 influences other safety performance indicators in the observed dataset, i.e., changing their behavior (increase, decrease, no impact), using IBM SPSS function Forecasting using Temporal Causal Model–Run Scenarios. All graphs show three curves. The blue curve shows observed values of (each) safety performance indicator in the dataset. The green curve shows original forecasted values of (each) safety performance indicator. The pink curve shows scenario forecasted values of (each) safety performance indicator due to the influence of a change in organizational indicator.
Figure A9.
Predicted safety performance indicators due to decreased organizational indicator OI1: (a) SPI1—Number of occurrences related to LIRF and loadsheet crosscheck; (b) SPI2—Number of occurrences related to wrong figures for loadsheet; (c) SPI3—Number of dangerous goods incidents; (d) SPI4—Number of aircraft damage occurrences; (e) SPI5—Number of personnel or passenger injuries; (f) SPI7—Number of training deficiencies; (g) SPI8—Number of apron maintenance incidents; (h) SPI9—Number of vehicle maintenance incidents; (i) SPI10—Number of occurrences related to maneuvering area maintenance; (j) SPI11—Number of occurrences related to communication; (k) SPI12—Number of incidents related to taxiing to/from apron; (l) SPI13—Number of aircraft marshalling occurrences; (m) SPI14—Number of occurrences related to FOD presence; (n) SPI15—Number of occurrences related to passenger handling at the gate; (o) SPI16—Number of occurrences related to passenger handling—disembarking/embarking; (p) SPI17—Number of occurrences related to personal protective equipment; (q) SPI18—Number of aircraft chocking incidents; (r) SPI19—Number of aircraft conning incidents; (s) SPI20—Number of occurrences related to baggage loading/unloading; (t) SPI21—Number of occurrences related to ground traffic (GSE) and vehicle driving; (u) SPI22—Number of anti-collision occurrences; (v) SPI23—Number of engine start-up incidents; (w) SPI24—Number of occurrences related to wildlife; (x) SPI25—Number of occurrences related to fuel handling.


- Scenario 3
Table A13 shows original values of OI2 and increased values of OI2 for 30%, as well the graph.
Table A13.
Increase of organizational indicator OI2—Number of passengers.
| Time Point | OI2_PASS Initial | OI2_PASS Increased for 30% | Graph |
|---|---|---|---|
| January 2022 | 7415 | 9640 |  |
| February 2022 | 5706 | 7418 | |
| March 2022 | 8031 | 10,440 | |
| April 2022 | 13,964 | 18,153 | |
| May 2022 | 32,754 | 42,580 | |
| June 2022 | 114,687 | 149,093 | |
| July 2022 | 349,042 | 453,755 | |
| August 2022 | 491,358 | 638,765 | |
| September 2022 | 326,347 | 424,251 | |
| October 2022 | 160,720 | 208,936 | |
| November 2022 | 25,726 | 33,444 | |
| December 2022 | 23,428 | 30,456 |
Figure A10 shows an impact diagram for increased organizational indicator OI2 on other safety performance indicators.
Figure A10.
Impact diagram of increased organizational indicator OI2 on safety performance indicators.
Figure A10.
Impact diagram of increased organizational indicator OI2 on safety performance indicators.

Figure A11 shows complete set of all cases in Scenario 3 set-up, showing how increased organizational indicator OI2 influences other safety performance indicators in the observed dataset, i.e., changing their behavior (increase, decrease, no impact), using IBM SPSS function Forecasting using Temporal Causal Model–Run Scenarios. All graphs show three curves. The blue curve shows observed values of (each) safety performance indicator in the dataset. The green curve shows original forecasted values of (each) safety performance indicator. The pink curve shows scenario forecasted values of (each) safety performance indicator due to the influence of a change in organizational indicator.
Figure A11.
Predicted safety performance indicators due to increased organizational indicator OI2: (a) SPI1—Number of occurrences related to LIRF and loadsheet crosscheck; (b) SPI2—Number of occurrences related to wrong figures for loadsheet; (c) SPI3—Number of dangerous goods incidents; (d) SPI4—Number of aircraft damage occurrences; (e) SPI5—Number of personnel or passenger injuries; (f) SPI7—Number of training deficiencies; (g) SPI8—Number of apron maintenance incidents; (h) SPI9—Number of vehicle maintenance incidents; (i) SPI10—Number of occurrences related to maneuvering area maintenance; (j) SPI11—Number of occurrences related to communication; (k) SPI12—Number of incidents related to taxiing to/from apron; (l) SPI13—Number of aircraft marshalling occurrences; (m) SPI14—Number of occurrences related to FOD presence; (n) SPI15—Number of occurrences related to passenger handling at the gate; (o) SPI16—Number of occurrences related to passenger handling—disembarking/embarking; (p) SPI17—Number of occurrences related to personal protective equipment; (q) SPI18—Number of aircraft chocking incidents; (r) SPI19—Number of aircraft conning incidents; (s) SPI20—Number of occurrences related to baggage loading/unloading; (t) SPI21—Number of occurrences related to ground traffic (GSE) and vehicle driving; (u) SPI22—Number of anti-collision occurrences; (v) SPI23—Number of engine start-up incidents; (w) SPI24—Number of occurrences related to wildlife; (x) SPI25—Number of occurrences related to fuel handling.


- Scenario 4
Table A14 shows original values of OI2 and decreased values of OI2 for 30%, as well the graph.
Table A14.
Decrease of organizational indicator OI2—Number of passengers.
| Time Point | OI2_PASS Initial | OI2_PASS Decreased for 30% | Graph |
|---|---|---|---|
| January 2022 | 7415 | 5191 |  |
| February 2022 | 5706 | 3994 | |
| March 2022 | 8031 | 5622 | |
| April 2022 | 13,964 | 9775 | |
| May 2022 | 32,754 | 22,928 | |
| June 2022 | 114,687 | 80,281 | |
| July 2022 | 349,042 | 244,329 | |
| August 2022 | 491,358 | 343,951 | |
| September 2022 | 326,347 | 228,443 | |
| October 2022 | 160,720 | 112,504 | |
| November 2022 | 25,726 | 18,008 | |
| December 2022 | 23,428 | 16,400 |
Figure A12 shows impact diagram of decreased organizational indicator OI2 on other safety performance indicators.
Figure A12.
Impact diagram of decreased organizational indicator OI2 on safety performance indicators.
Figure A12.
Impact diagram of decreased organizational indicator OI2 on safety performance indicators.

Figure A13 shows a complete set of all cases in Scenario 4 set-up, showing how a decreased organizational indicator OI2 influences other safety performance indicators in the observed dataset, i.e., changing their behavior (increase, decrease, no impact), using IBM SPSS function Forecasting using Temporal Causal Model–Run Scenarios. All graphs show three curves. The blue curve shows observed values of (each) safety performance indicator in the dataset. The green curve shows original forecasted values of (each) safety performance indicator. The pink curve shows scenario forecasted values of (each) safety performance indicator due to the influence of a change in organizational indicator.
Figure A13.
Predicted safety performance indicators due to decreased organizational indicator OI2: (a) SPI1—Number of occurrences related to LIRF and loadsheet crosscheck; (b) SPI2—Number of occurrences related to wrong figures for loadsheet; (c) SPI3—Number of dangerous goods incidents; (d) SPI4—Number of aircraft damage occurrences; (e) SPI5—Number of personnel or passenger injuries; (f) SPI7—Number of training deficiencies; (g) SPI8—Number of apron maintenance incidents; (h) SPI9—Number of vehicle maintenance incidents; (i) SPI10—Number of occurrences related to maneuvering area maintenance; (j) SPI11—Number of occurrences related to communication; (k) SPI12—Number of incidents related to taxiing to/from apron; (l) SPI13—Number of aircraft marshalling occurrences; (m) SPI14—Number of occurrences related to FOD presence; (n) SPI15—Number of occurrences related to passenger handling at the gate; (o) SPI16—Number of occurrences related to passenger handling—disembarking/embarking; (p) SPI17—Number of occurrences related to personal protective equipment; (q) SPI18—Number of aircraft chocking incidents; (r) SPI19—Number of aircraft conning incidents; (s) SPI20—Number of occurrences related to baggage loading/unloading; (t) SPI21—Number of occurrences related to ground traffic (GSE) and vehicle driving; (u) SPI22—Number of anti-collision occurrences; (v) SPI23—Number of engine start-up incidents; (w) SPI24—Number of occurrences related to wildlife; (x) SPI25—Number of occurrences related to fuel handling.


Appendix F
Table A15 shows a dataset of all observed (black) and predicted (colored) values of organizational and safety performance indicators at Split Airport, obtained by using predictive safety management methodology in aviation, i.e., predictive analysis of airport safety performance.
Table A15.
Dataset of observed and predicted organizational and safety performance indicators at Split Airport.
Table A15.
Dataset of observed and predicted organizational and safety performance indicators at Split Airport.
| Month | OI1 | OI2 | SPI1 | SPI2 | SPI3 | SPI4 | SPI5 | SPI6 | SPI7 | SPI8 | SPI9 | SPI10 | SPI11 | SPI12 | SPI13 | SPI14 | SPI15 | SPI16 | SPI17 | SPI18 | SPI19 | SPI20 | SPI21 | SPI22 | SPI23 | SPI24 | SPI25 |
|---|---|---|---|---|---|---|---|---|---|---|---|---|---|---|---|---|---|---|---|---|---|---|---|---|---|---|---|
| January 2014 | 438 | 24,900 | 0 | 0 | 0 | 0 | 0 | 0 | 0 | 0 | 0 | 0 | 0 | 0 | 0 | 0 | 0 | 0 | 0 | 0 | 0 | 0 | 1 | 0 | 0 | 0 | 0 |
| February 2014 | 392 | 20,825 | 0 | 0 | 0 | 0 | 0 | 0 | 0 | 0 | 0 | 0 | 0 | 0 | 0 | 0 | 0 | 0 | 1 | 0 | 0 | 1 | 0 | 0 | 0 | 0 | 0 |
| March 2014 | 514 | 26,410 | 0 | 0 | 0 | 0 | 0 | 0 | 0 | 0 | 0 | 0 | 0 | 0 | 0 | 1 | 0 | 0 | 0 | 0 | 0 | 1 | 1 | 0 | 0 | 1 | 0 |
| April 2014 | 1032 | 77,575 | 0 | 0 | 0 | 0 | 0 | 0 | 0 | 2 | 0 | 4 | 1 | 0 | 0 | 0 | 0 | 0 | 0 | 0 | 0 | 0 | 1 | 0 | 0 | 0 | 0 |
| May 2014 | 1942 | 157,070 | 0 | 0 | 0 | 0 | 0 | 0 | 0 | 1 | 0 | 0 | 0 | 0 | 0 | 0 | 0 | 1 | 0 | 0 | 0 | 0 | 1 | 0 | 0 | 1 | 0 |
| June 2014 | 2554 | 234,139 | 0 | 0 | 0 | 0 | 2 | 0 | 0 | 1 | 0 | 0 | 0 | 0 | 1 | 1 | 1 | 0 | 1 | 0 | 0 | 1 | 6 | 0 | 0 | 0 | 0 |
| July 2014 | 3872 | 386,039 | 0 | 0 | 1 | 0 | 1 | 0 | 0 | 0 | 0 | 0 | 0 | 0 | 1 | 0 | 5 | 0 | 0 | 0 | 0 | 0 | 1 | 0 | 0 | 10 | 0 |
| August 2014 | 3954 | 389,032 | 0 | 0 | 0 | 0 | 0 | 0 | 0 | 0 | 1 | 1 | 0 | 0 | 0 | 0 | 0 | 1 | 0 | 0 | 0 | 0 | 3 | 0 | 1 | 1 | 0 |
| September 2014 | 2592 | 240,991 | 0 | 0 | 0 | 1 | 0 | 0 | 0 | 1 | 1 | 0 | 0 | 0 | 0 | 1 | 2 | 0 | 0 | 0 | 0 | 1 | 0 | 0 | 1 | 2 | 0 |
| October 2014 | 1470 | 114,161 | 0 | 0 | 0 | 0 | 0 | 0 | 0 | 1 | 0 | 0 | 0 | 0 | 0 | 0 | 0 | 0 | 0 | 0 | 0 | 0 | 1 | 0 | 0 | 2 | 0 |
| November 2014 | 504 | 27,359 | 0 | 0 | 0 | 0 | 0 | 0 | 0 | 0 | 0 | 0 | 0 | 0 | 0 | 0 | 0 | 0 | 0 | 0 | 0 | 0 | 0 | 0 | 0 | 0 | 0 |
| December 2014 | 528 | 30,811 | 0 | 0 | 0 | 0 | 0 | 0 | 0 | 0 | 0 | 0 | 0 | 0 | 0 | 0 | 0 | 0 | 0 | 0 | 0 | 0 | 0 | 0 | 0 | 0 | 0 |
| January 2015 | 504 | 23,513 | 0 | 0 | 0 | 0 | 0 | 0 | 0 | 0 | 0 | 1 | 0 | 0 | 0 | 0 | 0 | 0 | 0 | 0 | 0 | 0 | 0 | 0 | 0 | 0 | 0 |
| February 2015 | 454 | 22,234 | 0 | 0 | 0 | 0 | 0 | 0 | 0 | 0 | 0 | 0 | 0 | 0 | 0 | 0 | 0 | 0 | 0 | 0 | 0 | 0 | 2 | 0 | 0 | 0 | 0 |
| March 2015 | 576 | 31,941 | 0 | 0 | 0 | 0 | 0 | 0 | 0 | 0 | 0 | 0 | 0 | 0 | 0 | 1 | 0 | 0 | 0 | 0 | 0 | 0 | 0 | 0 | 0 | 0 | 0 |
| April 2015 | 1132 | 73,149 | 0 | 0 | 0 | 0 | 0 | 0 | 0 | 0 | 0 | 0 | 0 | 0 | 1 | 0 | 2 | 0 | 0 | 0 | 0 | 0 | 1 | 0 | 0 | 2 | 0 |
| May 2015 | 2232 | 179,794 | 0 | 0 | 1 | 0 | 0 | 0 | 0 | 0 | 1 | 0 | 0 | 0 | 0 | 0 | 1 | 0 | 0 | 0 | 0 | 0 | 1 | 0 | 1 | 0 | 0 |
| June 2015 | 2942 | 267,755 | 0 | 0 | 0 | 0 | 0 | 0 | 0 | 1 | 0 | 0 | 0 | 0 | 0 | 0 | 1 | 1 | 0 | 0 | 0 | 2 | 1 | 0 | 1 | 1 | 0 |
| July 2015 | 4374 | 431,014 | 1 | 0 | 1 | 1 | 1 | 0 | 0 | 0 | 0 | 0 | 0 | 0 | 0 | 1 | 10 | 0 | 0 | 0 | 0 | 1 | 3 | 0 | 0 | 4 | 1 |
| August 2015 | 4162 | 427,830 | 0 | 0 | 0 | 0 | 1 | 0 | 0 | 0 | 0 | 0 | 0 | 0 | 0 | 0 | 10 | 0 | 1 | 0 | 0 | 0 | 2 | 0 | 0 | 3 | 0 |
| September 2015 | 2826 | 285,446 | 0 | 0 | 0 | 0 | 1 | 0 | 0 | 1 | 0 | 0 | 0 | 0 | 0 | 0 | 6 | 0 | 0 | 0 | 0 | 0 | 1 | 0 | 0 | 0 | 0 |
| October 2015 | 1582 | 133,129 | 0 | 0 | 0 | 0 | 0 | 0 | 0 | 1 | 0 | 0 | 0 | 0 | 0 | 0 | 2 | 0 | 0 | 0 | 0 | 0 | 1 | 0 | 0 | 0 | 0 |
| November 2015 | 640 | 27,938 | 0 | 0 | 0 | 0 | 0 | 0 | 0 | 0 | 1 | 0 | 0 | 0 | 0 | 0 | 0 | 0 | 0 | 0 | 0 | 0 | 0 | 0 | 0 | 0 | 0 |
| December 2015 | 564 | 27,137 | 0 | 0 | 0 | 0 | 0 | 0 | 0 | 1 | 0 | 0 | 0 | 0 | 0 | 1 | 0 | 0 | 0 | 0 | 0 | 0 | 0 | 0 | 0 | 0 | 0 |
| January 2016 | 492 | 25,028 | 0 | 0 | 0 | 0 | 0 | 0 | 0 | 0 | 0 | 0 | 0 | 0 | 0 | 0 | 0 | 0 | 0 | 0 | 0 | 0 | 1 | 0 | 0 | 0 | 0 |
| February 2016 | 494 | 22,782 | 0 | 0 | 0 | 0 | 0 | 0 | 0 | 0 | 1 | 0 | 0 | 0 | 0 | 0 | 0 | 0 | 0 | 0 | 0 | 0 | 3 | 0 | 0 | 1 | 0 |
| March 2016 | 624 | 33,477 | 1 | 0 | 0 | 0 | 1 | 0 | 1 | 0 | 0 | 0 | 0 | 0 | 0 | 0 | 1 | 0 | 0 | 0 | 0 | 0 | 0 | 0 | 0 | 0 | 0 |
| April 2016 | 1142 | 73,764 | 0 | 0 | 0 | 0 | 0 | 0 | 0 | 0 | 0 | 0 | 0 | 0 | 0 | 0 | 1 | 0 | 0 | 0 | 0 | 0 | 1 | 0 | 0 | 0 | 0 |
| May 2016 | 2390 | 201,906 | 0 | 0 | 1 | 0 | 2 | 0 | 1 | 0 | 0 | 0 | 0 | 0 | 0 | 0 | 6 | 0 | 1 | 0 | 0 | 1 | 2 | 0 | 0 | 2 | 0 |
| June 2016 | 3148 | 319,135 | 0 | 0 | 1 | 0 | 0 | 0 | 0 | 0 | 0 | 0 | 0 | 0 | 0 | 0 | 14 | 0 | 0 | 0 | 0 | 2 | 3 | 0 | 0 | 1 | 1 |
| July 2016 | 4824 | 540,778 | 0 | 0 | 0 | 0 | 1 | 0 | 0 | 0 | 1 | 0 | 0 | 0 | 0 | 0 | 16 | 0 | 0 | 0 | 0 | 0 | 3 | 0 | 0 | 0 | 0 |
| August 2016 | 4518 | 483,215 | 0 | 0 | 0 | 1 | 1 | 0 | 0 | 1 | 0 | 0 | 0 | 0 | 0 | 0 | 15 | 1 | 0 | 0 | 0 | 1 | 3 | 0 | 0 | 0 | 1 |
| September 2016 | 3280 | 337,967 | 0 | 0 | 0 | 0 | 1 | 0 | 0 | 1 | 0 | 0 | 1 | 0 | 1 | 0 | 5 | 0 | 0 | 0 | 0 | 3 | 5 | 1 | 0 | 2 | 2 |
| October 2016 | 1876 | 165,299 | 0 | 0 | 0 | 0 | 0 | 0 | 0 | 0 | 0 | 0 | 0 | 0 | 0 | 0 | 2 | 0 | 0 | 0 | 0 | 2 | 1 | 0 | 0 | 1 | 0 |
| November 2016 | 582 | 30,676 | 0 | 0 | 0 | 0 | 0 | 0 | 0 | 0 | 0 | 0 | 0 | 0 | 0 | 0 | 0 | 0 | 0 | 0 | 0 | 0 | 1 | 0 | 0 | 0 | 0 |
| December 2016 | 570 | 28,779 | 0 | 0 | 0 | 0 | 0 | 0 | 0 | 0 | 0 | 0 | 0 | 0 | 0 | 0 | 2 | 0 | 0 | 0 | 0 | 0 | 0 | 0 | 0 | 0 | 0 |
| January 2017 | 586 | 28,994 | 0 | 0 | 0 | 1 | 0 | 0 | 0 | 0 | 0 | 1 | 0 | 0 | 0 | 0 | 0 | 1 | 0 | 0 | 0 | 0 | 0 | 0 | 0 | 0 | 0 |
| February 2017 | 496 | 22,646 | 0 | 0 | 0 | 0 | 0 | 0 | 0 | 0 | 0 | 0 | 0 | 0 | 0 | 0 | 0 | 0 | 0 | 1 | 0 | 0 | 0 | 0 | 0 | 1 | 1 |
| March 2017 | 640 | 31,878 | 1 | 0 | 0 | 0 | 0 | 0 | 0 | 0 | 0 | 0 | 0 | 0 | 0 | 0 | 0 | 0 | 0 | 0 | 0 | 0 | 0 | 0 | 0 | 1 | 1 |
| April 2017 | 1378 | 120,980 | 0 | 0 | 0 | 0 | 0 | 0 | 0 | 0 | 0 | 0 | 0 | 0 | 0 | 0 | 1 | 0 | 0 | 0 | 0 | 0 | 0 | 0 | 0 | 1 | 0 |
| May 2017 | 2644 | 254,265 | 0 | 0 | 0 | 0 | 1 | 0 | 0 | 0 | 1 | 0 | 0 | 0 | 0 | 0 | 3 | 0 | 0 | 0 | 0 | 0 | 1 | 0 | 0 | 3 | 0 |
| June 2017 | 3594 | 401,347 | 0 | 0 | 0 | 0 | 0 | 0 | 0 | 0 | 0 | 0 | 0 | 0 | 0 | 0 | 6 | 0 | 0 | 0 | 0 | 0 | 5 | 1 | 0 | 0 | 1 |
| July 2017 | 5216 | 653,743 | 0 | 0 | 0 | 0 | 3 | 0 | 0 | 0 | 0 | 0 | 0 | 0 | 0 | 0 | 7 | 0 | 0 | 0 | 0 | 0 | 0 | 0 | 0 | 2 | 0 |
| August 2017 | 5078 | 590,830 | 0 | 0 | 0 | 0 | 0 | 0 | 0 | 1 | 0 | 0 | 0 | 0 | 0 | 0 | 0 | 0 | 0 | 0 | 0 | 0 | 4 | 0 | 0 | 3 | 0 |
| September 2017 | 378 | 418,836 | 0 | 0 | 0 | 0 | 0 | 0 | 0 | 0 | 0 | 0 | 0 | 0 | 0 | 0 | 1 | 0 | 0 | 0 | 0 | 0 | 0 | 0 | 0 | 4 | 1 |
| October 2017 | 2116 | 195,837 | 0 | 0 | 0 | 0 | 0 | 0 | 0 | 0 | 0 | 0 | 0 | 0 | 0 | 0 | 1 | 0 | 0 | 1 | 1 | 0 | 0 | 0 | 0 | 1 | 1 |
| November 2017 | 654 | 37,343 | 0 | 0 | 0 | 0 | 0 | 0 | 0 | 0 | 0 | 1 | 0 | 0 | 1 | 0 | 0 | 0 | 0 | 0 | 0 | 0 | 0 | 0 | 0 | 0 | 0 |
| December 2017 | 554 | 34,626 | 0 | 0 | 0 | 0 | 0 | 0 | 0 | 0 | 0 | 0 | 0 | 0 | 0 | 0 | 0 | 0 | 0 | 0 | 0 | 0 | 0 | 0 | 0 | 0 | 0 |
| January 2018 | 590 | 32,006 | 0 | 0 | 0 | 0 | 0 | 0 | 0 | 0 | 0 | 1 | 0 | 0 | 0 | 0 | 0 | 0 | 0 | 0 | 0 | 0 | 1 | 0 | 0 | 0 | 0 |
| February 2018 | 520 | 29,109 | 0 | 0 | 0 | 0 | 0 | 0 | 0 | 0 | 0 | 1 | 0 | 0 | 0 | 1 | 0 | 0 | 0 | 2 | 0 | 0 | 0 | 0 | 0 | 1 | 0 |
| March 2018 | 748 | 51,331 | 0 | 0 | 0 | 0 | 0 | 0 | 0 | 0 | 0 | 1 | 0 | 1 | 0 | 0 | 0 | 0 | 0 | 0 | 0 | 0 | 2 | 0 | 0 | 0 | 0 |
| April 2018 | 1486 | 121,372 | 0 | 0 | 0 | 0 | 0 | 0 | 0 | 0 | 0 | 0 | 0 | 0 | 0 | 0 | 1 | 0 | 0 | 0 | 0 | 1 | 1 | 0 | 0 | 2 | 0 |
| May 2018 | 2878 | 301,377 | 0 | 0 | 0 | 0 | 0 | 0 | 0 | 0 | 0 | 0 | 0 | 0 | 0 | 0 | 5 | 0 | 0 | 0 | 0 | 0 | 1 | 0 | 0 | 0 | 0 |
| June 2018 | 4052 | 471,962 | 0 | 0 | 0 | 0 | 0 | 0 | 0 | 0 | 0 | 0 | 0 | 0 | 0 | 0 | 2 | 0 | 0 | 0 | 0 | 0 | 0 | 0 | 0 | 0 | 1 |
| July 2018 | 5504 | 691,810 | 0 | 0 | 0 | 0 | 1 | 0 | 0 | 0 | 0 | 0 | 0 | 0 | 0 | 0 | 6 | 0 | 0 | 0 | 0 | 2 | 8 | 0 | 0 | 1 | 0 |
| August 2018 | 5136 | 625,209 | 0 | 0 | 0 | 0 | 0 | 0 | 0 | 0 | 0 | 1 | 0 | 0 | 1 | 0 | 5 | 1 | 0 | 0 | 0 | 3 | 0 | 0 | 0 | 3 | 0 |
| September 2018 | 3842 | 452,964 | 0 | 0 | 0 | 0 | 0 | 0 | 0 | 0 | 0 | 0 | 0 | 0 | 0 | 0 | 4 | 0 | 1 | 0 | 0 | 0 | 3 | 0 | 0 | 4 | 0 |
| October 2018 | 2272 | 223,092 | 0 | 0 | 0 | 0 | 2 | 0 | 0 | 0 | 1 | 0 | 0 | 0 | 0 | 0 | 5 | 0 | 0 | 0 | 0 | 1 | 1 | 1 | 0 | 0 | 0 |
| November 2018 | 750 | 52,942 | 0 | 0 | 0 | 0 | 0 | 0 | 0 | 0 | 0 | 0 | 0 | 0 | 0 | 0 | 2 | 0 | 0 | 0 | 0 | 1 | 0 | 0 | 0 | 0 | 0 |
| December 2018 | 646 | 42,434 | 0 | 0 | 0 | 0 | 0 | 0 | 0 | 0 | 0 | 0 | 0 | 0 | 0 | 0 | 0 | 0 | 0 | 0 | 0 | 0 | 0 | 0 | 0 | 0 | 0 |
| January 2019 | 664 | 34,694 | 0 | 0 | 0 | 0 | 0 | 0 | 0 | 0 | 0 | 0 | 0 | 0 | 0 | 0 | 0 | 0 | 0 | 0 | 0 | 0 | 0 | 0 | 0 | 0 | 0 |
| February 2019 | 634 | 33,087 | 0 | 0 | 0 | 0 | 0 | 0 | 0 | 0 | 0 | 0 | 0 | 0 | 0 | 0 | 0 | 0 | 0 | 0 | 0 | 0 | 3 | 0 | 0 | 0 | 0 |
| March 2019 | 800 | 48,095 | 0 | 0 | 0 | 0 | 0 | 0 | 0 | 1 | 0 | 0 | 0 | 0 | 1 | 0 | 0 | 0 | 0 | 0 | 0 | 0 | 0 | 0 | 0 | 0 | 0 |
| April 2019 | 1698 | 153,474 | 0 | 0 | 0 | 0 | 0 | 0 | 0 | 0 | 0 | 0 | 0 | 1 | 0 | 4 | 0 | 0 | 0 | 0 | 0 | 0 | 1 | 0 | 0 | 1 | 0 |
| May 2019 | 2992 | 308,447 | 0 | 0 | 0 | 0 | 1 | 0 | 0 | 0 | 0 | 0 | 0 | 0 | 0 | 1 | 0 | 0 | 0 | 0 | 0 | 0 | 1 | 0 | 0 | 2 | 0 |
| June 2019 | 4318 | 510,438 | 0 | 0 | 0 | 0 | 0 | 0 | 0 | 0 | 0 | 0 | 0 | 0 | 0 | 5 | 0 | 0 | 0 | 0 | 0 | 1 | 1 | 0 | 0 | 2 | 0 |
| July 2019 | 5576 | 719,796 | 2 | 0 | 1 | 0 | 1 | 0 | 0 | 0 | 0 | 0 | 0 | 0 | 0 | 1 | 0 | 0 | 0 | 0 | 0 | 0 | 2 | 0 | 0 | 13 | 0 |
| August 2019 | 5320 | 669,403 | 0 | 0 | 0 | 0 | 0 | 0 | 0 | 1 | 0 | 1 | 0 | 0 | 0 | 2 | 2 | 0 | 0 | 0 | 0 | 1 | 2 | 0 | 0 | 5 | 0 |
| September 2019 | 3848 | 467,544 | 0 | 0 | 0 | 0 | 0 | 0 | 0 | 0 | 0 | 0 | 0 | 0 | 0 | 0 | 0 | 0 | 0 | 0 | 0 | 1 | 0 | 0 | 0 | 0 | 0 |
| October 2019 | 2372 | 244,259 | 0 | 0 | 3 | 0 | 0 | 0 | 0 | 0 | 0 | 2 | 0 | 0 | 0 | 1 | 0 | 0 | 0 | 0 | 0 | 0 | 4 | 0 | 0 | 0 | 0 |
| November 2019 | 634 | 42,859 | 0 | 0 | 1 | 0 | 0 | 0 | 0 | 0 | 0 | 0 | 0 | 0 | 0 | 2 | 0 | 0 | 0 | 0 | 0 | 0 | 0 | 0 | 0 | 1 | 0 |
| December 2019 | 574 | 38,949 | 0 | 0 | 0 | 0 | 0 | 0 | 0 | 0 | 0 | 0 | 0 | 0 | 0 | 2 | 0 | 0 | 0 | 0 | 0 | 0 | 1 | 0 | 0 | 0 | 0 |
| January 2020 | 567 | 35,282 | 0 | 0 | 0 | 0 | 0 | 0 | 0 | 0 | 0 | 0 | 0 | 0 | 0 | 0 | 0 | 0 | 0 | 0 | 0 | 0 | 1 | 0 | 0 | 0 | 0 |
| February 2020 | 474 | 24,606 | 0 | 0 | 0 | 0 | 0 | 0 | 0 | 0 | 0 | 0 | 0 | 0 | 0 | 0 | 0 | 0 | 0 | 0 | 0 | 0 | 0 | 0 | 0 | 0 | 0 |
| March 2020 | 370 | 16,117 | 0 | 0 | 0 | 0 | 0 | 0 | 0 | 0 | 0 | 0 | 0 | 0 | 0 | 0 | 0 | 0 | 0 | 0 | 0 | 0 | 0 | 0 | 0 | 0 | 0 |
| April 2020 | 16 | 0 | 0 | 0 | 0 | 0 | 0 | 0 | 0 | 1 | 0 | 0 | 0 | 0 | 0 | 0 | 0 | 0 | 0 | 0 | 0 | 0 | 0 | 0 | 0 | 0 | 0 |
| May 2020 | 194 | 2319 | 0 | 0 | 0 | 0 | 0 | 0 | 0 | 0 | 0 | 0 | 0 | 0 | 0 | 0 | 0 | 0 | 0 | 0 | 0 | 0 | 0 | 0 | 0 | 0 | 0 |
| June 2020 | 818 | 24,929 | 0 | 0 | 0 | 0 | 0 | 0 | 0 | 0 | 0 | 0 | 0 | 0 | 0 | 0 | 2 | 0 | 0 | 1 | 0 | 0 | 0 | 0 | 0 | 1 | 0 |
| July 2020 | 2757 | 169,229 | 0 | 0 | 0 | 0 | 3 | 0 | 0 | 0 | 0 | 0 | 0 | 0 | 0 | 0 | 11 | 1 | 0 | 0 | 0 | 0 | 1 | 0 | 0 | 6 | 0 |
| August 2020 | 3676 | 271,362 | 1 | 0 | 0 | 0 | 0 | 0 | 0 | 0 | 0 | 0 | 0 | 1 | 0 | 0 | 7 | 0 | 0 | 0 | 0 | 0 | 0 | 0 | 0 | 0 | 0 |
| September 2020 | 1807 | 74,653 | 0 | 0 | 0 | 0 | 0 | 0 | 0 | 0 | 0 | 0 | 0 | 0 | 0 | 0 | 2 | 0 | 0 | 0 | 0 | 0 | 1 | 0 | 0 | 1 | 0 |
| October 2020 | 720 | 25,050 | 0 | 0 | 0 | 0 | 0 | 0 | 0 | 0 | 0 | 0 | 0 | 0 | 0 | 0 | 1 | 0 | 0 | 0 | 0 | 0 | 0 | 0 | 0 | 1 | 1 |
| November 2020 | 410 | 7658 | 0 | 0 | 1 | 0 | 0 | 0 | 0 | 0 | 0 | 0 | 0 | 0 | 0 | 0 | 0 | 0 | 0 | 0 | 0 | 0 | 0 | 0 | 0 | 0 | 0 |
| December 2020 | 341 | 8145 | 0 | 0 | 0 | 0 | 0 | 0 | 0 | 0 | 0 | 0 | 0 | 0 | 0 | 0 | 0 | 0 | 0 | 0 | 0 | 0 | 0 | 0 | 0 | 0 | 0 |
| January 2021 | 314 | 7415 | 0 | 0 | 0 | 0 | 0 | 0 | 0 | 0 | 0 | 0 | 0 | 0 | 0 | 0 | 0 | 0 | 0 | 0 | 0 | 0 | 0 | 0 | 0 | 0 | 0 |
| February 2021 | 274 | 5706 | 0 | 0 | 0 | 0 | 0 | 0 | 0 | 0 | 0 | 0 | 0 | 0 | 0 | 0 | 0 | 0 | 0 | 0 | 0 | 0 | 0 | 0 | 0 | 0 | 0 |
| March 2021 | 358 | 8031 | 0 | 0 | 0 | 0 | 0 | 0 | 0 | 0 | 0 | 0 | 0 | 0 | 0 | 0 | 0 | 0 | 0 | 0 | 0 | 0 | 0 | 0 | 0 | 0 | 0 |
| April 2021 | 587 | 13,964 | 0 | 0 | 0 | 0 | 0 | 0 | 0 | 0 | 0 | 0 | 0 | 0 | 0 | 0 | 0 | 0 | 0 | 0 | 0 | 0 | 0 | 0 | 0 | 0 | 0 |
| May 2021 | 883 | 32,754 | 0 | 0 | 0 | 0 | 0 | 0 | 0 | 0 | 0 | 0 | 0 | 0 | 0 | 2 | 0 | 0 | 0 | 0 | 0 | 0 | 1 | 0 | 0 | 0 | 0 |
| June 2021 | 2051 | 114,687 | 0 | 0 | 0 | 0 | 1 | 0 | 0 | 0 | 0 | 0 | 0 | 0 | 0 | 0 | 2 | 0 | 0 | 0 | 0 | 0 | 2 | 0 | 0 | 1 | 0 |
| July 2021 | 4084 | 349,042 | 0 | 1 | 0 | 0 | 0 | 0 | 0 | 2 | 0 | 0 | 0 | 0 | 0 | 0 | 0 | 2 | 0 | 0 | 0 | 0 | 0 | 0 | 0 | 0 | 0 |
| August 2021 | 4728 | 491,358 | 0 | 0 | 0 | 0 | 0 | 0 | 0 | 0 | 0 | 0 | 0 | 0 | 0 | 0 | 0 | 0 | 0 | 0 | 0 | 0 | 1 | 0 | 0 | 7 | 1 |
| September 2021 | 3435 | 326,347 | 0 | 0 | 0 | 0 | 0 | 0 | 0 | 0 | 0 | 0 | 0 | 0 | 0 | 0 | 1 | 0 | 0 | 0 | 0 | 1 | 1 | 0 | 0 | 1 | 0 |
| October 2021 | 2090 | 160,720 | 0 | 0 | 0 | 0 | 1 | 0 | 0 | 0 | 0 | 0 | 0 | 0 | 0 | 0 | 0 | 0 | 0 | 0 | 0 | 0 | 0 | 0 | 0 | 0 | 0 |
| November 2021 | 613 | 25,726 | 0 | 0 | 0 | 0 | 0 | 0 | 0 | 0 | 0 | 0 | 0 | 0 | 0 | 0 | 0 | 0 | 0 | 0 | 0 | 0 | 0 | 0 | 0 | 0 | 0 |
| December 2021 | 615 | 23,428 | 0 | 0 | 0 | 0 | 0 | 0 | 0 | 0 | 0 | 0 | 0 | 0 | 0 | 0 | 0 | 0 | 0 | 0 | 0 | 1 | 0 | 0 | 0 | 0 | 0 |
| January 2022 | 599 1 | 20,618 | 0 | 0 | 0 | 0 | 0 | 0 | 0 | 0 | 0 | 0 | 0 | 0 | 0 | 0 | 0 | 0 | 0 | 0 | 0 | 0 | 0 | 0 | 0 | 0 | 0 |
| February 2022 | 546 | 16,764 | 0 | 0 | 0 | 0 | 0 | 0 | 0 | 0 | 0 | 0 | 0 | 0 | 0 | 0 | 0 | 0 | 0 | 0 | 0 | 0 | 0 | 0 | 0 | 0 | 0 |
| March 2022 | 658 | 25,049 | 0 | 0 | 0 | 0 | 0 | 0 | 0 | 0 | 0 | 0 | 0 | 0 | 0 | 0 | 0 | 0 | 0 | 0 | 0 | 0 | 0 | 0 | 0 | 0 | 0 |
| April 2022 | 1138 | 73,424 | 0 | 0 | 0 | 0 | 0 | 0 | 0 | 0 | 0 | 0 | 0 | 0 | 0 | 0 | 0 | 0 | 0 | 0 | 0 | 0 | 0 | 0 | 0 | 1 | 0 |
| May 2022 | 2099 | 173,881 | 0 | 0 | 0 | 0 | 0 | 0 | 0 | 0 | 0 | 0 | 0 | 0 | 0 | 0 | 2 2 | 0 | 0 | 0 | 0 | 0 | 0 | 0 | 0 | 1 | 0 |
| June 2022 | 3014 | 287,188 | 0 | 0 | 0 | 0 | 0 | 0 | 0 | 0 | 0 | 0 | 0 | 0 | 0 | 1 | 3 | 0 | 0 | 0 | 0 | 1 | 2 | 0 | 0 | 1 | 0 |
| July 2022 | 4605 | 486,821 | 0 | 0 | 0 | 0 | 1 | 0 | 0 | 0 | 0 | 0 | 0 | 0 | 0 | 0 | 7 | 0 | 0 | 0 | 0 | 0 | 2 | 0 | 0 | 4 | 0 |
| August 2022 | 4651 | 487,669 | 0 | 0 | 0 | 0 | 0 | 0 | 0 | 0 | 0 | 0 | 0 | 0 | 0 | 0 | 5 | 0 | 0 | 0 | 0 | 1 | 1 | 0 | 0 | 3 | 0 |
| September 2022 | 2830 | 319,733 | 0 | 0 | 0 | 0 | 0 | 0 | 0 | 0 | 0 | 0 | 0 | 0 | 0 | 0 | 2 | 0 | 0 | 0 | 0 | 1 | 1 | 0 | 0 | 2 | 0 |
| October 2022 | 1891 | 151,833 | 0 | 0 | 0 | 0 | 0 | 0 | 0 | 0 | 0 | 0 | 0 | 0 | 0 | 0 | 1 | 0 | 0 | 0 | 0 | 0 | 0 | 0 | 0 | 0 | 0 |
| November 2022 | 678 | 25,702 | 0 | 0 | 0 | 0 | 0 | 0 | 0 | 0 | 0 | 0 | 0 | 0 | 0 | 0 | 0 | 0 | 0 | 0 | 0 | 0 | 0 | 0 | 0 | 0 | 0 |
| December 2022 | 628 | 23,428 | 0 | 0 | 0 | 0 | 0 | 0 | 0 | 0 | 0 | 0 | 0 | 0 | 0 | 0 | 0 | 0 | 0 | 0 | 0 | 0 | 0 | 0 | 0 | 0 | 0 |
| January 2023 | 599 | 20,618 | 0 | 0 | 0 | 0 | 0 | 0 | 0 | 0 | 0 | 0 | 0 | 0 | 0 | 0 | 0 | 0 | 0 | 0 | 0 | 0 | 0 | 0 | 0 | 0 | 0 |
| February 2023 | 546 | 16,764 | 0 | 0 | 0 | 0 | 0 | 0 | 0 | 0 | 0 | 0 | 0 | 0 | 0 | 0 | 0 | 0 | 0 | 0 | 0 | 0 | 0 | 0 | 0 | 0 | 0 |
| March 2023 | 658 | 25,049 | 0 | 0 | 0 | 0 | 0 | 0 | 0 | 0 | 0 | 0 | 0 | 0 | 0 | 0 | 0 | 0 | 0 | 0 | 0 | 0 | 0 | 0 | 0 | 0 | 0 |
| April 2023 | 1138 | 73,424 | 0 | 0 | 0 | 0 | 0 | 0 | 0 | 0 | 0 | 0 | 0 | 0 | 0 | 0 | 0 | 0 | 0 | 0 | 0 | 0 | 0 | 0 | 0 | 1 | 0 |
| May 2023 | 2099 | 173,881 | 0 | 0 | 0 | 0 | 0 | 0 | 0 | 0 | 0 | 0 | 0 | 0 | 0 | 0 | 2 | 0 | 0 | 0 | 0 | 0 | 0 | 0 | 0 | 1 | 0 |
| June 2023 | 3014 | 287,188 | 0 | 0 | 0 | 0 | 0 | 0 | 0 | 0 | 0 | 0 | 0 | 0 | 0 | 1 | 3 | 0 | 0 | 0 | 0 | 1 | 2 | 0 | 0 | 1 | 0 |
| July 2023 | 4605 | 486,821 | 0 | 0 | 0 | 0 | 1 | 0 | 0 | 0 | 0 | 0 | 0 | 0 | 0 | 0 | 7 | 0 | 0 | 0 | 0 | 0 | 2 | 0 | 0 | 4 | 0 |
| August 2023 | 4651 | 487,669 | 0 | 0 | 0 | 0 | 0 | 0 | 0 | 0 | 0 | 0 | 0 | 0 | 0 | 0 | 5 | 0 | 0 | 0 | 0 | 1 | 1 | 0 | 0 | 3 | 0 |
| September 2023 | 2830 | 319,733 | 0 | 0 | 0 | 0 | 0 | 0 | 0 | 0 | 0 | 0 | 0 | 0 | 0 | 0 | 2 | 0 | 0 | 0 | 0 | 1 | 1 | 0 | 0 | 2 | 0 |
| October 2023 | 1891 | 151,833 | 0 | 0 | 0 | 0 | 0 | 0 | 0 | 0 | 0 | 0 | 0 | 0 | 0 | 0 | 1 | 0 | 0 | 0 | 0 | 0 | 0 | 0 | 0 | 0 | 0 |
| November 2023 | 678 | 25,702 | 0 | 0 | 0 | 0 | 0 | 0 | 0 | 0 | 0 | 0 | 0 | 0 | 0 | 0 | 0 | 0 | 0 | 0 | 0 | 0 | 0 | 0 | 0 | 0 | 0 |
| December 2023 | 628 | 23,428 | 0 | 0 | 0 | 0 | 0 | 0 | 0 | 0 | 0 | 0 | 0 | 0 | 0 | 0 | 0 | 0 | 0 | 0 | 0 | 0 | 0 | 0 | 0 | 0 | 0 |
1 Red-colored area respresents the future period. 2 Bold and colored values present predicted adverse events.
References
- International Civil Aviation Organization (ICAO). Annex 19 to the Convention on International Civil Aviation: Safety Management, 2nd ed.; International Civil Aviation Organization: Montreal, QC, Canada, 2016. [Google Scholar]
- International Civil Aviation Organization (ICAO). Safety Management Manual (SMM) [Doc 9859 AN/474], 4th ed.; International Civil Aviation Organization: Montreal, QC, Canada, 2018. [Google Scholar]
- Onyegiri, I.E.; Oke, S.A. A grey relational analytical approach to safety performance assessment in an aviation industry of a developing country. Eng. Appl. Sci. Res. 2017, 44, 1–15. [Google Scholar] [CrossRef]
- Ioannou, C.; Harris, D.; Dahlstrom, N. Safety management practices hindering the development of safety performance indicators in aviation service providers. Aviat. Psychol. Appl. Hum. Factors 2017, 7, 95–106. [Google Scholar] [CrossRef]
- Cusick, S.K.; Cortes, A.I.; Rodrigues, C.C. Commercial Aviation Safety, 6th ed.; McGraw-Hill: New York, NY, USA, 2017. [Google Scholar]
- Ferguson, M.D.; Nelson, S. Aviation Safety: A Balanced Industry Approach, 1st ed.; Delmar: New York, NY, USA, 2014. [Google Scholar]
- Pisanich, G.M.; Corker, K.M. A Predictive Model of Flight Crew Performance in Automated Air Traffic Control and Flight Management Operations. In Proceedings of the 8th International Symposium on Aviation Psychology, Columbus, OH, USA, 24–27 April 1995. [Google Scholar] [CrossRef]
- National Aeronautics and Space Administration (NASA). Probabilistic Risk Assessment Procedures Guide for NASA Managers and Practitioners; National Aeronautics and Space Administration: Washington, DC, USA, 2002. [Google Scholar]
- Ghobbar, A.A.; Friend, C.H. Evaluation of forecasting methods for intermittent parts demand in the field of aviation: A predictive model. Comput. Oper. Res. 2003, 30, 2097–2114. [Google Scholar] [CrossRef]
- Du, H.B.; Qin, P.H. Time sequence extrapolative analysis model of short-term forecasting of U.S. general aviation accidents. J. Saf. Environ. 2011, 11, 209–212. [Google Scholar]
- Duanmu, J.S.; Ma, Z.Y.; Chang, H. Theoretical Methods of Aviation Accident Prediction, Early Warning and Prevention; National Defense Industry Press: Beijing, China, 2013. [Google Scholar]
- Risk Models and Accident Scenarios in the Total Aviation System. Available online: https://ascos-project.eu/downloads/ascos_paper_roelen.pdf (accessed on 27 May 2022).
- Di Gravio, G.; Mancini, M.; Patriarca, R.; Costantino, F. Overall safety performance of air traffic management system: Forecasting and monitoring. Saf. Sci. 2015, 72, 351–362. [Google Scholar] [CrossRef]
- Grant, E.; Salmon, P.M.; Stevens, N.J.; Goode, N.; Read, G.J. Back to the future: What do accident causation models tell us about accident prediction? Saf. Sci. 2018, 104, 99–109. [Google Scholar] [CrossRef]
- Xu, S.; Chan, H.K.; Zhang, T. Forecasting the demand of the aviation industry using hybrid time series SARIMA-SVR approach. Transp. Res. Part E Logist. Transp. Rev. 2019, 122, 169–180. [Google Scholar] [CrossRef]
- Ben, B.; Cui, L.; Chen, H.; Liu, M.; Wang, F. A New Method for Aviation Safety Prediction Based on the Highest Density Domain in Uncertainty Environment. In Proceedings of the 5th International Conference on Control Science and Systems Engineering (ICCSSE 2019), Shanghai, China, 14–16 August 2019; pp. 5–9. [Google Scholar] [CrossRef]
- Insua, D.R.; Alfaro, C.; Gomez, J.; Hernandez-Coronado, P.; Bernal, F. Forecasting and assessing consequences of aviation safety occurrences. Saf. Sci. 2019, 111, 243–252. [Google Scholar] [CrossRef]
- Bartulović, D.; Steiner, S. Liaison between Proactive and Predictive Methodology of Aviation Safety Management System. In Proceedings of the 19th International Conference on Transport Science (ICTS 2020), Portorož, Slovenia, 17–18 September 2020. [Google Scholar]
- Bartulović, D. Predictive safety management system development. Trans. Marit. Sci. 2021, 10, 135–146. [Google Scholar] [CrossRef]
- Bartulović, D.; Steiner, S. Cause-Effect Relations between Organizational and Safety Performance Indicators. In Proceedings of the 20th International Conference on Transport Science (ICTS 2022), Portorož, Slovenia, 23–24 May 2022. [Google Scholar]
- Bartulović, D. Development of Predictive Safety Management Methodology in Aviation. Ph.D. Dissertation, University of Zagreb, Faculty of Transport and Traffic Sciences, Zagreb, Croatia, 9 December 2022. [Google Scholar]
- Bartulović, D.; Steiner, S. Conceptual model of predictive safety management methodology in aviation. Aerospace 2023, 10, 268. [Google Scholar] [CrossRef]
- Granger, C.W.J. Investigating causal relations by econometric models and cross-spectral methods. Econometrica 1969, 37, 424–438. [Google Scholar] [CrossRef]
- Granger, C.W.J. Testing for causality: A personal viewpoint. J. Econ. Dyn. Control. 1980, 2, 329–352. [Google Scholar] [CrossRef]
- Granger, C.W.J. Some recent development in a concept of causality. J. Econom. 1988, 39, 199–211. [Google Scholar] [CrossRef]
- Apostolakis, G. The concept of probability in safety assessments of technological systems. Science 1990, 250, 1359–1364. [Google Scholar] [CrossRef] [PubMed] [Green Version]
- Wu, J.S.; Apostolakis, G.; Okrent, D. Uncertainties in system analysis: Probabilistic versus nonprobabilistic theories. Reliab. Eng. Syst. Saf. 1990, 30, 163–181. [Google Scholar] [CrossRef]
- Senders, J.W.; Moray, N.P. Human Error Cause Prediction and Reduction; Lawrence Erlbaum: Hillsdale, MI, USA, 1991. [Google Scholar]
- Spirtes, P.; Glymour, C.; Scheines, R. Causation, Prediction, and Search, 2nd ed.; MIT Press: Cambridge, UK, 2000. [Google Scholar]
- Sarasvathy, S.D. Causation and effectuation: Toward a theoretical shift from economic inevitability to entrepreneurial contingency. Acad. Manag. Rev. 2001, 26, 243–263. [Google Scholar] [CrossRef]
- Cartwright, N. Causation: One word, many things. Philos. Sci. 2004, 71, 805–819. [Google Scholar] [CrossRef] [Green Version]
- Sloman, S.A. Causal Models: How We Think about the World and Its Alternatives; Oxford University Press: New York, NY, USA, 2005. [Google Scholar]
- Hall, N. Two concepts of causation. In Causation and Counterfactuals; MIT Press: Cambridge, MA, USA, 2004; pp. 225–276. [Google Scholar]
- Longworth, F. Causation, pluralism and responsibility. Philosophica 2006, 77, 45–68. [Google Scholar] [CrossRef]
- Luxhøj, J.T.; Coit, D.W. Modeling Low Probability/High Consequence Events: An Aviation Safety Risk Model. In Proceedings of the RAMS ′06 Annual Reliability and Maintainability Symposium (RAMS 2006), Newport Beach, CA, USA, 23–26 January 2006. [Google Scholar] [CrossRef]
- Liou, J.J.H.; Yen, L.; Tzeng, G.H. Building an effective safety management system for airlines. J. Air Transp. Manag. 2008, 14, 20–26. [Google Scholar] [CrossRef]
- Roelen, A.L.C. Causal Risk Models of Air Transport: Comparison of User Needs and Model Capabilities; IOS Press: Amsterdam, The Netherlands, 2008. [Google Scholar]
- Shmueli, G. To explain or to predict? Stat. Sci. 2010, 25, 289–310. [Google Scholar] [CrossRef]
- Valdés, R.M.A.; Comendador, F.G.; Gordún, L.M.; Nieto, F.J.S. The development of probabilistic models to estimate accident risk (due to runway overrun and landing undershoot) applicable to the design and construction of runway safety areas. Saf. Sci. 2011, 49, 633–650. [Google Scholar] [CrossRef]
- Buehner, M.J. Understanding the past, predicting the future: Causation, not intentional action, is the root of temporal binding. Psychol. Sci. 2012, 23, 1490–1497. [Google Scholar] [CrossRef]
- Button, K.; Yuan, J. Airfreight transport and economic development: An examination of causality. Urban Stud. 2013, 50, 329–340. [Google Scholar] [CrossRef]
- Van De Vijver, E.; Derudder, B.; Witlox, F. Exploring causality in trade and air passenger travel relationships: The case of Asia-Pacific, 1980-2010. J. Transp. Geogr. 2014, 34, 142–150. [Google Scholar] [CrossRef] [Green Version]
- Peters, J.; Bühlmann, P.; Meinshausen, N. Causal inference using invariant prediction: Identification and confidence intervals. J. R. Stat. Society. Ser. B (Stat. Methodol.) 2016, 78, 947–1012. [Google Scholar] [CrossRef] [Green Version]
- Küçükönala, H.; Sedefoğlu, G. The causality analysis of air transport and socio-economics factors: The case of OECD countries. Transp. Res. Procedia 2017, 28, 16–26. [Google Scholar] [CrossRef]
- Pacheco, R.R.; Fernandes, E. International air passenger traffic, trade openness and exchange rate in Brazil: A Granger causality test. Transp. Res. Part A Policy Pract. 2017, 101, 22–29. [Google Scholar] [CrossRef]
- Peters, J.; Janzing, D.; Schölkopf, B. Elements of Causal Inference: Foundations and Learning Algorithms; MIT Press: Cambridge, UK, 2017. [Google Scholar]
- Heinze-Deml, C.; Maathuis, M.H.; Meinshausen, N. Causal structure learning. Annu. Rev. Stat. Its Appl. 2018, 5, 371–391. [Google Scholar] [CrossRef] [Green Version]
- Heinze-Deml, C.; Peters, J.; Meinshausen, N. Invariant causal prediction for nonlinear models. J. Causal Inference 2018, 6, 1–35. [Google Scholar] [CrossRef] [Green Version]
- Rohrer, J.M. Thinking clearly about correlations and causation: Graphical causal models for observational data. Adv. Methods Pract. Psychol. Sci. 2018, 1, 27–42. [Google Scholar] [CrossRef] [Green Version]
- Singh, V.; Kumar Sharma, S.; Chadha, I.; Singh, T. Investigating the moderating effects of multi-group on safety. Case Stud. Transp. Policy 2019, 7, 477–488. [Google Scholar] [CrossRef]
- Zheqi, Z.; Ren, B.; Xiaofeng, Z.; Hang, Z.; Tao, X.; Qingge, C. Neural Network-Based Probability Forecasting Method of Aviation Safety. In Proceedings of the 10th International Conference on Quality, Reliability, Risk, Maintenance, and Safety Engineering (QR2MSE 2020), Shaanxi, China, 8–11 October 2020; Volume 1043. [Google Scholar] [CrossRef]
- Forecasting: Principles and Practice. Available online: https://otexts.com/fpp2/index.html (accessed on 7 March 2023).
- Split Airport. Internal Safety Performance Management (SPIs) Reports & Data 2014–2021; Split Airport: Split, Croatia, 2022. [Google Scholar]
- Kaitano, D.; Godwell, N.; David, C. COVID-19 pandemic and prospects for recovery of the global aviation industry. J. Air Transp. Manag. 2021, 92, 1–12. [Google Scholar] [CrossRef]
- How the War in Ukraine Impacts Aviation—And What to Do about It. Available online: https://www.itf-oecd.org/war-ukraine-impacts-aviation (accessed on 7 March 2023).
- Passenger Demand Recovery Continued in December 2022 & for the Full Year. Available online: https://www.iata.org/en/pressroom/2023-releases/2023-02-06-02/ (accessed on 5 March 2023).
- Air Crash Deaths Increased In 2020 Despite COVID-19. Available online: https://www.statista.com/chart/12393/2017-was-the-safest-year-in-the-history-of-air-travel/ (accessed on 5 March 2023).
Figure 1.
Passenger traffic and trendline at Split Airport in the period from 1966 to 2021. Adapted with permission from Ref. [53]. 2022, Split Airport.
Figure 1.
Passenger traffic and trendline at Split Airport in the period from 1966 to 2021. Adapted with permission from Ref. [53]. 2022, Split Airport.

Figure 2.
Split Airport safety performance indicators from 2014 to 2021. Adapted with permission from Ref. [53]. 2022, Split Airport.
Figure 2.
Split Airport safety performance indicators from 2014 to 2021. Adapted with permission from Ref. [53]. 2022, Split Airport.

Figure 3.
Causal model of Split Airport organizational and safety performance indicators.

Figure 4.
Direct impact of individual organizational indicators on safety performance indicators: (a) OI1—Number of aircraft operations; (b) OI2—Number of passengers.
Figure 4.
Direct impact of individual organizational indicators on safety performance indicators: (a) OI1—Number of aircraft operations; (b) OI2—Number of passengers.

Figure 5.
Examples of impacts of individual safety performance indicators: (a) SPI7—Number of training deficiencies; (b) SPI21—Number of occurrences related to ground traffic (GSE) and vehicle driving.
Figure 5.
Examples of impacts of individual safety performance indicators: (a) SPI7—Number of training deficiencies; (b) SPI21—Number of occurrences related to ground traffic (GSE) and vehicle driving.

Figure 6.
Impact diagrams of causes and effects of safety performance indicator (SPI14—Number of occurrences related to FOD presence): (a) Causes of SPI14; (b) Effects of SPI14.
Figure 6.
Impact diagrams of causes and effects of safety performance indicator (SPI14—Number of occurrences related to FOD presence): (a) Causes of SPI14; (b) Effects of SPI14.

Figure 7.
Outliers and root causes of indicator SPI3.

Figure 8.
Outliers and root causes in observed period of time from 2014 to 2021.

Figure 9.
Outliers and root causes in observed period of time from 2014 to 2021—impact of SPI10.

Figure 10.
Forecasts of organizational indicators of Split Airport.

Figure 11.
Forecasts of Split Airport safety performance indicators (forecasting using temporal causal model): (a) SPI5—Number of personnel or passenger injuries; (b) SPI15—Number of occurrences related to passenger handling at the gate.
Figure 11.
Forecasts of Split Airport safety performance indicators (forecasting using temporal causal model): (a) SPI5—Number of personnel or passenger injuries; (b) SPI15—Number of occurrences related to passenger handling at the gate.

Figure 12.
Forecasts of Split Airport safety performance indicators: (a) ARIMA and smoothing methods (SPI24); (b) Smoothing methods only (SPI24).
Figure 12.
Forecasts of Split Airport safety performance indicators: (a) ARIMA and smoothing methods (SPI24); (b) Smoothing methods only (SPI24).

Figure 13.
Example of increasing organizational indicator OI1 in the observed dataset by 30% and its impact on behavior of safety performance indicator SPI3: (a) Increase of OI1; (b) impact of increased OI1 on SPI3 (scenario case).
Figure 13.
Example of increasing organizational indicator OI1 in the observed dataset by 30% and its impact on behavior of safety performance indicator SPI3: (a) Increase of OI1; (b) impact of increased OI1 on SPI3 (scenario case).

Figure 14.
Example of decreasing organizational indicator OI1 in the observed dataset by 30% and its impact on behavior of safety performance indicator SPI7: (a) Decrease of OI1; (b) Impact of decreased OI1 on SPI7 (scenario case).
Figure 14.
Example of decreasing organizational indicator OI1 in the observed dataset by 30% and its impact on behavior of safety performance indicator SPI7: (a) Decrease of OI1; (b) Impact of decreased OI1 on SPI7 (scenario case).

Figure 15.
Example of increasing organizational indicator OI2 in the observed dataset by 30% and its impact on behavior of safety performance indicator SPI11: (a) Increase of OI2; (b) impact of increased OI2 on SPI11 (scenario case).
Figure 15.
Example of increasing organizational indicator OI2 in the observed dataset by 30% and its impact on behavior of safety performance indicator SPI11: (a) Increase of OI2; (b) impact of increased OI2 on SPI11 (scenario case).

Figure 16.
Example of decreasing organizational indicator OI2 in the observed dataset by 30% and its impact on behavior of safety performance indicator SPI21: (a) Decrease of OI2; (b) Impact of decreased OI2 on SPI21 (scenario case).
Figure 16.
Example of decreasing organizational indicator OI2 in the observed dataset by 30% and its impact on behavior of safety performance indicator SPI21: (a) Decrease of OI2; (b) Impact of decreased OI2 on SPI21 (scenario case).

Figure 17.
Observed and predicted safety performance indicators (hazards/events) over observed and future time period, at Split Airport.
Figure 17.
Observed and predicted safety performance indicators (hazards/events) over observed and future time period, at Split Airport.

Figure 18.
Sample of proposed mitigation measures for anticipated occurrences (two in May 2022) related to passenger handling at the gate.
Figure 18.
Sample of proposed mitigation measures for anticipated occurrences (two in May 2022) related to passenger handling at the gate.

Figure 19.
Sample of proposed mitigation measures for anticipated occurrences (three in August 2022) related to wildlife.
Figure 19.
Sample of proposed mitigation measures for anticipated occurrences (three in August 2022) related to wildlife.

Table 1.
List of organizational and safety performance indicators in observed dataset at Split Airport. Adapted with permission from Ref. [53]. 2022, Split Airport.
Table 1.
List of organizational and safety performance indicators in observed dataset at Split Airport. Adapted with permission from Ref. [53]. 2022, Split Airport.
| Mark | Name of Organizational/Safety Performance Indicator | Targets 1 (For SPIs) |
|---|---|---|
| OI1 | Number of aircraft operations | / |
| OI2 | Number of passengers | / |
| SPI1 | Number of occurrences related to LIRF and loadsheet crosscheck | ≤1/10,000 |
| SPI2 | Number of occurrences related to wrong figures for loadsheet | ≤1/10,000 |
| SPI3 | Number of dangerous goods incidents | ≤1/10,000 |
| SPI4 | Number of aircraft damage occurrences | ≤1/100 |
| SPI5 | Number of personnel or passenger injuries | ≤1/1000 |
| SPI6 | Number of runway incursions/excursions | ≤1/10,000 |
| SPI7 | Number of training deficiencies | ≤1/1000 |
| SPI8 | Number of apron maintenance incidents | ≤1/1000 |
| SPI9 | Number of vehicle maintenance incidents | ≤1/1000 |
| SPI10 | Number of occurrences related to maneuvering area maintenance | ≤1/1000 |
| SPI11 | Number of occurrences related to communication | ≤1/10,000 |
| SPI12 | Number of incidents related to taxiing to/from apron | ≤1/1000 |
| SPI13 | Number of aircraft marshalling occurrences | ≤1/1000 |
| SPI14 | Number of occurrences related to FOD presence | ≤1/1000 |
| SPI15 | Number of occurrences related to passenger handling at the gate | ≤1/1000 |
| SPI16 | Number of occurrences related to passenger handling—disembarking/embarking | ≤1/1000 |
| SPI17 | Number of occurrences related to personal protective equipment | ≤1/1000 |
| SPI18 | Number of aircraft chocking incidents | ≤1/1000 |
| SPI19 | Number of aircraft conning incidents | ≤1/1000 |
| SPI20 | Number of occurrences related to baggage loading/unloading | ≤1/1000 |
| SPI21 | Number of occurrences related to ground traffic (GSE) and vehicle driving | ≤1/1000 |
| SPI22 | Number of anti-collision occurrences | ≤1/1000 |
| SPI23 | Number of engine start-up incidents | ≤1/1000 |
| SPI24 | Number of occurrences related to wildlife | ≤1/1000 |
| SPI25 | Number of occurrences related to fuel handling | ≤1/1000 |
1 Safety Performance Targets (SPTs): Number of occurrences versus number of aircraft operations.
Table 2.
Outlier root cause analysis for indicator SPI3.
| Time Point | Observed Value | Predicted Value | Outlier Probability | Root Causes |
|---|---|---|---|---|
| June 2017 | 0.00 | 1.06 | 1.00 | SPI5 |
| October 2019 | 3.00 | 2.01 | 1.00 | SPI13 |
| July 2015 | 1.00 | 0.02 | 1.00 | SPI23 |
| July 2019 | 1.00 | 0.03 | 1.00 | SPI1 |
| May 2015 | 1.00 | 0.03 | 1.00 | SPI16 |
| May 2016 | 1.00 | 0.15 | 1.00 | SPI17 |
| October 2015 | 0.00 | 0.65 | 0.97 | SPI20 |
Disclaimer/Publisher’s Note: The statements, opinions and data contained in all publications are solely those of the individual author(s) and contributor(s) and not of MDPI and/or the editor(s). MDPI and/or the editor(s) disclaim responsibility for any injury to people or property resulting from any ideas, methods, instructions or products referred to in the content. |
© 2023 by the authors. Licensee MDPI, Basel, Switzerland. This article is an open access article distributed under the terms and conditions of the Creative Commons Attribution (CC BY) license (https://creativecommons.org/licenses/by/4.0/).
Share and Cite
MDPI and ACS Style
Bartulović, D.; Steiner, S. Predictive Analysis of Airport Safety Performance: Case Study of Split Airport. Aerospace 2023, 10, 303. https://doi.org/10.3390/aerospace10030303
AMA Style
Bartulović D, Steiner S. Predictive Analysis of Airport Safety Performance: Case Study of Split Airport. Aerospace. 2023; 10(3):303. https://doi.org/10.3390/aerospace10030303
Chicago/Turabian StyleBartulović, Dajana, and Sanja Steiner. 2023. "Predictive Analysis of Airport Safety Performance: Case Study of Split Airport" Aerospace 10, no. 3: 303. https://doi.org/10.3390/aerospace10030303
Note that from the first issue of 2016, this journal uses article numbers instead of page numbers. See further details here.