Life Cycle Assessment of Honey: Considering the Pollination Service


Department of Economic Studies, University “G. d’Annunzio”, 65127 Pescara, Italy
*
Author to whom correspondence should be addressed.
Adm. Sci. 2019, 9(1), 27; https://doi.org/10.3390/admsci9010027
Submission received: 17 January 2019
/
Revised: 15 March 2019
/
Accepted: 22 March 2019
/
Published: 26 March 2019
(This article belongs to the Special Issue Industrial Ecology and Innovation)
Abstract
:Life Cycle Assessment (LCA) has been increasingly used for the improvement of the environmental performance of products and services, including food systems. Amongst them, however, honey appears to have been rarely analysed. Furthermore, the pollination by honeybees can be regarded as one of the functions of an apiculture system and is of utmost importance both for natural ecosystems and agriculture. When implementing an LCA of an apiculture system, the pollination service can and should be considered as one of the functions of a multifunctional system and the issue of how to deal with this multifunctionality in the modelling of that system should be considered carefully. The aim of this paper is to explore the economic value of pollination as a potential basis for managing multifunctionality in LCA modelling as well as its implementation in a case study. Economic allocation was performed between the pollination service and honey production. The results demonstrated that the production phase is the most impactful one for most of the environmental categories (due to the use of glass for the honey jars and electricity consumption during the storage of supers in refrigerator rooms), followed by the distribution phase. Finally, the most affected environmental impact category appeared to be natural land transformation, followed by marine ecotoxicity, freshwater eutrophication and human toxicity.
1. Introduction
Life Cycle Assessment (LCA) has become an increasingly popular methodology for the assessment of the environmental impacts of food supply-chains and the improvement of their environmental performance. Indeed, a great amount of agri-food LCAs and related reviews have been published in the literature (Arzoumanidis et al. 2013). However, amongst the food systems, apiculture appears to have been rarely analysed from a life-cycle perspective. Besides delivering physical products—typically: Honey, beeswax, propolis, etc., which are considered to have a great range of benefits for human health (Rao Pasupuleti et al. 2017)—beekeeping provides an additional function that is undoubtedly of utmost importance for both the natural ecosystems and agriculture: Pollination. This is a service provided to ecosystems. Indeed, the various ecosystems—both human-managed and natural-terrestrial—depend also on animal (especially insect) pollination (FAO 2018a); certainly, it is this service that is of utmost significance for a wide variety of foods, mainly horticultural crops. As regards agricultural crops, the importance of the animal pollination service cannot be underestimated (Klein et al. 2007; Crenna et al. 2015). Indeed, 84% of crops depend—at least to some degree—on animal pollination (e.g., entomophily or ornithophily) (Klein et al. 2007; Vaissière et al. 2008; Gallai et al. 2009), with watermelon, vanilla and cocoa being amongst the most dependent ones (Bailes et al. 2015). Most crops are actually able to produce yield to some extent even in the absence of insect pollination (Hanley et al. 2015), as for example anemophilous, parthenocarpic and self-fertile plants. Nevertheless, in its absence, the demand for agricultural land would increase (Aizen et al. 2009) or other inputs, such as labour, would have to be increased to compensate, thus involving higher costs (Southwick and Southwick 1992), though a perfect compensation would be hard to achieve (Pattemore and Wilcove 2012; Klein et al. 2014). Moreover, a decrease in bees’ population has been registered, mainly due to parasites, pesticides and climate change (e.g., Greenleaf and Kremen 2006; Klein et al. 2007; Majewski 2014; Champetier et al. 2015; Hanley et al. 2015; etc.), which could tamper with food supply and security (Bommarco et al. 2018; Candel and Biesbroek 2018; Chaplin-Kramer et al. 2014; FAO et al. 2017). Furthermore, the quality of the crops can also be enhanced by animal pollination (Bailes et al. 2015). Finally, the economic importance of the service was already acknowledged in the past: e.g., Cheung indicates the existence of hives rent contracts, in the United States, between beekeepers and farmers in order for the former to offer the service to the latter (Cheung 1973).
Given that pollination can be regarded as one of the functions of a beekeeping system, it is important to take it into consideration as such in LCA studies, as well. Indeed, when implementing an LCA of an apiculture system, the pollination service can be considered as one of the functions of a multifunctional system (other functions including, e.g., the provision of honey, beeswax, etc.). Whilst in LCA, in the analysis of a product system that provides a single function, the various environmental impacts are normally attributed to that sole function, their attribution to more than one function in a so-called multifunctional system can be more complicating. Therefore, the issue of how to deal with multifunctionality in the modelling of that system should be carefully considered.
When it comes to addressing the multifunctionality issue, various approaches are available (please refer to ISO 2006a). One of the most consolidated approaches, given its simplicity, is the use of allocation (even if it is not the first recommended option in the ISO standard cited above). The allocation can be performed either based on physical relations (e.g., mass, volume) or economic ones. In the case of a service (such as pollination) and given its immaterial nature, a physical relation cannot be appointed to it. Therefore, only economic allocation can be applied, by means of the economic values of the various co-products (amongst which is the pollination service) that are generated by the relevant multifunctional process.
For these reasons, the economic value of pollination—which may be much higher than that of honey itself (Eardley et al. 2006; Hein 2009)—can be regarded as a potential basis for managing multifunctionality in LCAs of apiculture systems. Giving a monetary value to a natural service, which is not tradable, can be somehow challenging (Majewski 2014; Munyuli 2014). However, several methods have been used or developed for such a task; these methods can generally be divided into market and non-market ones (Hanley et al. 2015). On one hand, the non-market methods may include the consumers’ willingness to pay (WTP) for environmental improvements or for avoiding a loss of pollinators (Hanley et al. 2015). On the other hand, the output of a crop depends on various inputs (e.g., labour, pesticides etc.) as well as on pollination services and stochastic factors, such as rainfall and temperature (ibid.). Commonly, the market value of pollination services reflects the way that their reduction can influence yields (Garratt et al. 2014). There is a plethora of market-based methods, including a dependence ratio (Gallai et al. 2009; Gallai and Vaissière 2009; Giannini et al. 2015; Hanley et al. 2015), yield analysis (Hanley et al. 2015), replacement costs (Hein 2009; Hanley et al. 2015), consumer surplus (Southwick and Southwick 1992; Hein 2009; Hanley et al. 2015), producer surplus (Hein 2009; Munyuli 2014) and combinations of the above methods (Hanley et al. 2015).
The objective of this article, which builds upon previous work (Arzoumanidis et al. 2016, 2017, 2018), is to deal with the multifunctionality in LCAs of apiculture systems when it comes to ecosystem services and honey and to address an application of this approach in a honey-related LCA case study, as this issue has been poorly tackled so far in the apiculture systems-related scientific literature (e.g., Kendall et al. 2013; Mujica et al. 2016, who focus only on carbon footprint and not on a full LCA). Nonetheless, the issue of multifunctionality, including the provision of services to ecosystems, was found to have been investigated in another sector, e.g., Kiefer et al. (2015) for dairy systems, who also focus only on carbon footprint.
This paper is structured as follows: In Section 2, the methodological issues related to the inclusion of the pollination service in a honey case study are presented in the framework of an LCA implementation (LCA phases: Goal and scope definition, life cycle inventory). In Section 3, the results of the LCA implementation are presented and discussed (LCA phases: Life cycle impact assessment, interpretation). Finally, some concluding remarks along with future developments are described in Section 4.
2. Materials and Methods
The case study presented here was performed with the aid of the SimaPro LCA software (Pré 2018), following the ISO 14040:2006 and 14044:2006 international standards (ISO 2006a, 2006b).
2.1. Goal and Scope Definition
The aim of the study was to identify the most critical phases of the life cycle of orange-blossom honey from an environmental point of view as well as the environmental impacts mostly affected by the examined product system. The intended audience of this study would be scientists, beekeeping companies and consumers. The Functional Unit (F.U.) was defined as a 250-g jar of honey including its primary, secondary and tertiary packaging. Furthermore, the system boundary included the following life cycle stages: Honey production and collection, processing, packaging, distribution and waste treatment. It can thus be called a “cradle-to-grave” analysis. For a simplified flow chart of the life cycle of honey under study please refer to Figure 1.
As regards the multifunctionality issue, the various functions of the system were identified as follows: Production of honey and beeswax (which returned as an input to the system, in the “hive placement” phase) and provision of the pollination service. This issue was attempted to be dealt with via economic allocation.
2.2. Life Cycle Inventory (LCI)
The LCI data were collected on-site for the year 2013 at a firm situated in Italy. The hives containing the honeybees (Apis mellifera) were initially transported and placed near an orange grove located at a distance of 180 km. The trip was repeated for a few times in order to perform regular controls, using a van. The data for all necessary inputs and the relevant processes, such as transport-related fuel consumption, wood and paint for the hives structure, bee-specific medicines, etc., and their respective packaging and transport (where applicable) were collected on-site or carefully selected from the Ecoinvent 2.2 database (Ecoinvent Center 2019), which is integrated in the software used. As far as the medicines are concerned, the relevant processes were selected on the basis of the various ingredients. One ingredient of the medicines, namely oxalic acid, had to be excluded from the calculations for both its production and its post-metabolic fate, since it was not found in the software database. Moreover, it has to be highlighted that this is the phase in the product life cycle where the pollination service occurs, as well. As aforementioned, it was decided to apply an economic allocation between the pollination service and the product “honey” based on the values of these co-products. In Section 2.2.1, a detailed description of how the estimation of the pollination economic value was carried out is outlined.
In the next step of the life cycle, the beekeepers bring the hives back to the apiculture firm for the supers extraction phase and their storage. Here, primary inputs such as the necessary gloves, lab coats, uniforms and internal handling were included. As far as the internal transport is concerned, the electricity consumption for the electric forklifts was taken into account.
The honeycombs are then uncapped in the successive phase. Here, the energy consumption (electricity: Low voltage, obtained by the Italian national grid) for machines, such as the uncapping machine, a press, a centrifuge and a conveyor belt as well as inputs regarding the filtration sub-phase, were included. At the end of the uncapping sub-phase, a specific amount of beeswax is obtained, which, after being processed at the premises of a firm in the region of Piedmont (Italy), returns to the beekeeping company as an input for the first stage (as aforementioned). Here, all transports (using a lorry) to and from the beekeeping company were taken into consideration. These inputs were easily introduced in the software.
Once the honey is obtained, it is packaged using a glass jar, a plastic/aluminium lid and a paper label (as primary packaging), a cardboard box and adhesive tape (as secondary packaging) and a plastic film and pallets (as tertiary packaging). The relevant entries as well as their eventual packaging materials and transport were found in the software without any obstacles.
The product is then distributed to its consumers, who reside both in Italy and abroad (i.e., the USA and France). All required transport was taken into account: The trips within Italy and to France are performed by lorries and ships (where necessary, e.g., to Sicily), whilst the ones to the United States are carried out by airplane. Transports from the distribution hub to local retailers have been excluded from the analysis. The last phase includes the waste management of the final product, i.e., its packaging, since the product itself is consumed via the human metabolism (use phase).
Finally, regarding the data quality of this study, the method used by following the ILCD Handbook data quality indicators (European Commission 2010a) resulted in a “basic quality” score. For a complete list of the intermediate flows (inputs and outputs) taken into account in the LCI phase, please refer to Table 1.
2.2.1. Estimation of the Economic Value of the Pollination Service
The economic allocation was performed for the first phase of the product life cycle (hive placement). Given that the two products of this phase were honey and the pollination service, their economic value per F.U. had to be calculated. The economic value of honey was obtained directly by the beekeeping company (sales value). On the other hand, since the company did not receive any remuneration for the pollination service for the specific case study and no market value could be retrieved for orange tree pollination in Italy, its economic value (EVIP) was calculated by using the equation proposed by Gallai and Vaissière (2009) for the Dependence Ratio method:
where:
EVIP = TVC * DR
- TVC is the total value of crop, calculated as the product of the unit producer price (economic value/mass) times the production (mass), and
- DR is the dependence ratio of that crop upon pollination.
Since this study deals with orange-blossom honey, oranges are the relevant crop. As far as the calculation of TVC for Italian oranges is concerned: (a) For the unit producer price, no data were found for Italy. Therefore, based on Gallai and Vaissière (2009), data from the FAO statistics website (FAO 2018b) were acquired for Spain (the most important producing country of the relevant world region), by calculating the average for the year 2013; and (b) the Italian production of oranges in 2013 was obtained through the same source. As far as DR is concerned, the dependence upon animal pollination for oranges was taken from the tool (FAO 2018c) proposed by Gallai and Vaissière (2009).
Equation (1) thus gave:
EVIP = TVC * DR = [246.5 (US$/t) * 1,700,778 t] * 0.05 = US$ 20,945,081 or € 19,279,440 (exchange rate: 05/2017).
In order for EVIP to be transformed as per F.U. and under the assumption that all orange pollination for that year derived from domesticated honeybees, the total orange-blossom honey production in Italy (or from citrus fruit, in general) had to be obtained; however, no specific data were found. In order to estimate it, the total honey production in Italy for 2013—that is 9,500,000 kg (OSN 2017)—was considered. Furthermore, in a case study concerning an Italian region, the average percentage of citrus fruit honey with respect to the total honey production was reported as 30% (Strano et al. 2015). Nonetheless, since the sample of firms taken into account in the cited case study was not specified, assuming the above percentage in calculations could introduce uncertainty in the results and their interpretation. In order to address that issue, a sensitivity analysis was carried out on the assumed percentage of 30%, by considering nine different percentages: 10%, 20%, 30%, 40%, 50%, 60%, 70%, 80% and 90% (0% and 100% were excluded because, in fact, these cannot be applicable in Italy). For each one of the assumptions, the calculations were made as follows: Given that the percentage of oranges in citrus fruit in Italy was calculated as 62.67% (ISTAT 2014), the economic value of the pollination service per F.U. (i.e., per jar) could then be calculated as well, by using Equation (1). The economic allocation was therefore performed for the two values: One for honey and one for the pollination service.
3. Results and Discussion
3.1. Life Cycle Impact Assessment (LCIA)
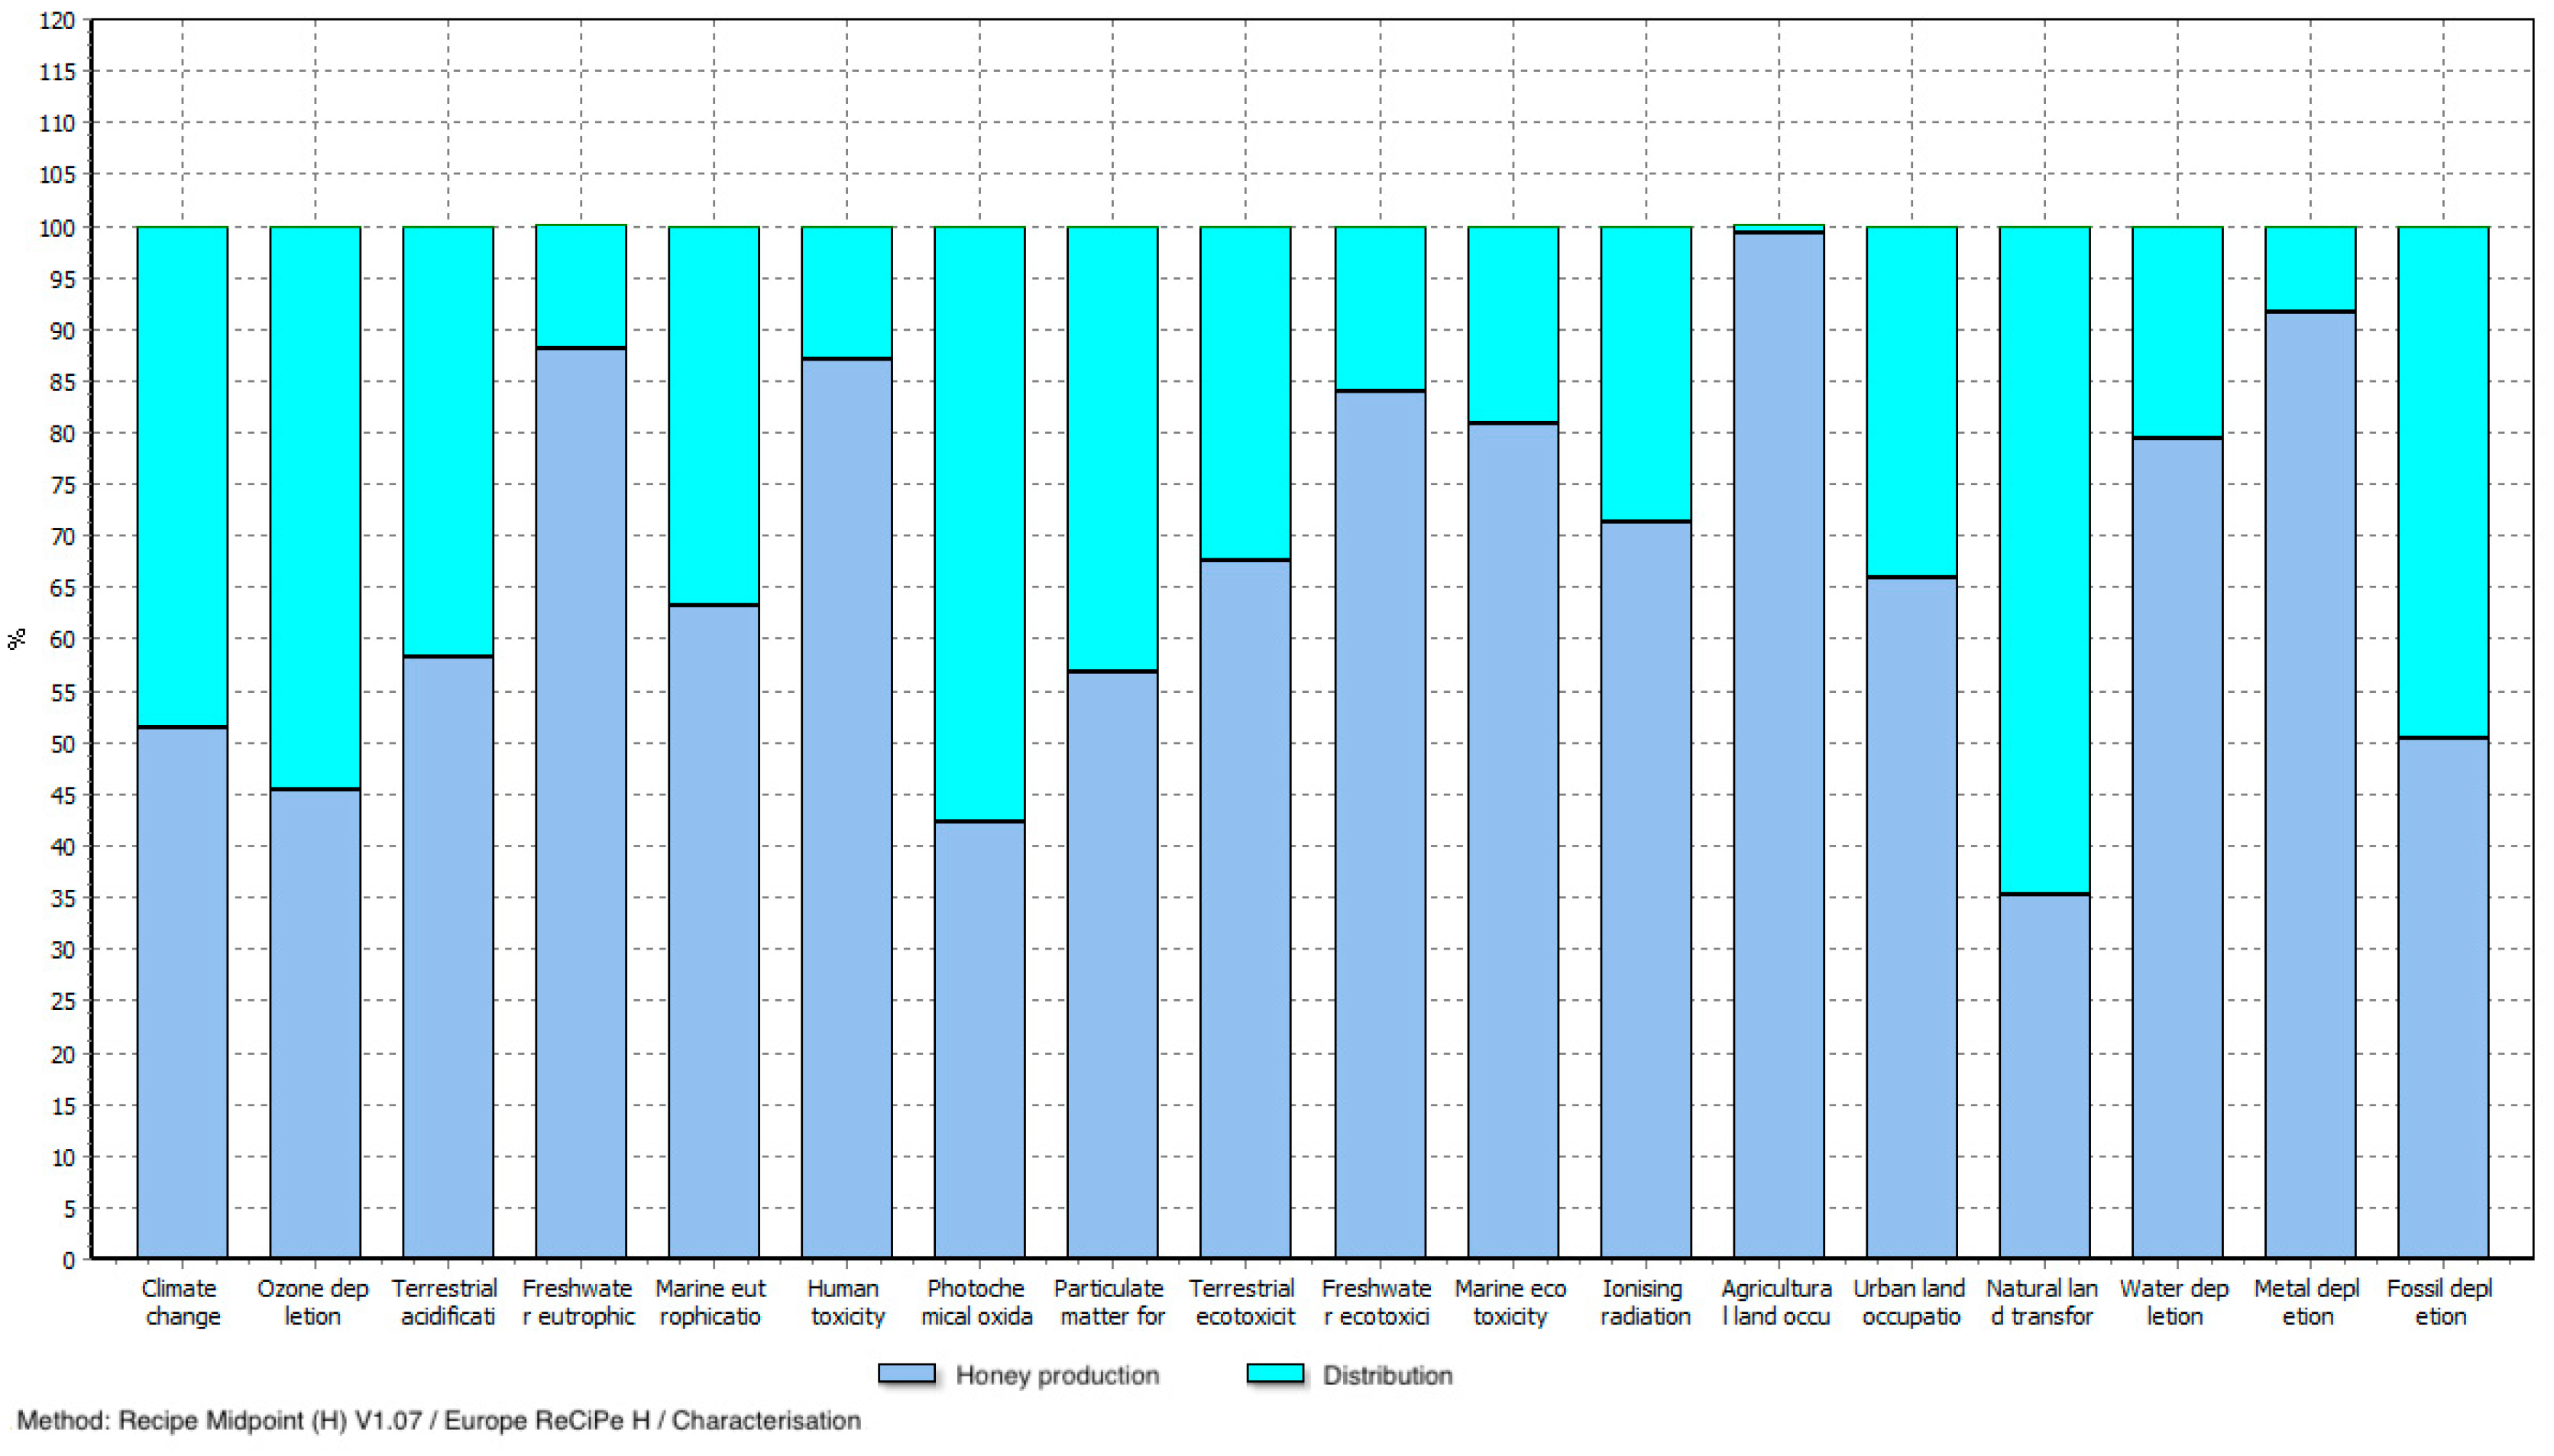
For this LCA case study, the calculations were performed by using the ReCiPe Midpoint (H) method (Goedkoop et al. 2009). Therefore, the environmental impact categories taken into consideration were the ones selected by this method. In this part, the classification, characterisation and normalisation (calculated per European citizen) phases of the life cycle impact assessment (LCIA) were carried out. When it came to the allocation coefficients, these referred to 59.26% of the environmental impacts that were allocated to honey and 40.74% to the pollination service (for the 30% assumption, regarding the percentage of citrus fruit honey with respect to the total honey production). An example of the results (always for the 30% assumption) of the characterisation step is shown in Figure 2 (as these were exported from the software) and reported in Table 2. The impacts for the various environmental impact categories are shown for the different life cycle phases, honey production (including hive placement, supers extraction & storage, honey extraction and packaging), distribution and waste management, thus providing information on the hotspots in the life cycle of the product. The results demonstrated that the production phase is the most impactful one for most of the environmental categories, followed by the distribution phase. A deeper examination via a contribution analysis in a product improvement perspective (European Commission 2010b) of the results via the software showed that the most responsible aspect within the production phase was the use of glass for the honey jars and the electricity consumption during the storage of supers in refrigerator rooms before they were used for each new cycle (see for example Table 3, Table 4 and Table 5). Regarding the distribution phase, the trip to the United States by airplane was the most impactful one. Furthermore, a comparison was made between the 30% assumption and the case where the pollination service was not taken into consideration at all. This showed a decrease in the environmental impact of the product (honey) for all environmental impact categories when economic allocation was taken into account due to the fact that a part of the impact was accounted for the by pollination service: e.g., 5.94% decrease for climate change, 16% for marine eutrophication, 12.34% for human toxicity, 8.84% for freshwater eutrophication, etc.
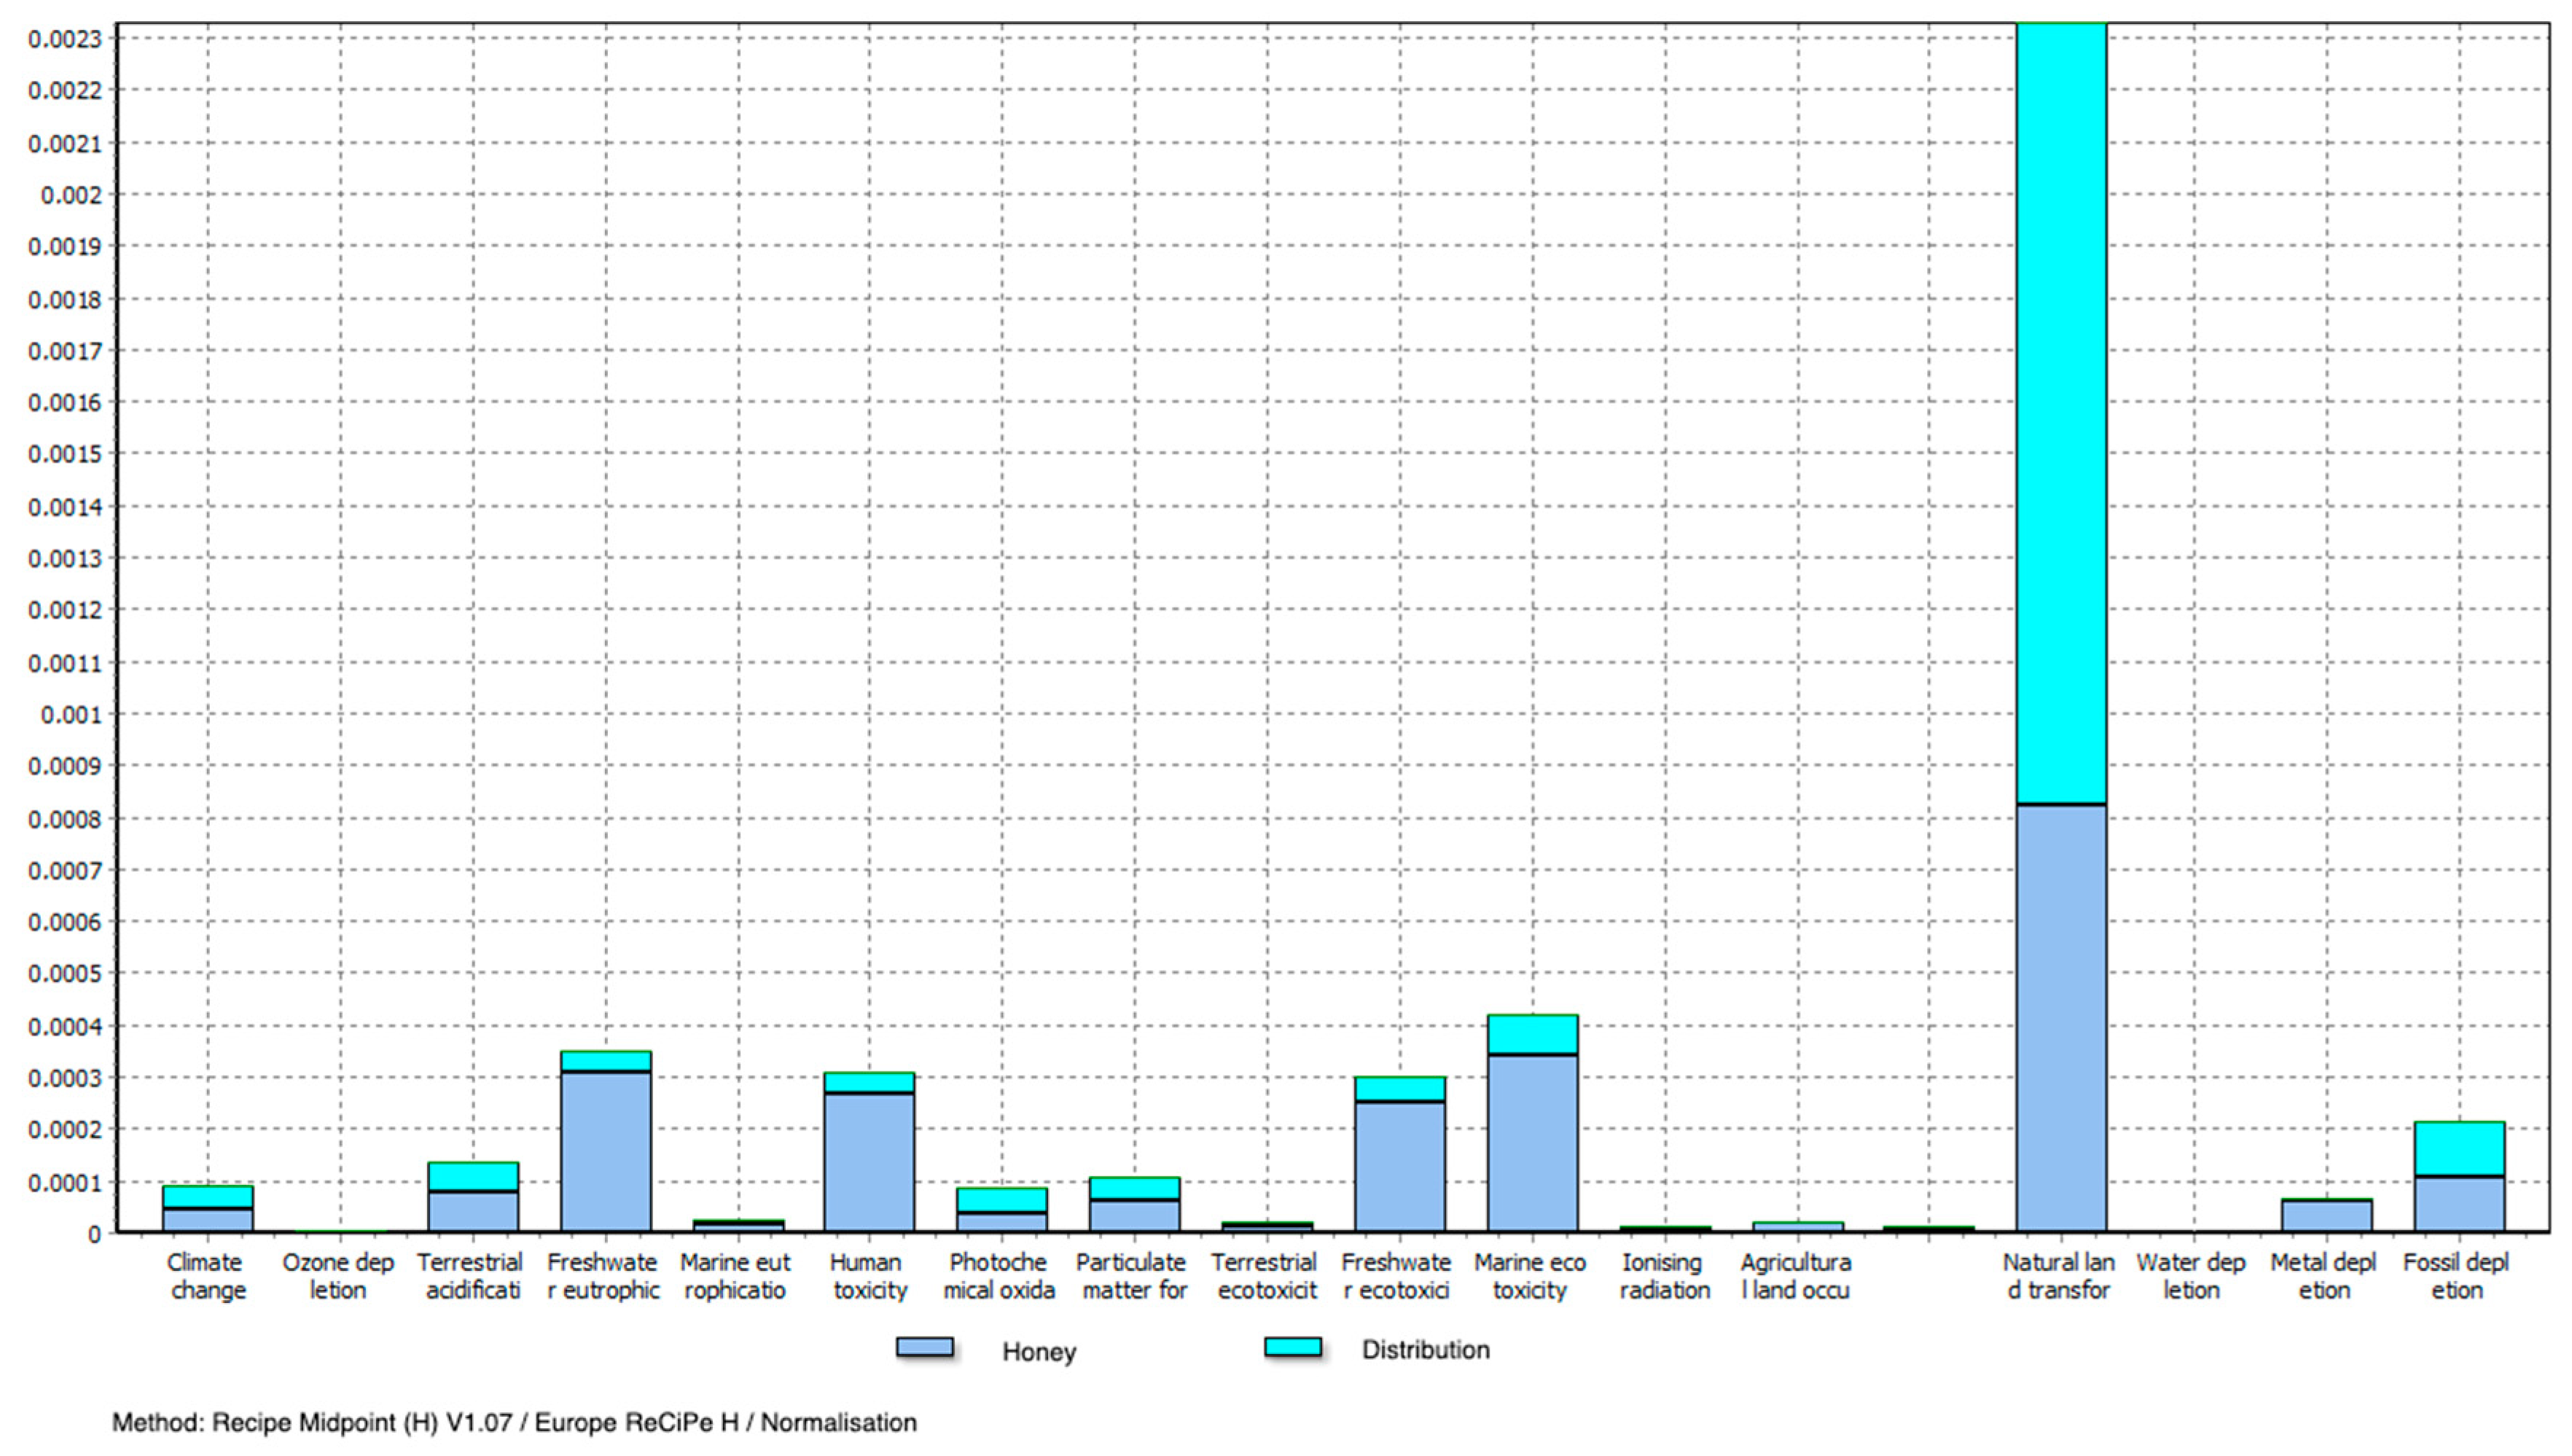
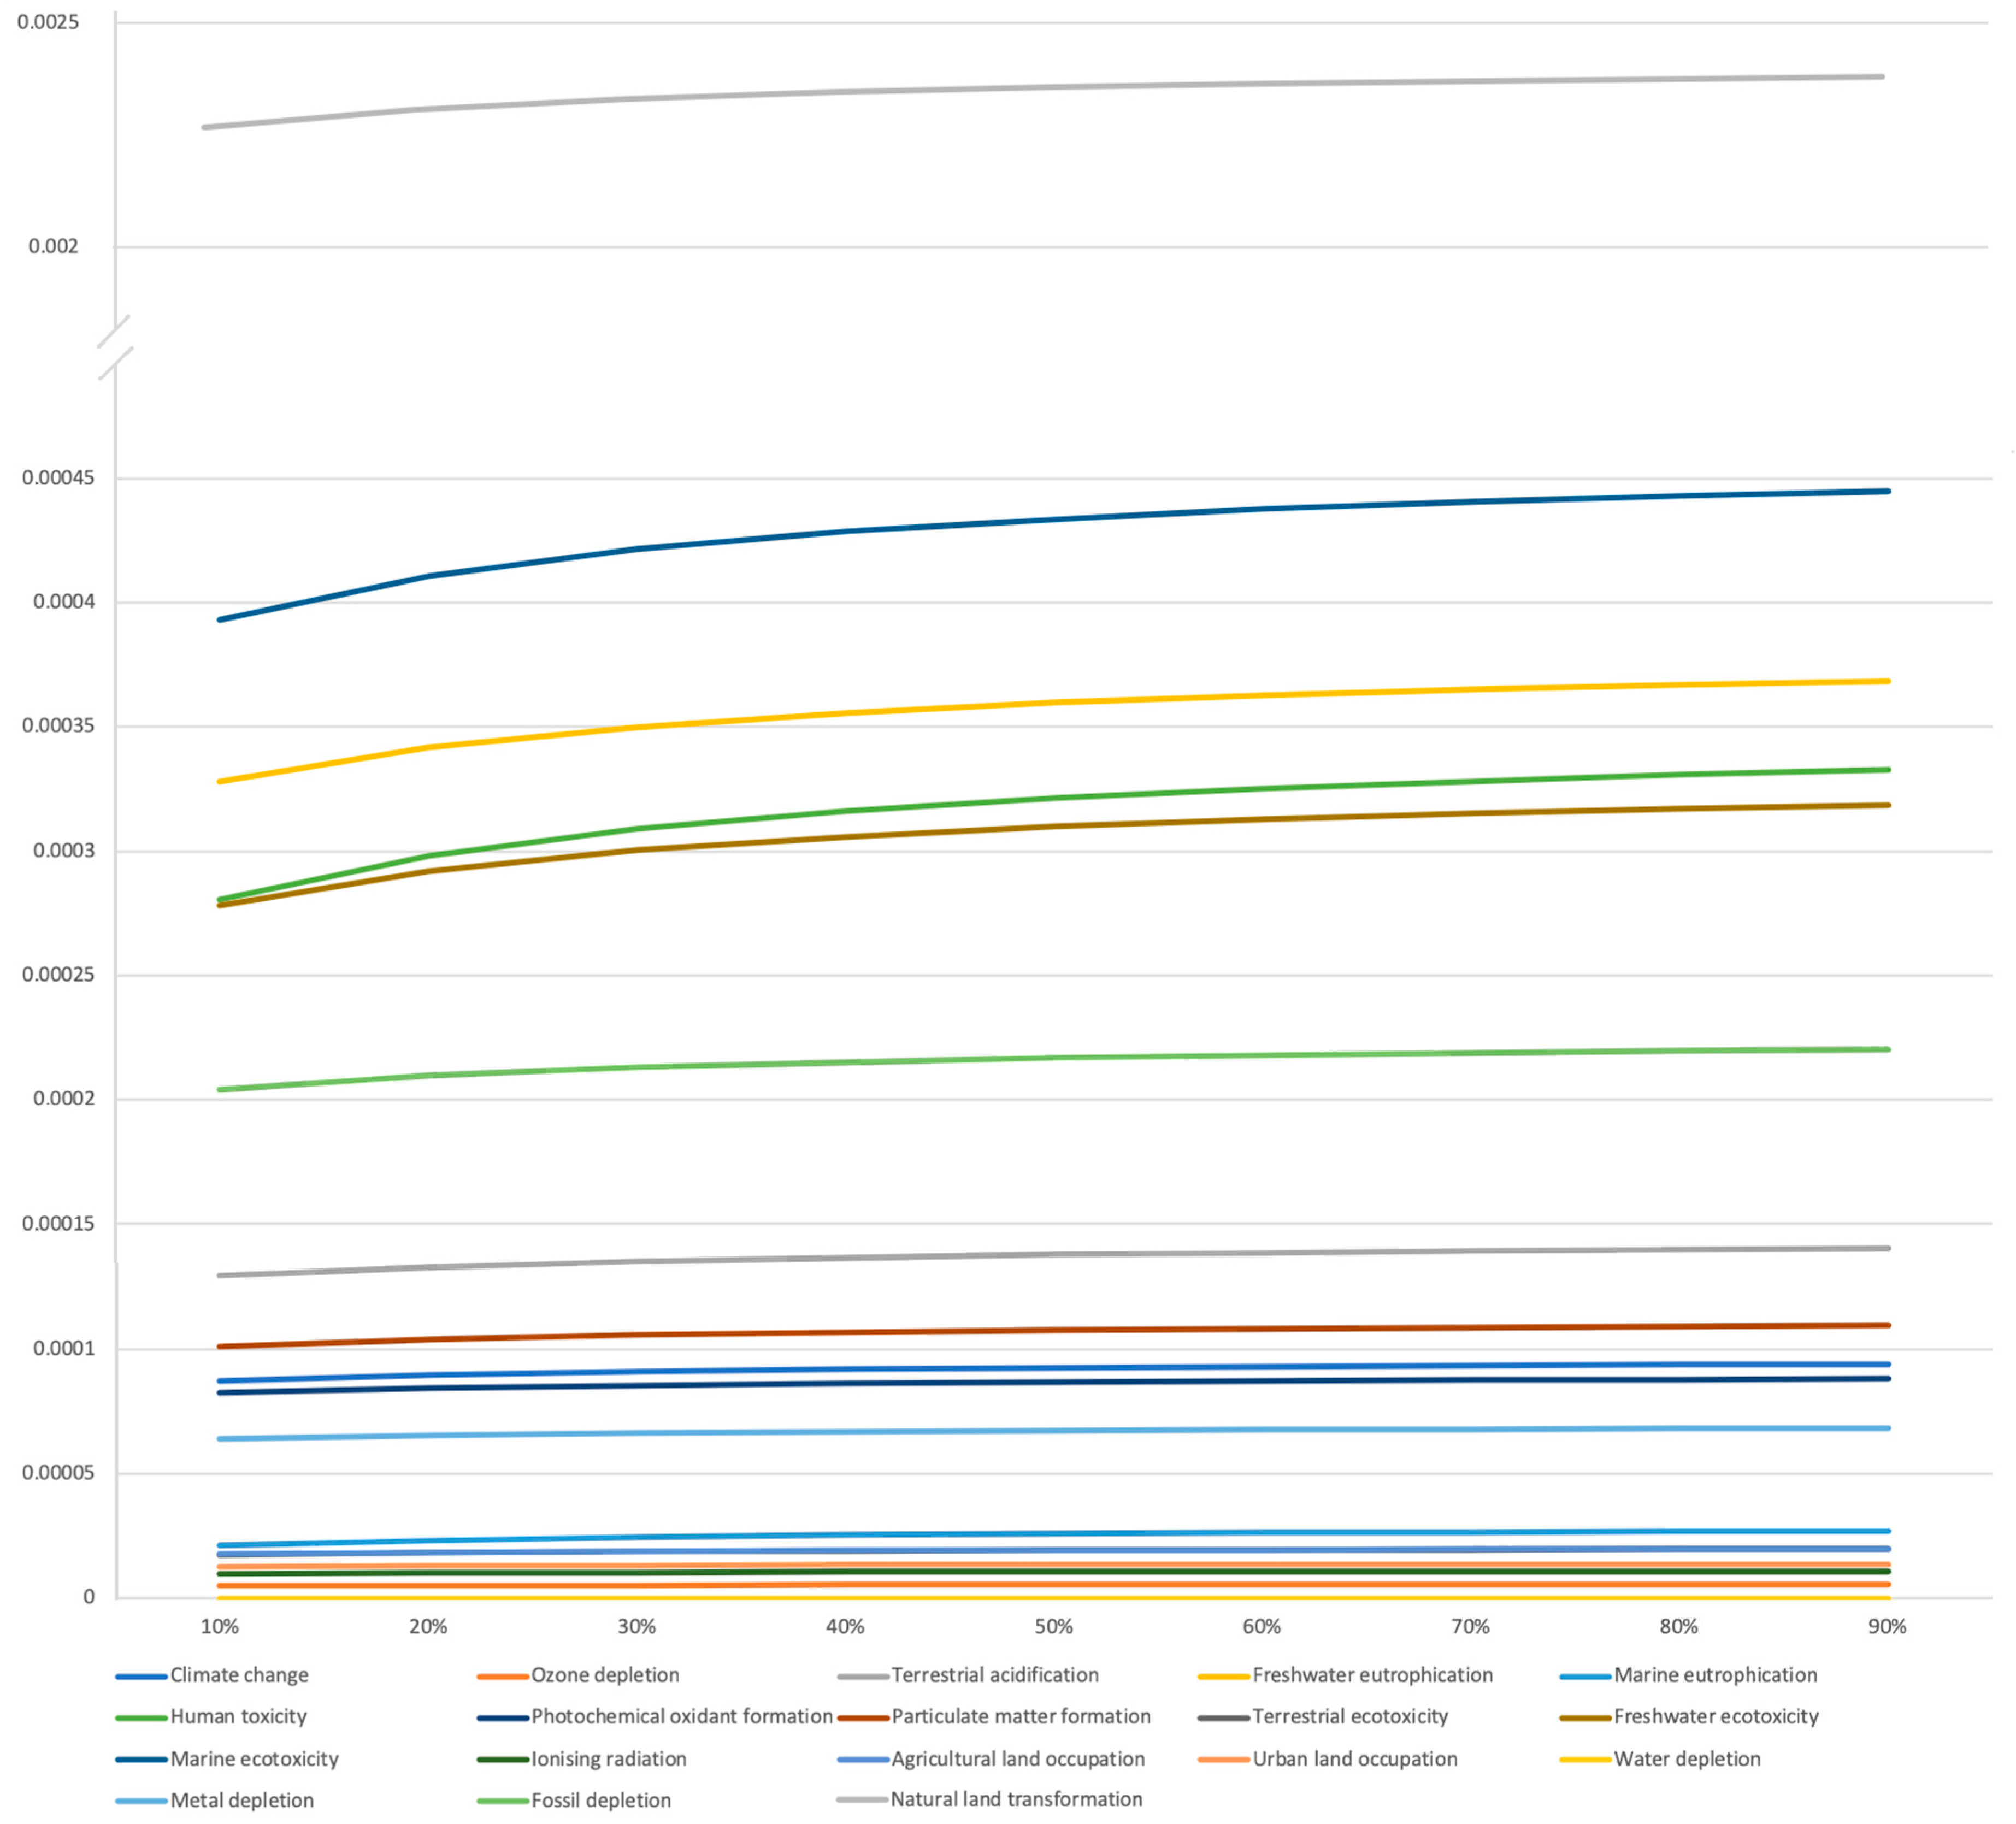
As far as the normalisation results are concerned, the most affected environmental impact category appeared to be natural land transformation, followed by marine ecotoxicity, freshwater eutrophication and human toxicity. The normalisation results for the 30% assumption are presented in Figure 3, whilst the results for all nine assumptions are reported in Figure 4.
3.2. Sensitivity Analysis
The nine assumptions were analysed in order to identify the importance for this case study of the percentage of citrus fruit honey within honey production in Italy. The results (see Figure 4) showed that higher percentages mean higher environmental impacts allocated for the product (honey) for all environmental categories. This can be explained by the fact that higher percentages of citrus fruit honey result in a lower unit value for the pollination service (per kg of honey), whilst the EVIP value remains constant; this results in lower allocation percentages for the pollination service. In other words, if EVIP is divided by the total quantity of orange-blossom honey (VH) in order to produce the cost of pollination per jar: EVIP/VH, then this fraction (unit value) will decrease as the percentages of citrus fruit honey increase (reflecting the denominator of the fraction).
4. Conclusions
This article tackled the inclusion of the pollination service in honey LCA studies, as one of the functions of an apiculture system. Given the multifunctionality of the beekeeping system, an attempt was made to include the pollination service in an LCA case study in Italy. In order for this issue to be dealt with, the use of economic allocation was decided on between the main product (honey) and the pollination service.
The implementation of the LCA methodology showed a decrease in the environmental impact for the product (honey) when economic allocation was taken into account for all environmental impact categories due to the fact that a part of the impact was accounted for by the pollination service. When it comes to the product life cycle, the production phase and the distribution phase appeared to be the most impactful phases. Regarding production, it was the electricity consumption in the refrigerator rooms as well as the use of glass for the packaging of the final product that were found to be the most impactful ones, whereas for the distribution phase the airplane trip to the United States was found to be the most responsible. As far as the environmental impact categories are concerned, natural land transformation was the most influenced, followed by marine ecotoxicity, freshwater eutrophication and human toxicity.
The sensitivity analysis for the missing datum showed a linearity of the results; in other words, the order of importance of the various environmental impact categories did not depend on it. Nonetheless, in order for more reliable quantitative results to be obtained, an accurate calculation is required. Future developments may include the implementation of economic allocation for this and other types of honey in order for robust conclusions to be drawn with regard to these methodological hypotheses. Other methods, as the ones described in the Introduction, may also be explored for the calculation of the economic value of the pollination service in order to assess their influence on the results. Moreover, alternative means of transport (e.g., ship) may be explored and analysed in order to substitute the high-impact trip by airplane to the United States that was identified in Section 3.1 (distribution phase). Finally, other methods for dealing with the multifunctionality issue, which are suggested by the ISO standards (e.g., system expansion), may be used in order to verify the robustness of the results.
Author Contributions
Data curation, I.A.; Methodology, I.A., A.R. and L.P.; Software, I.A.; Supervision, A.R. and L.P.; Validation, A.R. and L.P.; Writing—original draft, I.A.
Funding
This research received no external funding.
Conflicts of Interest
The authors declare no conflict of interest.
References
- Aizen, Marcello, Lucas Garibaldi, Saul Cunningham, and Alexandra Klein. 2009. How much does agriculture depend on pollinators? Lessons from long-term trends in crop production. Annals of Botany 103: 1579–88. [Google Scholar]
- Arzoumanidis, Ioannis, Luigia Petti, Andrea Raggi, and Alessandra Zamagni. 2013. Life Cycle Assessment (LCA) for the agri-food sector. In Product-Oriented Environmental Management System (POEMS)—Improving Sustainability and Competitiveness in the Agri-Food Chain with Innovative Environmental Management Tools. Edited by Roberta Salomone, Maria Teresa Clasadonte, Maria Proto and Andrea Raggi. Dordrecht: Springer, pp. 105–22. [Google Scholar]
- Arzoumanidis, Ioannis, Andrea Raggi, and Luigia Petti. 2016. The role of pollination in the LCA studies of honey. Paper presented at the 10th International Conference on Life Cycle Assessment of Food—Book of Abstracts, Dublin, Ireland, October 19–21. [Google Scholar]
- Arzoumanidis, Ioannis, Andrea Raggi, and Luigia Petti. 2017. Environmental Assessment of Beekeeping Products and Services—A Life Cycle Assessment Case Study including Honey and Pollination. Paper presented at the 10th Congress of the Hellenic Society of Agricultural Engineers “The Contribution of Agricultural Engineering to the Development of the Greek Agriculture”, Athens, Greece, September 28–29; pp. 426–35. [Google Scholar]
- Arzoumanidis, Ioannis, Andrea Raggi, and Luigia Petti. 2018. The inclusion of the Pollination Service in Life Cycle Assessment of Beekeeping Products. Paper presented at the 24th International Sustainable Development Research Society Conference (ISDRS 2018), Messina, Italy, June 13–15; Actions for a Sustainable World: From Theory to Practice—Book of Abstracts. p. 154. [Google Scholar]
- Bailes, Emily J., Jeff Ollerton, Jonathan G. Pattrick, and Beverley J. Glover. 2015. How can an understanding of plant-pollinator interactions contribute to global food security? Current Opinion in Plant Biology 26: 72–79. [Google Scholar] [CrossRef] [PubMed]
- Bommarco, Riccardo, Giulia Vico, and Sara Hallin. 2018. Exploiting ecosystem services in agriculture for increased food security. Global Food Security 17: 57–63. [Google Scholar] [CrossRef]
- Candel, Jeroen J. L., and Robbert Biesbroek. 2018. Policy integration in the EU governance of global food security. Food Security 10: 195–209. [Google Scholar] [CrossRef] [Green Version]
- Champetier, Antoine, Daniel A. Sumner, and James E. Wilen. 2015. The bioeconomics of honey bees and pollination. Environmental and Resource Economics 60: 143–64. [Google Scholar] [CrossRef]
- Chaplin-Kramer, Rebecca, Emily Dombeck, James Gerber, Katherine A. Knuth, Nathaniel D. Mueller, Megan Mueller, Guy Ziv, and Alexandra-Maria Klein. 2014. Global malnutrition overlaps with pollinator-dependent micronutrient production. Proceedings of the Royal Society B 281: 20141799. [Google Scholar] [CrossRef] [PubMed]
- Cheung, Steven. 1973. The fable of the bees: An economic investigation. Journal of Law and Economics 16: 11–33. [Google Scholar]
- Crenna, Eleonora, Serenella Sala, Chiara Polce, and Elena Collina. 2015. Pollinators in LCA: Towards a framework for impact assessment. Paper presented at the International Conference on Life Cycle Assessment as Reference Methodology for Assessing Supply Chains and Supporting Global Sustainability Challenges, Stresa and Milan, Italy, October 6–8; pp. 307–10. [Google Scholar]
- Eardley, Connal, Dana Roth, Julie Clarke, Stephen Buchmann, and Barbara Gemmill. 2006. Pollinators and Pollination: A Resource Book for Policy and Practice. Pretoria: African Pollinator Initiative (API). [Google Scholar]
- Ecoinvent Center. 2019. Ecoinvent Center—Database. Available online: http://www.ecoinvent.org/database/older-versions/ecoinvent-version-2/ecoinvent-version-2.html (accessed on 11 March 2019).
- European Commission. 2010a. International Reference Life Cycle Data System (ILCD) Handbook—Specific guide for Life Cycle Inventory Data Sets. First edition March 2010. EUR 24709 EN. Luxembourg: Publications Office of the European Union. [Google Scholar]
- European Commission. 2010b. International Reference Life Cycle Data System (ILCD)—Guide for Life Cycle Assess Using the Equation Proment—Detailed Guidance. First edition March 2010. EUR 24708 EN. Luxembourg: Publications Office of the European Union. [Google Scholar]
- FAO. 2018a. Biodiversity—Pollinators. Available online: http://www.fao.org/biodiversity/components/pollinators/en/ (accessed on 10 June 2018).
- FAO. 2018b. Food and Agriculture Organization of the United Nations—FAOSTAT. Available online: http://www.fao.org/faostat/en/#home (accessed on 10 May 2018).
- FAO. 2018c. Tool for Valuation of Pollination Services at a National Level. Available online: http://www.fao.org/fileadmin/user_upload/pollination/docs/POLLINATION_VALUE_ARRAY.xls (accessed on 1 July 2018).
- FAO, IFAD, UNICEF, WFP, and WHO. 2017. The State of Food Security and Nutrition in the World 2017. Building Resilience for Peace and Food Security. Rome: Food and Agriculture Organization of the United Nations (FAO). [Google Scholar]
- Gallai, Nicola, and Bernard E. Vaissière. 2009. Guidelines for the Economic Valuation of Pollination Services at a National Scale. Rome: Food and Agriculture Organization of the United Nations (FAO). [Google Scholar]
- Gallai, Nicola, Jean-Michel Salle, Josef Settele, and Bernard E. Vaissière. 2009. Economic valuation of the vulnerability of world agriculture confronted with pollinator decline. Ecological Economics 68: 810–21. [Google Scholar] [CrossRef]
- Garratt, Michael P. D., Tom D. Breeze, Nigel Jenner, Chiara Polce, Jacobus C. Biesmeijer, and Simon G. Potts. 2014. Avoiding a bad apple: Insect pollination enhances fruit quality and economic value. Agriculture, Ecosystems and Environment 184: 34–40. [Google Scholar] [CrossRef] [PubMed]
- Giannini, Tereza C., Antonio M. Saraiva, V. L. Imperatriz-Fonseca, Guaraci D. Cordeiro, and Breno M. Freitas. 2015. The dependence of crops for pollinators and the economic value of pollination in Brazil. Journal of Economic Entomology 108: 849–57. [Google Scholar] [CrossRef] [PubMed]
- Goedkoop, Mark, Reinout Heijungs, Mark Huijbregts, An D. Schryver, Jaap Struijs, and Rosalie van Zelm. 2009. ReCiPe 2008, A life Cycle Impact Assessment Method Which Comprises Harmonised Category Indicators at the Midpoint and Endpoint Level, First edition. Report I: Characterisation. The Hague: Dutch Ministry of Housing, Spatial Planning and Environment (VROM), Available online: http://www.lcia-recipe.net (accessed on 16 May 2018).
- Greenleaf, Sarah S., and Claire Kremen. 2006. Wild bees enhance honey bees’ pollination of hybrid sunflower. Proceedings of the National Academy of Sciences of the United States of America 103: 13890–95. [Google Scholar] [CrossRef] [PubMed]
- Hanley, Nick, Tom D. Breeze, Ciaran Ellis, and David Goulson. 2015. Measuring the economic value of pollination services: Principles, evidence and knowledge gaps. Ecosystem Services 14: 124–32. [Google Scholar] [CrossRef]
- Hein, Lars. 2009. The economic value of the pollination service, a review across scales. The Open Ecology Journal 2: 74–82. [Google Scholar] [CrossRef]
- ISO. 2006a. ISO 14040:2006. Environmental Management—Life Cycle Assessment—Principles and Framework, 2nd ed. Geneva: International Organisation for Standardisation. [Google Scholar]
- ISO. 2006b. ISO 14044:2006. Environmental Management—Life Cycle Assessment Requirements and Guidelines. Geneva: International Organisation for Standardisation. [Google Scholar]
- ISTAT. 2014. Le Principali Coltivazioni Legnose. Annata Agraria 2011/2012. Rome: Italian National Statistical Institute. (In Italian) [Google Scholar]
- Kendall, Alissa, Juhong Yuan, and Sonja B. Brodt. 2013. Carbon footprint and air emissions inventories for US honey production: case studies. International Journal of Life Cycle Assessment 18: 392–400. [Google Scholar] [CrossRef]
- Kiefer, Robert, Friederike Menzel, and Enno Bahrs. 2015. Integration of ecosystem services into the carbon footprint of milk of South German dairy farms. Journal of Environmental Management 152: 11–18. [Google Scholar] [CrossRef] [PubMed]
- Klein, Alexandra-Maria, Bernard E. Vaissière, James H. Cane, Ingolf S. Dewenter, Saul A. Cunningham, Claire Kremen, and Teja Tscharntke. 2007. Importance of pollinators in changing landscapes for world crops. Proceedings of the Royal Society B—Biological Sciences 274: 303–13. [Google Scholar] [CrossRef]
- Klein, Alexandra-Maria, Clough Steve Hendrix, A. Yann Scofield, and Kremen Claire. 2014. Interacting effects of pollination, water and nutrients on fruit tree performance. Plant Biology 17: 201–8. [Google Scholar] [CrossRef] [PubMed]
- Majewski, Janusz. 2014. Economic value of pollination of major crops in Poland in 2012. Paper presented at the Economic Science for Rural Development Conference "Production and Co-Operation in Agriculture", Jelgava, Latvia, April 26–27; pp. 14–21. [Google Scholar]
- Mujica, Maria, Gabriel Blanco, and Estela Santalla. 2016. Carbon footprint of honey produced in Argentina. Journal of Cleaner Production 116: 50–60. [Google Scholar] [CrossRef]
- Munyuli, Bin M. T. 2014. Social and ecological drivers of the economic value of pollination services delivered to coffee in central Uganda. Journal of Ecosystems 2014: 1–23. [Google Scholar] [CrossRef]
- OSN. 2017. Il valore della Terra. In Agricoltura e nuova ruralità—Economia e sostenibilità—Qualità e Consumo Consapevole. Report 2/2016. Bologna: Italian National Honey Observatory (OSN). (In Italian) [Google Scholar]
- Pattemore, David, and David Wilcove. 2012. Invasive rats and recent colonist birds partially compensate for the loss of endemic New Zealand pollinators. Proceedings of the Royal Society B 279: 1597–605. [Google Scholar] [CrossRef] [PubMed]
- Pré. 2018. Sustainability Software for Fact-Based Decision Making. Available online: https://www.pre-sustainability.com/simapro (accessed on 5 July 2018).
- Rao Pasupuleti, Visweswara, Lakhsmi Sammugam, Nagesvari Ramesh, and Siew Hua Gan. 2017. Honey, propolis, and royal jelly: A comprehensive review of their biological actions and health benefits. Oxidative Medicine and Cellular Longevity 2017: 1–21. [Google Scholar] [CrossRef] [PubMed]
- Southwick, Edward E., and Lawrence Southwick Jr. 1992. Estimating the economic value of honey bee (Hymenoptera: Apidae) as agricultural pollinators in the United States. Journal of Economic Entomology 85: 621–33. [Google Scholar] [CrossRef]
- Strano, Alfio, Teodora Stillitano, Anna I. De Luca, Giacomo Falcone, and Giovanni Gulisano. 2015. Profitability analysis of small-scale beekeeping firms by using Life Cycle Costing (LCC) methodology. American Journal of Agricultural and Biological Sciences 10: 116–27. [Google Scholar] [CrossRef]
- Vaissière, Bernard, Jean-Michel Salles, and Josef Settele. 2008. Economic value of insect pollination worldwide. International Pest Control 50: 240. [Google Scholar]
Figure 1.
Simplified life cycle flow chart of the product under study (orange-blossom honey—elaborated by the authors).
Figure 1.
Simplified life cycle flow chart of the product under study (orange-blossom honey—elaborated by the authors).

Figure 2.
Characterisation results—extracted from SimaPro (Pré 2018).
Figure 2.
Characterisation results—extracted from SimaPro (Pré 2018).

Figure 3.
Normalisation results for the 30% assumption—extracted from SimaPro (Pré 2018).
Figure 3.
Normalisation results for the 30% assumption—extracted from SimaPro (Pré 2018).

Figure 4.
Normalisation results for the various assumptions—extracted from SimaPro (Pré 2018) and elaborated by the authors.
Figure 4.
Normalisation results for the various assumptions—extracted from SimaPro (Pré 2018) and elaborated by the authors.


Table 1.
LCI phase: Data collection inputs and outputs—intermediate flows (elaborated by the authors).
Table 1.
LCI phase: Data collection inputs and outputs—intermediate flows (elaborated by the authors).
| Life Cycle Phases | Inputs | Outputs |
|---|---|---|
| Hive placement | Beehives Queen bee/beehive Wooden frame Beehive paint Supplementary food Beeswax Medicines Electricity (cold room refrigeration) Beehives transport Internal transport Medicines transport Paint transport | Beehives filled with honey Waste:
|
| Supers extraction | Uniform Gloves Beehives filled with honey Honeycombs transport Uniform transport Gloves transport | Supers with sealed honeycombs Waste:
|
| Supers storage | Supers with sealed honeycombs Lab coats Lab coats transport Internal transport | Supers ready to be processed Waste:
|
| Uncapping | Supers ready to be processed Electricity (uncapping machine, chain, beeswax press) | Beeswax Unsealed honeycombs Waste:
|
| Centrifuge | Unsealed honeycombs Electricity (honey extractor) | Raw honey Waste:
|
| Transition in decanting tanks and collection in a ripener | Raw honey | Decanted honey Waste:
|
| Filtration | Decanted honey Nylon filters with cotton strings | Honey ready to be packaged Waste:
|
| Packaging | Honey ready to be packaged Jars Lids Labels Boxes Tape Plastic film Pallet Jars transport Lids transport Labels transport | Packaged honey Waste:
|
| Distribution | Packaged honey Transport of final product in Italy and abroad | Consumed product |
| End of life | Consumed product | Waste treatment (jar, lid, etc.) |
Table 2.
Characterisation results for the 30% assumption—extracted from SimaPro (Pré 2018).
Table 2.
Characterisation results for the 30% assumption—extracted from SimaPro (Pré 2018).
| Impact Category | Unit | Amount |
|---|---|---|
| Climate change | kg CO2 eq | 1.01 |
| Ozone depletion | kg CFC-11 eq | 1.16 × 10⁻⁷ |
| Terrestrial acidification | kg SO2 eq | 4.65 × 10⁻³ |
| Freshwater eutrophication | kg P eq | 1.45 × 10⁻⁴ |
| Marine eutrophication | kg N eq | 2.48 × 10⁻⁴ |
| Human toxicity | kg 1,4-DB eq | 0.183 |
| Photochemical oxidant formation | kg NMVOC | 4.54 × 10⁻³ |
| Particulate matter formation | kg PM10 eq | 1.57 × 10⁻³ |
| Terrestrial ecotoxicity | kg 1,4-DB eq | 1.53 × 10⁻⁴ |
| Freshwater ecotoxicity | kg 1,4-DB eq | 3.27 × 10⁻³ |
| Marine ecotoxicity | kg 1,4-DB eq | 3.57 × 10⁻³ |
| Ionising radiation | kg U235 eq | 6.52 × 10⁻² |
| Agricultural land occupation | m2a | 8.54 × 10⁻² |
| Urban land occupation | m2a | 5.38 × 10⁻³ |
| Natural land transformation | m2 | 3.76 × 10⁻⁴ |
| Water depletion | m3 | 3.72 × 10⁻³ |
| Metal depletion | kg Fe eq | 4.74 × 10⁻² |
| Fossil depletion | kg oil eq | 0.331 |
Table 3.
Characterisation results for natural land transformation—first ten processes (30% assumption—extracted from SimaPro (Pré 2018)).
Table 3.
Characterisation results for natural land transformation—first ten processes (30% assumption—extracted from SimaPro (Pré 2018)).
| Impact Category | Unit | Amount |
|---|---|---|
| Electricity, low voltage | m2 | 5.5 × 10⁻⁵ |
| Packaging glass, white | m2 | 4.3 × 10⁻⁵ |
| Transport, lorry 3.5–7.5 t | m2 | 6.7 × 10⁻⁶ |
| Corrugated board | m2 | 6.4 × 10⁻⁶ |
| Transport, lorry 16–32 t | m2 | 4.8 × 10⁻⁶ |
| Alkyd paint, white | m2 | 4.8 × 10⁻⁶ |
| Production of carton board boxes | m2 | 4.1 × 10⁻⁶ |
| Transport, lorry 7.5–16 t | m2 | 2.5 × 10⁻⁶ |
| Steel, low-alloyed | m2 | 1.7 × 10⁻⁶ |
| Paper, wood-free, coated | m2 | 1.2 × 10⁻⁶ |
Table 4.
Characterisation results for marine ecotoxicity—first ten processes (30% assumption—extracted from SimaPro (Pré 2018)).
Table 4.
Characterisation results for marine ecotoxicity—first ten processes (30% assumption—extracted from SimaPro (Pré 2018)).
| Impact Category | Unit | Amount |
|---|---|---|
| Electricity, low voltage | kg 1,4-DB eq | 1.2 × 10⁻³ |
| Packaging glass, white | kg 1,4-DB eq | 6.3 × 10⁻⁴ |
| Steel, low-alloyed | kg 1,4-DB eq | 4.1 × 10⁻⁴ |
| Disposal, wood ash mixture | kg 1,4-DB eq | 1.3 × 10⁻⁴ |
| Alkyd paint, white | kg 1,4-DB eq | 1.2 × 10⁻³ |
| Corrugated board | kg 1,4-DB eq | 1.0 × 10⁻⁴ |
| Transport, lorry 3.5–7.5 t | kg 1,4-DB eq | 7.4 × 10⁻⁵ |
| Sheet rolling | kg 1,4-DB eq | 6.2 × 10⁻⁵ |
| Production of carton board boxes | kg 1,4-DB eq | 5.2 × 10⁻⁵ |
| Transport, lorry 16–32 t | kg 1,4-DB eq | 3.8 × 10⁻³ |
Table 5.
Characterisation results for freshwater eutrophication—first ten processes (30% assumption—from SimaPro (Pré 2018)).
Table 5.
Characterisation results for freshwater eutrophication—first ten processes (30% assumption—from SimaPro (Pré 2018)).
| Impact Category | Unit | Amount |
|---|---|---|
| Electricity, low voltage | kg P eq | 6.7 × 10⁻⁵ |
| Packaging glass, white | kg P eq | 3.1 × 10⁻⁵ |
| Steel, low-alloyed | kg P eq | 8.7 × 10⁻⁶ |
| Alkyd paint, white | kg P eq | 6.1 × 10⁻⁶ |
| Corrugated board | kg P eq | 5.2 × 10⁻⁶ |
| Transport, lorry 3.5–7.5 t | kg P eq | 2.0 × 10⁻⁶ |
| Production of carton board boxes | kg P eq | 1.8 × 10⁻⁶ |
| Sheet rolling | kg P eq | 1.7 × 10⁻⁶ |
| Transport, lorry 16–32 t | kg P eq | 1.1 × 10⁻⁶ |
| Paper, wood-free, coated | kg P eq | 9.0 × 10⁻⁷ |
© 2019 by the authors. Licensee MDPI, Basel, Switzerland. This article is an open access article distributed under the terms and conditions of the Creative Commons Attribution (CC BY) license (http://creativecommons.org/licenses/by/4.0/).
Share and Cite
MDPI and ACS Style
Arzoumanidis, I.; Raggi, A.; Petti, L. Life Cycle Assessment of Honey: Considering the Pollination Service. Adm. Sci. 2019, 9, 27. https://doi.org/10.3390/admsci9010027
AMA Style
Arzoumanidis I, Raggi A, Petti L. Life Cycle Assessment of Honey: Considering the Pollination Service. Administrative Sciences. 2019; 9(1):27. https://doi.org/10.3390/admsci9010027
Chicago/Turabian StyleArzoumanidis, Ioannis, Andrea Raggi, and Luigia Petti. 2019. "Life Cycle Assessment of Honey: Considering the Pollination Service" Administrative Sciences 9, no. 1: 27. https://doi.org/10.3390/admsci9010027
Note that from the first issue of 2016, this journal uses article numbers instead of page numbers. See further details here.