
Design and Potential Analysis of an Eddy Current Sensor for Inductive Conductivity Measurement in Fluids †


Institute for Mechatronics in Mechanics, Hamburg University of Technology, 21073 Hamburg, Germany
*
Author to whom correspondence should be addressed.
†
Presented at the 8th International Symposium on Sensor Science, 17–28 May 2021; Available online: https://i3s2021dresden.sciforum.net/ .
Eng. Proc. 2021, 6(1), 54; https://doi.org/10.3390/I3S2021Dresden-10160
Published: 19 May 2021
(This article belongs to the Proceedings of The 8th International Symposium on Sensor Science)
Abstract
:In the scope of this paper, a first exemplary eddy current sensor for seawater conductivity measurement is developed, based on the derived sensor theory of a previous work. By high-frequency excitation, eddy currents are induced in the fluid and are counter-fields measured with a sensing coil. The coil’s resonance point is used for amplification. The developed prototype is analyzed based on a derived transfer function and FEM simulations. The theory is validated using a prototype implementation. With conducted experiments on a sensor test bench, the characteristics are confirmed and disturbances identified. It is shown that frequencies exist where temperature influence is minimal. This work gives a perspective for a novel sensor to allow seawater conductivity measurement.
1. Introduction
Eddy current sensors have the potential to become a cost-effective inductive alternative to the industrial standard of transformer-type conductivity sensors (TICS). TICS are an established solution [1,2], for standard industrial applications up to high-precision measurements in the oceanography. Compared to the standard conductivity cells, inductive sensors present a more expensive solution, but provide housing for protection from corrosion and biofouling. For long-term seawater salinity monitoring, the use of an inductive sensor is unavoidable. The higher prices restrict the quantity of deployed sensors, and therefore limit the spatial measurement resolution. In the search for a cost-effective inductive conductivity sensor, the authors of this paper investigate the novel inductive eddy current (EC) sensor type [3,4,5]. An EC sensor generates an alternating magnetic flux in conductive fluid and measures the effects of the resulting eddy currents. In a previous work, the theory of this sensor together with a model description was derived and validated based on a sensor prototype and FEM simulation results [6].
This paper reports possible implementations for EC sensors and aims to identify their measurement uncertainties. In the following, an implementation of the sensor is compared to the ideal model representation and FEM simulation results to examine temperature’s influence and possible working points. Since the measured effects of the eddy currents are small in amplitude, the resonance point of the coil is used for natural amplification. It is shown that a strong temperature correlation can be avoided by the selection of the right frequency.
2. Materials and Methods
Various experiments resulted in a sensor design that carries two coils on a ferrite rod. The coupling between both coils is determined by the magnetic field of the excitation coil subtracted by the counter acting magnetic field of the eddy currents:
To be able to measure this effect, the coupling has to be low while exciting with a high frequency to increase δB/δt. The upper limit for the frequency is given by the resonance point of the coil, which was shifted in this experiment by an additional capacitor to keep the measurement frequency below 1 MHz. A prototype based on this design was manufactured (Figure 1b,c) and waterproofed by PU-molded housing.
Besides the implemented prototype, a FEM model with the same configuration was designed in Ansys Electronics (Figure 1a). The sensor was used in a test bench environment, where temperature and conductivity could be controlled in a continuously mixing water body. An experiment was conducted with the implemented prototype, where water temperature and conductivity changed over time. In a hysteresis-like progression, the conductivity was reduced from approximately 50 mS/cm to approximately 15 mS/cm and increased again to above 50 mS/cm. During the reduction in conductivity, the temperature was slightly increased from 18.2 °C to 19.6 °C due to the warmer mixing water. During the increase in conductivity, the temperature was kept almost constant and showed only a slight temperature increase from 19.6 °C to 19.7 °C. In each cycle, 20 measurements were collected to a total of 41 measurement points. For each measurement, a frequency sweep between 750 kHz and 1 Mhz was collected with a constant excitation current of 10 mA.
3. Results
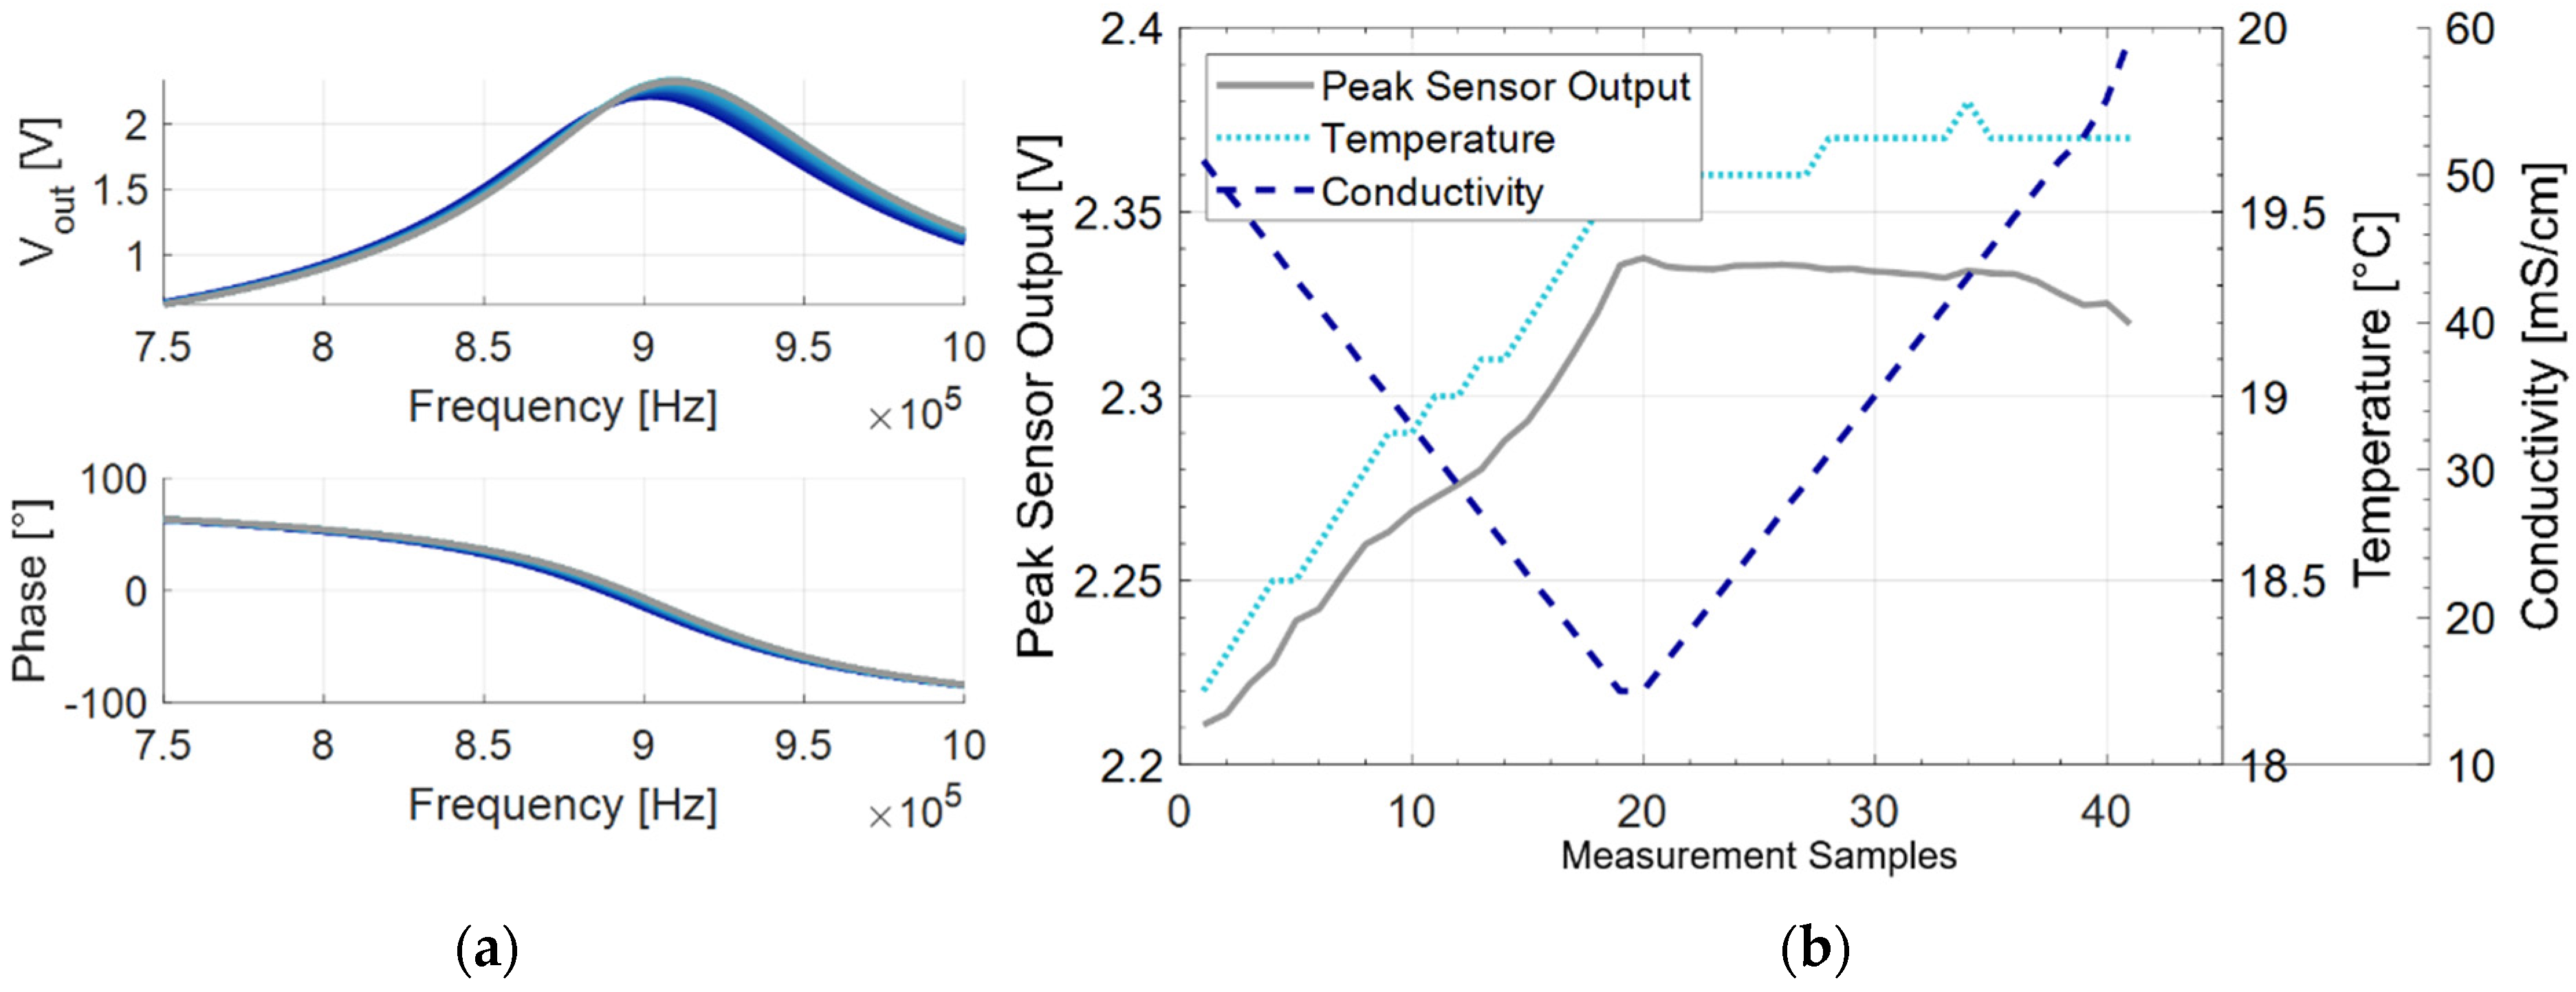
The collected frequency response data in Figure 2a shows the secondary coil’s output voltage for each frequency and measurement. In Figure 2b, the peak amplitude of the output voltage is plotted together with the changing conductivity and temperature over all measurement points. The results of the experiment primarily indicate a strong and dominating temperature dependency of the sensors voltage output. This is related to the changing copper resistance and the amplification close to the resonance point. The correlation to conductivity can be seen, starting from measurement sample 20, when the temperature remains almost constant, but the sensor voltage decreases with rising water conductivity.
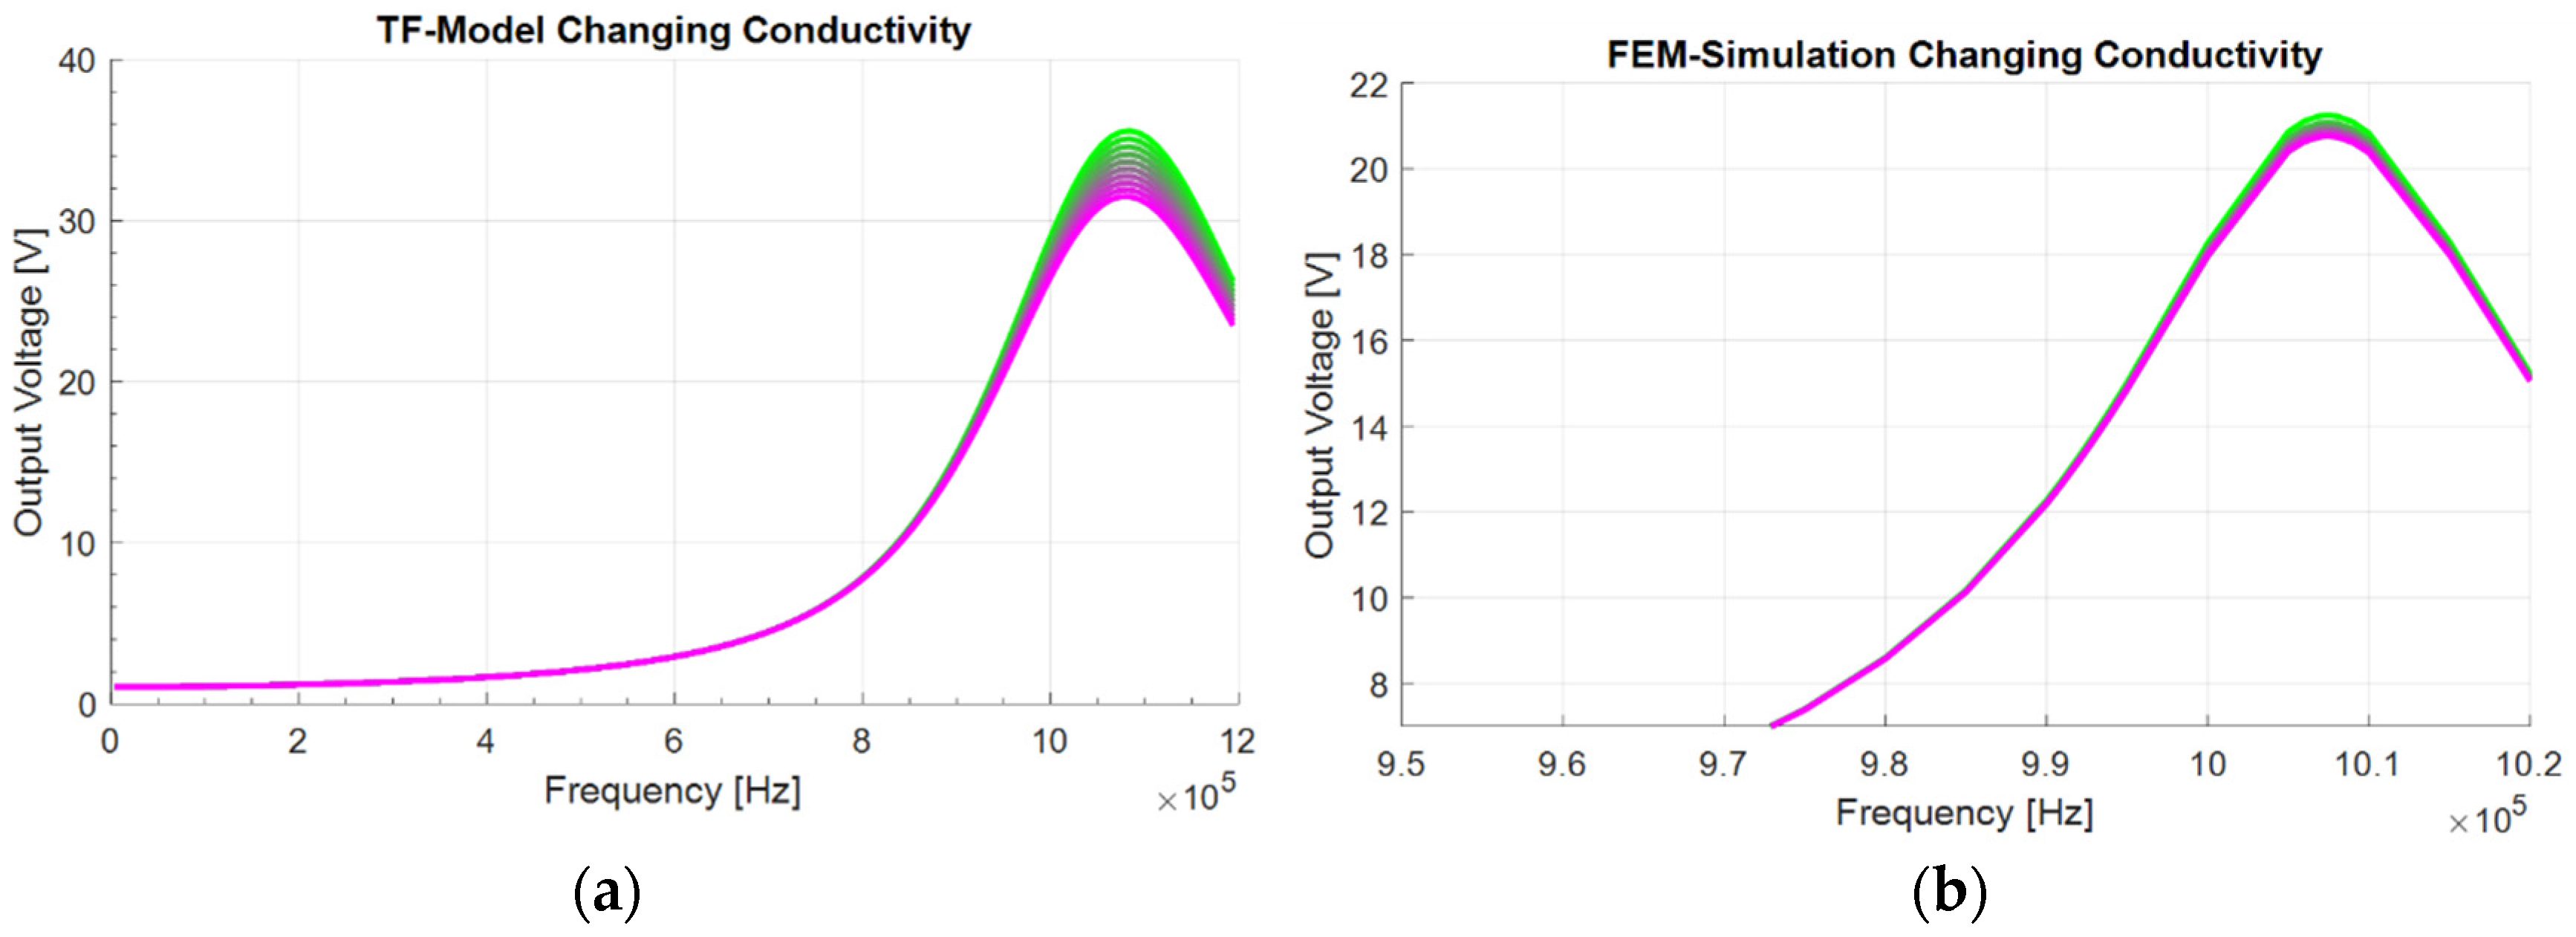
The correlation between water conductivity and sensor voltage output is also shown by the FEM simulation and TF model results (Figure 3).
4. Discussion
The equivalent model representation, derived in a previous work, indicates both temperature and conductivity correlation:
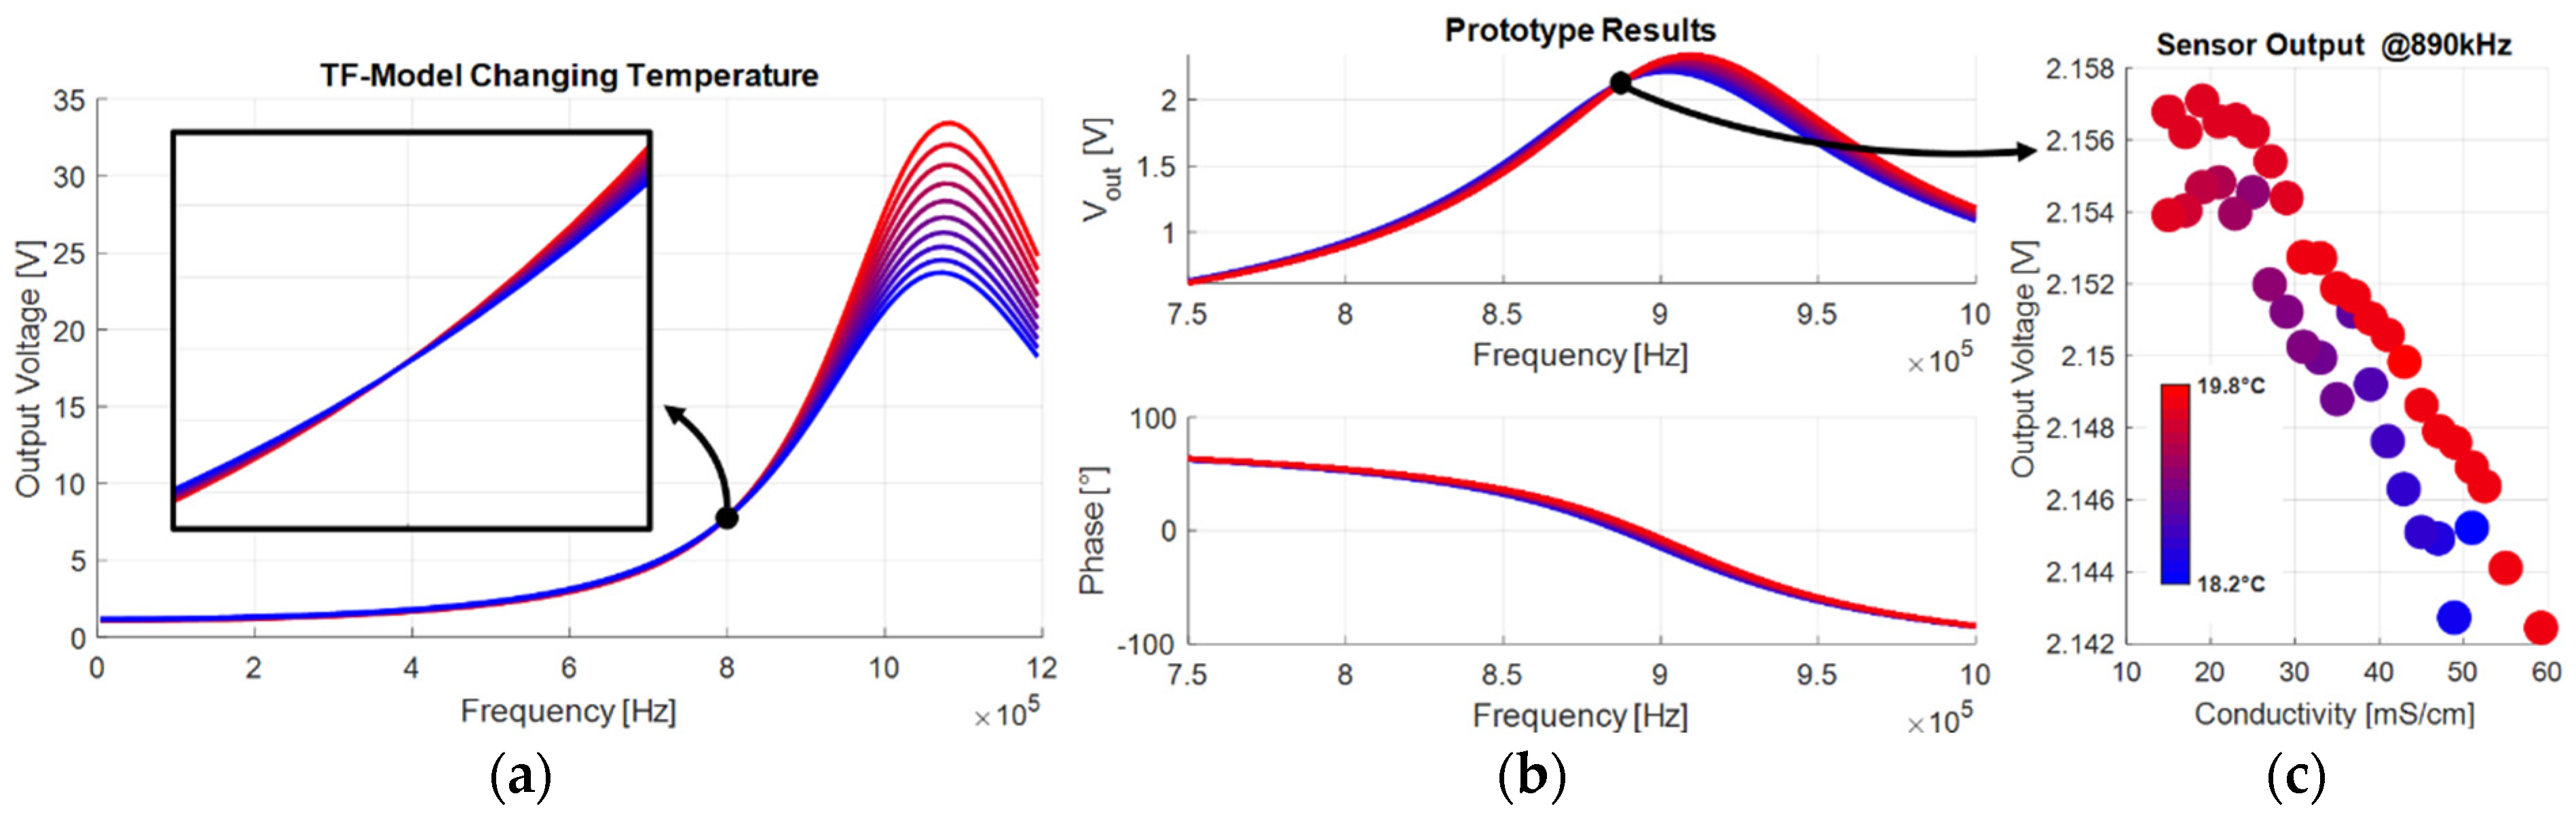
The frequency response of the transfer function (Figure 4a) shows that a point exists where the output voltage is independent of the temperature. In the conducted experiment, this point was found to be at approximately 890 kHz. Figure 4b shows the sensor output over water conductivity for the frequency of 890 kHz. The color of the measurement points represent the water temperature from warm (red) to cold (blue). It can be seen that the output voltage has a linear correlation with the conductivity of the water and water temperature has no obvious influence.
5. Conclusions
The conducted experiment confirms the predicted model behavior and indicates similar results to the FEM simulation. It was shown that a very simple and cost-effective implementation of an eddy current sensor allows conductivity measurement to a certain extent. Strong temperature dependencies dominate the measurement result, but it was demonstrated in the experiment as well as in the model that an operating point with very low temperature dependency exists. In this implementation, the sensor uncertainty is still too high for ocean salinity measurement, but from manufacturing perspective, the eddy current sensor presents a cost-effective alternative to the TICS. However, the high measurement frequency required for the EC sensor contributes to greater expense in secondary electronics, which can negatively influence the cost factor. In summary, further development on eddy current sensors is necessary to develop a commercially viable instrument for salinity measurement. This paper shows the potential of the sensor and gives a starting point for future research on eddy current sensors.
Institutional Review Board Statement
Not applicable.
Informed Consent Statement
Not applicable.
References
- Striggow, K.; Dankert, R. The exact theory of inductive conductivity sensors for oceanographic application. IEEE J. Ocean. Eng. 1985, 10, 175–179. [Google Scholar] [CrossRef]
- Kang Hui, S.; Jang, H.; Kim Gum, C.; Yu Song, C.; Kim Yong, H. A new design of inductive conductivity sensor for measuring electrolyte concentration in industrial field. Sens. Actuators A Phys. 2020, 301, 111761. [Google Scholar] [CrossRef]
- Li, W.; Chiang, Y.; Tsou, C. A novel method for inspecting raw milk quality by using dual-coil inductance. In Proceedings of the 2016 IEEE 29th International Conference on Micro Electro Mechanical Systems (MEMS), Shanghai, China, 24–28 January 2016; pp. 282–285. [Google Scholar] [CrossRef]
- Ding, X.; Chen, X.; Li, N.; Chen, X.; Zhao, X. An inductive salt solution concentration sensor using a planar coil based on a PQCR-L circuit. Sens. Actuators A Phys. 2017, 263, 246–251. [Google Scholar] [CrossRef]
- Sonehara, M.; Van Toai, N.; Sato, T. Fundamental Study of Non-Contact Water Salinity Sensor by Using Electromagnetic Means for Seawater Desalination Plants. IEEE Trans. Magn. 2016, 52, 1–4. [Google Scholar] [CrossRef]
- Harms, J.; Kern, T.A. Theory and Modeling of Eddy Current Type Inductive Conductivity Sensors. MDPI Eng. Proc. 2020, in press. [Google Scholar]
Figure 1.
Implementation of the eddy current sensor (a) in the FEM simulation (b) of the manufactured prototype (c) with soldered capacitor.
Figure 1.
Implementation of the eddy current sensor (a) in the FEM simulation (b) of the manufactured prototype (c) with soldered capacitor.

Figure 2.
Plot of the maximum voltage output for the characterization test over (a) change in temperature (b) change in conductivity.
Figure 2.
Plot of the maximum voltage output for the characterization test over (a) change in temperature (b) change in conductivity.

Figure 3.
Frequency responses for changing conductivity values of (a) transfer function model and (b) FEM simulation. The water conductivity changes from high (green) to low (purple).
Figure 3.
Frequency responses for changing conductivity values of (a) transfer function model and (b) FEM simulation. The water conductivity changes from high (green) to low (purple).

Figure 4.
(a) Frequency response of equivalent transfer function model for different temperatures; (b) experiment results; (c) output voltage at 890 kHz over water conductivity. Red and blue color relates to high and low temperature respectively.
Figure 4.
(a) Frequency response of equivalent transfer function model for different temperatures; (b) experiment results; (c) output voltage at 890 kHz over water conductivity. Red and blue color relates to high and low temperature respectively.

Publisher’s Note: MDPI stays neutral with regard to jurisdictional claims in published maps and institutional affiliations. |
© 2021 by the authors. Licensee MDPI, Basel, Switzerland. This article is an open access article distributed under the terms and conditions of the Creative Commons Attribution (CC BY) license (https://creativecommons.org/licenses/by/4.0/).
Share and Cite
MDPI and ACS Style
Harms, J.; Kern, T.A. Design and Potential Analysis of an Eddy Current Sensor for Inductive Conductivity Measurement in Fluids. Eng. Proc. 2021, 6, 54. https://doi.org/10.3390/I3S2021Dresden-10160
AMA Style
Harms J, Kern TA. Design and Potential Analysis of an Eddy Current Sensor for Inductive Conductivity Measurement in Fluids. Engineering Proceedings. 2021; 6(1):54. https://doi.org/10.3390/I3S2021Dresden-10160
Chicago/Turabian StyleHarms, Julius, and Thorsten A. Kern. 2021. "Design and Potential Analysis of an Eddy Current Sensor for Inductive Conductivity Measurement in Fluids" Engineering Proceedings 6, no. 1: 54. https://doi.org/10.3390/I3S2021Dresden-10160