

Underground Gas Storage Monitoring Using Free and Open Source InSAR Data: A Case Study from Yela (Spain)


1
Earth Sciences Department, University of Florence, Via La Pira 4, 50121 Firenze, Italy
2
National Institute for Nuclear Physics INFN, Division of Florence, Via Bruno Rossi 1, 50019 Sesto Fiorentino, Italy
*
Author to whom correspondence should be addressed.
Energies 2023, 16(17), 6392; https://doi.org/10.3390/en16176392
Submission received: 24 July 2023
/
Revised: 22 August 2023
/
Accepted: 31 August 2023
/
Published: 3 September 2023
(This article belongs to the Section H: Geo-Energy)
Abstract
:Gas consumption is subject to large seasonal fluctuations between the summer season (period with lower request) and the winter season (time with increased consumer demand). Underground gas storage applications (UGS) help to ensure a steady and reliable supply of natural gas, even during periods of peak demand, smoothing price fluctuations and providing a means of balancing the supply and demand of natural gas on a daily, weekly, or seasonal basis. However, UGS activities can induce vertical ground displacement, which is usually strictly associated with the injection and withdrawal of gas into/from the reservoir. It is necessary to carefully monitor and manage the potential impact of UGS activities on the subsurface and surface to ensure the stability and safety of the local environment. The Interferometric Synthetic Aperture Radar (InSAR) technique can provide a wide range of high-precision information on seasonal surface deformation associated with UGS activities useful for increasing the amount of information on ground deformation monitoring. This study introduces a unique and replicable approach to investigating freely available ground movement data for a fractured aquifer reservoir located in the Madrid Basin (Guadalajara, Spain), which is currently employed for seasonal underground gas storage applications. Notably, this study gives a comprehensive comparison of InSAR results of UGS activity in a deep aquifer, leveraging data that are entirely open-source and easily accessible. The Yela UGS project exploits a carbonate reservoir (dolomite) managed, since 2012, by Enagás, the Spanish main Transmission System Operator (TSO). InSAR data from 2015 to 2021 provided a full and coherent ground deformation pattern of the area. Based on this data, a fully integrated volumetric variation model was developed, elucidating the effects of gas storage activity. A significant correlation between the periodic injection/withdrawal rates of natural gas and InSAR ground deformation over time was identified.
1. Introduction
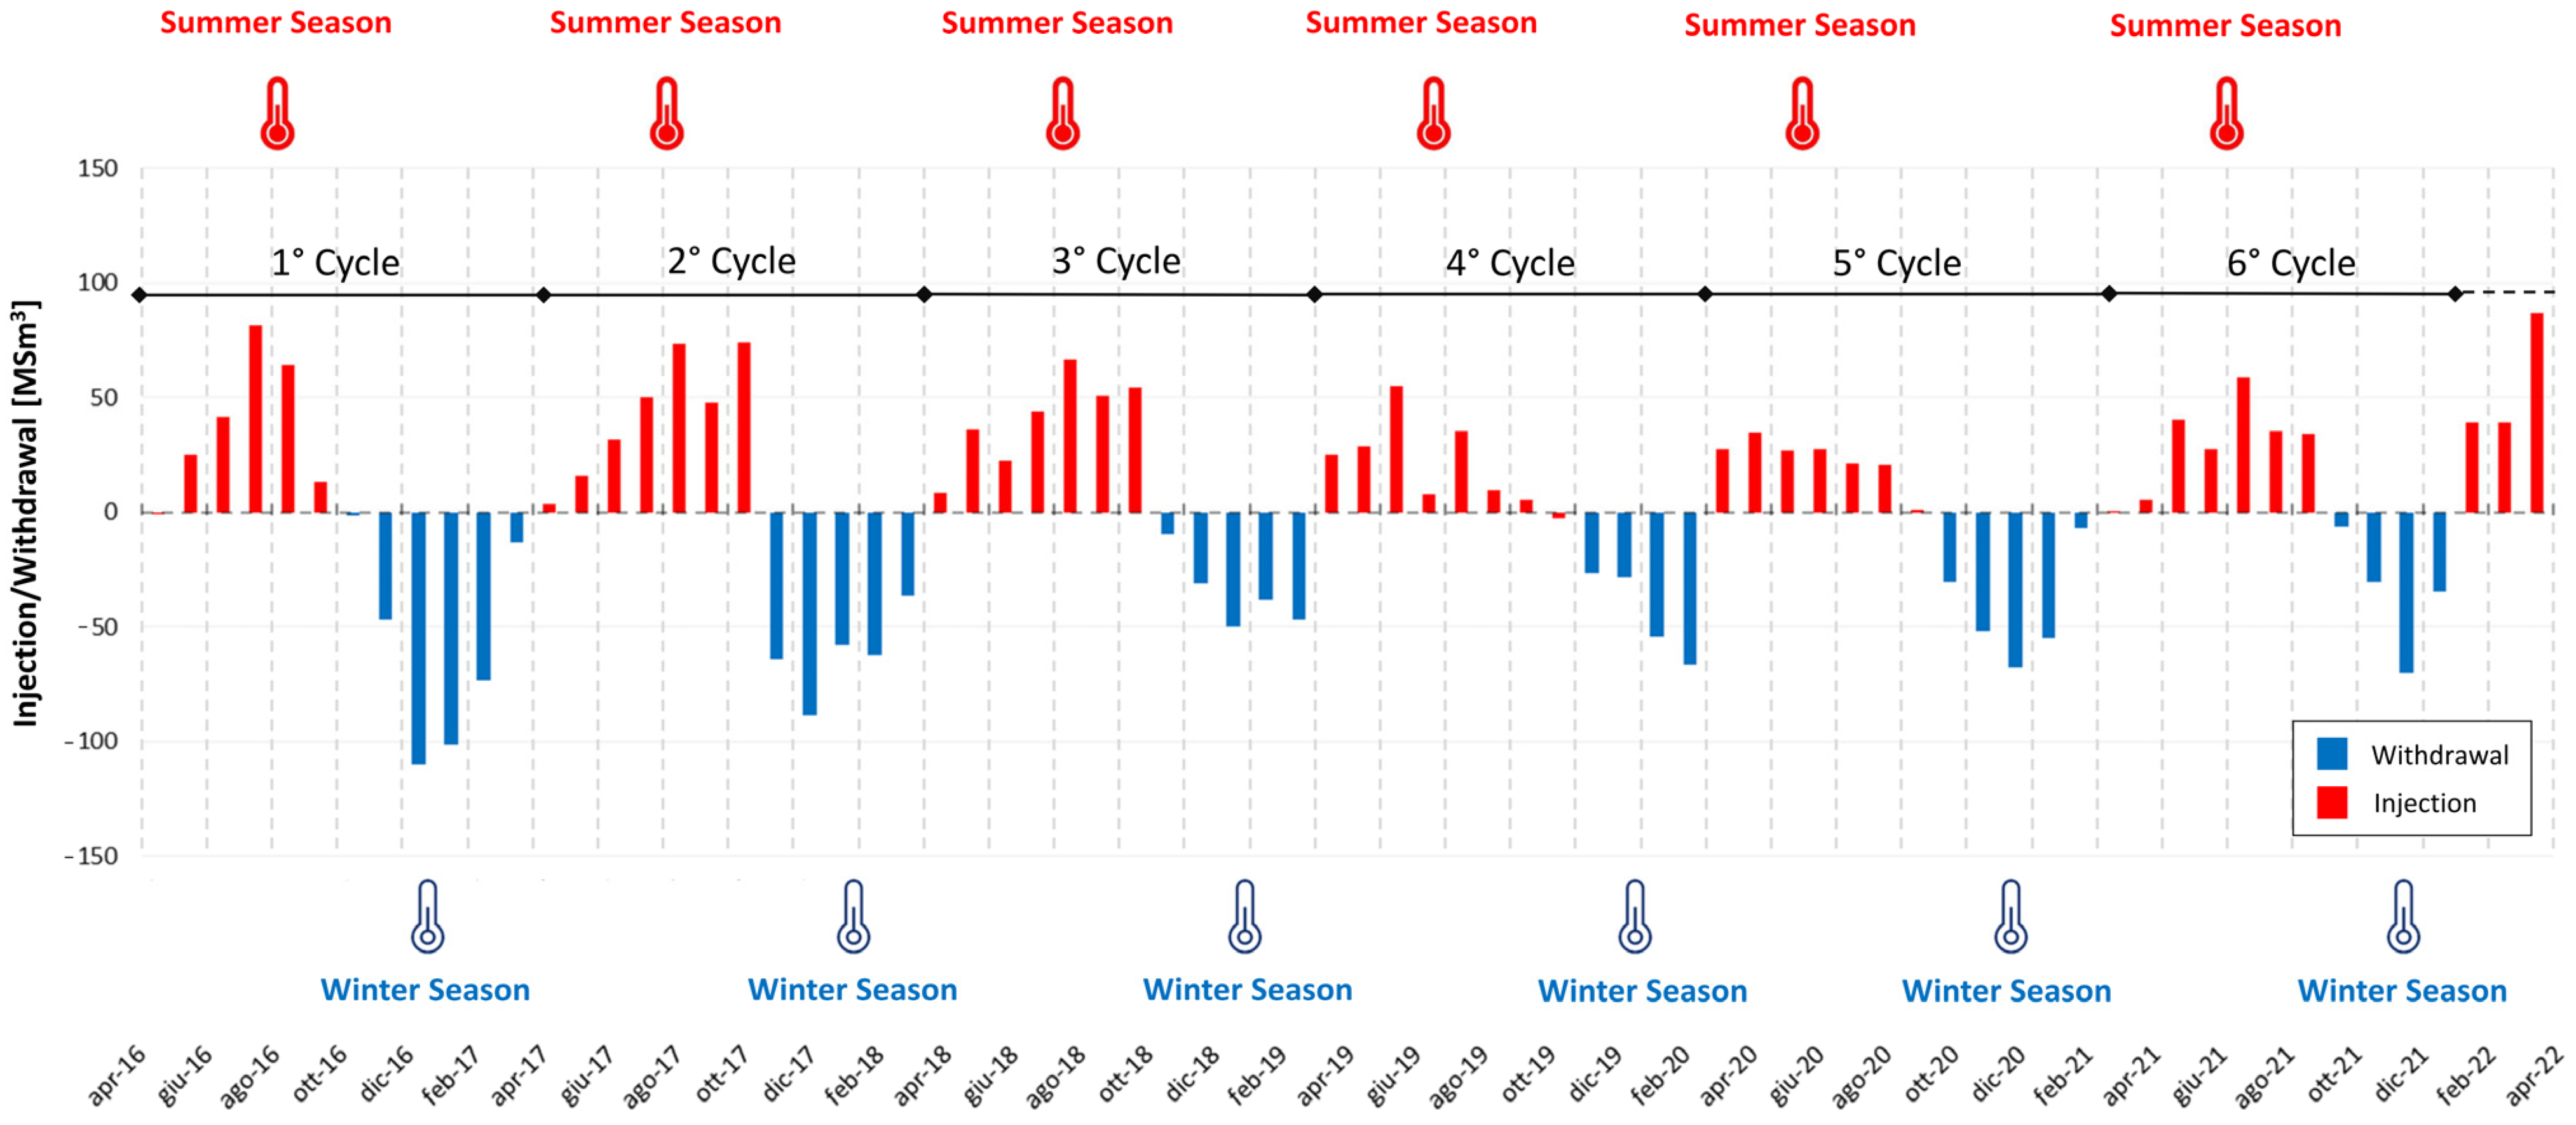
One of the primary sources of energy used by humans is fossil fuels, which include coal, oil, natural gas, and biomass. Natural gas is one of the most relevant, as it provides a fuel source for cooking and heating, in addition to its use as a fuel power station for supplying electricity to homes, businesses, and several industrial processes. Gas consumption is subject to large seasonal fluctuations due to periods of lower consumer demand (summer season) and periods of higher demand owing to the necessity of heating (winter season). In this regard, interest in developing underground gas storage (UGS) facilities in geological structures such as depleted oil/gas fields, aquifers, and salt caverns is growing worldwide to create strategic gas reserves. The main purpose of UGS is to accommodate daily to seasonal variations in natural gas demand. Figure 1 shows a typical injection and withdrawal cycle; the sample data are from the Uelsen UGS facility (Germany). The cycle consists of two phases: (i) the summer season with high atmospheric temperatures and corresponding low demand for natural gas, and (ii) the winter season with low atmospheric temperature and corresponding high demand. Each reservoir type has its own physical features that govern its suitability for specific applications [1]. Natural porous strata typically possess a substantial storage capacity but exhibit lower injection and withdrawal rates. In contrast, salt caverns often have a more limited storage capacity but allow for higher injection and extraction rates [2,3].
The worldwide interest in UGS applications is demonstrated by the increasing global underground gas storage capacity, which reached 475 × 109 Sm3 (Standard m3) in 2022, more than four times that available in 1970 [5]. In 2016, there were 143 active project sites in Europe, while by the end of 2021, the number was 160, 35% of which were in Germany (Table 1) [6].
The total European underground gas storage capacity is approximately 100 billion m3 [7]. The number and sizes of facilities vary greatly. A total of 73% of the total European capacity is concentrated in five states: Germany, Italy, France, Netherlands, and Austria. The increase in the pressure of the gas stored in existing facilities is one of the most economical ways of improving the working gas capacity (the amount of gas that can be stored and extracted) in a UGS reservoir [8]. Typically, the limitation in pressure is set dynamically following the response to the gas pressure during the filling process; however, these values do not always represent the maximum short-term pressure capacity of the reservoir. Therefore, there is a growing demand for reliable procedures that can assess the maximum operating pressure without compromising safety conditions and negatively impacting the surrounding environment.
The constant increase in the number and capacity of UGS facilities has increased the importance of monitoring them. Indeed, UGS activities can induce vertical ground deformations, leading to subsidence (associated with natural gas extraction) or uplift (linked to natural gas injection) [9]. Continuous monitoring is paramount to ensure caprock integrity and the efficiency and longevity of injection/withdrawal wells. The high costs of in situ monitoring systems, especially when considering the limited spatial density of the instruments, have paved the way for remote sensing technologies. The latter issue is the main reason why remote sensing technologies such as Interferometric Synthetic Aperture Radar (InSAR) are becoming increasingly attractive to companies for monitoring their activities. Notably, the efficacy of InSAR in monitoring UGS activity is evident in its ability to detect vertical ground deformation due to UGS operations through time series analysis [5]. As a result, InSAR is fast becoming a standard technology adopted in many UGS projects across Europe, offering wide-area monitoring at a fraction of the cost of traditional methods e.g., [5,9,10,11]. Additionally, ground deformation data can be linked to reservoir parameters through geomechanical models [12]. It is essential to carefully monitor and manage the impact of UGS activities on the subsurface—and indirectly on the surface—in order to maintain local environmental safety. Such vigilance stems from the inherent risks of UGS activities, including potential gas leaks from pipelines that could lead to fires or create flammable methane clouds [13]. Several incidents involving gas leakage and subsequent fires or explosions have been documented globally [14,15]. Monitoring three-dimensional land surface deformation, which reflects seasonal stress variations due to injection and withdrawal activities, is instrumental in managing these risks [10]. Notably, well failures can result in a catastrophic Loss of Containment (LoC) of natural gas, as evidenced by the large-scale surface blowout at the Aliso Canyon UGS facility in California in October 2016 [16,17].
This study shows the potential of using the InSAR approach for monitoring ground displacement in areas close to UGS facilities. The primary aim of this study is to establish general guidelines for UGS remote monitoring projects and to delineate the potential and limitations of freely available InSAR data. In addition, the interaction and correlation between the injection and withdrawal activities and the surficial ground deformation are also assessed. The presented approach is based on free and easily accessible European data.
2. Study Area
Enagás, the Spanish main Transmission System Operator (TSO), operates three underground storage facilities in Spain, located in Serrablo (Huesca), Gaviota (an off-shore site in the province of Biscay), and Yela (Guadalajara) [18]. The Yela underground gas storage facility is situated in the district of Brihuega, a municipality belonging to the province of Guadalajara, within the autonomous community of Castilla-La Mancha, approximately 100 km northeast of Madrid. Guadalajara is a province of >12,000 km2 in central Spain. It is an area of considerable orography and relief, with altitudes between 600 and 2300 m above sea level, and a continental Mediterranean climate.
Yela UGS exploits 11 wells for injection and withdrawal activities, establishing a strategic natural gas reserve to address energy supply and demand in central Spain.
Geological and Geomorphological Setting
The Yela reservoir, a deep aquifer converted into an underground gas storage site in 2012, consists of a saline aquifer in a carbonate succession and covers an area of approximately 30 km2.
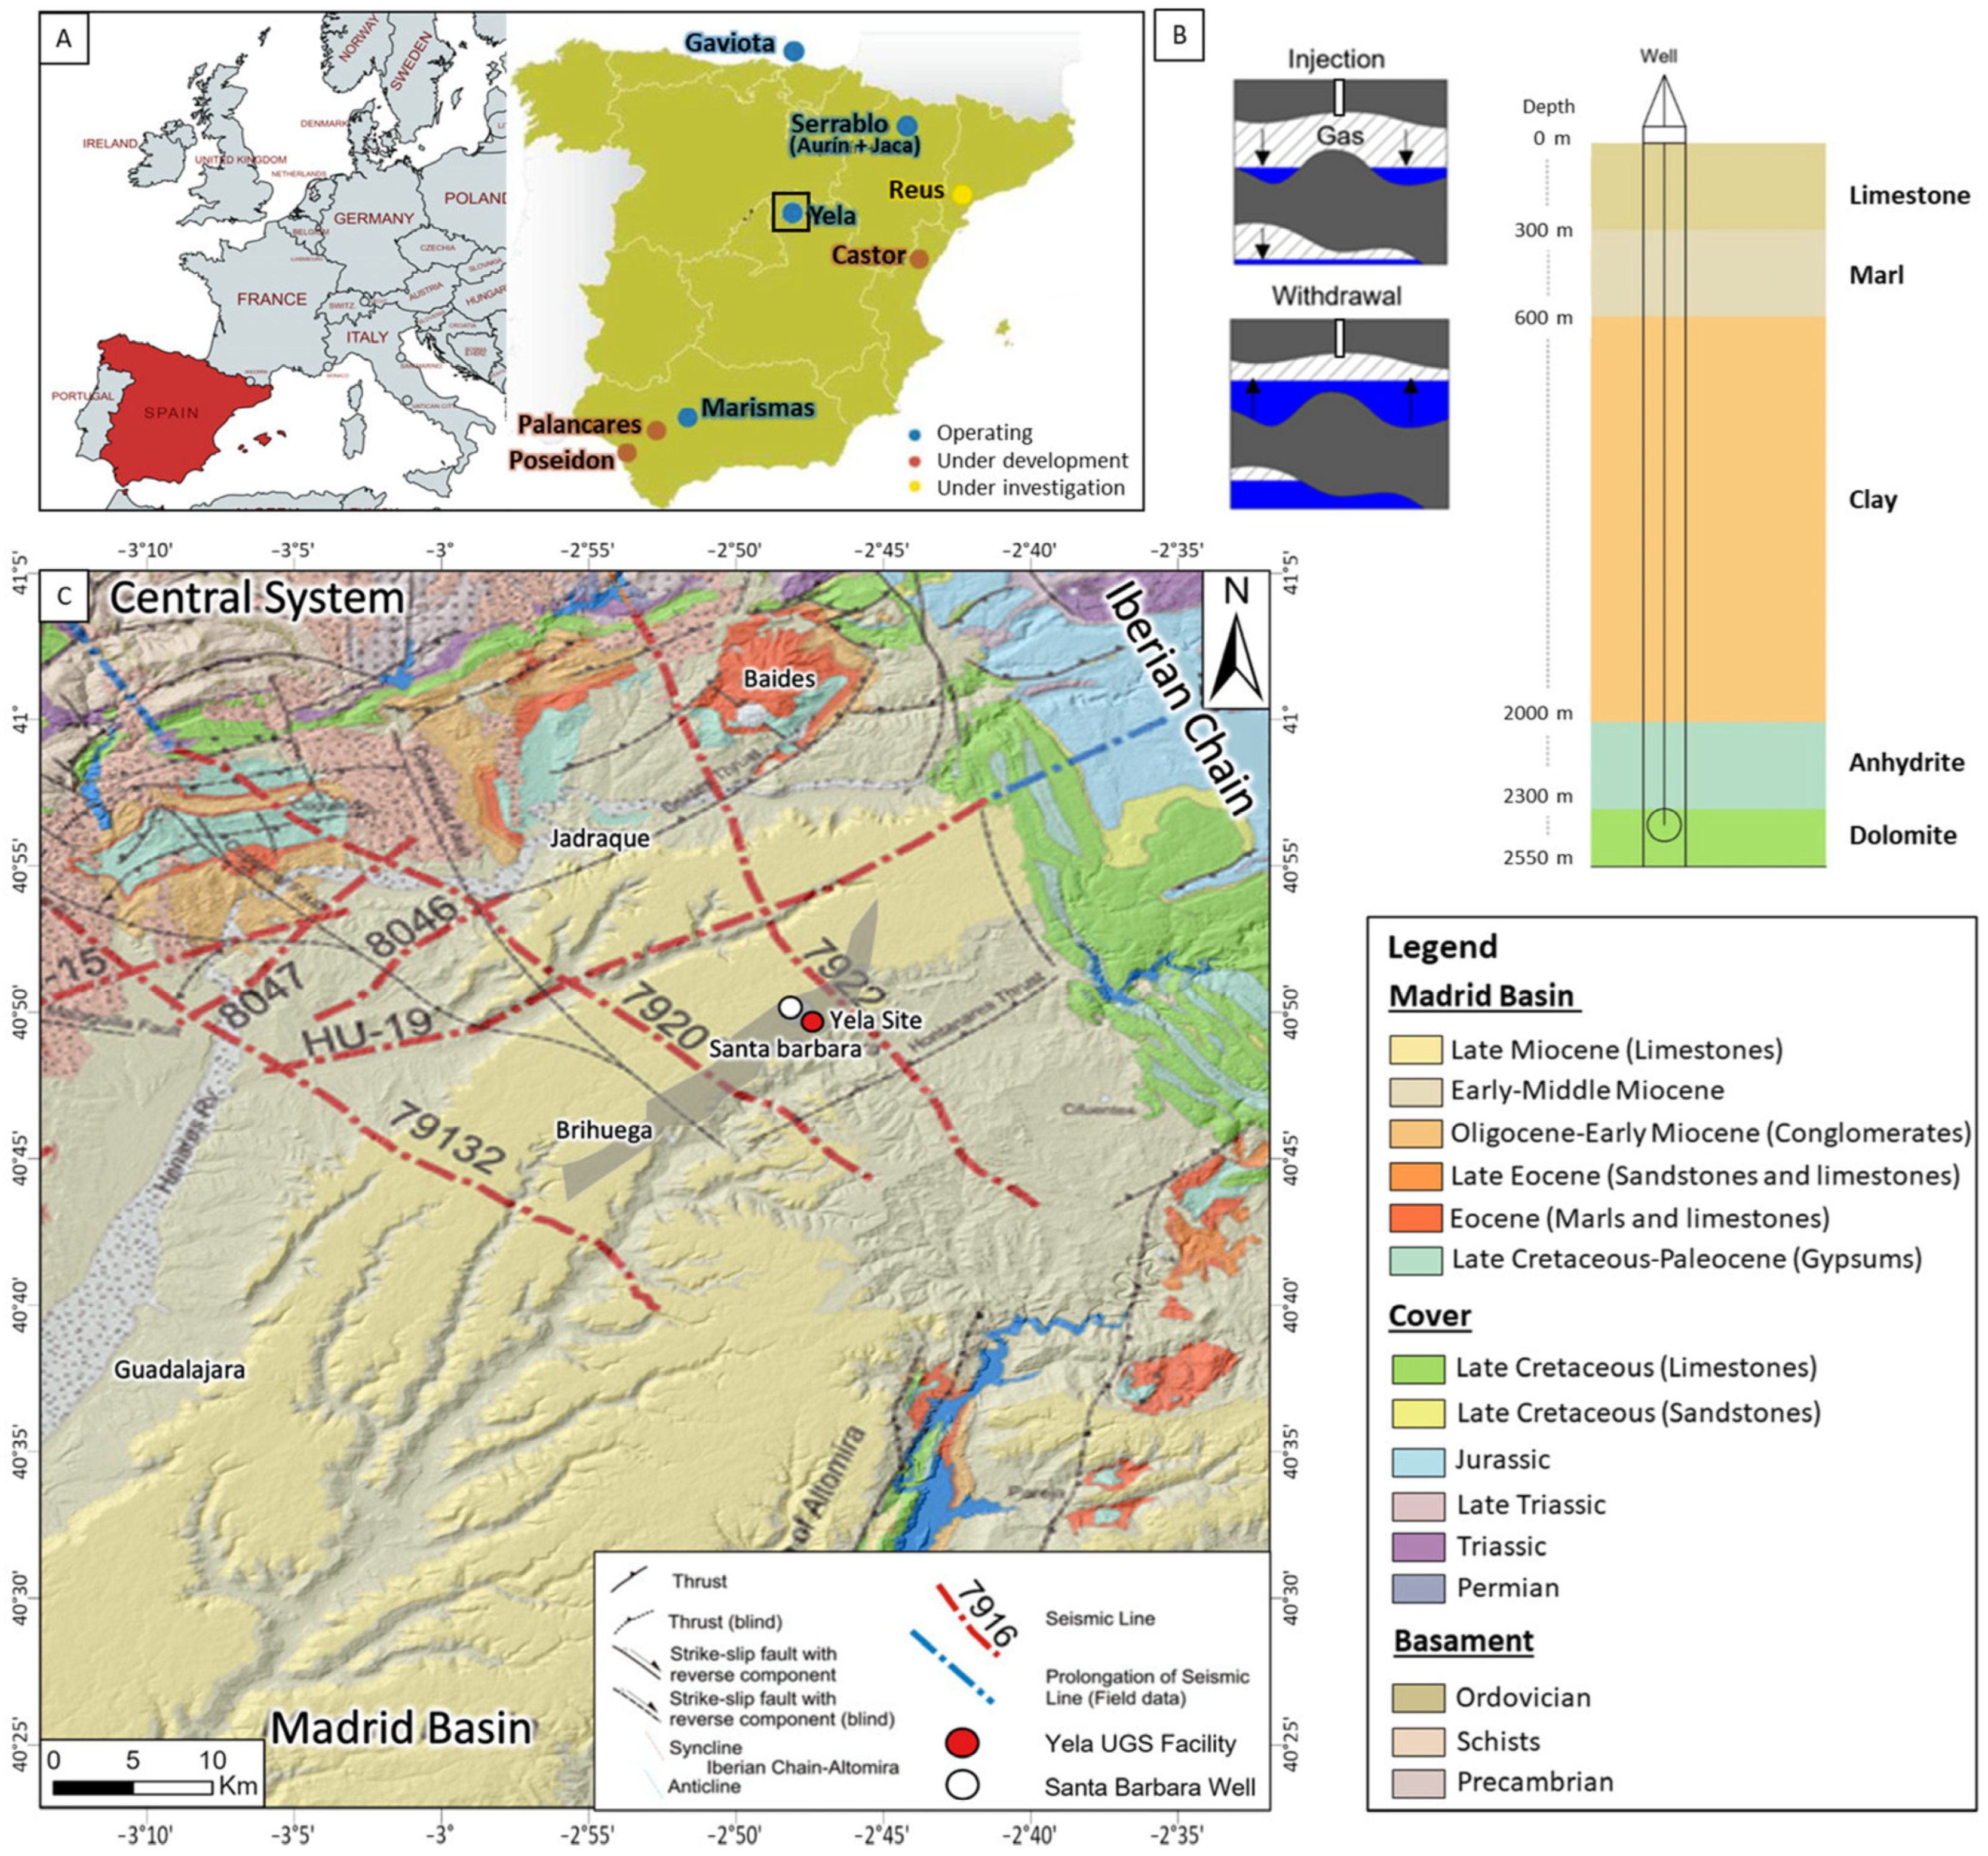
An aquifer can be considered suitable for gas storage if the porous sedimentary rock formation containing water is overlain with an impermeable cap rock. This situation allows the gas to remain confined in the reservoir, preventing possible leakage and spillage. Although the aquifer reservoir behaviour is comparable to one constituted by a depleted production field, its use for natural gas storage usually requires a larger amount of cushion gas (i.e., gas not available for withdrawal but needed to ensure a minimum adequate pressure for UGS activities). Furthermore, the aquifer reservoir allows a lower flexibility in injection and withdrawal rates. Availability rates can be improved by the presence of an active water system, which sustains reservoir pressure during injection and withdrawal cycles (the operation is described in the diagram in Figure 2B). The Yela reservoir is situated between 2300 and 2550 m below ground level. It resides within the ‘Santa Bàrbara’ formation, which is composed of Cretaceous carbonates (predominantly dolomite) and is characterised by a widespread network of fractures. This formation is capped and sealed by evaporitic facies (as shown in Figure 2B) [19]. The geological structure exploited during UGS activities is an anticline with two tops: (i) the reservoir, made up of dolomite, and (ii) the seal, consisting of anhydrites, both from the Upper Cretaceous (Table 2).
The Yela facility is located in the north-eastern portion of the Madrid Basin, a Cenozoic basin bounded by the Central System intraplate mountain range to the North and the fold-and-thrust belt of the Iberian Chain to the North-East (developed in the Cenozoic era). It has a surface area of more than 20,000 km2 and is characterised by a structure closely linked to the tectonic evolution of the Central System and the Iberian Chain, which allows for the presence of considerable hydrological resources. The Madrid Basin formed on a sedimentary layer composed of a Permian–Triassic clastic succession. This layer was subsequently overlaid by Middle to Upper Triassic carbonates, which include evaporitic sequences (notably, sequences from the Jurassic to the Lower Cretaceous are absent in the area) [20]. The sedimentary history of this basin is largely continuous from the Late Cretaceous to the Late Miocene. This continuity is indicative of its continental deposition environment, resulting in a diverse lithology that encompasses sandstones, clays, marls, limestones, and chalk (as illustrated in Figure 2).
Figure 2.
(A) Localization of the Yela underground storage facility (modified from [21]). (B) Well-log representation and diagram showing the effects of injection and withdrawal into and from the aquifer reservoir (key role of groundwater in maintaining aquifer pressure). (C) Detailed geological map of the NE portion of the Madrid Basin. The grey polygon, elongated in a NE–SW direction, depicts the deep structural trap where the natural gas is stored (modified from [19]).

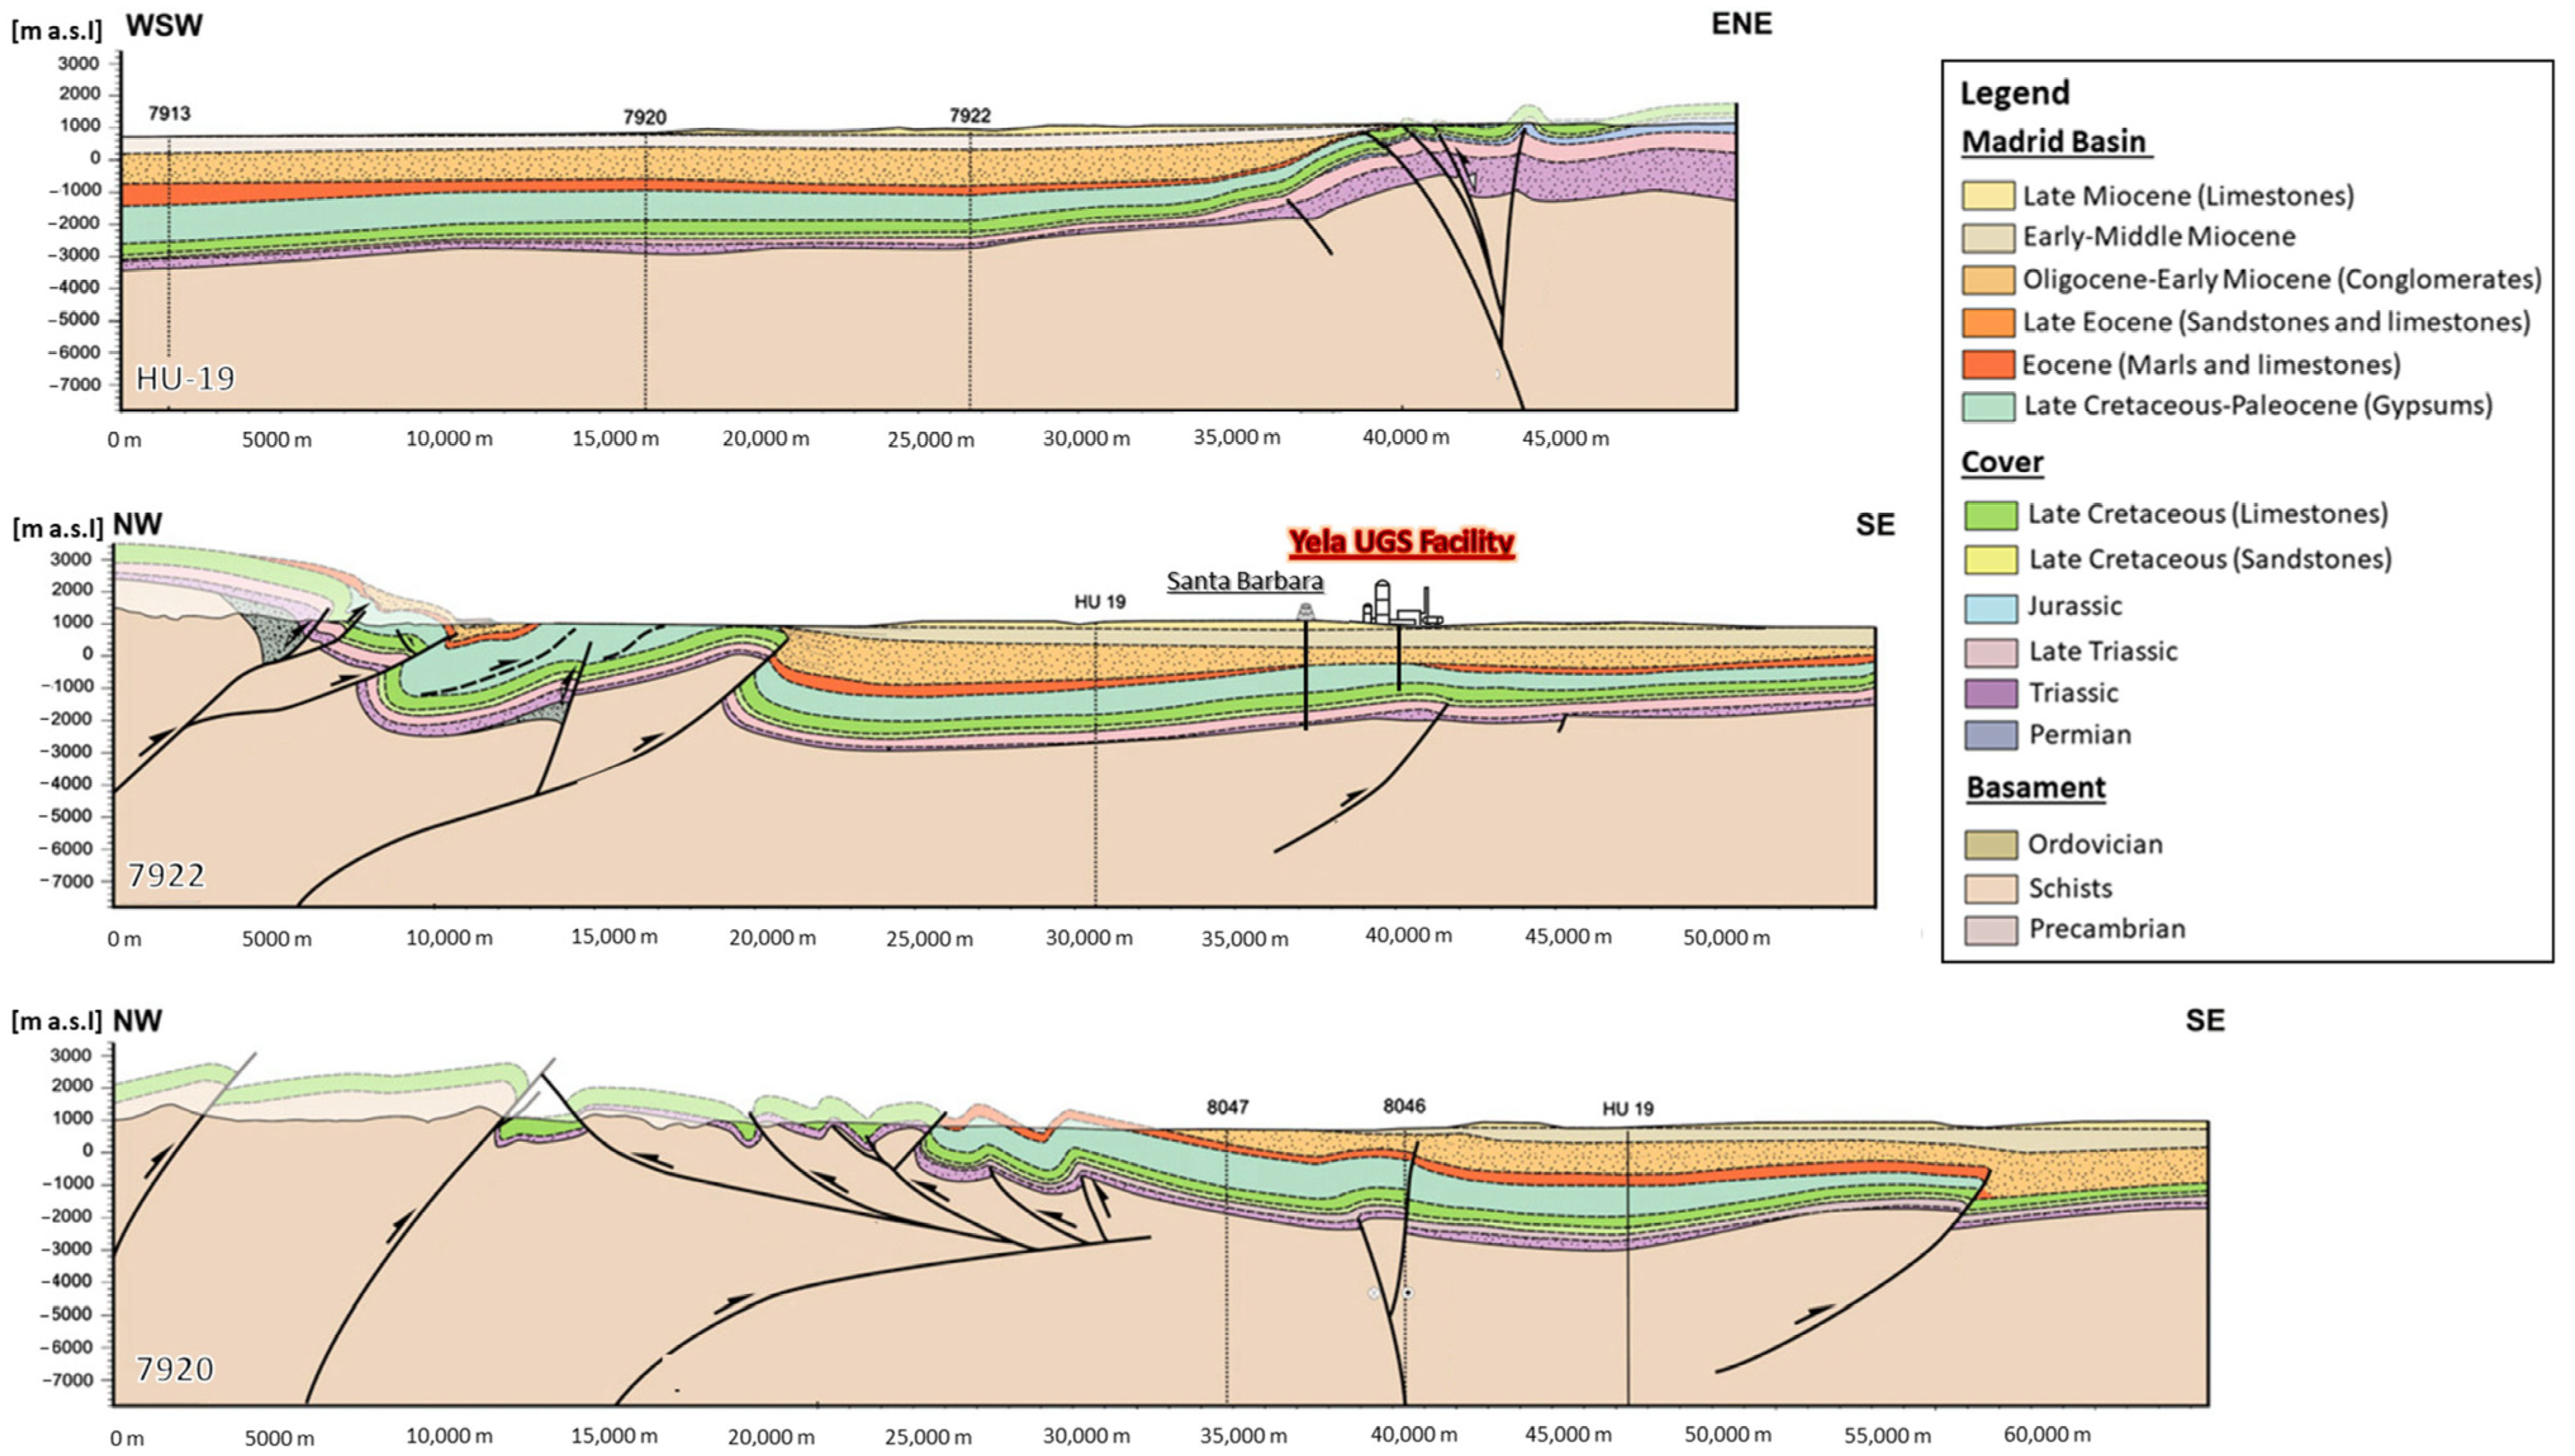
De Vincente et al. [19] designed geological cross-sections from seismic reflection profiles of the southern boundary of the Central System and the Iberian Chain, which can recognise a complex thick-skinned thrust system developed during the Cenozoic [19]. Figure 3 shows the easternmost cross-sections of the Madrid Basin.
During the injection process, natural gas is introduced into the porous rock, displacing the previously stored water. The presence of an active water system can improve the availability rates as well as sustain reservoir pressure during withdrawal operations. Therefore, using an active aquifer requires less cushion gas, allowing a higher quantity of working gas to be injected into the reservoir. The working gas capacity of the Yela UGS site is 1 billion m3, and the total reservoir capacity is approximately double that. The delivery and distribution of natural gas take place thanks to the national network supervised by the control centre throughout the gas system based on the diverse demand in different areas of the country. Monitoring the pressure is necessary because a defined range of values must be maintained; the maximum pressure at the system inlet is between 72 and 80 bar, whereas the minimum is approximately 45 bar [18].
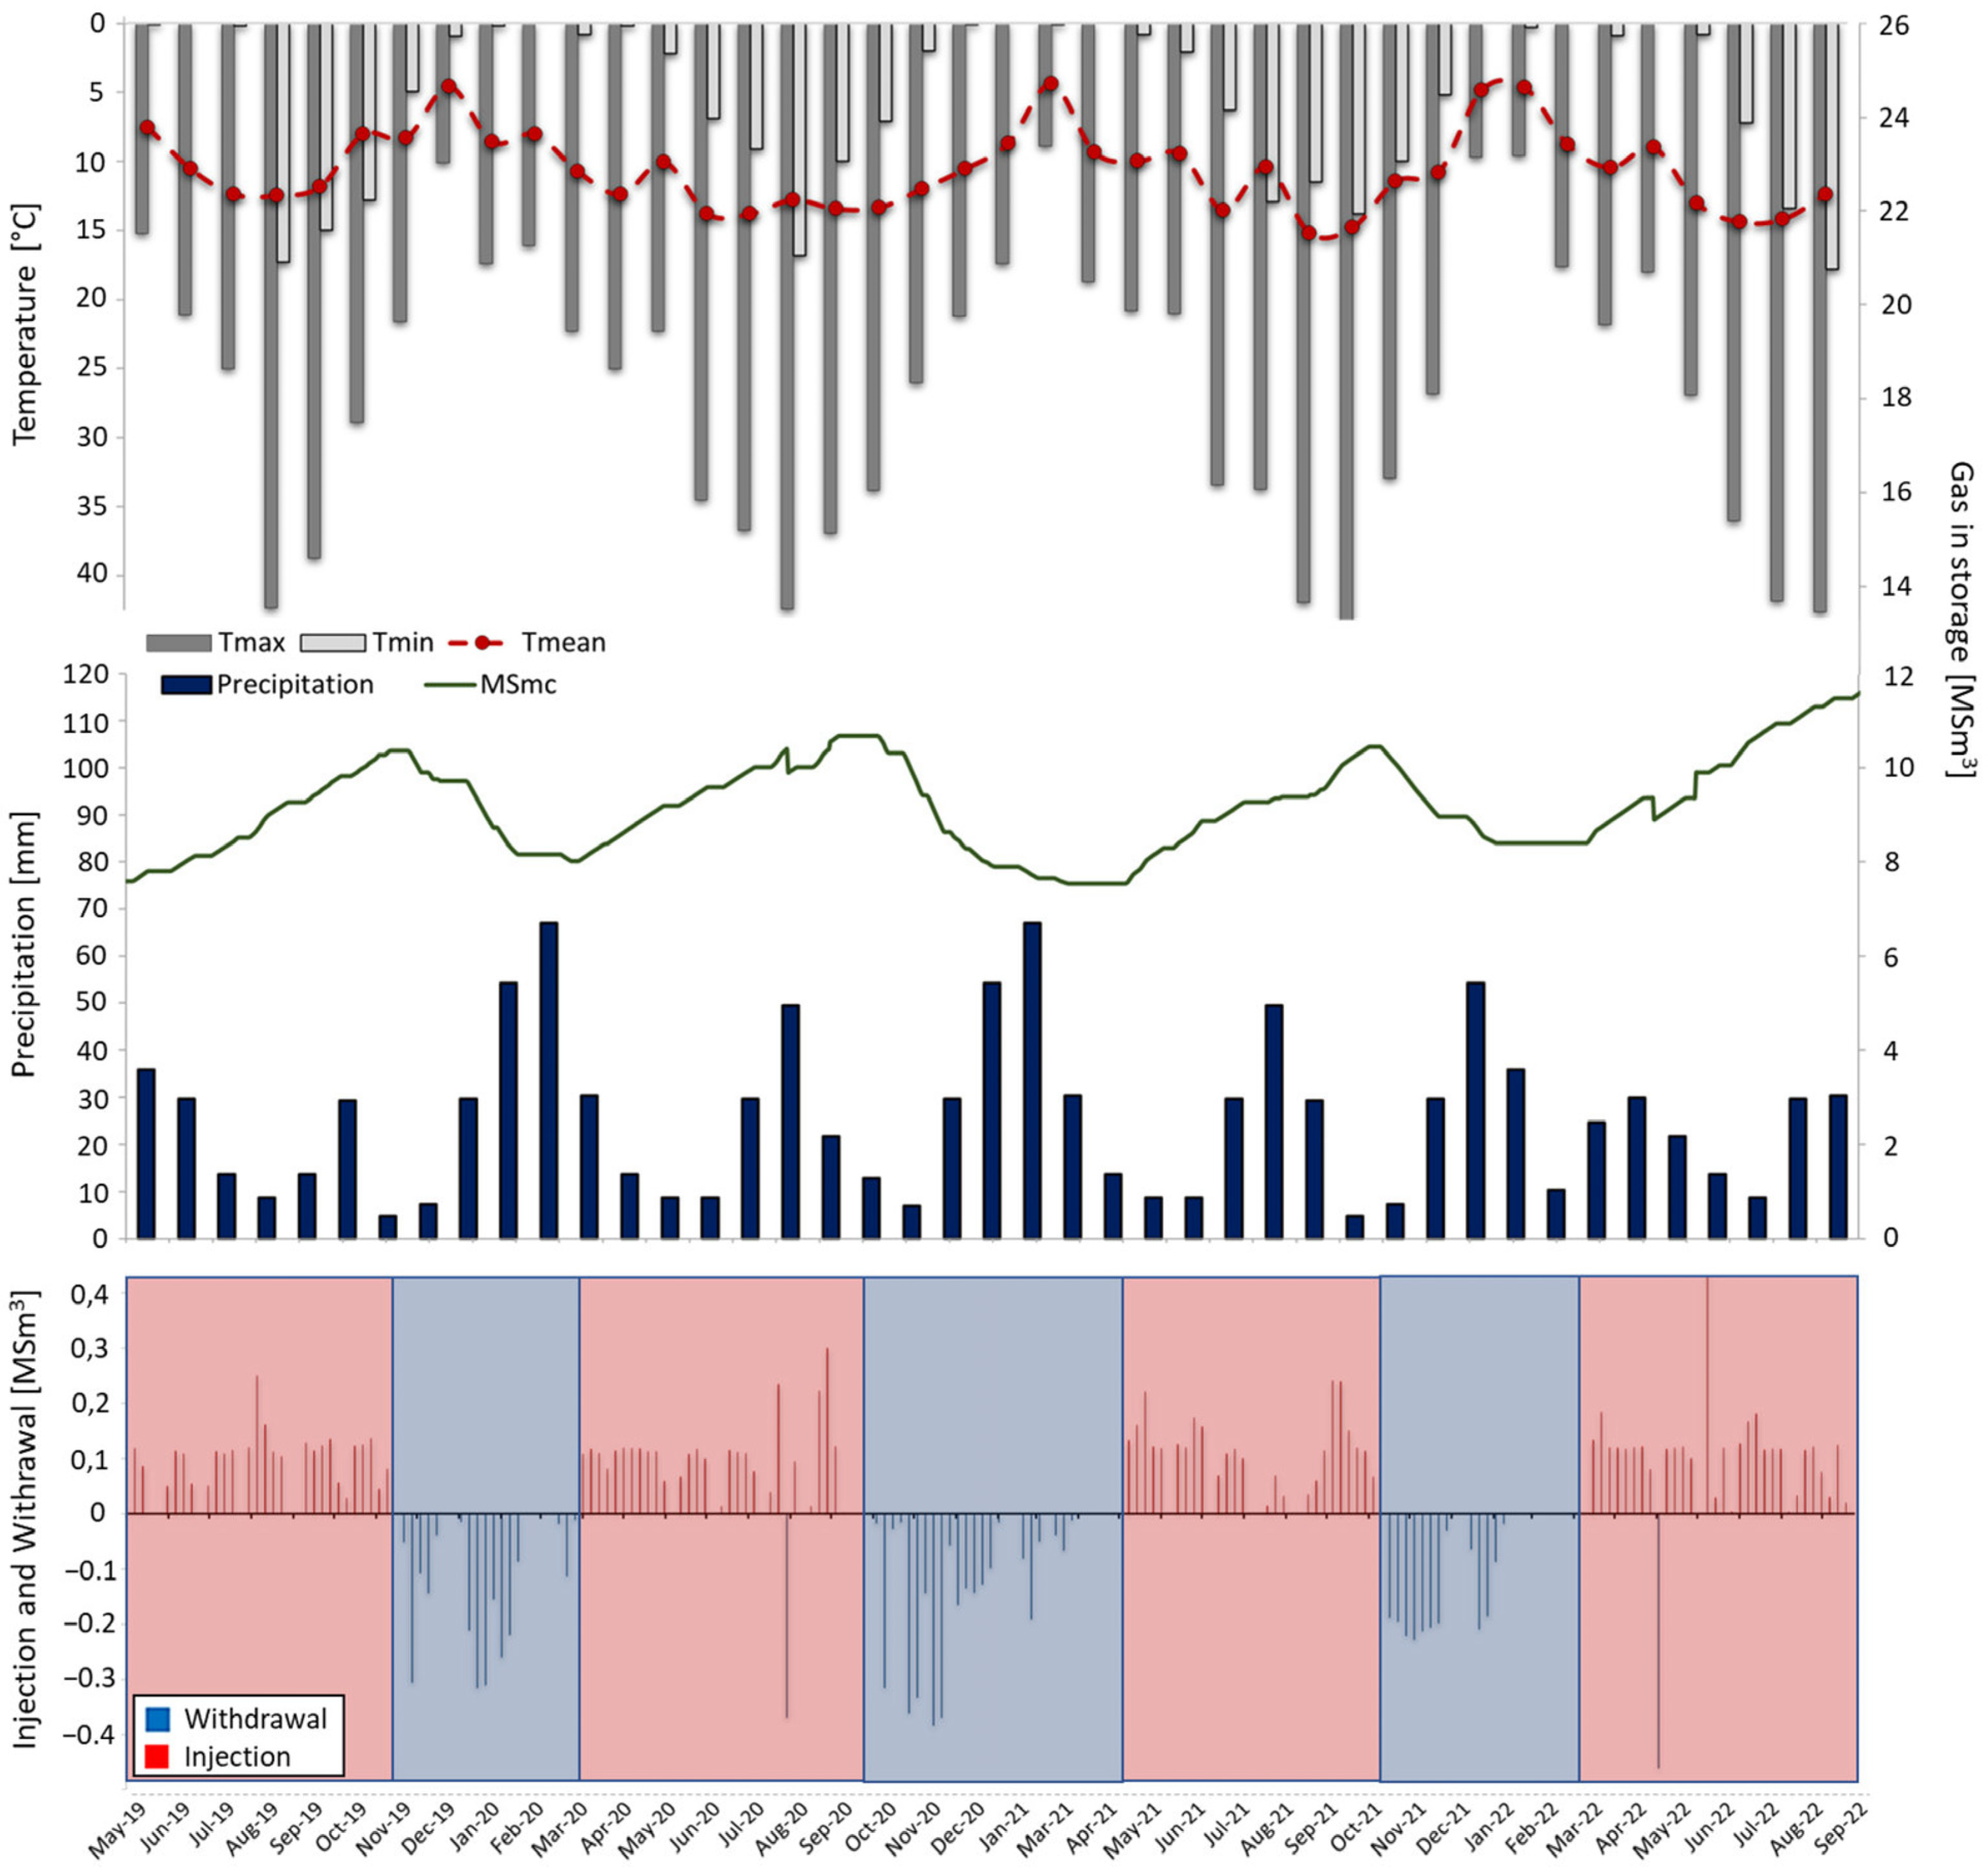
It is worth noting that the Spanish Seismic Network, operated by the Geographical Institute of Spain [22], has recorded a set of microearthquakes since the start of the UGS activities, with seasonal trends coinciding with injection operations prior to winter withdrawal [20]. Figure 4 shows the curve of gas volumes stored in the reservoir in relation to atmospheric temperature and seasonal average rainfall in central Spain [23], and the total net injection/total gross withdrawal from May 2019 to November 2022.
3. Materials and Methods
3.1. InSAR Data
The ground displacement induced by UGS activity can be detected using both ground-based and remotely sensed data. The latter involves non-contact techniques that receive and record signals interacting with the surface or objects above the reservoir area. Over the last decade, InSAR has become a widely recognised tool for monitoring storage activities, taking advantage of the emission/reception sensors mounted on satellites. Its popularity can be largely attributed to the advent of differential interferometry (DInSAR) techniques. The working principle of InSAR is rooted in the measurement of the phase difference of the return signal at each pixel between two radar images. DInSAR revolves around the analysis of a pair of radar images acquired by a Synthetic Aperture Radar (SAR) sensor [25]. Specifically, InSAR methods rely on the phase delay of a reflected microwave (radar wave) to gauge variations in distance along the Line-of-Sight (LoS) direction of the satellite [12]. The final result of the DInSAR approach is the interferogram, expressing the phase difference for each pixel of the images acquired from two satellites passing over the same area. In operational terms, an interferogram is produced by summing the complex values of one SAR image with the complex conjugate of another image once they are adequately resampled (co-registered) on the same grid (for more detail see [12,25,26,27,28]). The variation in phase components for each pixel can be represented by the equation:
where φd represents the phase shift caused by target displacement between the two acquisitions; φa denotes the phase contribution resulting from differing atmospheric conditions during the acquisitions; φt is a component related to changes in the acquisition geometry, which is highly influenced by local topography; and ν accounts for the noise, which encompasses thermal, temporal, and geometrical decorrelation phenomena affecting the phase value of the pixel [26]. The analysis of multiple SAR images (Advanced Differential InSAR, A-DInSAR) and derived interferograms allows the temporal evolution of ground deformations to be recovered. The displacement time series are extracted from ground features with reflective capabilities (e.g., buildings, roads, and rock outcrops) that maintain an optimal level of coherence during the monitoring period. The literature on InSAR techniques and applications is extensive. Pixel selection can be performed using different algorithms [27]. These algorithms usually fall under two main approaches: permanent (or persistent) scatterers interferometry (PSI [28]) and distributed scatterers interferometry (DSI [29]). The first group creates a dominant scattering point centre within the resolution cell and results from a combination of all the signal backscattered by the elements inside, limiting phase decorrelation effects due to different acquisition geometries (characterised by high reflectivity values and stable phase values), whereas the second group consists of ground features that, when considered individually, do not exhibit strong amplitude or a stable phase. However, when integrated by averaging, their spatial and electromagnetic homogeneity enables specific algorithms to enhance their radar response (DS are much more common in natural environments). The result of multi-temporal A-DInSAR analyses is a deformation map composed of multiple points. Each point is defined by an annual velocity value and a displacement time series. This product boasts millimetre-level accuracy and delivers both high temporal and spatial resolutions [11].
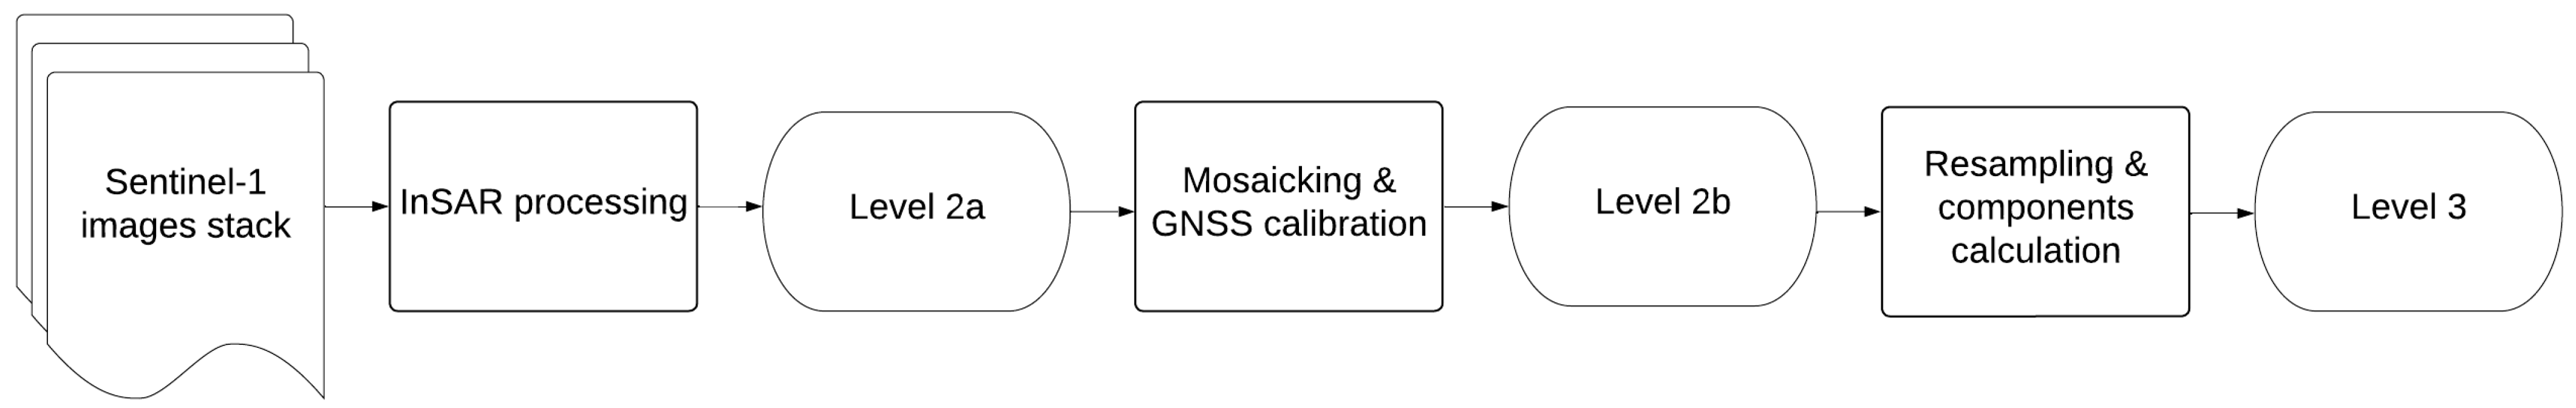
The InSAR data used in this study were extracted from the European Ground Motion Service (EGMS) under the responsibility of the CLMS (Copernicus Land Monitoring System) [30] using the EGMStream application [31]. The EGMS, founded by the European Commission (under the European Environment Agency’s framework service contract), constitutes the first application of InSAR technology in monitoring ground deformations over an entire continent (Copernicus Participating States and the United Kingdom) based on full-resolution processing of all Sentinel-1 satellite acquisitions [32]. Moreover, a Global Navigation Satellite System (GNSS) high-quality 50 km grid model was developed within the EGMS to calibrate the InSAR ground motion products. The EGMS provides data from February 2015 to December 2021 for the three types of products:
- Basic (L2a): This provides InSAR measurements of ground displacement along the LOS of the Sentinel-1 satellite, covering both ascending and descending geometries;
- Calibrated (L2b): Similar to L2a, this product includes InSAR ground motion measurements that are anchored to a common geodetic reference frame using a large-scale GNSS velocity model;
- Ortho (L3): This offers vertical and east–west ground deformation measurements. These are derived from multiple L2b products with complementary acquisition geometries and are tied to the geodetic reference frame.
These products are available through the EGMS explorer [30]. The four partners that compose the OpeRational Ground motion INsar Alliance (ORIGINAL) consortium (e-Geos, TRE Altamira, NORCE, and GAF) operate their own processing algorithms implemented in the different processing chains based on advanced PS and DS InSAR processing techniques. However, end products have the same attributes. The characteristics of the algorithms used by the 4 InSAR Processing Entities (IPEs) are listed in Table 3.
The EGMS data and processing methodologies, with the exception of SqueeSAR, rely primarily on PSI algorithms. InSAR techniques grounded on DS come into play to supplement PS results, especially in areas where the density of pointwise scatterers falls short of the project’s standards [26]. Figure 5 provides a streamlined flowchart of EGMS processing and showcases a visual representation of the three product levels.
On the AoI (area of interest) of Yela, the InSAR datasets consist of calibrated Sentinel-1 ascending (A15-001 and A16-103) and descending (D16-081) data, and the horizontal and vertical deformation components are established based on the geodetic reference model data provided by EGMS [30]. Sentinel-1 data provide time series analyses of ground deformation measurements from February 2015 to December 2021, with a temporal resolution of 6 days in both observation geometries until early 2022 and then of 12 days temporal resolution due to a problem with the Sentinel-1b satellite. As of May 2019, Sentinel-1 data can be compared with the available data on injected/withdrawal gas volumes provided by Enagàs [18]. The satellite data cover an area larger than that of the UGS facility in Yela. Table 4 shows the main characteristics of the Sentinel-1 datasets that were downloaded and used to analyse ground displacements over the Yela gas storage facility.
3.2. Ancillary Data
Several non-InSAR datasets (Table 5) were used for the analysis and monitoring of the Yela UGS site, enabling their comparison with ground displacement data provided by the EGMS.
Daily injection and withdrawal data allowed the definition of the temporal trend in the cumulative volume curve of natural gas in the reservoir, which is crucial for understanding the relationship between the ground displacement areas recognised by remote sensing data and the underground gas storage operations. Comparison of storage volumes with surface displacement time series, considering the temporal displacement and the amplitude of both curves, allows linking of the effects of ground deformation with UGS activity. Analysis of historical values of atmospheric temperature and precipitation makes it possible to confirm the dependence of surface effects on the UGS operations in the survey area. In addition, the inverse distance weighting (IDW) method [38] was used to estimate the ground displacement distribution from the EGMS data in 2D and 3D. IDW interpolation explicitly assumes that things that are near each other are more similar than things that are far from each other. This method enables the prediction of a value for any unmeasured location using measured values surrounding the prediction location.
3.3. Volumetric Change Detection
Ground volume changes were assessed by analysing the available MP data using the 2.5D volume computation plug-in in CloudCompare open-source software v2.12 beta (CC) [39,40]. The plug-in allows the creation of a grid composed of square bins generated over the selected study area, with a dimension of 125 × 125 m chosen with respect to the distance between the MP (100 m). With this approach, all the areas without MP were regarded as empty cells and were therefore not useful for computing variations in volume. The average value of the vertical displacements (L3) relative to all MPs falling in a bin was assigned to the bin itself. This procedure was repeated twice, once taking into consideration the minimum vertical MP displacement based on the natural gas withdrawal (the maximum negative displacement value with respect to the average surface elevation) and the second taking the highest MP vertical displacement during the injection period (the maximum positive displacement value). The two obtained grids, each with different elevation values (max z1 and min z2) but the same coordinates (x, y), were used to calculate the variations in volumes between the two periods. The calculated volume (V) of the selected area is the sum of the volumes of each elementary parallelepiped (dV):
where i is the number of non-empty MP elementary parallelepiped, is the grid step, and is the difference between the minimum and maximum heights.
4. Results
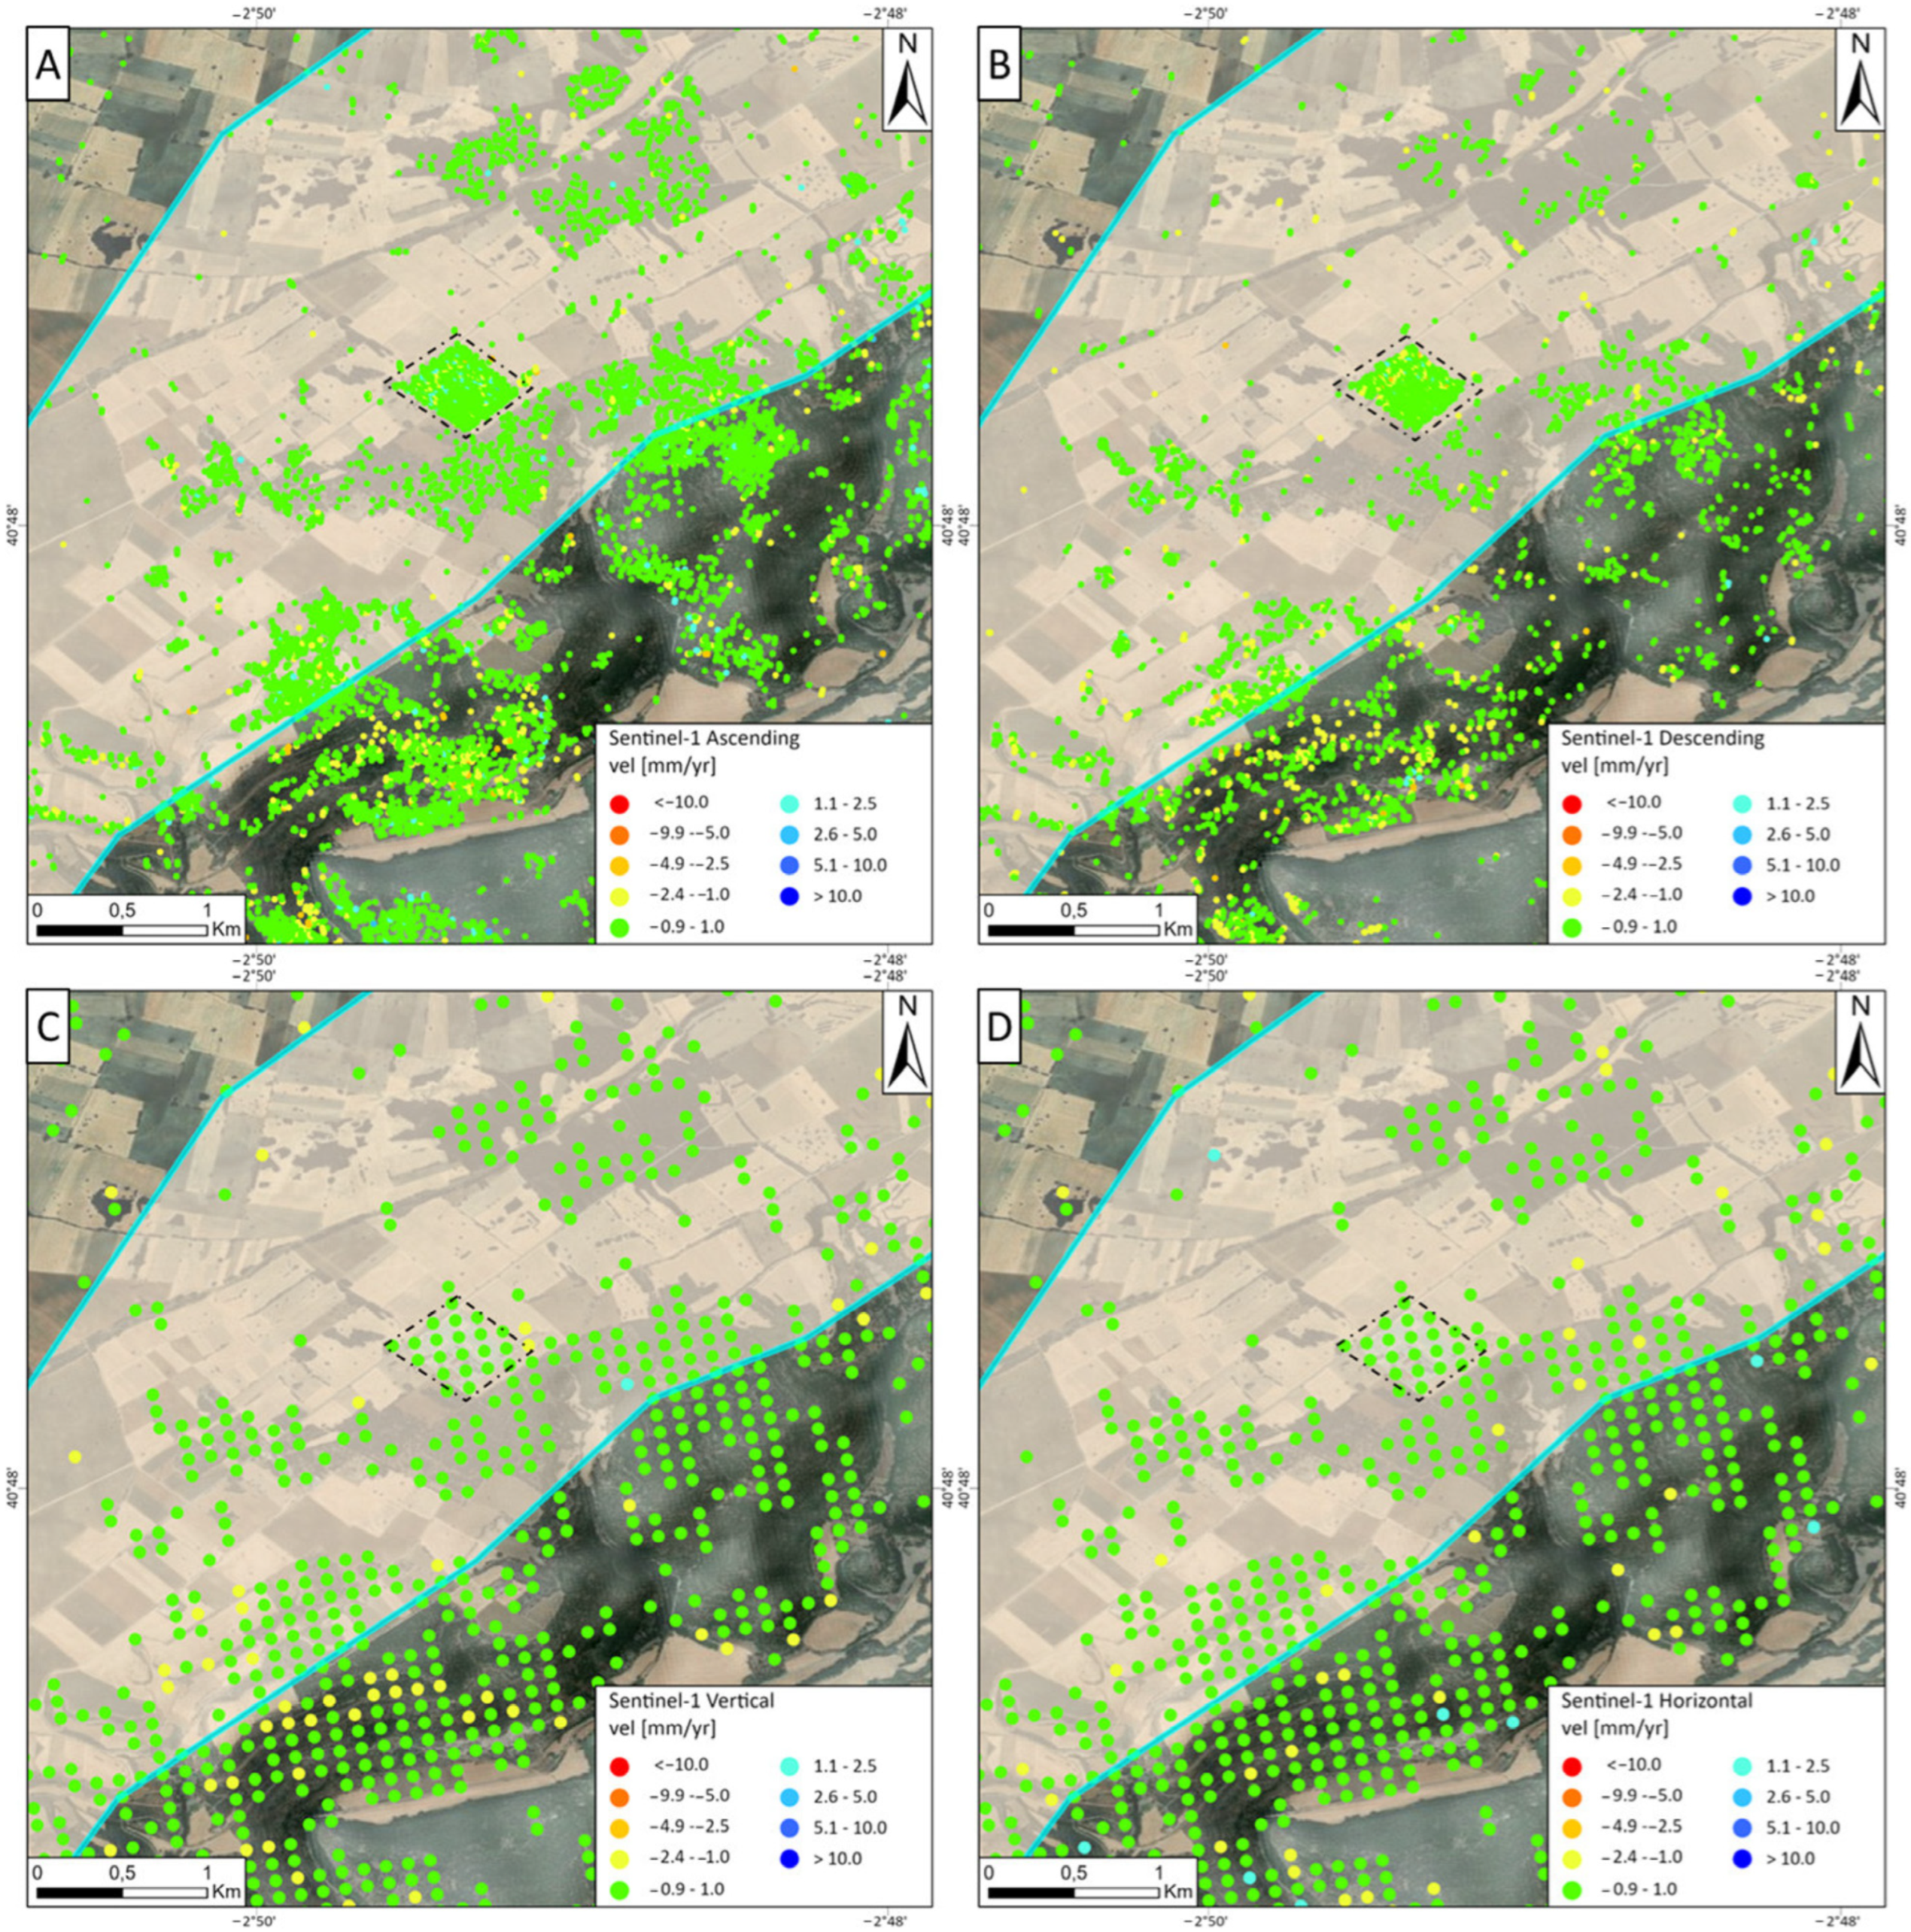
The displacement maps in the ascending (Figure 6A) and descending (Figure 6B) orbits show the overall stability of the study area, with local zones showing positive values indicating motion towards the satellite, e.g., a slight uplift, and negative values representing motion away from the satellite, e.g., a subsidence trend. The vertical velocity map (Figure 6C) shows the overall stability of the field area, as does the horizontal velocity map (Figure 6D). Although the area of interest does not show vertical or horizontal velocity on ground deformation maps in LoS, a useful time series analysis of the UGS site can be conducted since it enables the detection of additional information on seasonal variability as non-linear and seasonality trends.
Thanks to the regular acquisition of data from the Sentinel-1 constellation, it is possible to monitor deformation over time, understand cyclical variations, and investigate related phenomena. Time series analysis showed cyclical trends, with no general linear trend, explaining why the average velocity of the areas of interest remained within the ±2 mm/year stability range. In fact, no trends, excluding the cyclicity of the withdrawal and injection phases, were detected over long periods. This demonstrates the importance of analysing time series MP data from areas involved in UGS activities to detect details that may be hidden in the average velocity computed for a given period. The mean velocity approach is beneficial in continuously deforming regions. However, by merely fitting a line through a time series to calculate it, most of the information on temporal variability is lost.
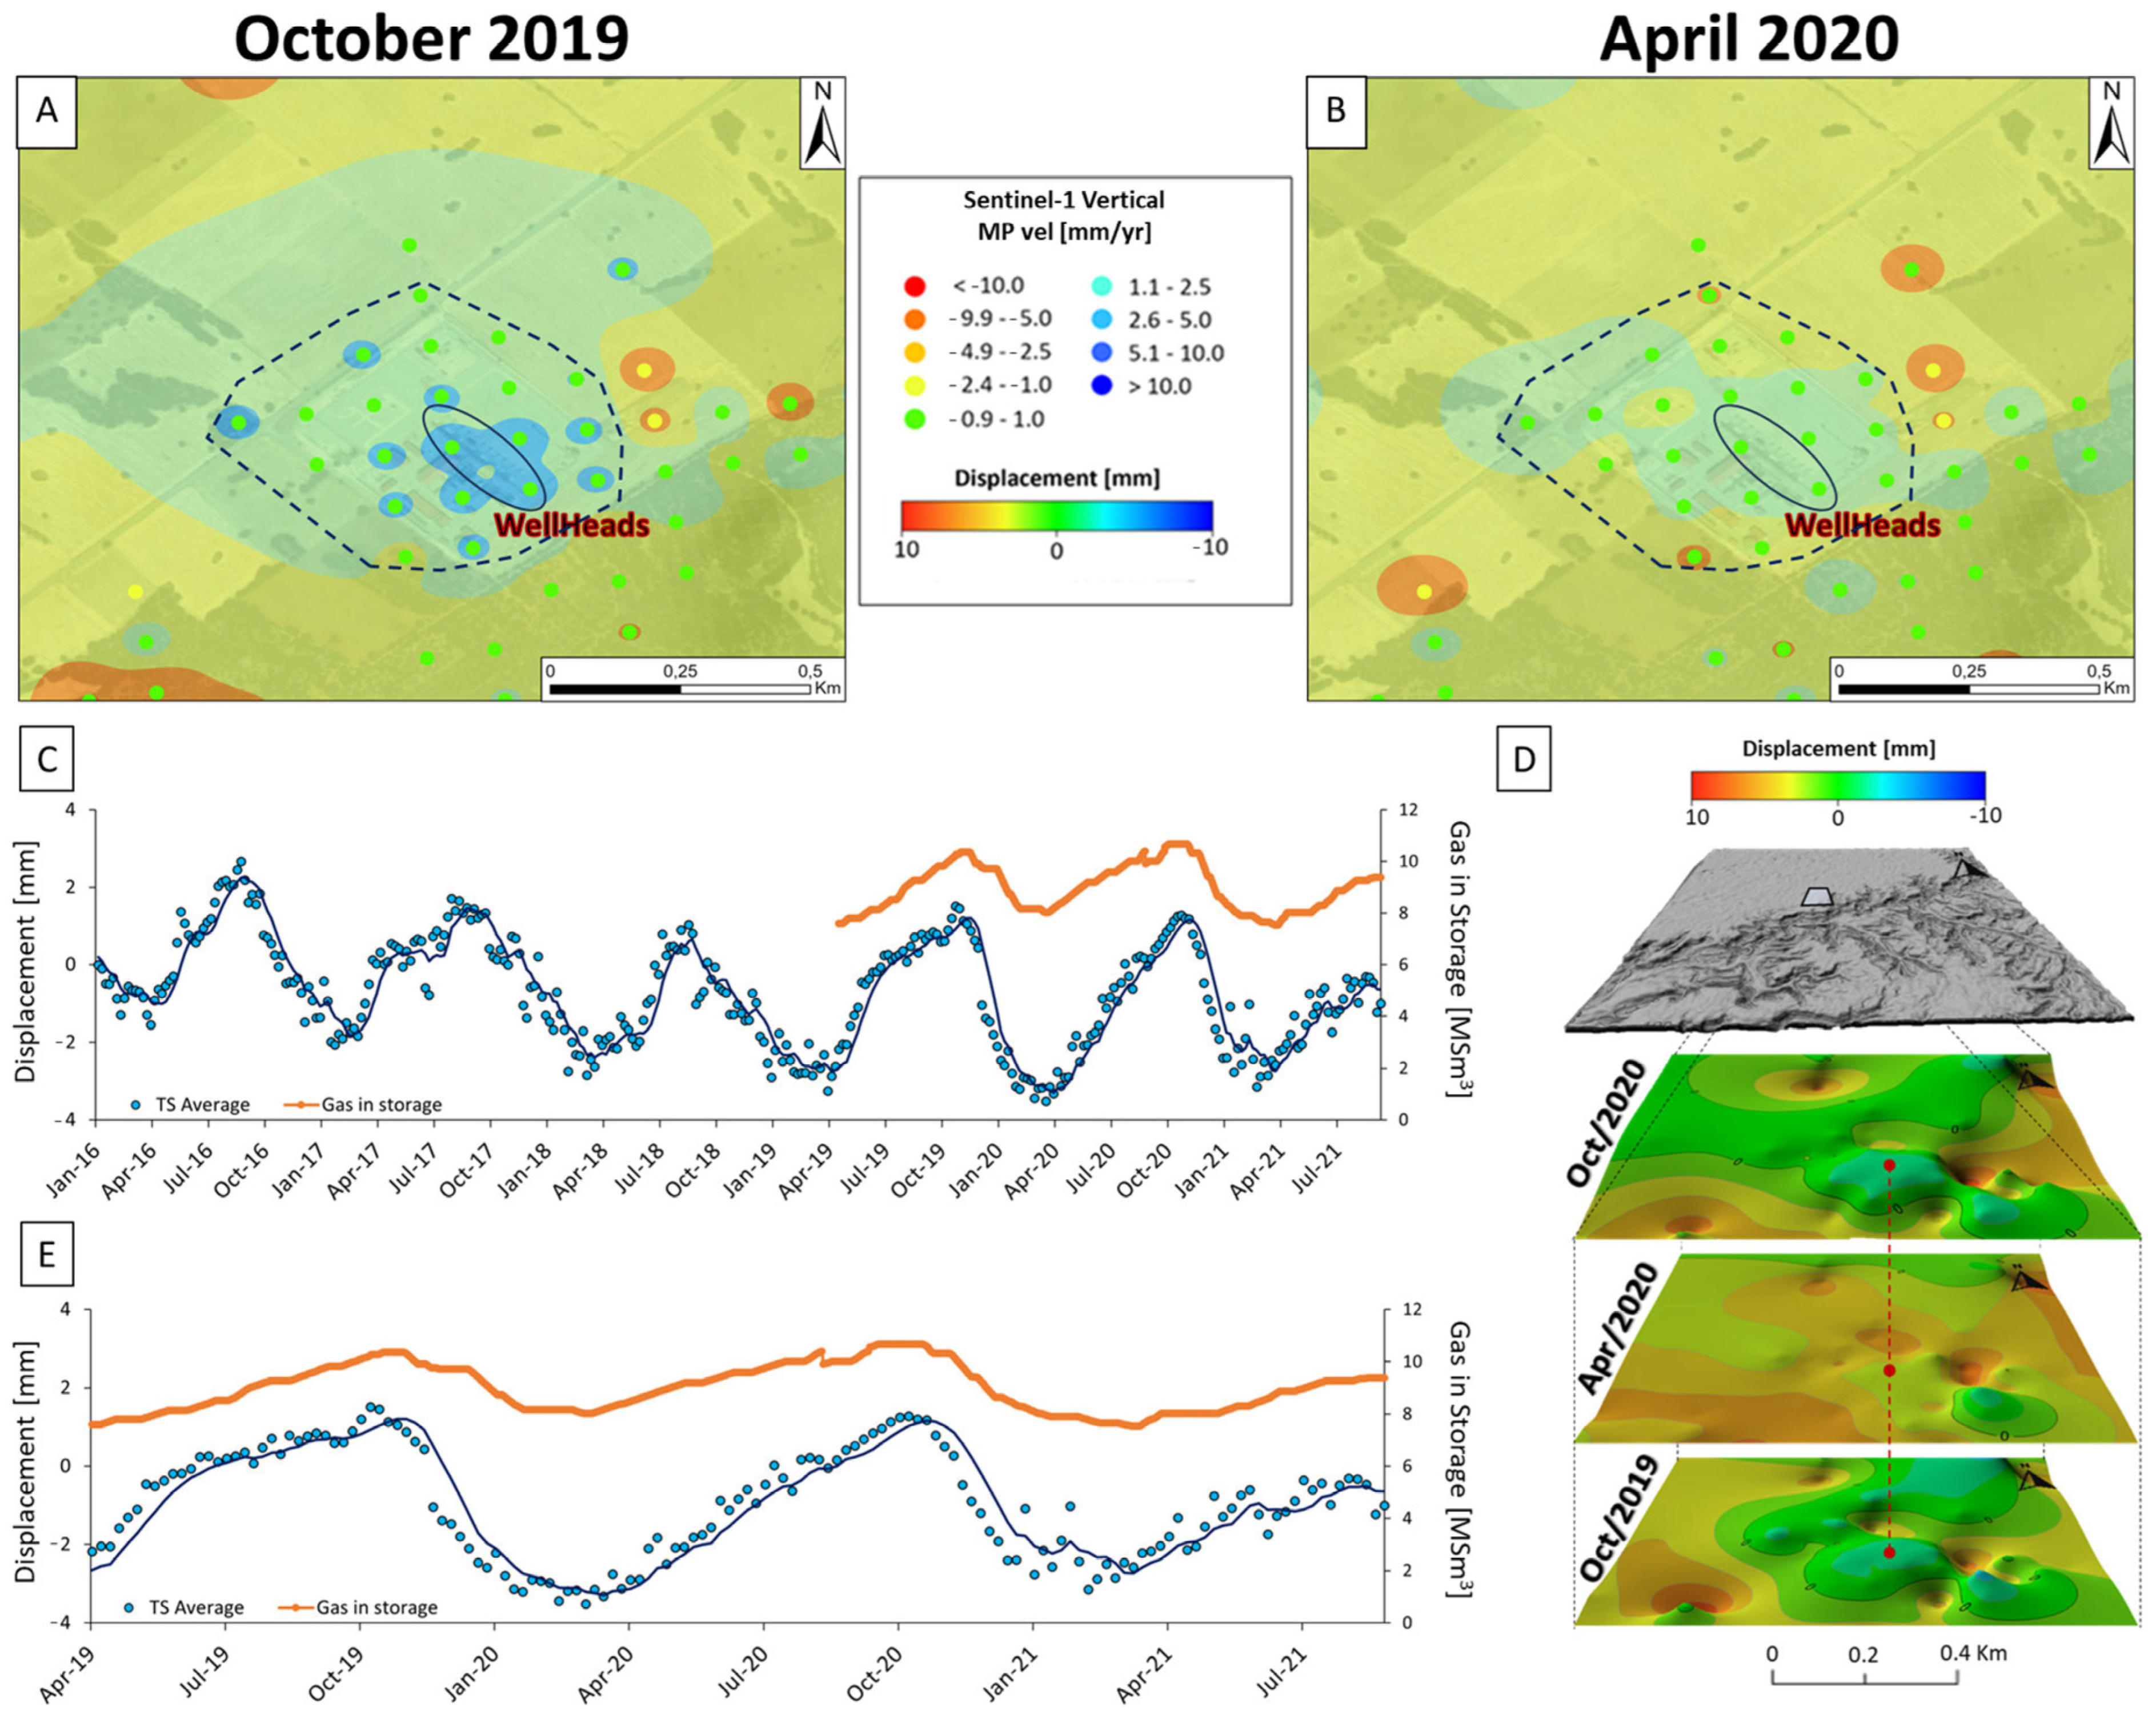
Figure 7 shows interpolation maps of the vertical ground information on the MP, constructed using IDW interpolation [38]. These maps correspond to (A) the maximum peak (October 2019) at the end of the injection period and (B) the minimum peak (April 2020), indicating the conclusion of the withdrawal period over the Yela field. The temporal evolution of the vertical displacement component at the Yela site follows a pronounced sinusoidal trend. This trend correlates strongly with the volume of the gas in storage, both in amplitude and periodicity, as illustrated in Figure 7C–E. It is worth noting that a slight shift of approximately 15 days can be recognized, probably due to the time necessary for the fluid to flow everywhere and create the subsurface response to the overpressure. This cyclical behaviour is closely linked to the periodic injection and withdrawal of natural gas into and from the reservoir. Vertical displacement in years with matching data (from the end of 2019 to 2021, see Figure 7E) shows the maximum and minimum peaks at the end of each injection and withdrawal period (October/November and March/April).
In this case study, the prominence of vertical displacement over horizontal displacement aligns with the expectations, taking into account the depth of the Yela gas storage, which is between 2300 and 2550 m deep. Deformations triggered by natural gas injection and extraction must be progressively relayed from the topmost layer of the reservoir to the surface, as detailed in [41]. Thus, theoretically, surface deformation effects become more pronounced the shallower the storage depth is. However, determining this “sealing depth” or effective depth of influence is not straightforward and several geotechnical factors come into play, including reservoir porosity, saturation, and other intrinsic properties, as well as the cap rock’s integrity and thickness [10]. Despite this, the horizontal motion shows a slight sinusoidal signal in the MP located within the structural trap in the Yela area (MP1 in Figure 8C), showing a positive trend during withdrawal periods (east direction) and a negative trend during injection periods (west direction). The behaviour of ground displacement of a wide area is similar to a bowl both in uplift and subsidence, showing a small component in the centre and outwards during the withdrawal and injection phases, respectively.
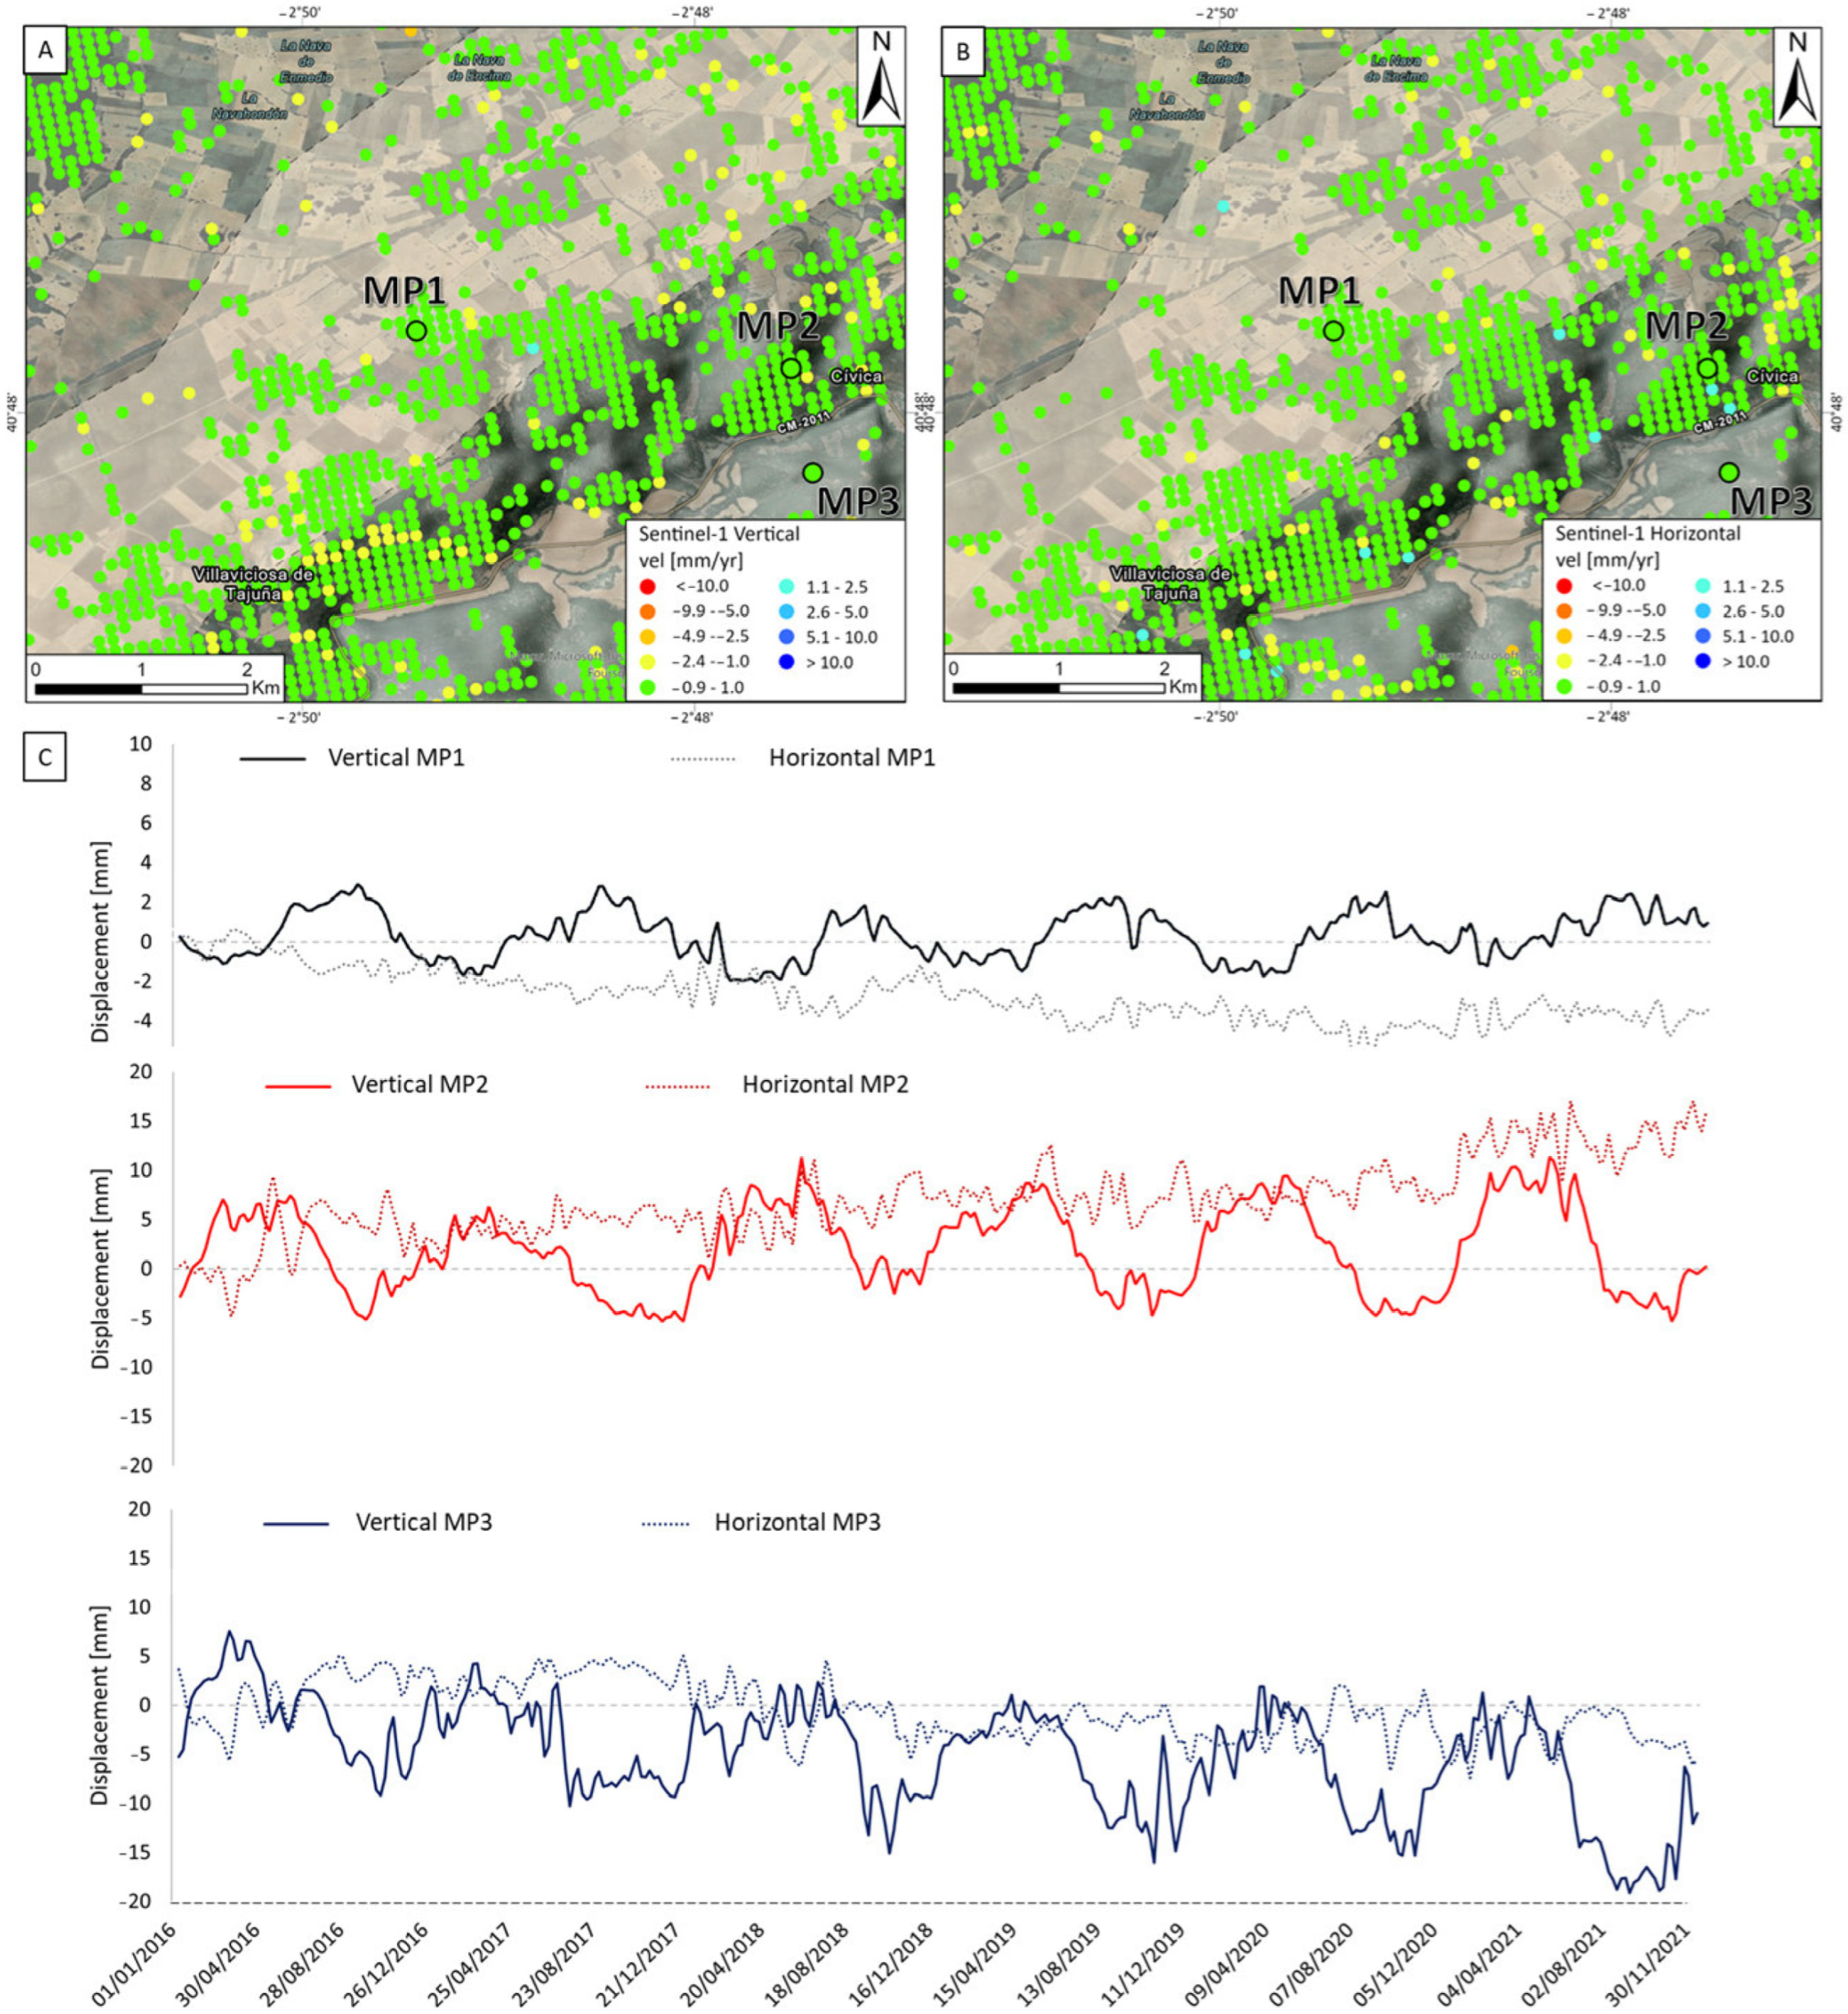
Increasing the scale of the investigation showed two areas with different surface displacement time series behaviours. Three representative MPs in the InSAR-monitored area were selected inside (MP1 in Figure 8A,B) and outside (MP2 and MP3 in Figure 8A,B) the structural trap area where the natural gas is stored (represented by the grey polygon). The analysis of these MPs is useful for analysing the time series of ground displacement along the vertical and east–west directions. The southeastern area of the Yela underground gas storage facility (MP2 and MP3) has a phase that is exactly opposite to the vertical movements observed in MP1. Consequently, as the terrain above the reservoir rises due to the injection of natural gas, the adjacent areas subside, and vice versa. In contrast to MP1, the two MPs selected outside the structural trap show no seasonality in horizontal displacement. In addition, it is possible to recognise a slight shift of approximately 20–30 days between the time series of MP1 and those of MP2 and MP3 (Figure 8C).
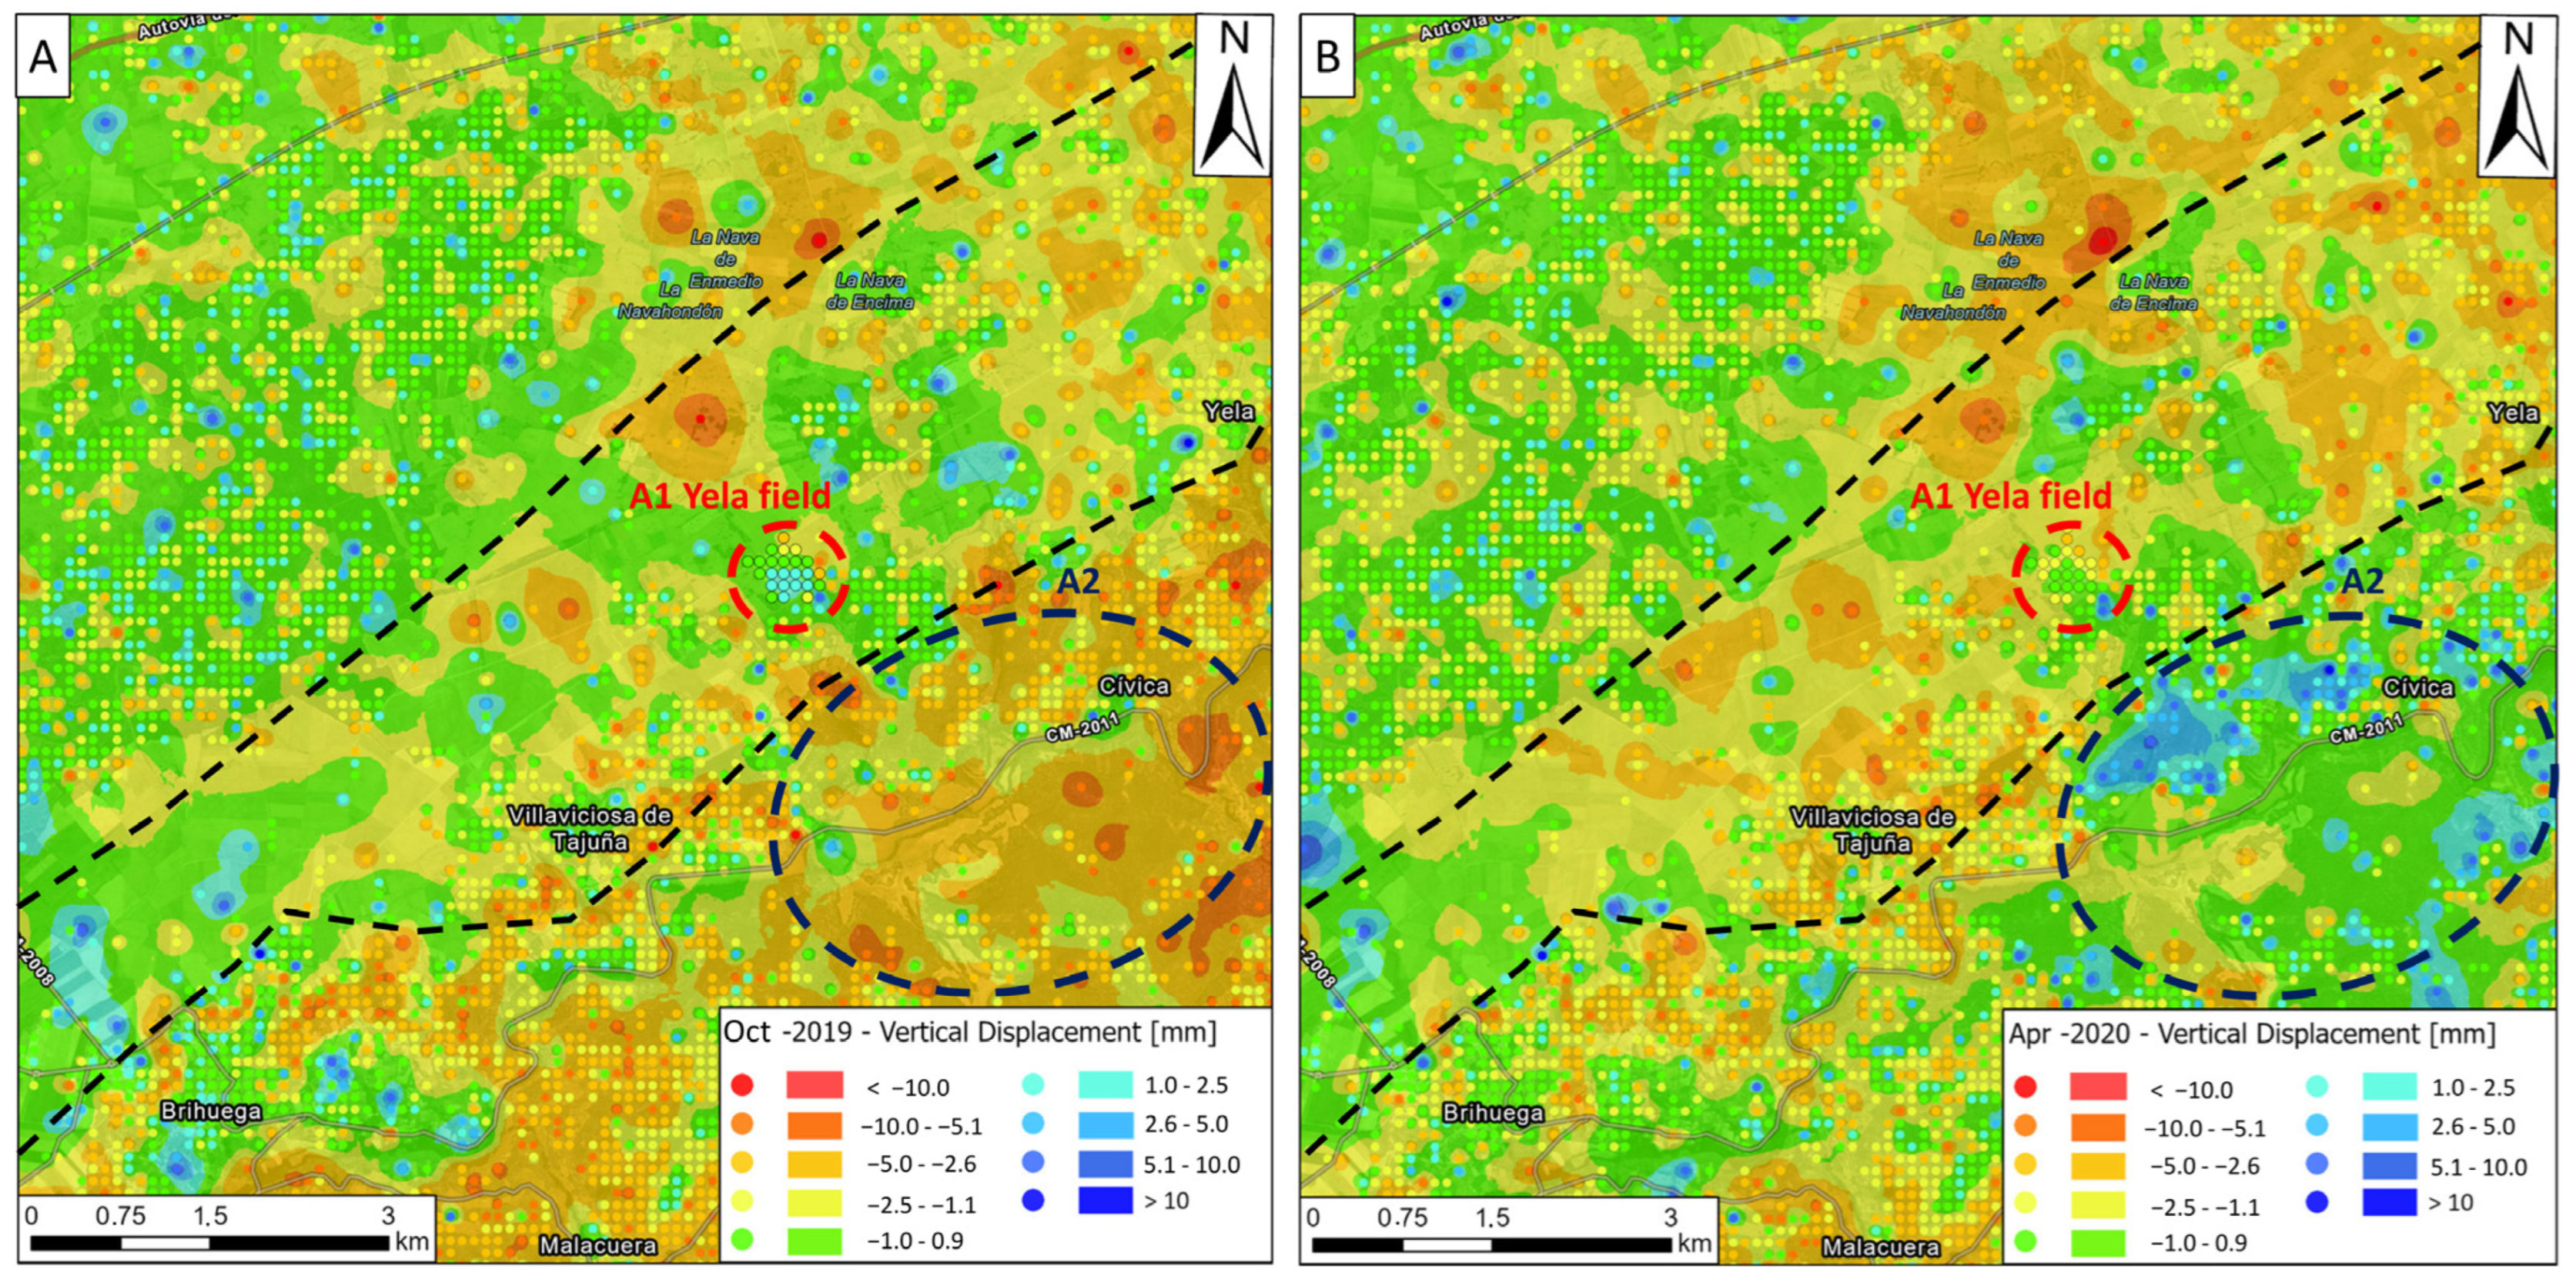
The interpolation maps of the basin scale of the vertical ground information of the MPs generated using IDW [38] on the vertical motion data (Figure 9A) for the maximum peak (October 2019) at the end of the injection period (Figure 9B) and the minimum peak (April 2020) at the end of the extraction period over the Yela field shows a different response on the surface (Figure 9). Typically, during the injection and withdrawal processes, the change in reservoir formation pressure results in noticeable surface deformation. However, when the reservoir is very deep, the surface ground deformation caused by UGS activities, which is recognisable in seasonal trend variations, is confined close to the injection and withdrawal wells [10]. Furthermore, as indicated earlier, the Yela facility area (A1 in Figure 9) and the external south-eastern area (A2 in Figure 9) show different ground deformation behaviours. The external area shows the opposite phase of vertical movement, thus the A2 area shows subsidence during the injection of natural gas, and vice versa during the withdrawal, with an amplitude value larger than that of area A1. This effect is evident when comparing the time series of MPs in the two selected areas (see Figure 8C).
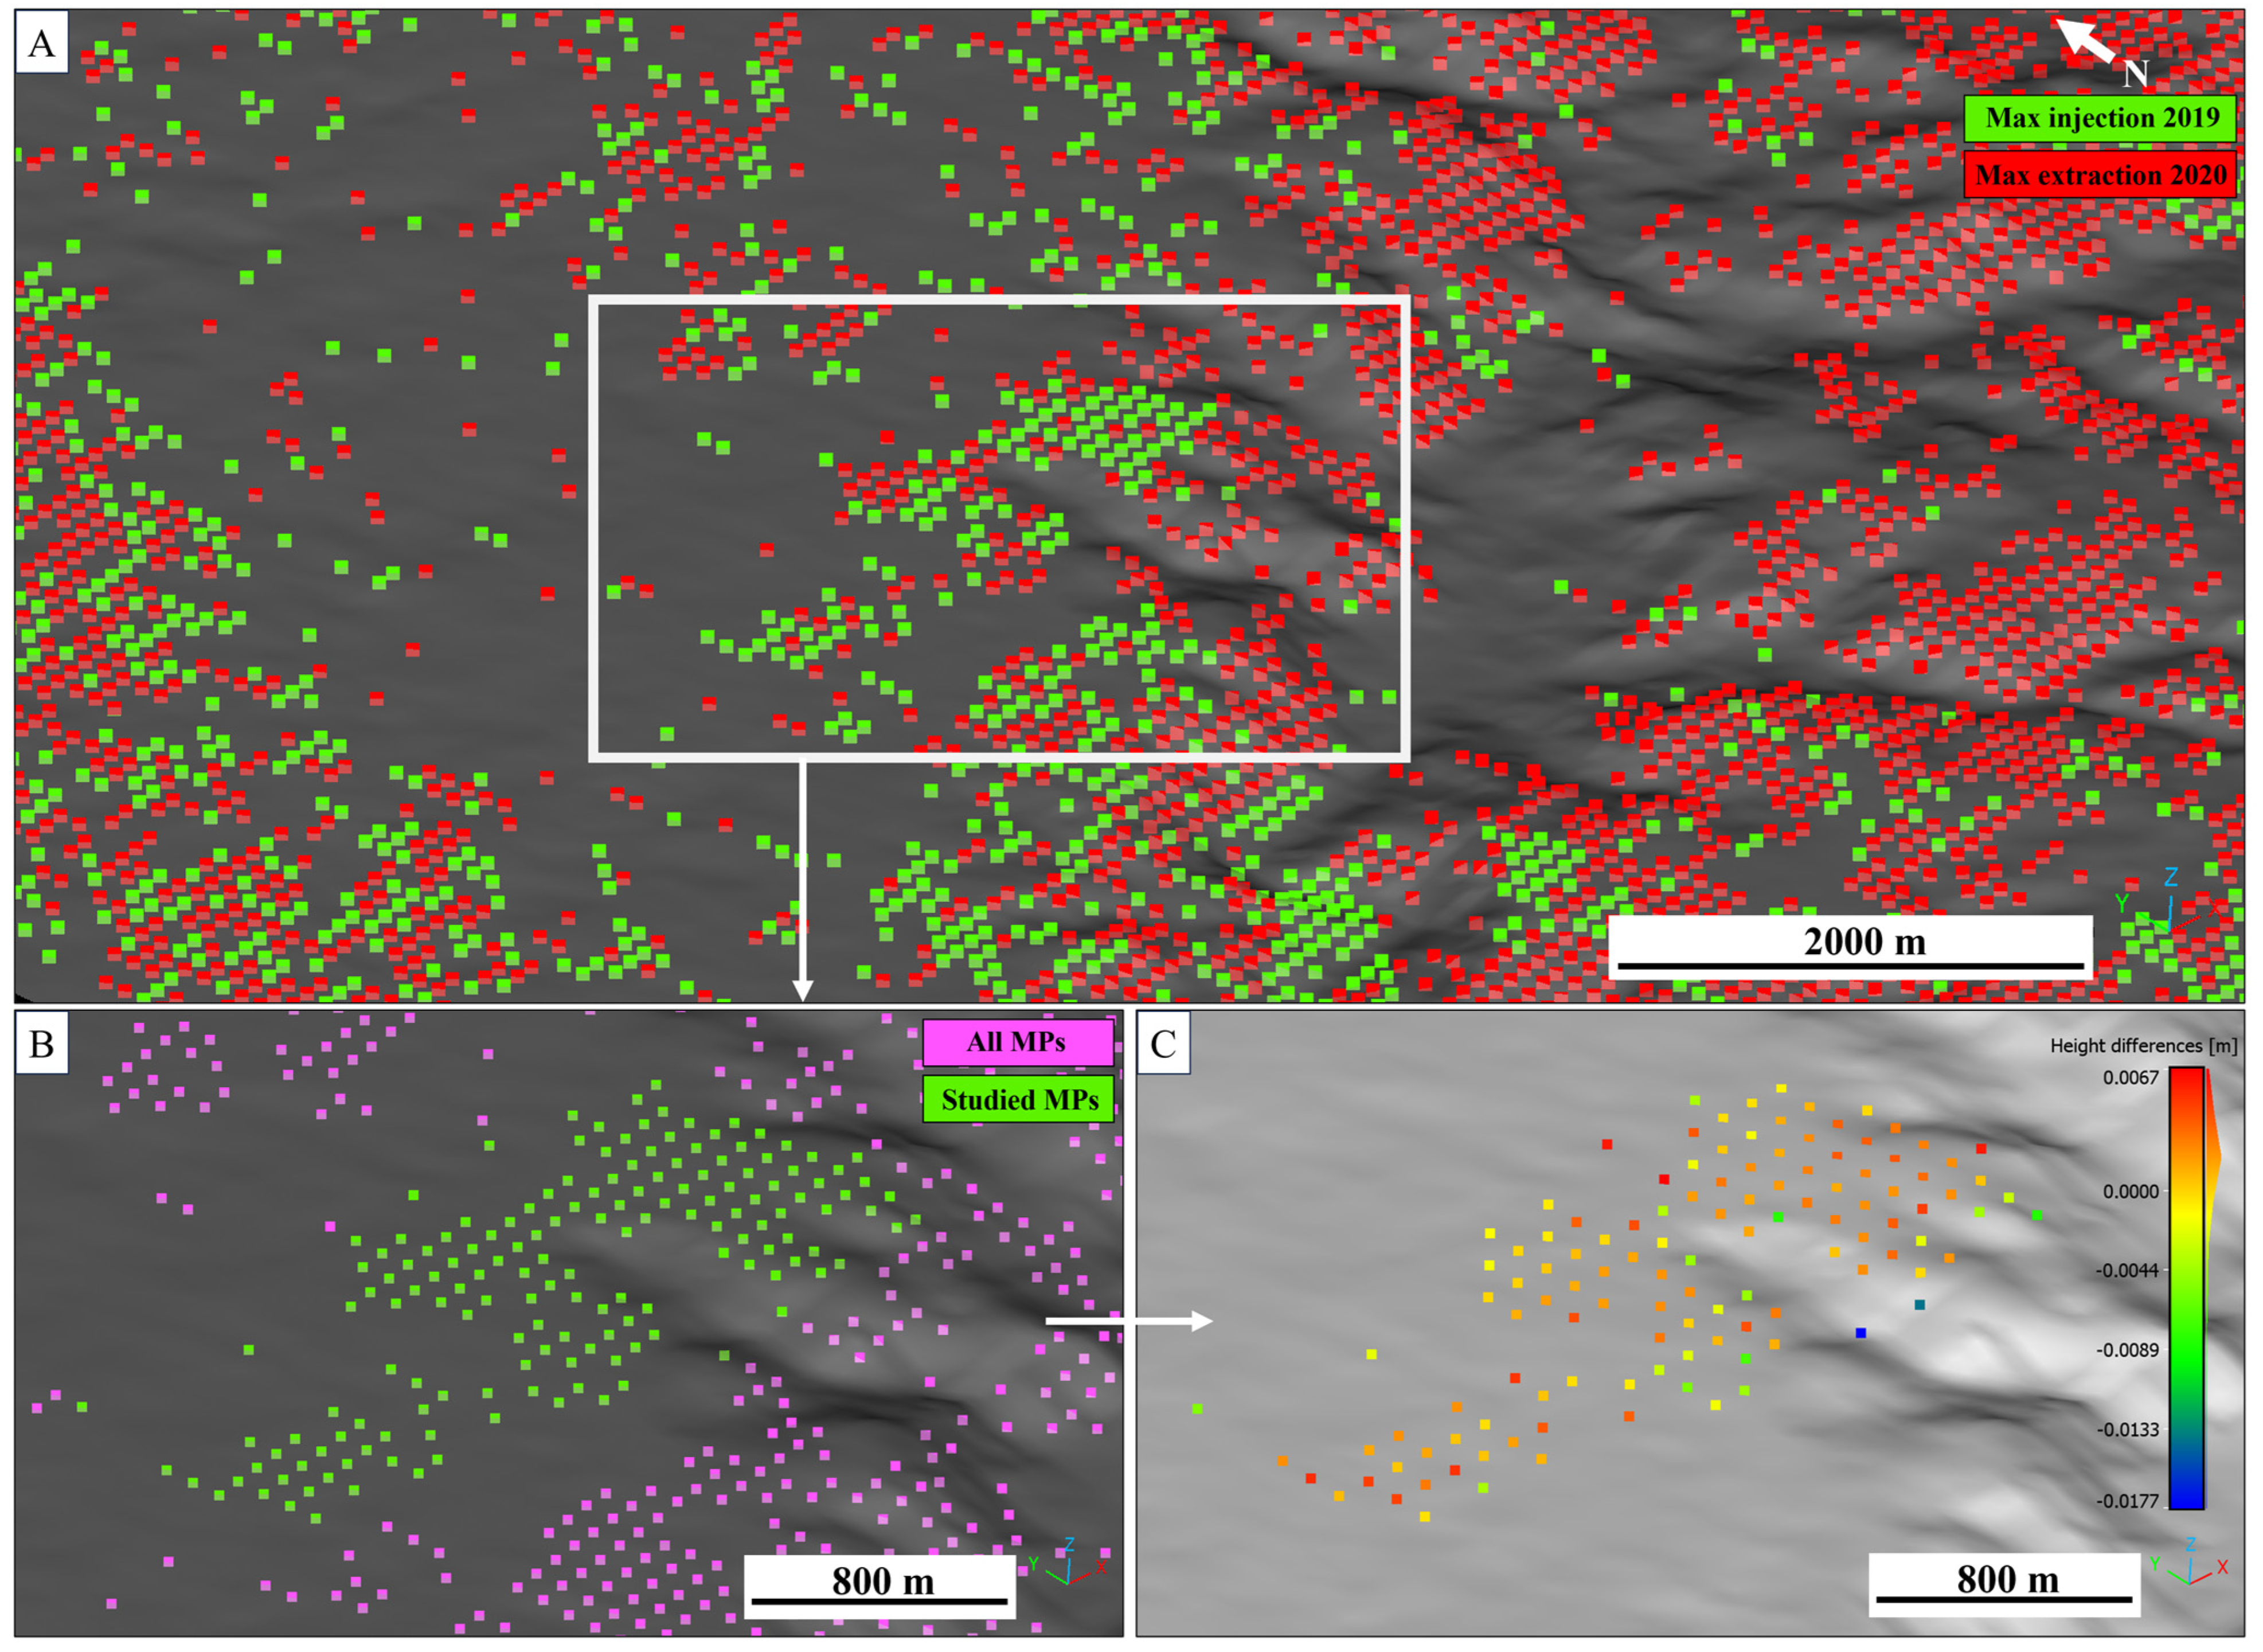
Analysis of volumetric changes between the period of maximum injection in October 2019 and the period of maximum extraction in April 2020 showed a strong correlation with time series results, highlighting two zones with different behaviours (Figure 8 and Figure 9): (i) the area above the storage facility, which shows a trend correlated with the gas in storage (A1 in Figure 9) and (ii) the south-eastern area with an opposite trend (A2 in Figure 9). The changes in volume were determined through analysis of displacement data obtained using the InSAR technique (Figure 10). However, it is important to note that, compared with the actual values, volumes derived from ground point displacements in the Yela area should be regarded as underestimations. This discrepancy can be attributed to the limited spatial density of the available monitoring points (MPs) used in this study. The volume computation performed in CC estimated a negative volumetric change of 1.074 m3 in the area designated as A1 (Figure 9), which spans approximately 1.5 km2 and includes the Yela plant (Figure 10B,C). These results support the hypothesis that only a small deformation in the dolomite reservoir is evident on the surface. The short-term cyclic subsidence/uplift associated with UGS is limited to the chosen area and is maximum above the 11 wellheads (see Figure 7A,B).
5. Discussion
Underground gas storage serves as a vital mechanism for establishing national strategic reserves and ensures a consistent and dependable supply of natural gas. These storage facilities play a crucial role in maintaining stability in gas networks, allowing for quick compensation during consumption peaks, especially in winter. Compared with storage options on the surface, underground gas storage facilities offer the advantage of storing significantly larger quantities of gas, leveraging natural geological formations for capacity. However, gas storage activities, which induce continuous stress changes in the reservoir, can threaten caprock integrity. Since 2012, the north-eastern Madrid Basin area, where the Yela facility is located, has been exploited for Underground Gas Storage activities. Its strategic location in central Spain makes Yela a key infrastructure for guaranteeing energy supply for the country. The UGS Yela site provides great flexibility to the gas system by exploiting a deep fractured aquifer with an active water system, making it possible to switch almost seamlessly from injection to extraction, and vice versa. An appropriate monitoring system and a risk management plan can ensure the safety and stability of local environments. In this regard, InSAR data can play a key role thanks to the high-precision measurements of ground deformations. In addition, the huge spatial and temporal extension of the InSAR products allows the investigation of the UGS at a low cost (EGMS data are completely free). Analysis of InSAR measurements can provide accurate surface deformation data over wide areas, enabling continuous monitoring of UGS activities over time. While additional data is needed to establish comprehensive guidelines for UGS management, InSAR technology appears to be a key tool for complementing in situ data, enhancing facility safety and minimising the risk of gas leaks. One of the main limitations of the InSAR approach is land cover. Rural areas, with rough terrain and vegetated areas, have associated low-phase coherence; this results in limited spatial coverage of InSAR measurement points [42]. Another limitation is the reduced presence of reliable and durable PS in heavily vegetated and complex mountainous areas [9] where many UGS sites are located. Despite these issues, InSAR technology is one of the best methods for monitoring UGS projects. Furthermore, InSAR holds significant potential for future developments. For example, by comparing ground deformation data with pressure and temperature changes in the reservoirs, optimal thresholds of injection and withdrawal rates can be identified, thereby improving the overall management and longevity of the storage system.
InSAR results show a strong correlation between periodic natural gas injection/withdrawal in the reservoir and corresponding vertical ground deformation around the Yela facility. Time series results, obtained by comparing the vertical time series of displacements with the volume of the stored gas, highlight that ground movements in the Yela UGS site are not associated with seasonal temperature changes in the area. The temperature variation should show the same behaviour in all MPs, whereas in this case, the seasonality associated with UGS operations is only recognisable in those up to a maximum distance of approximately 2 km from the injection and extraction wells. In addition, the maximum temperature in central Spain was recorded in July, August, and September of each year, while the maximum ground deformation was identified in October and November. The same shift can be recognised when the minimum temperature (occurring in January and February) and the peak deformation (identifiable in March and April) (Figure 3) are taken into account. A discrepancy can also be recognised when rainfall data from the investigated period is considered.
It is important to note that several earthquakes, identified by the Instituto Geográfico Nacional [22], have occurred in the study area since the start of UGS activities in 2012. In most cases, induced seismic activity may be so low that it is not perceived on the surface. Pérez-Lopez et al. [19] highlighted that the anticline enclosed by the complex thrust system can act as an effective pathway for gas leakage and can trigger seismicity. Earthquakes recorded during underground gas storage operations in the Yela field showed peaks with seasonal trends coinciding with injection operations prior to winter withdrawal. These seismic clusters appeared annually until 2021, but since the gas storage facility was working at its maximum capacity, the recorded induced earthquake activities decreased in frequency and magnitude over the last period (2017 to 2021) [19]. Unfortunately, data on gas volumes stored in the Yela aquifer are only available from 2019, making it impossible to determine correlations with ground deformation during the period of maximum induced seismic activity.
Furthermore, a comprehensive comparison of our InSAR monitoring results of UGS activity in a deep aquifer with similar studies from other parts of the world is not feasible. Although there are publications on UGS monitoring in other types of reservoirs [5,41,43], they primarily highlight the capability of InSAR technology to detect vertical ground deformation through time series analysis. However, none of these studies utilise data that is entirely open-source, free, and easily accessible.
6. Conclusions
This study proposes a fully integrated and open-source approach to monitoring ground movement associated with an underground gas storage system (north-eastern Madrid Basin, Yela facility). The reservoir is a deep aquifer that was converted into an underground gas storage reservoir in 2012 and consists of a carbonate succession (approximately 30 km2). Reservoir depth varies between 2300 and 2550 m from ground level and its geology is represented by the “Santa Bàrbara” formation consisting of Cretaceous carbonates (mainly dolomite) affected by a diffuse fracture network overlain and sealed with evaporitic facies. The trap exploited during the UGS activity is an anticline with two tops: (i) the reservoir, which is composed of dolomite, and (ii) the seal, consisting of anhydrites, both closed by a system of thrusts.
The analysis and interpretation of InSAR data from the Yela case study revealed that:
- i.
- Both ascending and descending orbit mean velocity data demonstrate the overall stability of the field area;
- ii.
- UGS activity does not influence the average horizontal and vertical displacement velocities in the field area, aligning with the velocity range across the entire monitored domain;
- iii.
- Time series analysis of displacement is useful for identifying details that may be hidden in average motion signals computed over a given period. The mean velocity approach has useful applications in regions characterised by ground deformation with linear trends, but a lot of information on seasonal variability is lost. With regular acquisition of data from the Sentinel-1 satellite constellation, it is possible to monitor deformation over time, understand cyclical variations, and study related phenomena;
- iv.
- A strong correlation is evident between the gas volume curve in the reservoir and the time series of vertical ground displacements above the facility. This correlation was confirmed through the analysis of seasonal temperatures and precipitation and the presence of areas with different surface deformation behaviours;
- v.
- Horizontal displacement is less pronounced than vertical displacement. Despite this, the horizontal motion shows a slight sinusoidal signal in the facility area, showing a positive trend during withdrawal periods (east direction) and a negative trend during injection periods (west direction);
- vi.
- Only a small deformation of the dolomite reservoir (4–6 mm amplitude) was evident on the surface during the injection and withdrawal of natural gas. The volume calculation performed in CC estimated a negative volumetric change of 1.074 m3 in area A1 (see Figure 9) of about 1.5 km2 located in the vicinity of the reservoir between October 2019 (maximum peak) and April 2020 (minimum peak). The short-term cyclic subsidence/uplift associated with UGS is limited to the field area and is maximum above the 11 wellheads (see Figure 7).
- vii.
- Several factors influence these results: the considerable depth of the reservoir (the shallower the storage depth, the more pronounced the surface deformation effect), the geotechnical properties of the reservoir (porous aquifers have better elastic properties than fractured ones), the geology of the area, the injection rate (affects the formation pressure and stress), and the amount of gas injected and withdrawn;
- viii.
- The southeastern area of the Yela gas storage facility exhibits a different ground displacement behaviour. The latter area shows the opposite phase of vertical movements analysed for the area above the reservoir. It also has a larger amplitude. This result is in accordance with a possible normal manifestation of seasonal cyclicity, showing a positive trend during the winter and a negative trend during the summer.
The strategic significance of InSAR in the domain of underground gas storage (UGS) monitoring cannot be understated. While individual case studies offer invaluable insights, adopting a global perspective is paramount for a holistic understanding. As reliance on UGS facilities intensifies globally, the imperative to consistently and comprehensively monitor ground deformation becomes even more pressing. InSAR, with its ability to deliver high-resolution observations across vast regions, provides an optimal solution. By integrating InSAR monitoring strategies for UGS, we can champion best practices and safety standards that hold universal relevance. This approach not only aids in the early detection of potential hazards but also promotes the efficient utilisation of storage facilities and highlights the broader implications of localized activities. In our quest for energy sustainability and safety, global-scale InSAR monitoring of UGS sites is not merely a recommendation, it is a necessity.
This study serves not only as an exemplification of the versatility of the InSAR approach but also paves the way for future establishment and calibration of sophisticated geomechanical models of fractured layers. Such models are indispensable for simulating and foreseeing the profound deformations of reservoirs. The research results showed that the InSAR method enables general, regular, and specific monitoring of UGS activities and shows seasonal trends in vertical displacement above the reservoir. By providing a thorough site-specific perspective, our work offers invaluable insights that could significantly enhance the management of withdrawal and injection rates. Furthermore, this research can act as a pivotal reference when assessing effects near UGS facilities, thereby improving the reliability and safety of operations.
Author Contributions
G.F., Conceptualization, methodology, software, validation, formal analysis, investigation, writing—original draft preparation and figures preparation; T.B., methodology, software, investigation, writing-original draft preparation and figures preparation; M.D.S., writing—review and editing, conceptualization, supervision of the project and review of the final version; R.F., supervision of the project, review of the final version. All authors have read and agreed to the published version of the manuscript.
Funding
This research received no external funding.
Data Availability Statement
Publicly available datasets were analysed in this study. This data can be found here: https://land.copernicus.eu/pan-european/european-ground-motion-service.
Acknowledgments
This study was developed in the context of the aim of the national doctoral program PON Research and Innovation 2014–2020 “Education and research for recovery—REACT-EU” program (Ministerial Decree 10 August 2021, n. 1061) Action IV.5, Ph.D. on green topics.
Conflicts of Interest
The authors declare no conflict of interest.
References
- Belcher, S. The Basics of Underground Natural Gas Storage; U.S. Energy Information Administration (EIA): Washington, DC, USA, 2004. [Google Scholar]
- Fernando, A.; Raman, A. Gas Storage: An Onshore Operator’s Perspective. Geol. Soc. Lond. Spec. Publ. 2009, 313, 17–24. [Google Scholar] [CrossRef]
- Plaat, H. Underground Gas Storage: Why and How. Geol. Soc. Lond. Spec. Publ. 2009, 313, 25–37. [Google Scholar] [CrossRef]
- Uelsen Natural Gas Storage Facility, Storengy. Available online: https://www.storengy.de/en/company (accessed on 10 January 2023).
- Teatini, P.; Gambolati, G.; Castelletto, N.; Ferronato, M.; Janna, C.; Cairo, E.; Marzorati, D.; Colombo, D.; Ferretti, A.; Bagliani, A.; et al. Monitoring and Modelling 3-D Ground Movements Induced by Seasonal Gas Storage in Deep Reservoirs. IAHS-AISH Publ. 2010, 339, 68–75. [Google Scholar]
- Gas Infrastructure Europe—AGSI. Available online: https://agsi.gie.eu/ (accessed on 10 January 2023).
- European Commission. Available online: https://energy.ec.europa.eu/ (accessed on 3 July 2023).
- Bruno, M.S.; Dusseault, M.; Balaa, T.; Barrera, J. Geomechanical Analysis of Pressure Limits for Gas Storage Reservoirs. Int. J. Rock Mech. Min. Sci. 1998, 35, 569–571. [Google Scholar] [CrossRef]
- Fibbi, G.; Del Soldato, M.; Fanti, R. Review of the Monitoring Applications Involved in the Underground Storage of Natural Gas and CO2. Energies 2022, 16, 12. [Google Scholar] [CrossRef]
- Zhang, T.; Zhang, W.; Yang, R.; Gao, H.; Cao, D. Analysis of Available Conditions for InSAR Surface Deformation Monitoring in CCS Projects. Energies 2022, 15, 672. [Google Scholar] [CrossRef]
- Tomás, R.; Li, Z.; Lopez-Sanchez, J.M.; Liu, P.; Singleton, A. Using Wavelet Tools to Analyse Seasonal Variations from InSAR Time-Series Data: A Case Study of the Huangtupo Landslide. Landslides 2016, 13, 437–450. [Google Scholar] [CrossRef]
- Ferretti, A. Ebook: Satellite InSAR Data: Reservoir Monitoring from Space (EET 9); EAGE Publications: DB HOUTEN, The Netherlands, 2014; ISBN 978-90-73834-71-2. [Google Scholar]
- Chakrabarty, A.; Mannan, S.; Cagin, T. Multiscale Modeling for Process Safety Applications; Elsevier: Amsterdam, The Netherlands, 2016; ISBN 978-0-12-396975-0. [Google Scholar]
- Evans, D.J. A Review of Underground Fuel Storage Events and Putting Risk into Perspective with Other Areas of the Energy Supply Chain. Geol. Soc. Lond. Spec. Publ. 2009, 313, 173–216. [Google Scholar] [CrossRef]
- Folga, S.; Portante, E.; Shamsuddin, S.; Tompkins, A.; Talaber, L.; McLamore, M.; Kavicky, J.; Conzelmann, G.; Levin, T. US Natural Gas Storage Risk-Based Ranking Methodology and Results; Argonne National Lab. (ANL): Argonne, IL, USA, 2016. [Google Scholar]
- Thorpe, A.K.; Duren, R.M.; Conley, S.; Prasad, K.R.; Bue, B.D.; Yadav, V.; Foster, K.T.; Rafiq, T.; Hopkins, F.M.; Smith, M.L.; et al. Methane Emissions from Underground Gas Storage in California. Environ. Res. Lett. 2020, 15, 045005. [Google Scholar] [CrossRef]
- Freifeld, B.M.; Oldenburg, C.M.; Jordan, P.; Pan, L.; Perfect, S.; Morris, J.; White, J.; Bauer, S.; Blankenship, D.; Roberts, B.; et al. Well Integrity for Natural Gas Storage in Depleted Reservoirs and Aquifers; Lawrence Berkeley National Lab. (LBNL): Berkeley, CA, USA, 2016; p. LBNL--1006165, 1338936. [Google Scholar]
- Enàgas, Underground Storage Facilities Historical Data Spain. Available online: https://www.enagas.es/en/ (accessed on 11 January 2023).
- De Vicente, G.; Muñoz Martín, A. The Madrid Basin and the Central System: A tectonostratigraphic analysis from 2D seismic lines. Tectonophysics 2013, 602, 259–285. [Google Scholar] [CrossRef]
- Pérez-López, R.; Ramos, A.; Giner-Robles, J.L. Stress and Strain Analysis and Induced Seismicity in Geological Gas Storage (Yela, Spain). J. Struct. Geol. 2022, 161, 104662. [Google Scholar] [CrossRef]
- Pastuschuk, E.S. Modelo de Programasiòn Entera-Mixta de Los Almacenamientos Subterraneos de Una Red de Gas Natural. Estudio de Sensibilidad y Simulaciòn Fisica de La Red. Madrid University. 2014. Available online: http://www.fdi.ucm.es/profesor/jjruz/WebProyectos/Elena%20Pastuschuk%20Estepa/index.htm (accessed on 20 March 2023).
- Instituto Geográfico Nacional. Centro Nacional de Información Geográfica (CNIG). Available online: www.ign.es (accessed on 20 January 2023).
- Climate Change Knowledge Portal, for Development Practitioners and Policy Markers. Available online: https://climateknowledgeportal.worldbank.org/ (accessed on 11 January 2023).
- Weather and Climate, Climate Zone and Historical Climate Data. Available online: https://tcktcktck.org/ (accessed on 3 February 2023).
- Solari, L.; Del Soldato, M.; Raspini, F.; Barra, A.; Bianchini, S.; Confuorto, P.; Casagli, N.; Crosetto, M. Review of Satellite Interferometry for Landslide Detection in Italy. Remote Sens. 2020, 12, 1351. [Google Scholar] [CrossRef]
- Ferretti, A.; Passera, E.; Capes, R. End-to-End Implementation and Operation of the European Ground Motion Service (EGMS): Algorithm Theoretical Basis Document. Technical Report EGMS-D3-ALG-SC1-2.0-006. 2021. Available online: https://land.copernicus.eu/user-corner/technical-library/egms-algorithm-theoretical-basis-document (accessed on 10 April 2023).
- Crosetto, M.; Monserrat, O.; Cuevas-González, M.; Devanthéry, N.; Crippa, B. Persistent Scatterer Interferometry: A Review. ISPRS J. Photogramm. Remote Sens. 2016, 115, 78–89. [Google Scholar] [CrossRef]
- Ferretti, A.; Prati, C.; Rocca, F. Permanent Scatterers in SAR Interferometry. IEEE Trans. Geosci. Remote Sens. 2001, 39, 8–20. [Google Scholar] [CrossRef]
- Berardino, P.; Fornaro, G.; Lanari, R.; Sansosti, E. A New Algorithm for Surface Deformation Monitoring Based on Small Baseline Differential SAR Interferograms. IEEE Trans. Geosci. Remote Sens. 2002, 40, 2375–2383. [Google Scholar] [CrossRef]
- European Ground Motion Service. Available online: https://land.copernicus.eu/pan-european/european-ground-motion-service (accessed on 10 January 2023).
- Festa, D.; Del Soldato, M. EGMStream, a Desktop App for EGMS Data Downstream. Remote Sens. 2023, 15, 2581. [Google Scholar] [CrossRef]
- Costantini, M.; Minati, F.; Trillo, F.; Ferretti, A.; Passera, E.; Rucci, A.; Dehls, J.; Larsen, Y.; Marinkovic, P.; Eineder, M.; et al. EGMS: Europe-Wide Ground Motion Monitoring Based on Full Resolution Insar Processing of All Sentinel-1 Acquisitions. In Proceedings of the IGARSS 2022—2022 IEEE International Geoscience and Remote Sensing Symposium, Kuala Lumpur, Malaysia, 17–22 July 2022; IEEE: Kuala Lumpur, Malaysia; pp. 5093–5096. [Google Scholar]
- Costantini, M.; Chen, T.; Xu, Y.; Trillo, F.; Vecchioli, F.; Kong, L.; Jiang, D.; Hu, Q. High Resolution Ground Deformations Monitoring By COSMO-SkyMed PSP SAR Interferometry: Accuracy Analysis And Validation. ESA FRINGE Proc. 2012, 697, 99. [Google Scholar]
- Ferretti, A.; Fumagalli, A.; Novali, F.; Prati, C.; Rocca, F.; Rucci, A. A New Algorithm for Processing Interferometric Data-Stacks: SqueeSAR. IEEE Trans. Geosci. Remote Sens. 2011, 49, 3460–3470. [Google Scholar] [CrossRef]
- InSAR Norway Visualization Tool. Available online: https://insar.ngu.no (accessed on 14 May 2023).
- Yague-Martinez, N.; Prats-Iraola, P.; Rodriguez Gonzalez, F.; Brcic, R.; Shau, R.; Geudtner, D.; Eineder, M.; Bamler, R. Interferometric Processing of Sentinel-1 TOPS Data. IEEE Trans. Geosci. Remote Sens. 2016, 54, 2220–2234. [Google Scholar] [CrossRef]
- Copernicus Europe’s Eyes on Earth. Land Monitoring Service. Available online: https://land.copernicus.eu/imagery-in-situ/eu-dem/eu-dem-v1.1. (accessed on 10 January 2023).
- Bartier, P.M.; Keller, C.P. Multivariate Interpolation to Incorporate Thematic Surface Data Using Inverse Distance Weighting (IDW). Comput. Geosci. 1996, 22, 795–799. [Google Scholar] [CrossRef]
- CloudCompare CloudCompare. Available online: https://www.danielgm.net/cc/ (accessed on 27 April 2022).
- 5D Volume—CloudCompareWiki. Available online: https://www.cloudcompare.org/doc/wiki/index.php/2.5D_Volume (accessed on 2 May 2023).
- Rapant, P.; Struhár, J.; Lazecký, M. Radar Interferometry as a Comprehensive Tool for Monitoring the Fault Activity in the Vicinity of Underground Gas Storage Facilities. Remote Sens. 2020, 12, 271. [Google Scholar] [CrossRef]
- ElGharbawi, T.; Tamura, M. Increasing Spatial Coverage in Rough Terrain and Vegetated Areas Using InSAR Optimized Pixel Selection: Application to Tohoku, Japan. Geo-Spat. Inf. Sci. 2022, 25, 295–311. [Google Scholar] [CrossRef]
- Wang, Y.; Feng, G.; Li, Z.; Xu, W.; Zhu, J.; He, L.; Qiao, X. Retrieving the displacements of the Hutubi (China) underground gas storage during 2003–2020 from multi-track InSAR. Remote Sens. Environ. 2022, 268, 112768. [Google Scholar] [CrossRef]
Figure 1.
Typical cycles of injection (red) and withdrawal (blue) of underground gas storage activity. Data from Uelsen, Germany [4]).
Figure 1.
Typical cycles of injection (red) and withdrawal (blue) of underground gas storage activity. Data from Uelsen, Germany [4]).

Figure 3.
Cross-sections of the eastern Madrid Basin interpreted from seismic surveys (modified from [19]). The locations of the cross-sections are illustrated in Figure 2C.

Figure 4.
Curve of gas volumes stored in the reservoir. At the top are three complete injection and withdrawal cycles at the Yela UGS site in relation to the monthly atmospheric temperature and seasonal average precipitation in central Spain [24]. At the bottom is the total net injection and total gross withdrawal from May 2019 to November 2022.

Figure 5.
Schematic representation flowchart of EGMS processing [26].
Figure 5.
Schematic representation flowchart of EGMS processing [26].

Figure 6.
Displacement velocity rates calculated using (A) ascending, (B) descending, (C) vertical, and (D) Horizontal Sentinel-1 data collected from January 2015 to December 2021. The grey polygon, elongated in a NE–SW direction, depicts the deep structural trap where natural gas is stored. The dotted polygon represents the Yela facility.

Figure 7.
Vertical ground displacement maps of Yela facility constructed using IDW interpolation of motion data, referring to (A) the period of maximum injection in 2019 (October) and (B) the period of maximum extraction in 2020 (April). (C) Average time series analysis of selected MP (polygon with blue dashed border in (A,B)) compared with the curve of gas in storage (at the top). (D) 3D analysis of ground displacement occurring in the maximum (October 2019–2020) and minimum (April 2020) peaks at the end of each injection and withdrawal period. (E) Focus on average time series in the years with data matching the curve of gas in storage (at the top).

Figure 8.
Vertical (A) and horizontal (B) displacement velocity rates. At the bottom is the time series comparison between vertical and horizontal displacements (C) of three MPs (MP1, MP2, and MP3) in the study area. The grey polygon, elongated in a NE–SW direction, depicts the deep structural trap where natural gas is stored.

Figure 9.
Vertical ground displacement maps constructed using IDW interpolation of motion data from (A) the period of maximum injection in 2019 (October) and (B) the period of maximum extraction in 2020 (April). The black dotted lines represent the boundary of the structural trap at a depth at which natural gas is stored. The red dashed circle represents the Yela field area, and the blue dashed circle represents the external area (A2) with different and opposite behaviour.

Figure 10.
Analysis of volumetric changes using CC. In (A), an extended view of all the MPs relative to the period of maximum injection in October 2019 (Red) and the period of maximum extraction in April 2020 are shown together. It is evident that inside the white square (Yela UGS site), the green dots are higher than the red ones. In (B), the green dots represent the MPs used for CC volume computation, and in (C), the height differences between the maximum injection in 2019 and the maximum extraction in 2020, assigned to each 125 × 125 m2 grid centres (represented by the coloured dots), are shown.


Table 1.
European underground gas storage inventory at the end of 2021 [6].
Table 1.
European underground gas storage inventory at the end of 2021 [6].
| Country | Reservoir Type | No. of Projects |
|---|---|---|
| Austria | Depleted fields | 11 |
| Croatia | Depleted field | 1 |
| Czech Republic | Depleted fields, Aquifers, Salt caverns | 14 |
| Denmark | Aquifer, Salt caverns | 3 |
| France | Depleted fields, Aquifers, salt caverns | 21 |
| Germany | Depleted fields, Aquifers, Salt caverns | 56 |
| Hungary | Depleted fields | 6 |
| Italy | Depleted fields | 15 |
| Latvia | Aquifer | 1 |
| Netherlands | Depleted fields, Salt caverns | 6 |
| Poland | Depleted fields, Salt caverns | 11 |
| Portugal | Salt cavern | 1 |
| Romania | Depleted fields | 6 |
| Slovakia | Depleted fields | 2 |
| Spain | Depleted fields, Aquifers | 5 |
| Sweden | Salt cavern | 1 |
| TOTAL | 160 |
Table 2.
Structural characterisation of the Yela gas storage reservoir.
| Structure | Geology | Characterisation |
|---|---|---|
| Seal | Anhydrites (Upper evaporitic unit) | Upper Cretaceous |
| Reservoir | Dolomites (Santa Bárbara formation) | Upper Cretaceous |
| Hermetic trap | Complex thrust system | Anticline Alpine |
Table 3.
Main characteristics of the IPEs chain.
| IPE | Name of the Algorithm | Reference |
|---|---|---|
| E-Geos | PSP-IFSAR | [33] |
| TRE ALTAMIRA | SqueeSAR® | [34] |
| NORCE | GSAR-GTSI | [35] |
| GAF/DLR | PSI performed with Integrated Wide Area Processor (IWAP) | [36] |
Table 4.
Main characteristics of the Sentinel-1 datasets used in this study.
| Observation Geometry | Layer Name | Dataset | Scene | Time Interval |
|---|---|---|---|---|
| Ascending | Calibrated—level 2B | (A15-001) | 302 | 2 February 2015–27 December 2021 |
| Ascending | Calibrated level 2B | (A16-103) | 245 | 5 March 2015–22 December 2021 |
| Descending | Calibrated—level 2B | (D16-081) | 297 | 8 February 2015–21 December 2021 |
| Vertical component | Ortho—level 3 | (vertical) | 304 | 5 January 2016–16 December 2021 |
| Horizontal component | Ortho—level 3 | (east/west) | 304 | 5 January 2016–16 December 2021 |
Table 5.
Ancillary data and descriptions of their purposes.
| Ancillary Data | Purpose | Source |
|---|---|---|
| Injection/withdrawal data (daily) | Useful for displaying the curve of gas in storage within the reservoir | [18] |
| Volume of gas in storage | Comparison with InSAR data | [18] |
| Atmospheric temperature | Comparison with InSAR and UGS data | [23,24] |
| Precipitation | Comparison with InSAR and UGS data | [23,24] |
| Digital Elevation Model (Spain) | 3D visualization | [37] |
Disclaimer/Publisher’s Note: The statements, opinions and data contained in all publications are solely those of the individual author(s) and contributor(s) and not of MDPI and/or the editor(s). MDPI and/or the editor(s) disclaim responsibility for any injury to people or property resulting from any ideas, methods, instructions or products referred to in the content. |
© 2023 by the authors. Licensee MDPI, Basel, Switzerland. This article is an open access article distributed under the terms and conditions of the Creative Commons Attribution (CC BY) license (https://creativecommons.org/licenses/by/4.0/).
Share and Cite
MDPI and ACS Style
Fibbi, G.; Beni, T.; Fanti, R.; Del Soldato, M. Underground Gas Storage Monitoring Using Free and Open Source InSAR Data: A Case Study from Yela (Spain). Energies 2023, 16, 6392. https://doi.org/10.3390/en16176392
AMA Style
Fibbi G, Beni T, Fanti R, Del Soldato M. Underground Gas Storage Monitoring Using Free and Open Source InSAR Data: A Case Study from Yela (Spain). Energies. 2023; 16(17):6392. https://doi.org/10.3390/en16176392
Chicago/Turabian StyleFibbi, Gabriele, Tommaso Beni, Riccardo Fanti, and Matteo Del Soldato. 2023. "Underground Gas Storage Monitoring Using Free and Open Source InSAR Data: A Case Study from Yela (Spain)" Energies 16, no. 17: 6392. https://doi.org/10.3390/en16176392
Note that from the first issue of 2016, this journal uses article numbers instead of page numbers. See further details here.