Vibro-Acoustic Numerical Simulation for Analyzing Floor Noise of a Multi-Unit Residential Structure


Korea Institute of Civil Engineering and Building Technology, 283, Goyang-daero, Ilsanseo-gu, Goyang-si 10223, Gyeonggi-do, Korea
Appl. Sci. 2019, 9(20), 4289; https://doi.org/10.3390/app9204289
Submission received: 9 August 2019
/
Revised: 29 September 2019
/
Accepted: 1 October 2019
/
Published: 12 October 2019
(This article belongs to the Special Issue State-of-the-Art on Vibroacoustics and Sound Radiation Control of Structures)
Abstract
:In South Korea, the construction of new multi-unit residential structures has been continuously increasing in order to accommodate multiple households in single structures. However, the presence of walls and floors shared with neighbors makes these structures exceptionally vulnerable to floor noise transmission when the noise of everyday life occurs. In particular, South Korea has many social problems associated with such floor noise, which require the utmost attention and immediate resolution. In this study, a 17-story structure was selected as a test structure. Field measurements were carried out. A numerical model for the 17-story structure was developed in order to perform a vibro-acoustic analysis. The validation of the numerical model comparing with the field measurement data results shows a good agreement. Finally, it is concluded that numerical analysis can be applied to resolve floor noise problems arising in multi-unit residential structures.
1. Introduction
The structure of a multi-unit residential structure enables each household to have its own independent domestic activities. This is a very effective way to utilize limited space and to solve dense population problems in modern cities. Accordingly, in South Korea, increasing numbers of apartments (which are one type of multi-unit residential structure) are being newly constructed. The 2015 Population and Housing Census revealed that multi-unit residential structures accounted for approximately 75% of all housing types (with apartments occupying approximately 60%) [1]. In this study, the meaning of “multi-unit residential structure” is defined as a structure having a residential purpose, with more than two units in the same floor.
However, building walls, corridors, and stairways are completely or partially shared by residents, making the structures vulnerable to floor noise transmission originating from the domestic households. Additionally, floor noise is very difficult to regulate legally due to its individual different sensitivities, and no clear solution has been presented. Moreover, modern society emphasizes quality of life improvements, and floor noise causes many social problems. The number of civil complaints related to floor noise in South Korea has gradually increased from approximately 9000 in 2012 to 19,500 in 2016 [2].
Recently, various studies using numerical analysis methods, such as the finite element method (FEM), the boundary element method (BEM), and the statistical energy analysis (SEA), on floor noise sources, transmission paths, and noise reduction are being performed to propose a fundamental solution [3,4,5,6,7,8,9,10,11,12,13,14,15]. The selection of the numerical method depends on the frequency domain of interest. The low frequency domain is characterized by resonances showing a modal-controlled behavior. In this domain, the number of modes is low and the wavelengths are long. Therefore, either the FEM or the BEM is preferred. On the contrary, the high frequency domain has no resonance and the number of modes is high. The wavelengths are short compared to the characteristic dimensions of the system, so the finite element approach costs are excessively high, and so in this case, statistical- and energy-based methods (e.g., SEA) are broadly used in this range. The intermediate domain between the low and the high frequency has a feature of complexity whereby the low- and high-frequencies behavior coexist, and for that reason, a hybrid deterministic-statistical method is recommended [14].
It should be noted that the FEM was considered to be an expensive numerical tool for room acoustics simulations with complex boundary conditions, and so the application of the method was limited to low-frequency regions. However, the situation has been changed rapidly owing to the outstanding progress of computational power and the development of efficient elements and methods. Therefore, the application of the method is no longer restricted in predicting the sound field in a residential structure at the high-frequency regions [3,4,8,9,10,11,12].
Vibro-acoustic analysis has been applied to solve structural acoustic problems. Legault et al. investigated the effects of finite dimensions on the vibro-acoustic response of orthogonally stiffened panels. Three types of excitations, such as acoustical excitation, point force excitation, and random excitation, were considered. Their models were compared with numerical simulations and experimental results in order to complement them [16]. Nuraini et al. performed vibro-acoustic modeling and simulations using the finite element and the boundary element methods to determine the vibratory and acoustic properties of engine structures, such as the mode shapes and natural frequencies contributing to engine structure vibration [17]. Jiao and Zhang conducted a vibro-acoustic modeling and analysis of a rectangular acoustic cavity bounded by a flexible panel. Three modeling techniques, such as FEM, SEA, and a hybrid FE-SEA method, were considered. Finally, comparisons were carried out to validate the models and verify their accuracy using experimental results [18].
In this study, the FEM is considered to utilize vibro-acoustic analysis, which is the concurrent operation of structural vibration and acoustic noise analyses. To utilize a numerical analysis to solve floor noise problems, a numerical model for residential buildings must be constructed. Then, a vibration analysis must be performed, so that the results can be used as inputs to the noise analysis, i.e., acoustic analysis.
2. Description of the Methodology
2.1. Vibro-Acoustic Analysis
Typically, floor noise, in multi-unit residential structures, refers to noise transferred to adjacent households. When floor impact sources such as children’s running, adults’ walking, etc., are applied on the upper floor, they generate a vibration at the upper floor slabs that is transferred to the lower floors through the walls and the ceiling slabs. When slabs or walls vibrate the air particles adjacent to them are also vibrated, and the vibration of the air particles causes sound. Accordingly, in order to analyze noise caused by floor impact sound, the speed of the air particle vibrations occurring due to vibration transfer is the boundary condition of the noise analysis. The precise vibration velocity of structures such as slabs or walls can be computed through the analysis of structural vibration, and the precise analysis of noise can be conducted based on the computed vibration velocity [3,13,14]. Generally, Equation (1) is applied to calculate the structural vibration of the test structure, which is caused by an external impact source (F).
where, , , are the displacement, velocity, and acceleration, respectively. m, c, k are the mass, damping value, and stiffness of the structure, respectively. F is the external load applied to the structure.
The structural vibration of a wall or slab in a multi-unit residential building is caused by an external impact force, i.e., an impact source in this study. A bang machine is adopted as the standard impact source, specified by KS F 2810 [19], ISO 10140 [20], ISO 16283 [21], and JIS A 1418 [22], for acoustic vibration evaluation. An acoustic wave equation can be derived by utilizing the equation of the state, which indicates the relationship between density and pressure. The equation of motion shows the relationship between pressure and displacement, and the equation of continuity indicates the displacement-density relation. Equation (2) below is the acoustic wave equation [13,23].
where, p is the sound pressure, c is the velocity of air, ρ is the fluid density, κ is the fluid bulk modulus, and t is the time.
Figure 1 shows graphically the vibro-acoustic analysis process mentioned above. The structural vibration for Equation (1) was analyzed using OptiStruct of Altair Engineering, Inc. [24], which is a commercial finite element analysis program using the numerical model of the test structure. Then, modal analysis was conducted to determine the natural mode shapes and frequencies of the structure, and to calculate the vibrational responses of the structures under the impact force source, i.e., the bang machine in this study. During the analysis, proper boundary conditions (e.g., fixed conditions for the bottom regions of the test structure) have been applied. Then, the acoustic analysis of Equation (2) was performed using Virtual LAB [25] of SIEMENS. To do this, an acoustic model for a test floor in the structure has been constructed. It should be clarified that the meaning of the test floor is defined as the floor on which the impact force source is applied. A 2D plane grid mesh for a microphone array has been employed to measure the sound pressure level at the target area. A 3D tetra mesh has been used to create the acoustic mesh model. A detailed explanation of the structural analysis and acoustic analysis for interested readers can be found in [3,14,26,27,28,29,30].
It should be noted that a wavelength is important to solve the acoustic wave equation and determine the mesh size of the acoustic regions. The wavelength equation to calculate the proper wavelength for the acoustic mesh of the test structure [31] can be found as Equation (4):
where, λ is the wave length, c is the velocity of air, and f is frequency.
Marburg [32] and Thompson et al. [33] suggested more than 10 elements per wavelength should be enough to capture the nature of the wave with reasonable accuracy. In this study, the maximum frequency range of interest is roughly up to 800 Hz, so the wavelength of the minimum element size has been computed as 42.5 mm. Therefore, 25 mm for the element size is adopted in this study.
2.2. Standard Heavy Weight Impact Source
In 2016, the Ministry of Land, Infrastructure, and Transport of South Korea revised the criteria for the structure recognition and management of floor impact sound insulation in multi-family residential housing (6 December, 2016, Notification No. 2016-824) [34]. In South Korea, the bang machine, shown in Figure 2, is used as the standard heavy weight impact source for the field measurement of floor noise, and KS F 2810 [19] provides the statistical features of the bang machine’s heavy weight impact sound.
The statistical features of the standard heavy weight impact sound in KS F 2810 [19] include the mean value and standard deviation of the impact exposure level (LFE, dB), which are based on a 1/1 octave band frequency. The impact exposure level can be calculated below in Equation (5):
where, F(t) is the impact force (N), F0 is the reference power (1 N), t1 ~ t2 are the times (including the impact time) for the impact source (s), and T0 is the reference time (1 s).
3. An Illustrative Example
A 17-story reinforced concrete shear wall residential structure was selected as the test structure and its numerical model was constructed. Then, numerical simulations were performed and the results, including the field measurements, were also compared. During the analysis, a standard heavy weight impact source was applied to the 17-story structures as the loading condition. A fixed condition was applied to the bottom of the test structure as the boundary condition.
3.1. Test Specimen and Field Measurements
The 17-story reinforced concrete shear wall residential structure under construction, which is located at Uijeongbu-si Gyeonggi-do South Korea, was selected as a test structure, as shown in Figure 3. The overall structure has 17 stories with a roughly 50 m height, and the total area of the unit floor is about 650 m2. The main structural system of this building is a bearing wall-slab system, and the thickness of the floor slab is 210 mm without any floor finishing materials. An 11th story of the structure was considered as a target floor. The test structure consists of four individual apartment units and the floor plan is shown in Figure 3. The overall dimensions of the apartment building were 45.6 × 11.2 × 50.2 m (b × w × h).
For the field measurements, the floor impact sound pressure was measured. The bang machine, as mentioned earlier, was used as a standard heavy impact source, which is certificated in KS F 2810 [19]. For storage of the measurement data, a laptop, sensor signal acquisition device (Front-End SIEMENS SCADAS Mobile), microphones (Brüel and Kjær 4188), and preamplifier (Brüel and Kjær 2671) were used. The method of installation and location of the five impact points and receiving points are specified in KS F 2810 [19], shown in Figure 4.
Figure 5 shows the five microphones’ field measurement results of the bang machine, applied to the center point, with respect to a 1/3 octave band frequency. As shown in Figure 5, a peak sound pressure level of the average of five microphones is 88.46 dB at 24.8 Hz for a 1/3 octave band frequency. Table 1 shows the sound pressure level (SPL) and a single number quantity (SNQ) for the field measurement results at a 1/1 octave band frequency.
It should be noted that the SNQ, regulated by KS F 2863 [35], is adopted as a rating method for floor noise in South Korea. The method described in KS F 2863 [35] is the same as that of ISO 717 [36], that is for the standard light weight impact source, such as a tapping machine, except for the difference in the considered frequency range for calculation. Detailed information related to the computation can be found in KS F 2863 [35] and ISO 717 [36]. Additionally, the narrow band of frequency ranges of up to 800 Hz was determined for the analysis because the floor noise in multi-unit residential buildings is evaluated by a single number quantity (SNQ) that considers the 1/1 octave band frequency range (i.e., 63, 125, 250, and 500 Hz).
3.2. Numerical Simulations and Comparisons
Figure 6a shows a numerical model of the 17-story structure. Table 2 shows the meshing information of the numerical model. The excitation location of the impact source and the location of the five indoor microphones for noise measurements were numerically installed at the exact same locations used in the field measurements, shown in Figure 6b. The test structure has 17 floors and can be categorized into a high-rise structure. Therefore, two concrete materials are used, i.e., C27 for the lower parts (1st–10th’s floors, walls, and columns, and 11th’s floor) and C24 for the upper parts (11th’s walls and columns, and 12th roof’s floors, walls, and columns), respectively. It should be noted that the reinforcing steel bars in the floors, walls, and columns are neglected in this study.
Figure 7 shows the structural and acoustic mesh of the target area, shown in Figure 4b. The real structure has walls, windows, and doors, etc. In this numerical model, walls and columns are modeled as structural elements such as frames and plates, etc. In addition, windows, doors, and other empty spaces are modeled as an acoustic panel which has absorbent property. The target areas are modeled as 3d tetra elements.
Table 3 presents the material properties for the numerical models [37,38,39]. The structural vibration analysis was carried to the entire structure, and then the acoustic analysis was conducted only for the living room area. To identify the magnitude of vibration and its variation when being transmitted to the upper and lower floors (according to the position of the impact load), a vibro-acoustic analysis was conducted by assuming that the impact load (the impact source being the bang machine at MC#3 in Figure 6b) was applied sequentially from the floor slab of the 2nd floor (top slab of the 1st floor) to the top slab of the 18th floor (roof) of the 17-story model.
Figure 8 shows an example case of applying the impact load to the floor slab of the 11th floor, and the results of the vibration analysis from the floor slab of the 2nd floor to the roof slab of the 18th floor. The largest vibration response was produced at the 11th floor, which was the target floor of the impact source. The second largest responses were produced at the 10th floor, which is the next vertical upper floor, and the 12th floor, which is the next vertical lower floor. The next largest vibration responses were produced at the 9th and 13th floors, which were the second next upper and lower floors, respectively. The 10th and 12th floors showed very similar results, as did the 9th and 13th floors.
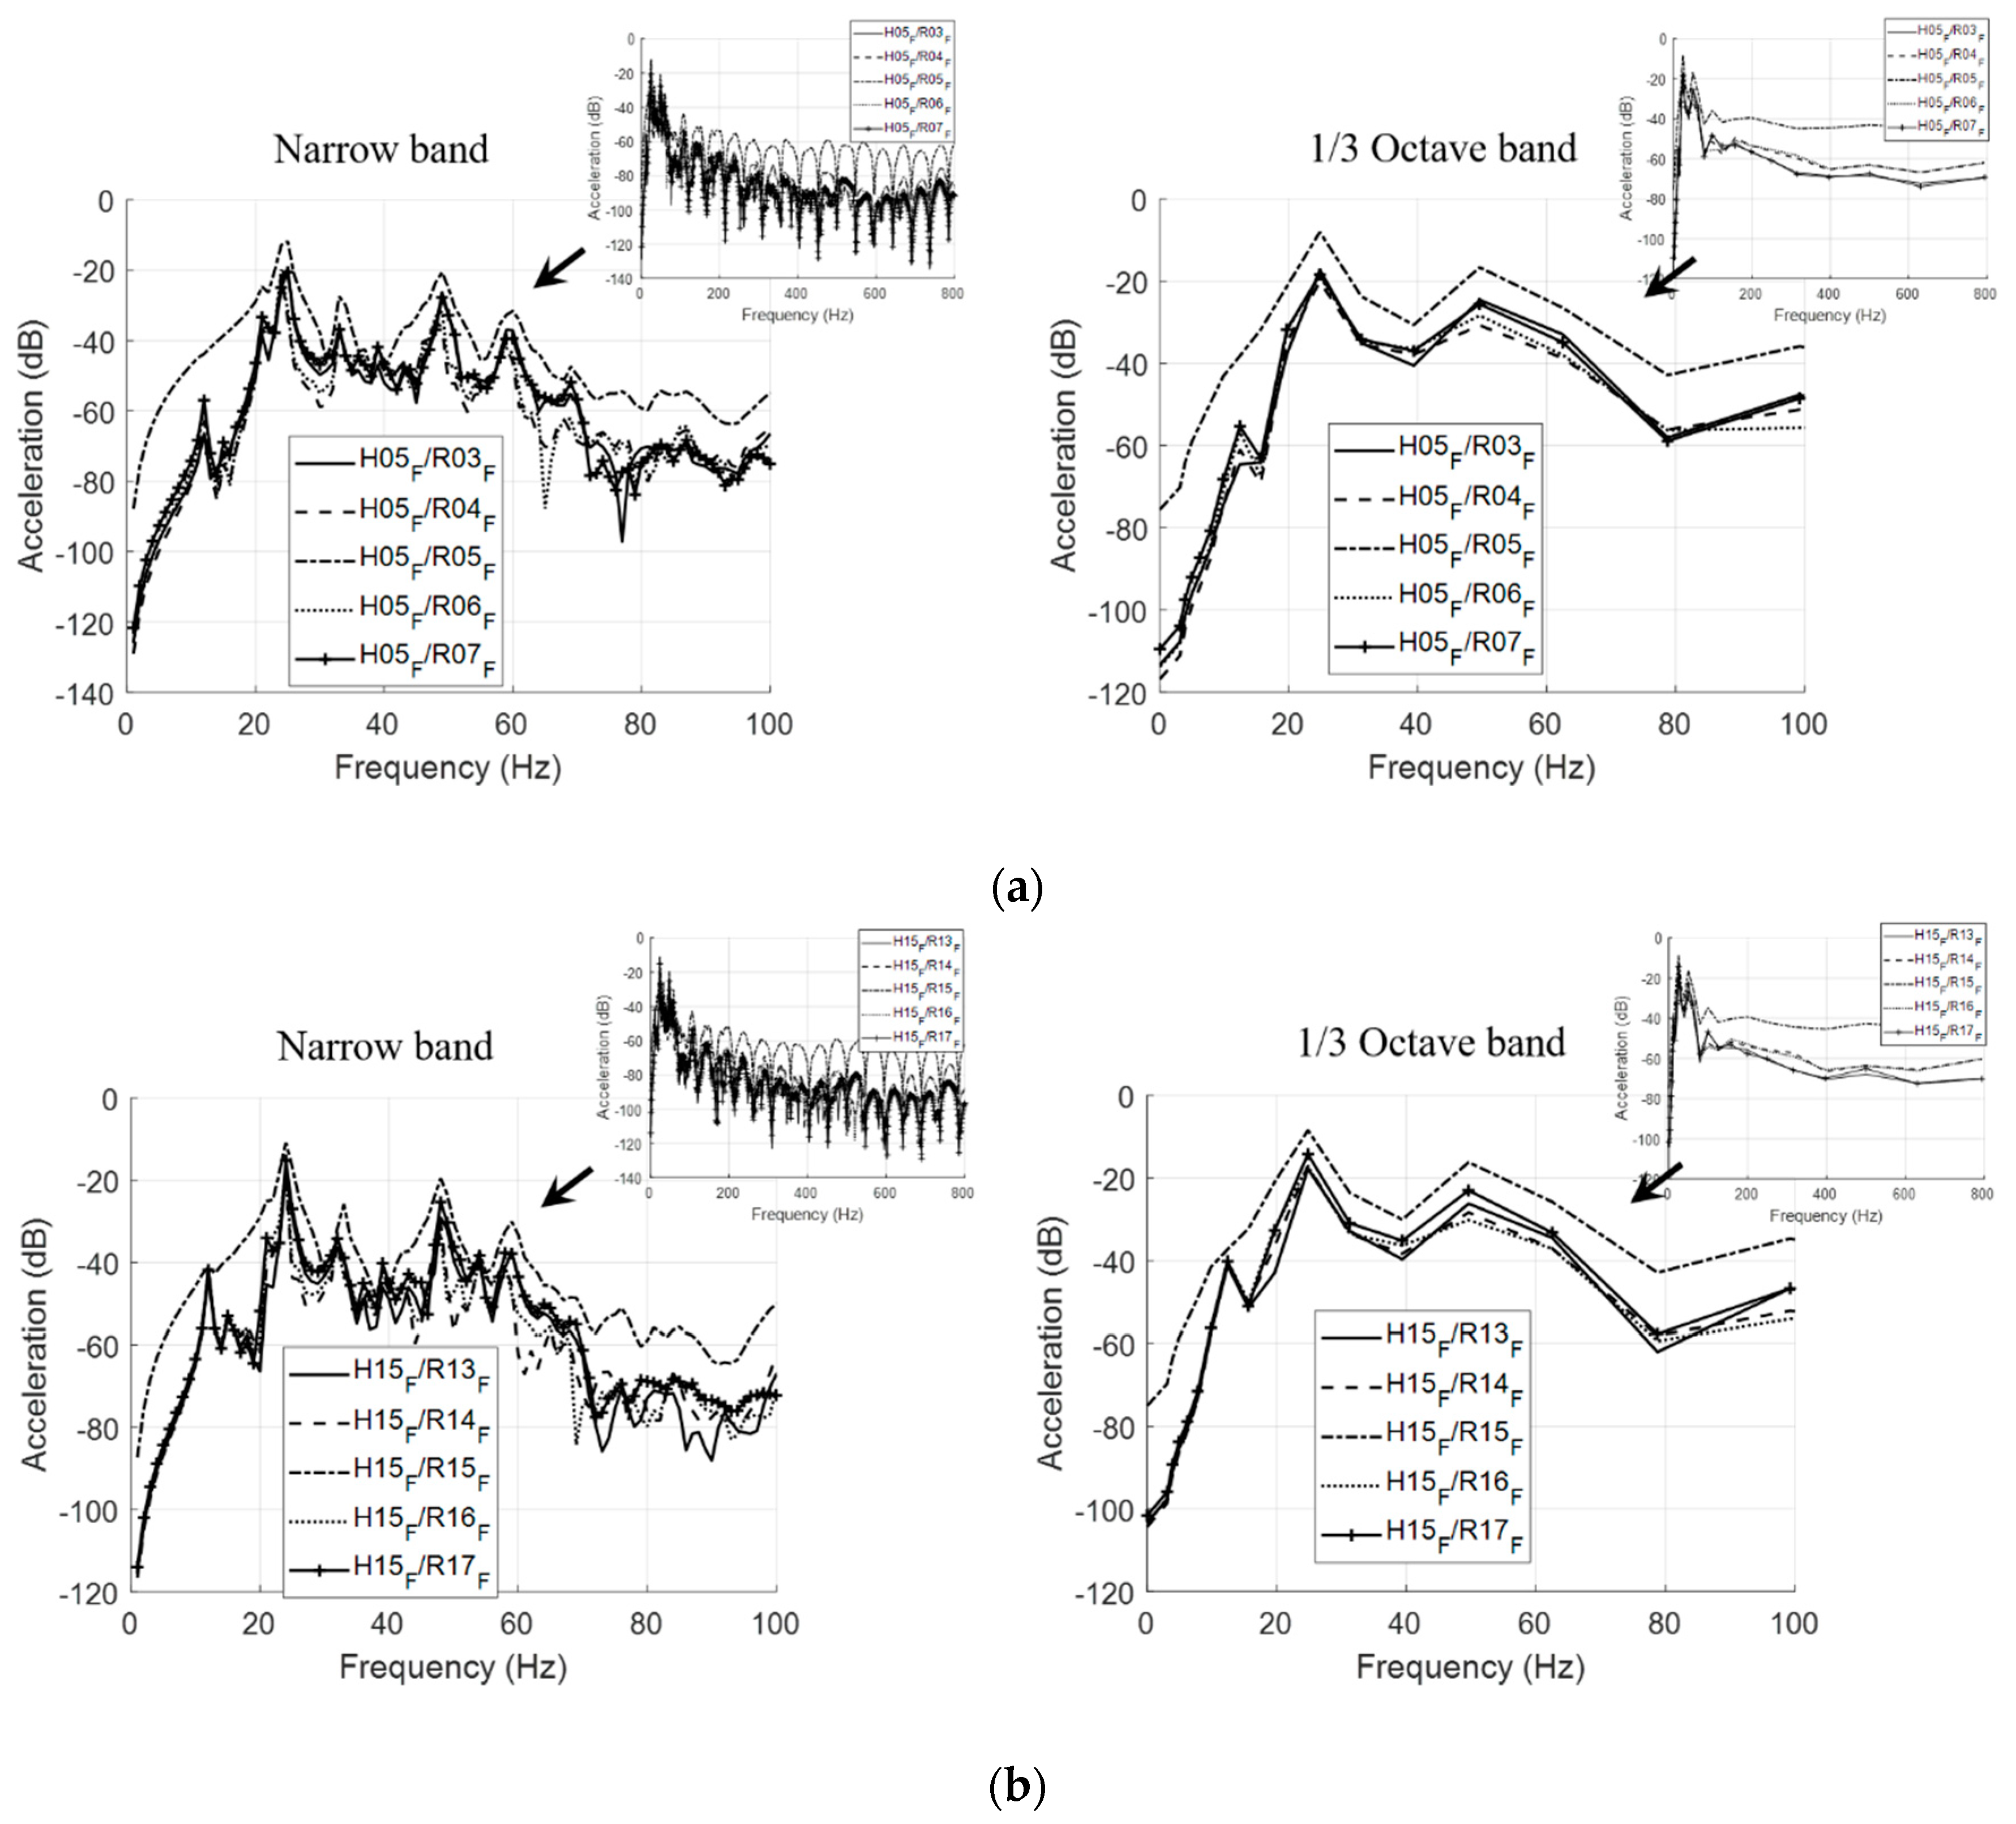
It is very clear that when an impact source is applied to the floor slab of an upper floor, as the largest vibration occurs to the target floor. After the vibration is transmitted equally to both the upper and lower parts, the transmitted energy dissipates gradually, and the other floors generate less vibration. An additional vibration analysis was conducted for the 5th floor, in the lower portion of the overall building, and for the 15th floor, in the higher portion of the overall building (see Figure 9).
Figure 8 and Figure 9 show that the target floor of the impact source generated the largest vibrations, which were then transmitted to the vertical upper and lower floors. From the results of the vibration analysis in Figure 8 and Figure 9, it can be concluded that multi-unit residential buildings with a repetitive structural form like the test structure of this study will generate the largest vibration on the target floor and the second largest vibration on the next upper and lower floors.
It is also clear that the magnitude of vibration decreases with increasing distance from the target floor. The same analysis was conducted for the remaining floors. Figure 10 compares the magnitudes of vibration between the target floors to which the impact source was applied. Both the 2nd floor and the roof floor (18F) could transmit the generated vibration only in either the upper or lower direction, which was a different condition from the other floors. Consequently, both the 2nd floor and the roof floor showed a marginally different result, as shown in Figure 10. Additionally, Figure 11 depicts the largest magnitude of the structural vibration of five floors. From Figure 11, it can be seen that the acceleration shape of the five floors with respect to the frequency has shifted to the left as the height of the floor rises, which is due to the boundary condition of the test structure to which the bottom is fixed.
The acoustic analysis was performed using results of the vibration analysis when the impact source was applied to the 11th floor of the test structure. Then, results of the acoustic analysis were analyzed and compared with the field measurements. As in the field measurements, the acoustic analysis results of the five microphones are analyzed with respect to the 1/3 octave band frequency, as shown in Figure 11. As a result of the above vibration analysis, it can be seen that the floor noise, which is sound pressure level, decreases as the frequency increases.
As shown in Figure 12, a comparison between the vibro-acoustic analyses results and the field measurements results with regard to the 1/1 octave band revealed that the numerical simulations using the impact forces are very similar to the field measurements results.
Table 4 presents the comparison of the 1/1 octave band and SNQ-based evaluations for the results of both the field measurements and the numerical simulations. The results of the numerical simulations showed a higher value than that of the field measurements, except at 500 Hz. Consequently, the former had an SNQ value of 55 dB, which was just higher than that of the latter case by 4 dB.
It should be noted that the difference of 4 dB can be explained, as: (1) The reinforcing steel bars in the floors, walls, and columns have been neglected in the numerical model; (2) the concrete material is not the perfectly isotropic material, which means that the condition of the numerical model is different than that of the real structures; and (3) there are uncertainties in the field measurements. Therefore, these can all be contributing causes for the difference of 4 dB.
4. Summary & Conclusions
This study performed a vibro-acoustic analysis of multi-unit residential structures. During this study, a numerical structural model has been developed, that can be used for numerically analyzing floor noise occurring inside a multi-unit residential building. Noise evaluation of a target model (the 17-story structure) was carried out using a numerical analysis. The results of the vibration and acoustic analyses were compared in terms of 1/3 octave bands, 1/1 octave bands, and SNQs.
For the purpose of the proposed vibro-acoustic analyses, field measurements were carried out and a comparison with the numerical simulation results was conducted. The comparison results show that the results of the vibro-acoustic analysis exhibited a reasonable accuracy.
On the basis of the above results, it is clear that the numerical simulations using the proposed approach can replace field experiments that demand time and money. Additionally, numerical simulations can be applicable in practical situations and future researches, such as analyzing noise-transmission paths inside multi-unit residential buildings and determining community structures, floor plate types, and wall locations, all of which can be carried out using the proposed approach.
Funding
This work was supported by the National Research Council of Science & Technology (NST) grant by the Korea government (MSIP) (No. CRC-16-02-KICT).
Acknowledgments
The author acknowledges Altair Korea, Inc. for their invaluable comments and technical support on the numerical analysis during this study, and appreciates the anonymous reviewers for their helpful comments and suggestions.
Conflicts of Interest
The authors declare no conflict of interest.
References
- Korea National Statistical Office (KOSTAT). The Population and Housing Census. Available online: http://www.census.go.kr (accessed on 20 May 2017).
- The Korean Ministry of Environment National Noise Information System. Available online: http://www.noiseinfo.or.kr/about/data_view.jsp?boardNo=164&keyfield=whole&keyword=&pg=1 (accessed on 20 May 2017).
- Howard, C. Acoustic Analyses Using Matlab® and Ansys®, 1st ed.; CRC Press: Boca Raton, FL, USA, 2014; ISBN 9781482223255. [Google Scholar]
- Okuzono, T.; Otsuru, T.; Tomiku, R.; Okamoto, N. A finite-element method using dispersion reduced spline elements for room acoustics simulation. Appl. Acoust. 2014, 79, 1–8. [Google Scholar] [CrossRef] [Green Version]
- Johansson, D.; Comnell, P. Statistical Energy Analysis Software: Development and Implementation of an Open Source in MATLAB/OCTAVE; Chalmers University of Technology: Gothenburg, Sweden, 2010. [Google Scholar]
- Dokhani, I. NVH Analysis of a Vehicle Using Statistical Energy Analysis; Blekinge Institute of Technology: Karlskrona, Sweden, 2015. [Google Scholar]
- Baek, G.; Mun, D.; Han, H.; Park, H. Analysis of Heavy-weight floor impact noise and vibration of concrete slabs in a residential building. In Proceedings of the Advances in Civil, Enviromental, and Materials Research (ACEM15), Incheon, Korea, 25–29 August 2015. [Google Scholar]
- Arjunan, A.; Wang, C.J.; Yahiaoui, K.; Mynors, D.J.; Morgan, T.; Nguyen, V.B.; English, M. Development of a 3D finite element acoustic model to predict the sound reduction index of stud based double-leaf walls. J. Sound Vib. 2014, 333, 6140–6155. [Google Scholar] [CrossRef]
- Okuzono, T.; Otsuru, T.; Tomiku, R.; Okamoto, N. Fundamental accuracy of time domain finite element method for sound-field analysis of rooms. Appl. Acoust. 2010, 71, 940–946. [Google Scholar] [CrossRef] [Green Version]
- Díaz-Cereceda, C.; Poblet-Puig, J.; Rodríguez-Ferran, A. The finite layer method for modelling the sound transmission through double walls. J. Sound Vib. 2012, 331, 4884–4900. [Google Scholar] [CrossRef] [Green Version]
- del Coz Díaz, J.J.; Álvarez Rabanal, F.P.; García Nieto, P.J.; Serrano López, M.A. Sound transmission loss analysis through a multilayer lightweight concrete hollow brick wall by FEM and experimental validation. Build. Environ. 2010, 45, 2373–2386. [Google Scholar] [CrossRef]
- Okuzono, T.; Yoshida, T.; Sakagami, K.; Otsuru, T. An explicit time-domain finite element method for room acoustics simulations: Comparison of the performance with implicit methods. Appl. Acoust. 2016, 104, 76–84. [Google Scholar] [CrossRef]
- Park, S.; Kim, H. Development of Analytical Impact Force Models for Floor Impact Vibration and Acoustic Numerical Analysis. Appl. Sci. 2016, 6, 120. [Google Scholar] [CrossRef]
- Atalla, N.; Sgard, F. Finite Element and Boundary Methods in Structural Acoustics and Vibration, 1st ed.; CRC Press: Boca Raton, FL, USA, 2015; ISBN 9781466592872. [Google Scholar]
- Yu, H.; Cai, Y.; Liang, B.; Song, Y.; Yan, J. Estimation of statistical energy analysis loss factor for fiber reinforced plastics plate of yachts. J. Vibroeng. 2016, 18, 2088–2101. [Google Scholar] [CrossRef]
- Legault, J.; Mejdi, A.; Atalla, N. Vibro-acoustic response of orthogonally stiffened panels: The effects of finite dimensions. J. Sound Vib. 2011, 330, 5928–5948. [Google Scholar] [CrossRef]
- Nuraini, A.A.; Mohd Ihsan, A.K.A.; Nor, M.J.M.; Jamaluddin, N. Vibro-acoustic analysis of free pistion engine structure using finite element and boundary element methods. J. Mech. Sci. Technol. 2012, 26, 2405–2411. [Google Scholar] [CrossRef]
- Jiao, R.; Zhang, J. Vibro-acoustic modeling of a rectangular enclosure with a flexible panel in broad range of frequencies and experimental investigations. J. Vibroeng. 2016, 18, 2683–2692. [Google Scholar]
- KS F 2810. Field Measurements of Impact Sound Insulation of Floors—Part 2: Method Using Standard Heavy Impact Sources; Korean Standards Association: Seoul, Korea, 2012. [Google Scholar]
- ISO 10140. Acoustics—Laboratory Measurement of Sound Insulation of Building Elements. Part 3: Measurement of Impact Sound Insulation; ISO: Geneva, Switzerland, 2010. [Google Scholar]
- ISO 16283. Acoustics—Field Measurement of Sound Insulation in Buildings and of Building Elements—Part 2: Impact Sound Insulation; ISO: Geneva, Switzerland, 2015. [Google Scholar]
- JIS A 1418. Acoustics—Measurement of Floor Impact Sound Insulation of Buildings. Part 2: Method Using Standard Heavy Impact Source; JSA: Tokyo, Japan, 2000.
- Morse, P.M.C. Vibration and Sound, 2nd ed.; International Series in Pure and Applied Physics; McGraw-Hill Book Company: Beijing, China, 1948. [Google Scholar]
- HyperWorks OptiStruct; Version 2017; Altair Engineering Inc.: Troy, MI, USA, 2017.
- SIEMENS Software LMS Virtual.Lab; Version R13.4; Siemens Inc.: Plano, TX, USA, 2015.
- Armentani, E.; Sepe, R.; Parente, A.; Pirelli, M.; Armentani, E.; Sepe, R.; Parente, A.; Pirelli, M. Vibro-Acoustic Numerical Analysis for the Chain Cover of a Car Engine. Appl. Sci. 2017, 7, 610. [Google Scholar] [CrossRef]
- Chopra, A.K. Dynamics of Structures-Theory and Applications to Earthquake Engineering, 4th ed.; Prentice Hall: Upper Saddle River, NJ, USA, 2012. [Google Scholar]
- Bathe, K.J. Finite Element Procedures, 2nd ed.; Prentice Hall: Upper Saddle River, NJ, USA, 2014; ISBN 978-0-9790049-5-7. [Google Scholar]
- Marburg, S.; Nolte, B. Computational Acoustics of Noise Propagation in Fluids—Finite and Boundary Element Methods; Springer: Berlin/Heidelberg, Germany, 2008; ISBN 9783540774488. [Google Scholar]
- Fahy, F.; Gardonio, P. Sound and Structural Vibration, 2nd ed.; Academic Press: Cambridge, MA, USA, 2006; ISBN 9780123736338. [Google Scholar]
- Rienstra, S.W.; Hirschberg, A. An Introduction to Acoustics; Eindhoven University of Technology: Eindhoven, The Netherlands, 2009. [Google Scholar]
- Marburg, S. Six boundary elements per wavelength: Is that enough? J. Comput. Acoust. 2002, 10, 25–51. [Google Scholar] [CrossRef]
- Thompson, L.L.; Pinsky, P.M. A space-time finite element method for structural acoustics in infinite domains part 2: Exact time-dependent non-reflecting boundary conditions. Comput. Methods Appl. Mech. Eng. 1996, 132, 229–258. [Google Scholar] [CrossRef]
- The Ministry of Land Infrastructure and Transport. Notification on 2016-824: Criteria for Structure Recognition and Management on the Floor Impact Sound Insulation in Multi-Family Residential Housing; The Ministry of Land Infrastructure and Transport: Seoul, Korea, 2016.
- KS F 2863. Rating of Floor Impact Sound Insulation for Impact Source in Buildings and of Building Elements—Part 2—Floor Impact Sound Insulation Against Standard Heavy Impact Source; Korean Standards Association: Seoul, Korea, 2007. [Google Scholar]
- ISO 717. Acoustics—Rating of Sound Insulation in Buildings and of Building Elements—Part 2: Impact Sound Insulation; ISO: Geneva, Switzerland, 2013. [Google Scholar]
- The Ministry of Land Affairs Transport and Maritime. Structural Concrete Code (KCI Code 2012); The Ministry of Land Affairs Transport and Maritime: Seoul, Korea, 2012.
- Chen, W.; Hao, H.; Hughes, D.; Shi, Y.; Cui, J.; Li, Z.-X. Static and dynamic mechanical properties of expanded polystyrene. Mater. Des. 2015, 69, 170–180. [Google Scholar] [CrossRef]
- ONDA. Tables of Acoustic Properties of Materials. Available online: http://www.ondacorp.com/tecref_acoustictable.shtml (accessed on 29 December 2015).
Figure 1.
Schematic overview of vibro-acoustic analysis procedure.

Figure 2.
Bang machine impact source: (a) Overview of the bang machine; (b) its time series and frequency domain data.
Figure 2.
Bang machine impact source: (a) Overview of the bang machine; (b) its time series and frequency domain data.

Figure 3.
Overview of a 17-story test structure and the unit floor plan.

Figure 4.
Microphone settings for field measurements: (a) Overview of microphone’s setting for testing; and (b) microphone locations for the field measurement.
Figure 4.
Microphone settings for field measurements: (a) Overview of microphone’s setting for testing; and (b) microphone locations for the field measurement.


Figure 5.
Acoustic response of the field measurements for five microphones and its 1/3 octave band frequency.
Figure 5.
Acoustic response of the field measurements for five microphones and its 1/3 octave band frequency.

Figure 6.
Graphical representation of the test structure: (a) The computational model; (b) microphone’s location for acoustic analysis.
Figure 6.
Graphical representation of the test structure: (a) The computational model; (b) microphone’s location for acoustic analysis.

Figure 7.
Schematic overview of the structural and acoustic mesh of the target area.

Figure 8.
Results of vibration response to impact load on floor 11F.

Figure 9.
Results of the response when the impact load was applied to: (a) Fifth floor; (b) 15th floor.
Figure 9.
Results of the response when the impact load was applied to: (a) Fifth floor; (b) 15th floor.

Figure 10.
Results of the vibration response when the impact load was applied to five floors; (a) At narrow band frequency; (b) at 1/3 octave band frequency.
Figure 10.
Results of the vibration response when the impact load was applied to five floors; (a) At narrow band frequency; (b) at 1/3 octave band frequency.

Figure 11.
Acoustic response of the vibro-acoustic simulations for five microphones and its mean value.
Figure 11.
Acoustic response of the vibro-acoustic simulations for five microphones and its mean value.

Figure 12.
Comparison of the acoustic response between the simulations and field measurements.


Table 1.
Sound pressure level and single number quantity for field measurements.
| 1/1 Octave Band Frequency (Hz) | Field Measurements (dB) | |||||
|---|---|---|---|---|---|---|
| MC#1 | MC#2 | MC#3 | MC#4 | MC#5 | Average | |
| 63 | 78.29 | 82.91 | 78.45 | 81.09 | 79.72 | 80.27 |
| 125 | 65.05 | 63.38 | 62.30 | 65.30 | 65.48 | 64.39 |
| 250 | 53.09 | 52.62 | 54.42 | 54.26 | 53.86 | 53.68 |
| 500 | 47.13 | 47.35 | 45.69 | 47.50 | 46.46 | 46.85 |
| SNQ | 50 | 52 | 49 | 52 | 51 | 51 |
Table 2.
The meshing information of the target structure.
| Name | No. | Type |
|---|---|---|
| Nodes | 274,900 | - |
| 2D Frame Element | 10,812 | Structure |
| 2D Quad Element | 273,785 | Structure |
| 3D Tetra Element | 46,859 | Acoustic |
Table 3.
Material property of the specimen.
| Name | Concrete | |
|---|---|---|
| Low Story (C27) | Upper Story (C24) | |
| Modulus of Elasticity (GPa) | 26.7 | 25.8 |
| Density (ρ, kg/m3) | 2400.0 | 2400.0 |
| Poisson’s Ratio (ν) | 0.167 | 0.167 |
| Acoustic Impedance (Z, MRayl) | 8.0 | 8.0 |
Table 4.
Results of the vibration-acoustic analysis (1/1 octave band) and SNQ values for field measurements and numerical simulations of the 17-story structures.
Table 4.
Results of the vibration-acoustic analysis (1/1 octave band) and SNQ values for field measurements and numerical simulations of the 17-story structures.
| Type | Section | 1/1 Octave Band Frequency (dB) | SNQ Grade (dB) | |||
|---|---|---|---|---|---|---|
| 63 Hz | 125 Hz | 250 Hz | 500 Hz | |||
| Numerical simulations | Impact sound pressure level | 85.9 | 66.5 | 57.2 | 42.0 | 55 |
| Normalized curve of inverse A weighted | 78 | 68 | 61 | 55 | ||
| Excess value of normalized curve | 7.9 | 0 | 0 | 0 | ||
| Field measurements | Impact sound pressure level | 80.3 | 64.4 | 53.7 | 46.9 | 51 |
| Normalized curve of inverse A weighted | 74 | 64 | 57 | 51 | ||
| Excess value of normalized curve | 6.3 | 0.4 | 0 | 0 | ||
© 2019 by the author. Licensee MDPI, Basel, Switzerland. This article is an open access article distributed under the terms and conditions of the Creative Commons Attribution (CC BY) license (http://creativecommons.org/licenses/by/4.0/).
Share and Cite
MDPI and ACS Style
Park, S. Vibro-Acoustic Numerical Simulation for Analyzing Floor Noise of a Multi-Unit Residential Structure. Appl. Sci. 2019, 9, 4289. https://doi.org/10.3390/app9204289
AMA Style
Park S. Vibro-Acoustic Numerical Simulation for Analyzing Floor Noise of a Multi-Unit Residential Structure. Applied Sciences. 2019; 9(20):4289. https://doi.org/10.3390/app9204289
Chicago/Turabian StylePark, Sangki. 2019. "Vibro-Acoustic Numerical Simulation for Analyzing Floor Noise of a Multi-Unit Residential Structure" Applied Sciences 9, no. 20: 4289. https://doi.org/10.3390/app9204289
Note that from the first issue of 2016, this journal uses article numbers instead of page numbers. See further details here.