Article

RNA-seq Reveals Differentially Expressed Genes between Two indica Inbred Rice Genotypes Associated with Drought-Yield QTLs

1
The John Bingham Laboratory, National Institute of Agricultural Botany (NIAB), 93 Lawrence Weaver Road, Cambridge CB3 0LE, UK
2
International Rice Research Institute (IRRI), Pili Drive, Los Baños, Laguna 4031, Philippines
3
Department of Agronomy, National Taiwan University (NTU), Taipei City 100, Taiwan
4
SRUC, Peter Wilson Building, West Mains Road, Edinburgh EH9 3JG, UK
*
Author to whom correspondence should be addressed.
Agronomy 2020, 10(5), 621; https://doi.org/10.3390/agronomy10050621
Submission received: 23 March 2020 / Revised: 22 April 2020 / Accepted: 24 April 2020 / Published: 28 April 2020
(This article belongs to the Special Issue Genotype× Environment Interactions in Crop Breeding)

Abstract

:
Two indica inbred rice lines, IR64, a drought-sensitive, and Apo, a moderately drought-tolerant genotype, were exposed to non- (control or unstressed) and water-stress treatments. Leaf samples collected at an early flowering stage were sequenced by RNA-seq. Reads generated were analyzed for differential expression (DE) implementing various models in baySeq to capture differences in genome-wide transcriptional response under contrasting water regimes. IR64, the drought-sensitive variety consistently exhibited a broader transcriptional response while Apo showed relatively modest transcriptional changes under water-stress conditions across all models implemented. Gene ontology (GO) and KEGG pathway analyses of genes revealed that IR64 showed enhancement of functions associated with signal transduction, protein binding and receptor activity. Apo uniquely showed significant enrichment of genes associated with an oxygen binding function and peroxisome pathway. In general, IR64 exhibited more extensive molecular re-programming, presumably, a highly energy-demanding route to deal with the abiotic stress. Several of these differentially expressed genes (DEGs) were found to co-localize with QTL marker regions previously identified to be associated with drought-yield response, thus, are the most promising candidate genes for further studies.

1. Introduction

More than half of the world’s population depends on rice. Most of these people live in Asia, where at least 90% of the world’s rice is produced and consumed [1]. Increasing production has been the center of collaborative efforts and consortia to keep up with the global demands amidst changing climatic conditions, dwindling arable lands, and an increasing world population.
Among the abiotic stresses, drought is considered the most important limitation to rice production in rainfed lowlands and is estimated to affect at least 23M ha of rice area (20% of the total rice area) in Asia [2]. Drought, together with poor soil conditions, limits upland rice yield in over 19M ha representing 15% of the rice-growing area worldwide [3].
While rice is generally adapted to a well-watered or irrigated ecosystem, there are genetic variations against drought that have been observed in traditional and modern varieties [4,5]. These phenotypic variations provide the platform for biological investigation to shed hints on the underlying genetic mechanisms of a drought response.
The advent of modern approaches on genomics such as high-throughput sequencing has revolutionized genetic and transcriptome analyses of important crops including rice. Most notably, the 30K rice genome sequencing project provided a plethora of resource information on its genetic variation, population structure and diversity [6].
Genome-wide expression analysis in response to either biotic or abiotic stress has been a subject of a number of research studies for several years before now. Drought tolerance, for example, has been extensively studied in rice (e.g., [7,8,9]). However, such a trait is challenging to work with as it is controlled by many genes–with both small and large effects. Zhou et al. [9], for example, demonstrated that the tolerance of several genotypes, e.g., N22 and Apo, was attributed to the enhanced expression of several enzyme-encoding genes, while the susceptibility of IR64 was ascribed to significant down-regulation of regulatory alleles.
Molecular markers, on the other hand, such as restriction fragment length polymorphism (RFLP), simple sequence repeats (SSR) and single nucleotide polymorphism (SNP), help to track the genetic loci controlling several traits through quantitative trait loci (QTL) mapping or genome-wide association studies (GWAS). Once identified, the QTL can be selected for breeding programs using marker-assisted selection (MAS) and other strategies. Several drought-response QTLs have been mapped in rice in a number of studies [10,11,12,13,14], mostly employing indica × japonica parental lines where the majority of the drought-tolerance traits were contributed by the japonica parent [14,15]. Recently, GWAS using image-based traits has identified OsPP15 (LOC_Os01g62760, protein phosphatase) to be associated with drought resistance [16].
In this study, Apo, a moderately drought-tolerant upland indica cultivar, and IR64, a drought-susceptible lowland indica cultivar, were sequenced to identify their expression patterns after exposure to both non- and water-stress conditions. These two genotypes are well known for their contrasting sensitivity to drought at a vegetative stage under field conditions [17]. The use of two indica parents offers advantages since indica × japonica lines are extensively studied where both ecotypes are grown in entirely different environments; one allele may not be expressed in a particular ecosystem. Hence, it is desirable to look for genetic variations within indica ecotypes with contrasting response against drought conditions and map loci using the same lines. This approach would provide identification of loci or causative regions, which respond to varying water regimes between two highly genetically related inbred lines. Furthermore, indica accounts for more than 70% of the global rice production and is widely cultivated in China and Southeast Asia [18]. Therefore, such a study will provide valuable insights on the different molecular changes between indica inbred lines.
The present study generally aimed to identify DEGs between the two genotypes through transcriptome analysis under two contrasting water regimes: normal vs. water-stress. Eventually, we co-localized DEGs with previously identified drought-yield QTLs to shortlist potential candidate genes for further studies.

2. Materials and Method

In this paper, we performed differential expression (DE) analysis between two inbred rice lines, IR64 and Apo, using various models as described in baySeq [19,20]. The biological preparations of the materials and the bioinformatics pipeline (see SI 1 for commands used) are described below.

2.1. Dry-Down Experiment

Seeds of the parental inbred lines were pre-germinated for five to seven days in petri plates with sterilized filtered paper, moistened with distilled water. Germinated seeds were transferred in small plastic boxes for one week after which they were transplanted in pots filled with approximately 10 kg of soil mix (2 soil: 1 sand), adequately fertilized and grown under controlled conditions at Phytotron, IRRI at 30 °C temperature with 70% relative humidity (Figure 1). Saturated soils in the pots were covered with white plastic covers, with an opening in the middle to facilitate planting. Feeder pipes were inserted for watering the pots. One pre-germinated seed was transplanted per pot. All the pots were maintained in a well-watered/ flooded condition.
All pots were irrigated twice daily to maintain the soil at saturation. The day before the start of progressive soil drying, soil in each pot was saturated. Stressed plants were allowed to drain overnight by loosening the base stoppers and were weighed early the next morning to get the saturated weight. Stress was imposed by initiating soil dry down protocol starting 10 days before heading.
Gradual dry down to 0.5 FTSW (fraction of transpirable soil water) was imposed and pots were maintained at this level until sampling [21,22,23]. No water was added back to the pot during dry down. All pots were weighed daily to account for volume of water lost and to ensure the stress level was reached.
In this study, non-stress or well-watered treatment served as the normal or control condition; water-stress or water-limiting condition as stressed treatment. These terms are used interchangeably in this paper. Furthermore, as a consequence of alternative splicing, several genes were identified to have one or more splice or transcript variants. Thus, genes are represented as gene models or isoforms as described in Michigan State University (MSU) Rice Genome Annotation located at http://rice.plantbiology.msu.edu/ [24].

2.2. RNA Extraction

At the end of the dry-down treatment, the flag leaf samples from each plant were collected between 0900 and 1100 and were immediately frozen using liquid N. RNA was extracted using the TRIzol method according to the instructions provided by the supplier (Invitrogen, San Diego, CA, USA). RNA-seq libraries were prepared as described in Illumina’s standard protocol for RNA-seq using the parental (IR64 and Apo) RNA samples from each treatment (non- and water-stress). Libraries were sequenced on Illumina GAIIx, generating a 38-bp read size for our first biological rep; 90-base paired end (PE) reads, for the second rep. We tested whether there was significant effect of these dissimilar read sizes in our analysis by generating M (log ratio) and A (mean average) or MA plots.

2.3. Pre-Processing

Quality checking of PE reads was performed using FASTQC [25]. Reports generated from the FASTQC files indicated the absence of adapters, insignificant proportions of over-represented sequences and high base-quality sequences (Q ≤ 20). Therefore, no further processing steps were made. Reads were mapped via bowtie2 (parameters: --no-discordant) to the cDNA pseudomolecules of Oryza sativa indica 93–11 and Shuhui498 and the MSU v7 and International Rice Genome Sequencing Project (IRGSP) models of the japonica Nipponbare as the transcriptome references. Mapping was performed to generate Binary Alignment/Map files using SAMtools [26] (parameter: view –b). These are binary files which are compressed, thus, occupy smaller memory size and are easier for computers to work with. Using the same tool, reads with low mapping quality were removed using a modest filtering parameter (option: view –q 1). We then compared the percentage alignment of reads mapping to the various transcriptome references.

2.4. Read Count Quantification

Read count quantification after transcriptome mapping was performed using Salmon on alignment-based mode (options: --biasCorrect --useErrorModel) [27]. The annotations (“Name”) and the number of reads (“NumReads”) columns generated by Salmon were extracted and a count data matrix was created using R (v3.6.1; in Linux environment) [28].

2.5. Data Filtering and Normalization

Isoforms with low expression values (nearly zero row sums) in the data matrix were removed to decrease memory and increase calculation speed. Normalization of datasets based on library size was performed to make the data from different replicates and treatments more comparable. Library scaling factor was calculated using Trimmed Means of M-values (TMM) [29]. MA plots with Loess curves were created (SI 2) to determine whether normalization was effective. Loess curves indicated an adequate normalization procedure in our datasets.
Prior to DE analysis, Spearman’s coefficient of correlations was calculated, and histograms and summary statistics before and after removal of low read counts were generated. Between Pearson and Spearman methods, we preferred the latter, a non-parametric rank-based metric, well-suited for non-normal distributions to calculate the coefficient of correlations since Pearson is heavily influenced by outliers, and RNAseq data is heavily skewed [30]. Additionally, Spearman was shown to perform best among tested correlation methods for identifying differential correlation [31].
In summary, we implemented several statistical filtering measures and parameters to minimize artifacts in identifying DEGs: (i) reads with low-mapping quality were removed, (ii) isoforms (i.e., rows) with low read counts in the data matrix were filtered out, (iii) datasets were normalized with respect to library size, (iv) Spearman’s coefficient of correlation between replicates of the same sample were very high (0.94 and 0.95), and (v) in case of the dissimilar read sizes (i.e., 38- and 90-bp), tight and symmetrical MA plots were obtained.

2.6. Differential Expression Analysis

BaySeq was used to test DE following the instructions described in the paper by Hardcastle and Kelly [19] and as described in the vignettes [20,32]. Pairwise DE analysis was performed between samples exposed to non- and water-stress conditions for each genotype (i.e., Apo control vs. Apo stress; IR64 control vs. IR64 stress), to determine the effect of the treatment (water stress) to each of the genotypes.
DE using more complex models was also determined to capture: (1) genes that do not change between the conditions nor vary between genotypes: we called it non-differential expression or NDE (IR64 non-stress, IR64 stress, Apo non-stress, Apo stress). Here, we assumed that all the samples belonged to the same group; (2) overall variations between IR64 and Apo due to their genotypic differences, across treatments: genotype DE or GDE (IR64 non-stress, IR64 stress vs. Apo non-stress, Apo stress). These are genes that differ between the two cultivars, under both treatments; (3) differences that arise between the two genotypes due to the stress: we called this drought DE or DDE, a three-way DE analysis (IR64 non-stress, Apo non-stress vs. IR64 stress vs. Apo stress). This captures variations between the two genotypes as a consequence of their exposure to water stress; and (4) residual differences among groups or RDE (IR64 non-stress vs. IR64 stress vs. Apo non-stress vs. Apo stress). These are differences across genotypes and treatments. See SI 2 for additional baySeq R commands and their explanations.
Bayseq [19,20] estimates posterior likelihoods of differential gene expression. For pairwise DE, the average of two replicates was obtained for each treatment and expression ratios were calculated as treatment/control (T/C) plus a pseudo-count of 1 to avoid 0 denominators. Log (base 2) ratio or fold-change (FC) was then computed. In the DE analysis between samples exposed to non- and water-stress treatments of the same genotype, an isoform (or a transcript variant) is said to be differentially expressed if it exhibits |log2FC| ≥ 1, false discovery rate (FDR) p-value correction < 0.05 [33], and an absolute value difference > 10 as was previously implemented [34].
For DE analysis using the other models described above (NDE, GDE, DDE, RDE), a gene is differentially expressed if it exhibits FDR-corrected p-value < 0.05. No residual differences (RDE) were detected in this study.
We used AgriGO [35,36] to perform Gene Ontology (GO) enrichment analysis located at http://systemsbiology.cau.edu.cn/agriGOv2/ [37], implementing Singular Enrichment Analysis (SEA) with O. sativa Rice MSU7.0 nonTE transcript ID as the reference background. A Venn diagram was also generated using InteractiVenn (http://www.interactivenn.net/) [38] to show overlaps among DEGs.
Kyoto Encyclopedia of Genes and Genomes (KEGG) [39] analysis was further performed to determine molecular interactions and relational networks among DEGs. Located at https://www.genome.jp/kaas-bin/ [40], the tool implements BLAST search program against the reference Oryza sativa japonica (RefSeq and RAPDB) as reference databases.

2.7. Co-Localization Analysis

A co-localization step was performed by aligning the positions of DEGs (described above) to previously identified SSR markers known to be involved with yield under drought in populations with the same parental background (IR64/Apo): F3:5 [41] and F2:3 [12]. The population tail ends (highest and lowest yield) of IR64/Apo F3:5 Recombinant Inbred Lines (RILs) were selectively genotyped using SSR markers then we identified regions associated with drought-yield response [41]. On a separate study, Venuprasad et al. [12] identified markers responding to selection under water-limiting conditions using IR64/Apo F2:3 RIL population. These SSR marker regions were anchored in the indica genome and their locations were estimated using Ensembl [42]. Using the same tool, their proximity with DEGs could be estimated. SSR markers were provided in a previous study [43]. Several genes were found to co-localize with the QTL markers at a physical distance of at most 240 kb, the estimated equivalent of 1 cM. The application ICIMapping [44] was used to generate the map based on Cornell and IRMI.

3. Results and Discussion

Two genotypes with contrasting response against drought—(i) IR64, a moderately drought-susceptible genotype [45], and (ii) Apo (IR55423-01), a moderately tolerant variety [46]—were exposed to well-watered (non-stress) and drought conditions (water-stress). Leaf samples were collected after treatment during the flowering stage, the most sensitive stage affecting grain yield [47,48], then were sequenced for RNA-seq. We generated 58,715,576 and 107,027,567 reads from all libraries in rep 1 and 2, respectively, with a grand total read count of 166 million (Table 1).

3.1. Read Mapping

Reads were mapped to the transcriptome references of the indica lines 93–11 [49] (Ensembl release 36) and Shuhui498 (“Shuhui” in this paper) [50]. Likewise, reads were mapped to the cDNA references of the japonica lines, Nipponbare, using MSU v7 [51] and the IRGSP (2005) [52] models, via bowtie2 [53] (see Supplementary Information (SI) 1 for complete commands used). Mapping to multiple transcriptome assemblies aims to determine which reference sequence yields the best percentage alignment.
Initial mapping of three sample libraries against the 93-11 cDNA showed an average of 52% alignment rate (data not shown) against the other three transcriptome references. Among the reference assemblies, MSU v7 and Shuhui showed the best alignment rates (83%; shown in Table 1 and Table S1, respectively). Details of alignments including multiple aligned reads using MSU v7 is shown in Table S2. However, between MSU v7 and Shuhui, we preferred the former reference for further analysis to be consistent with our previous studies on allelic imbalance in hybrids [41] and regulatory divergence [54]. However, results using Shuhui, an indica like our materials, are sporadically presented below and are comprehensively discussed in the Supplementary Discussion for comparative purposes.

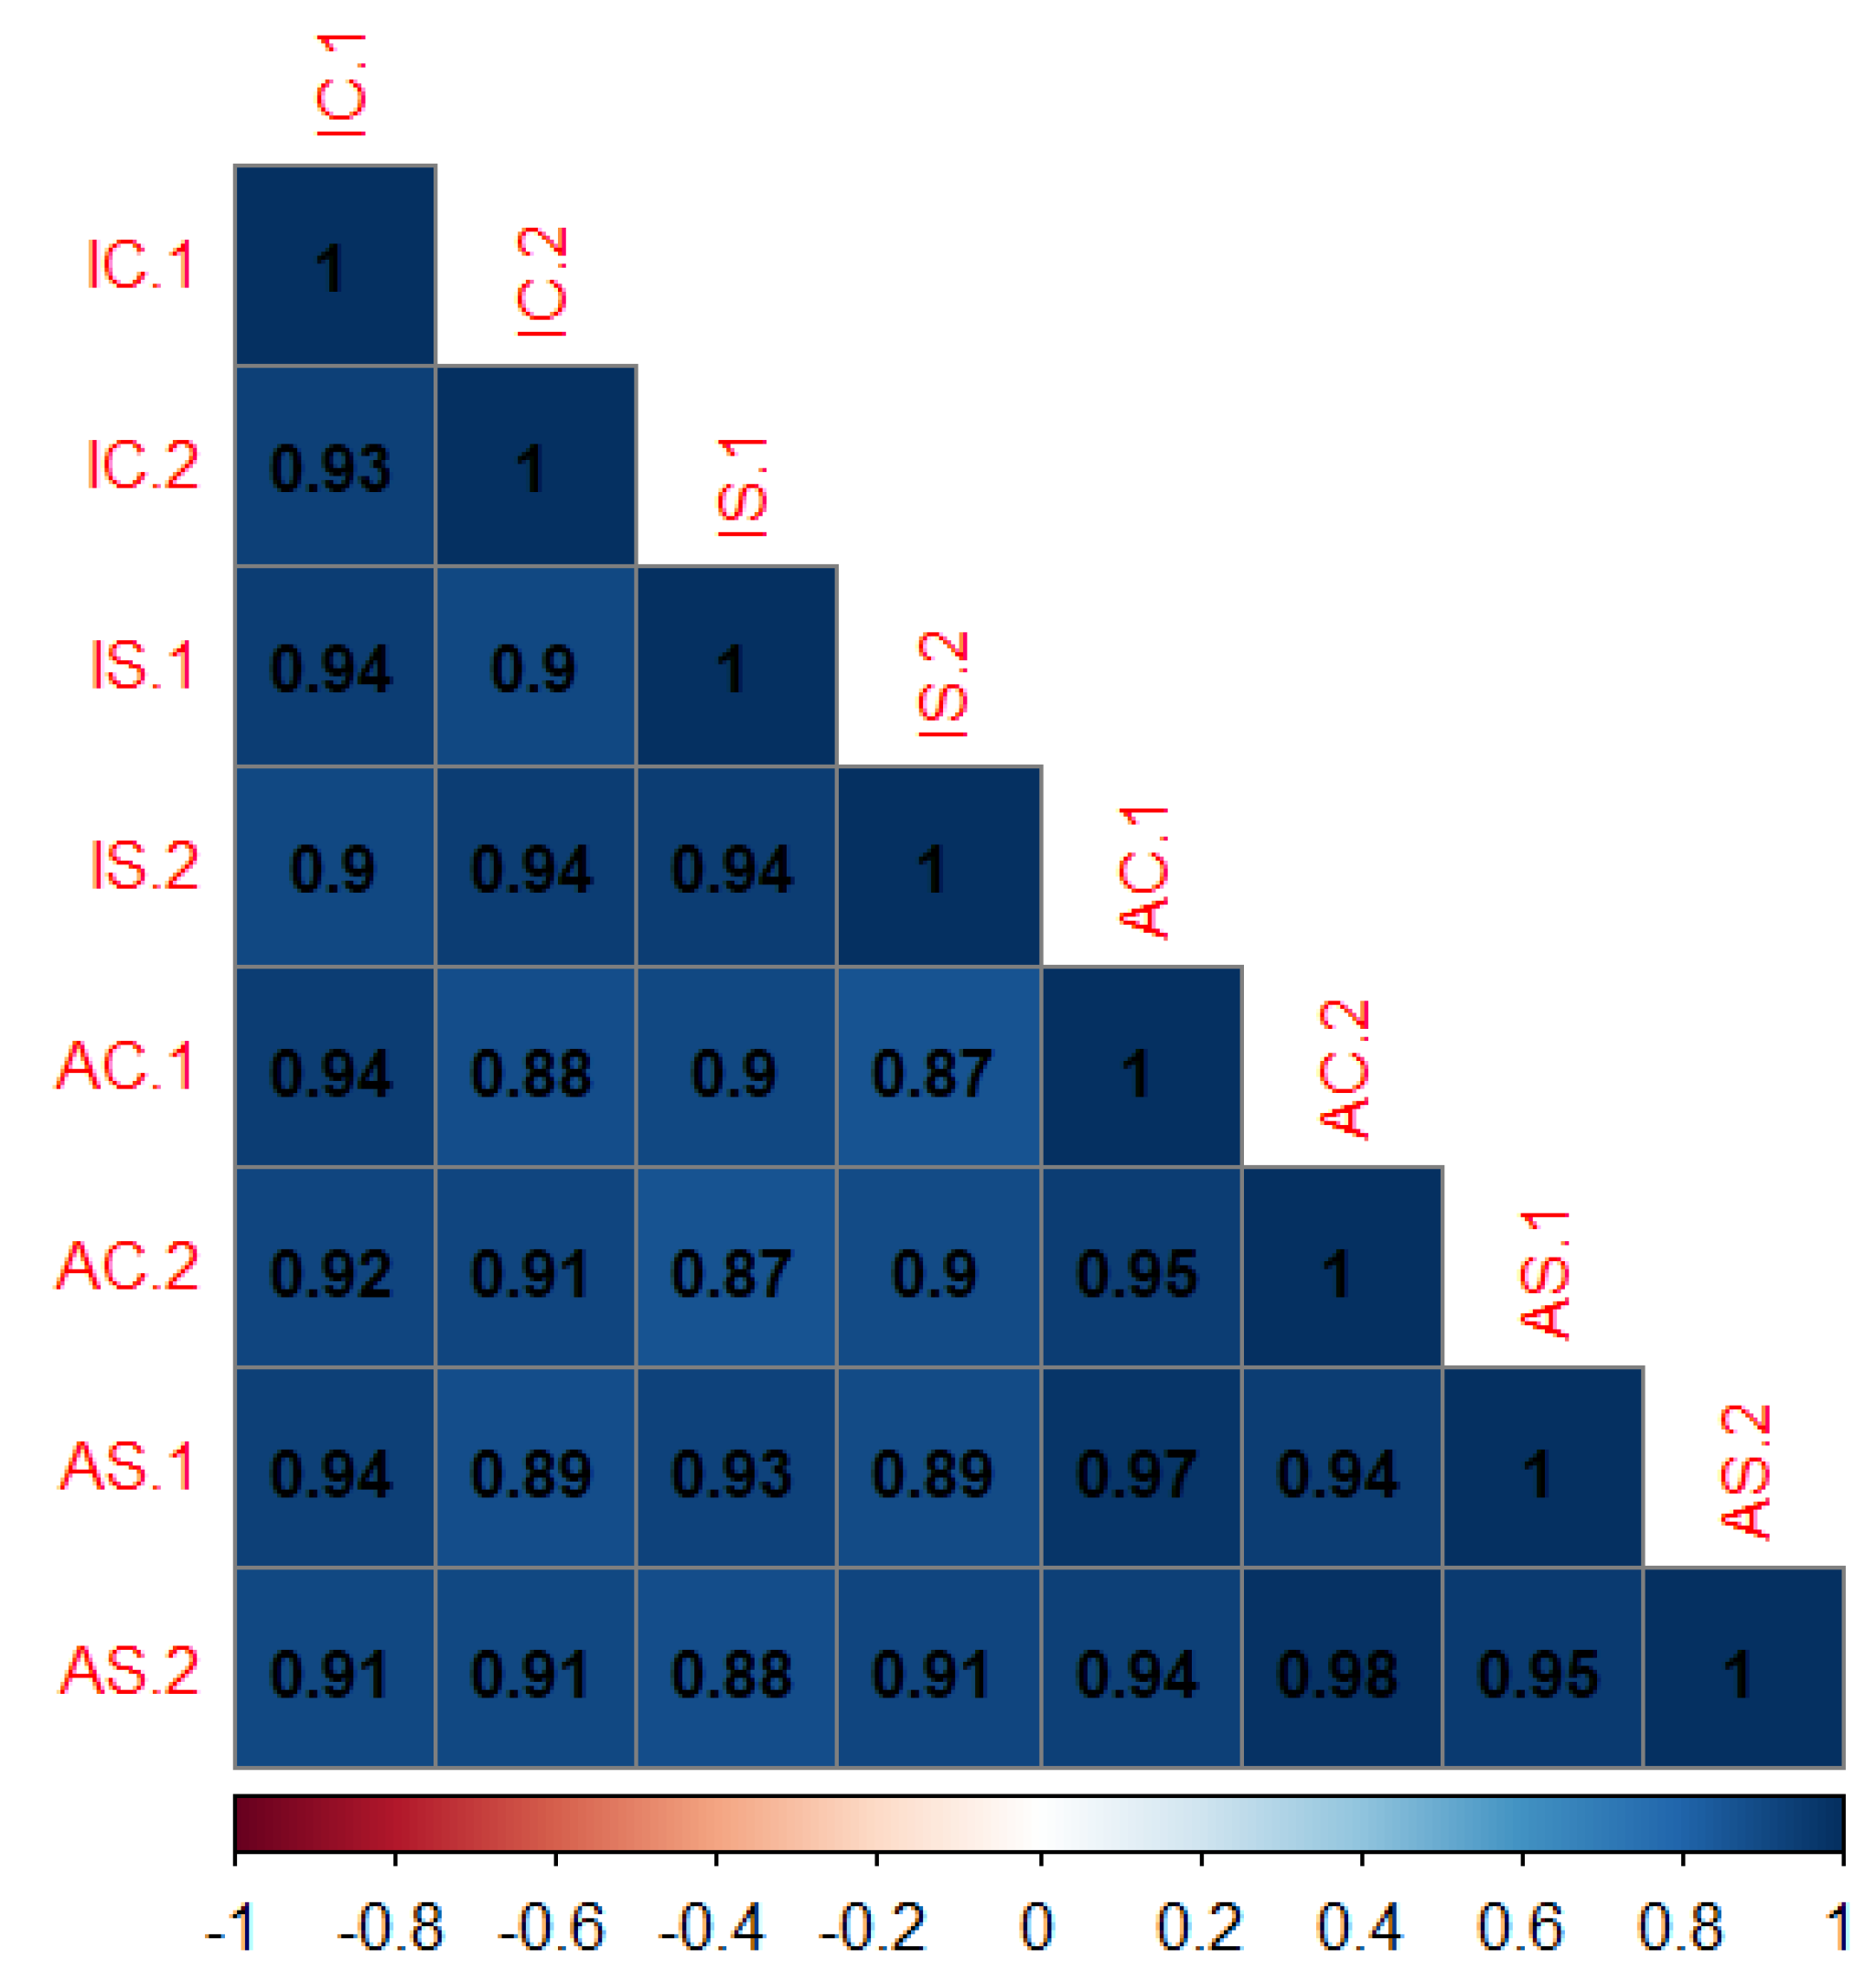
3.2. MA Plots and Spearman’s Coefficient of Correlations

The sequencing protocol generated 38– and 90–basepair read sizes for replicates 1 and 2, respectively. To determine whether there was an impact of these varying sizes on the succeeding analysis, MA plots (where M is the difference in log expression values and A is the average [55]) with Loess curve [56,57] were created between IR64 reps 1 and 2 and between Apo reps 1 and 2. Results showed that MA plots indicated tight and symmetrical data points (at M = 0) with centered Loess curves suggesting that there is no significant variability between the two replicates of the same genotype (Figure S1). Hence, it is reasonable to suppose that there is no influence of the dissimilar read sizes in the succeeding DE analysis.
Using MSU v7 transcriptome reference, Spearman’s coefficient of correlations using normalized read counts between replicates showed 0.93 and 0.94 in IR64 control and stress treatments, respectively (Figure 2). Similarly, Apo showed 0.95 between replicates under both non- and water-stress treatments. These results indicate a high level of reproducibility between replicates of the same genotype.

3.3. Pairwise DE (PDE) Between Treatments of the Same Genotype

Samples exposed to non- and water-stress conditions were analyzed for PDE (i.e., IR64 control vs. IR64 stress; Apo control vs. Apo stress) to determine the effect of the treatment in each genotype. Before testing for PDE, read counts were normalized with respect to library size. MA plots with Loess curves were, likewise, generated to visualize whether our normalization procedure was effective. Results showed symmetrical MA plots with “centered” Loess curves in our analyses, indicating that the normalization procedure was effective (Figure S2).
In the IR64 samples, 170 genes were found to be differentially expressed (Figure 3; Table S3). Of these, 36 (21.2%) and 134 (78.8%) are down- and up-regulated, respectively, under water-stress conditions (|log2FC| > 1, FDR < 0.05). Two of the genes repressed under water-limiting conditions encode for a nucleotide-binding site leucine-rich repeat (NBS-LRR), which is known to be involved in disease resistance, and a brassinosteroid insensitive 1-associated receptor kinase which was recently found to play a role in plant growth and defense [58] (complete list is shown in Table S3). On the other hand, genes up-regulated under water-stress include zinc finger, MYB, NAC, late embryogenesis abundant protein, and a bZIP protein, most of which are transcription factors (TFs). Such molecules were known to play crucial roles during drought stress (reviewed in [59]).
In Apo, four genes showed significant DE between non- and water-stress conditions (Figure 3; Table S4). Of these, one gene, a transposon is repressed, while three genes which include dehydrin, HSF-type DNA-binding protein and an expressed protein are induced under stress conditions. These three up-regulated genes in Apo were also found to be induced in the susceptible cultivar, IR64 (Figure 3a) suggestive of their crucial roles in water-limiting conditions. Apparently, dehydrin is up-regulated in both IR64 and Apo which are known to contribute in the acquisition of drought and cold tolerance (reviewed in [60]). On the other hand, TFs were found to be induced in the drought-sensitive IR64 but not in Apo using Shuhui as the reference assembly (see Supplementary Discussion). No GO terms were enriched in the pairwise analysis.
Results using Shuhui and MSU v7 assemblies consistently suggest that there is a major difference in the number of genes responding to changes in environmental conditions between IR64 and Apo. IR64, the drought-intolerant but high-yielding variety, exhibited a wider transcriptional response when exposed to water-stress conditions, while Apo, the drought-tolerant genotype, showed modest expression changes. These findings potentially demonstrate that Apo is relatively transcriptionally stable under stressful conditions. Our results align with a previous study on jute [61]. The drought-susceptible species (Corchorus capsularis L.) showed a higher number of DEGs (794) as compared to the drought-tolerant species (Corchorus olitorius L.; 39) in response to a Polyethylene Glycol (PEG)-induced drought stress.

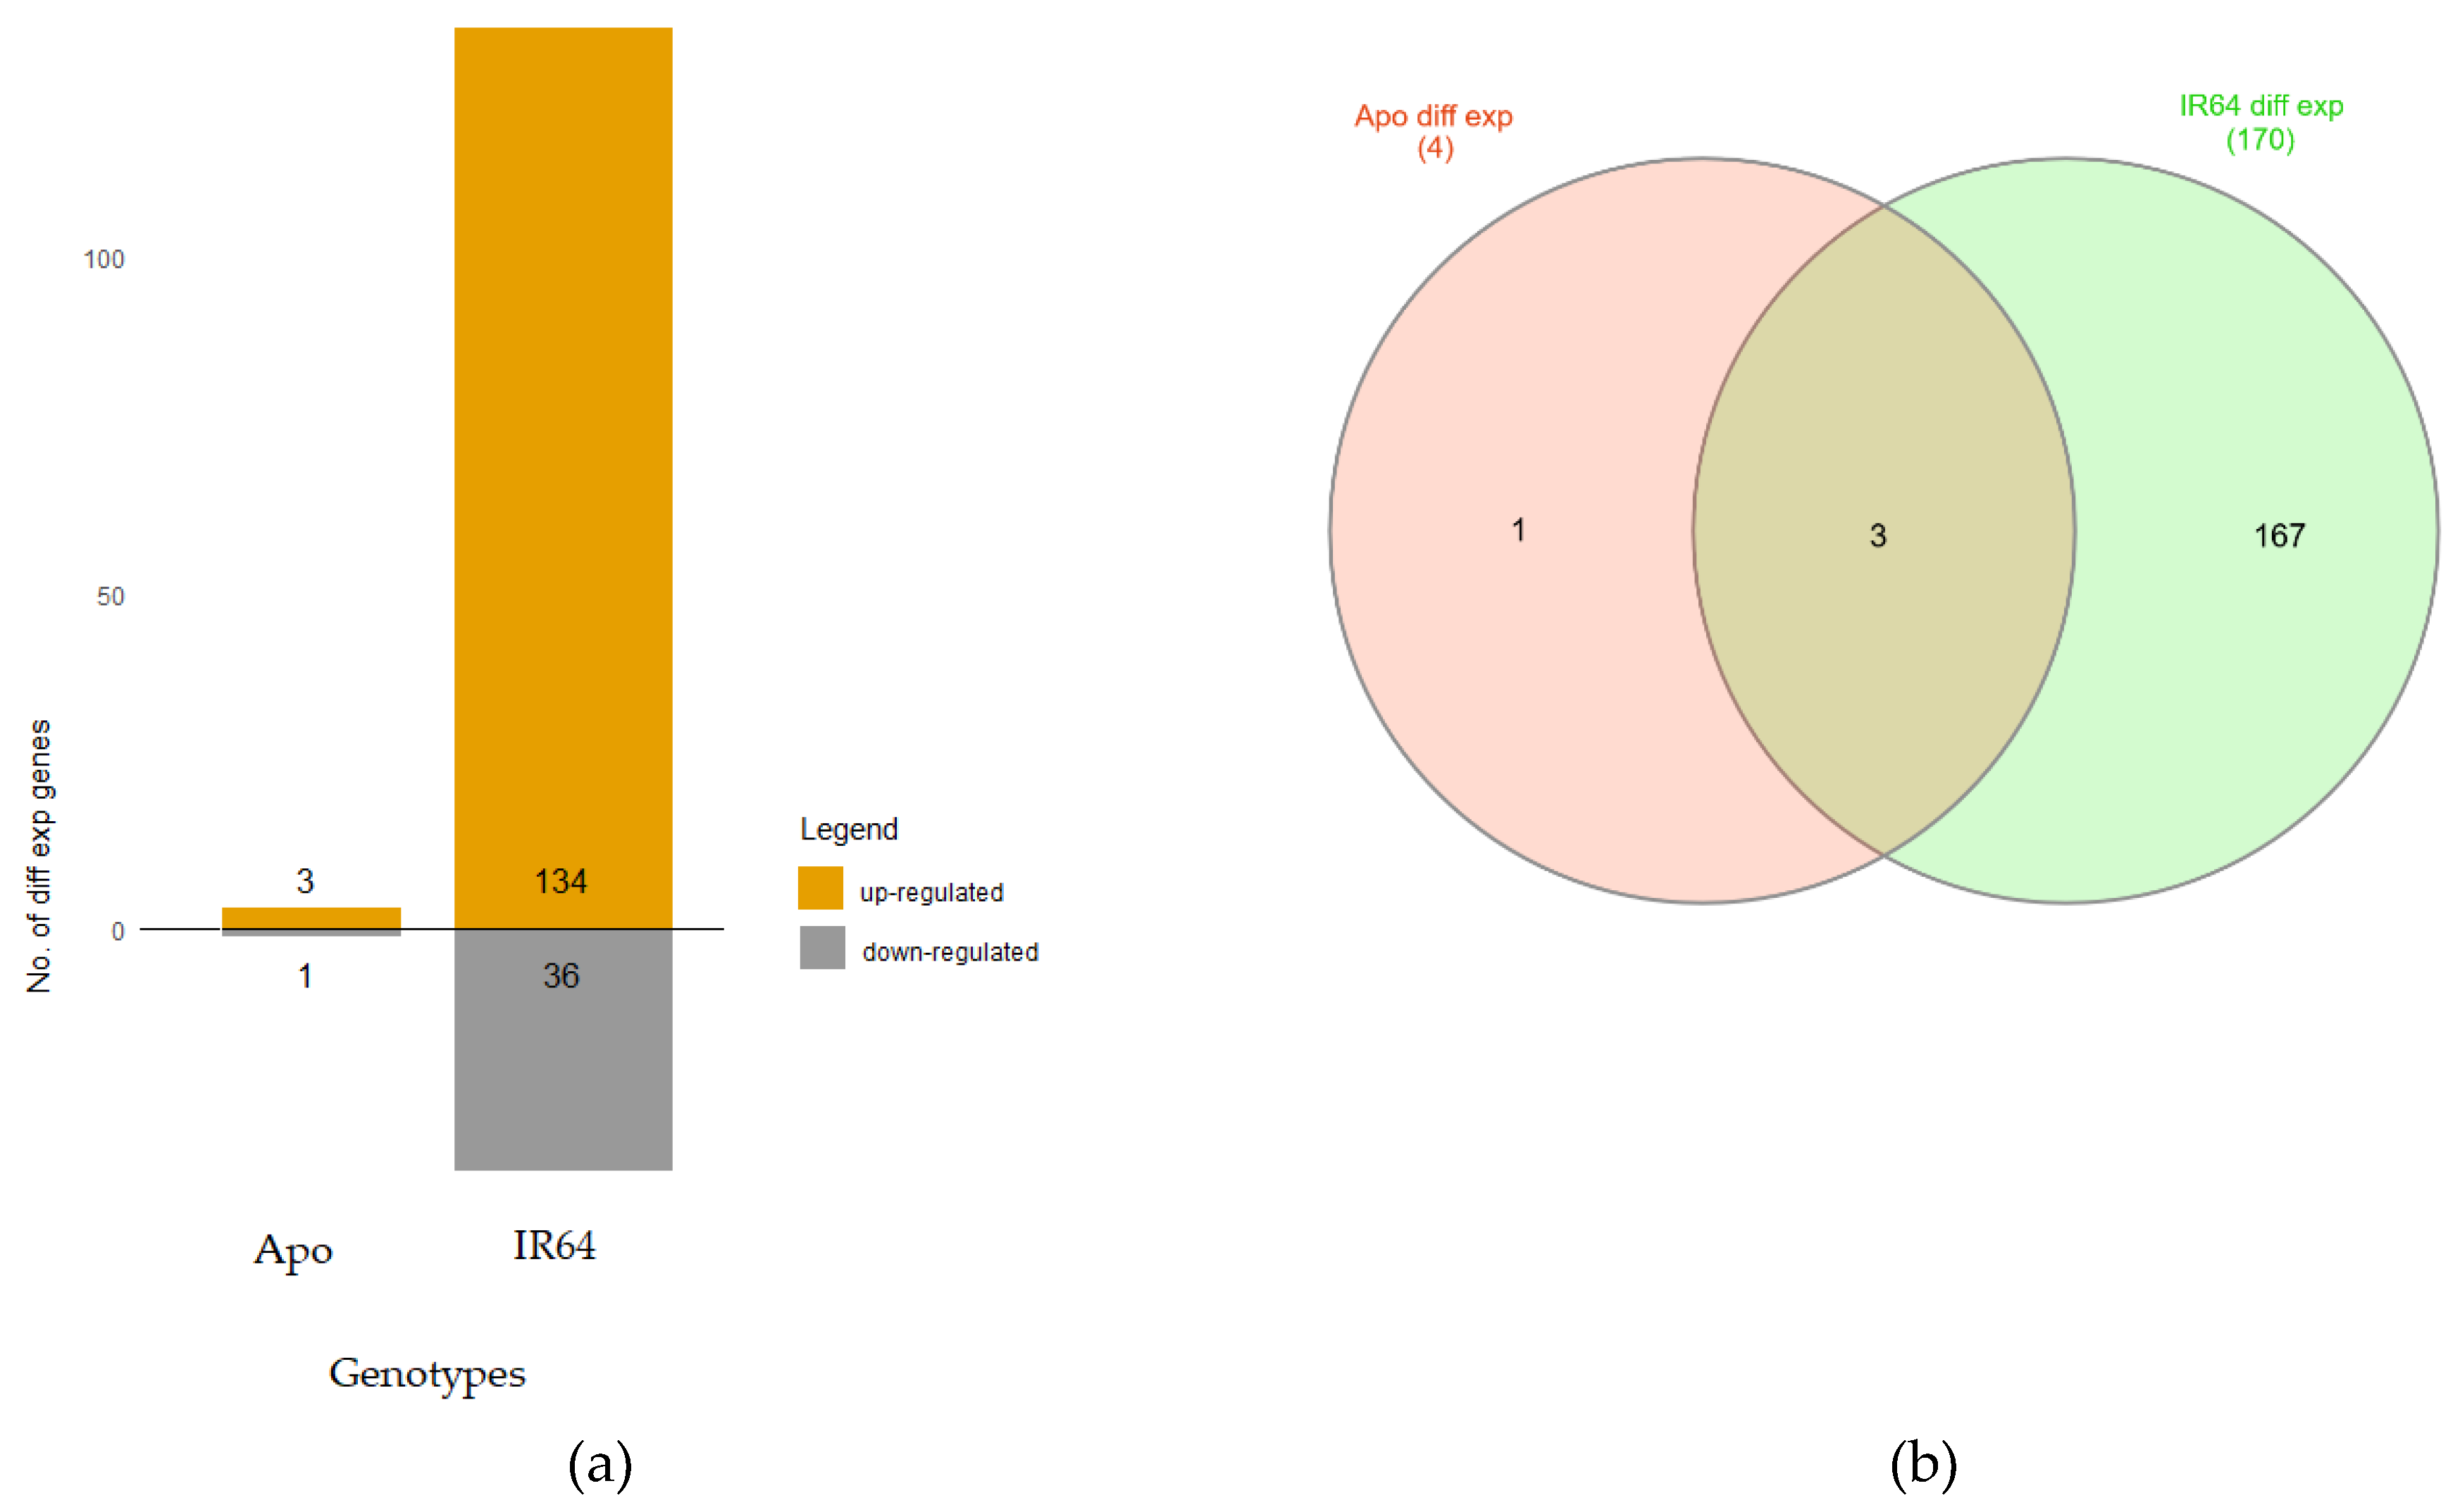
3.4. Differences Due to Genotypic Background across Treatments

We tested for DE between genotypes using a different model to capture differences between the two parental inbred lines across the environmental conditions (“genotype differential expression” or GDE; see SI 2 and Materials and Method). Analysis showed that there were 729 up-regulated genes in Apo but were down-regulated in IR64 (at FDR < 0.05; Table S5). On the other hand, 828 genes were significantly up-regulated in IR64 but were down-regulated in Apo.

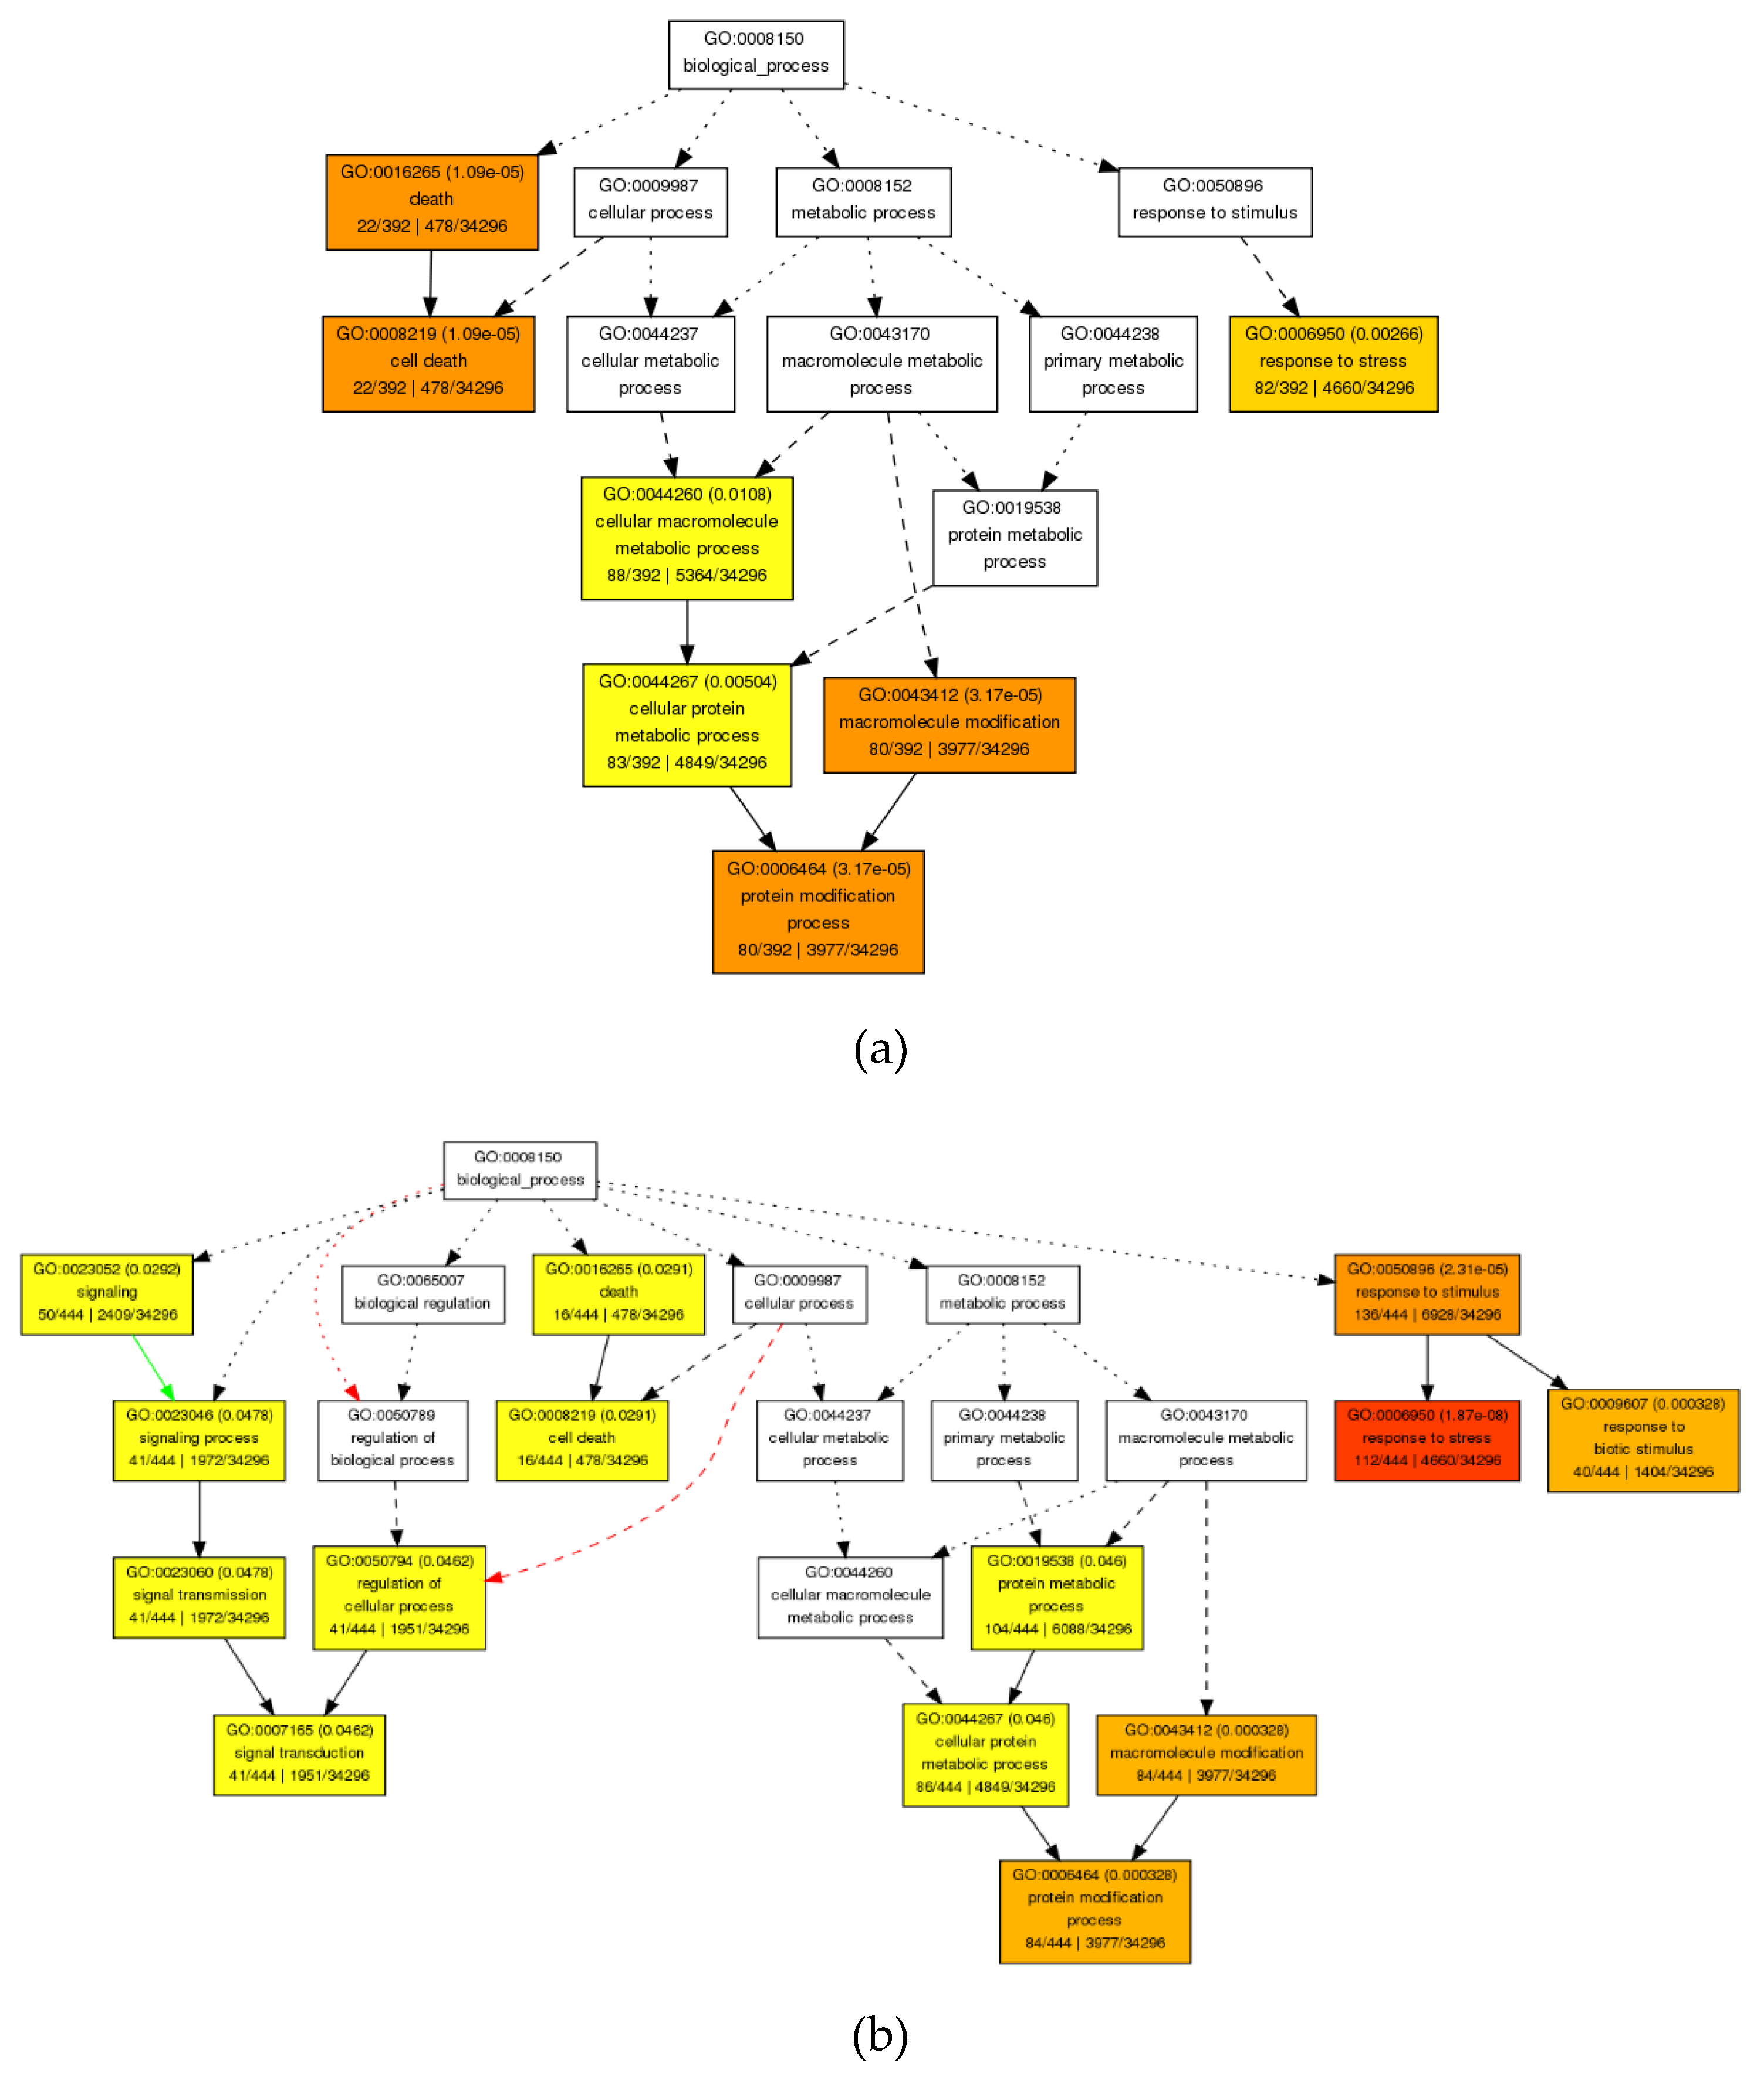
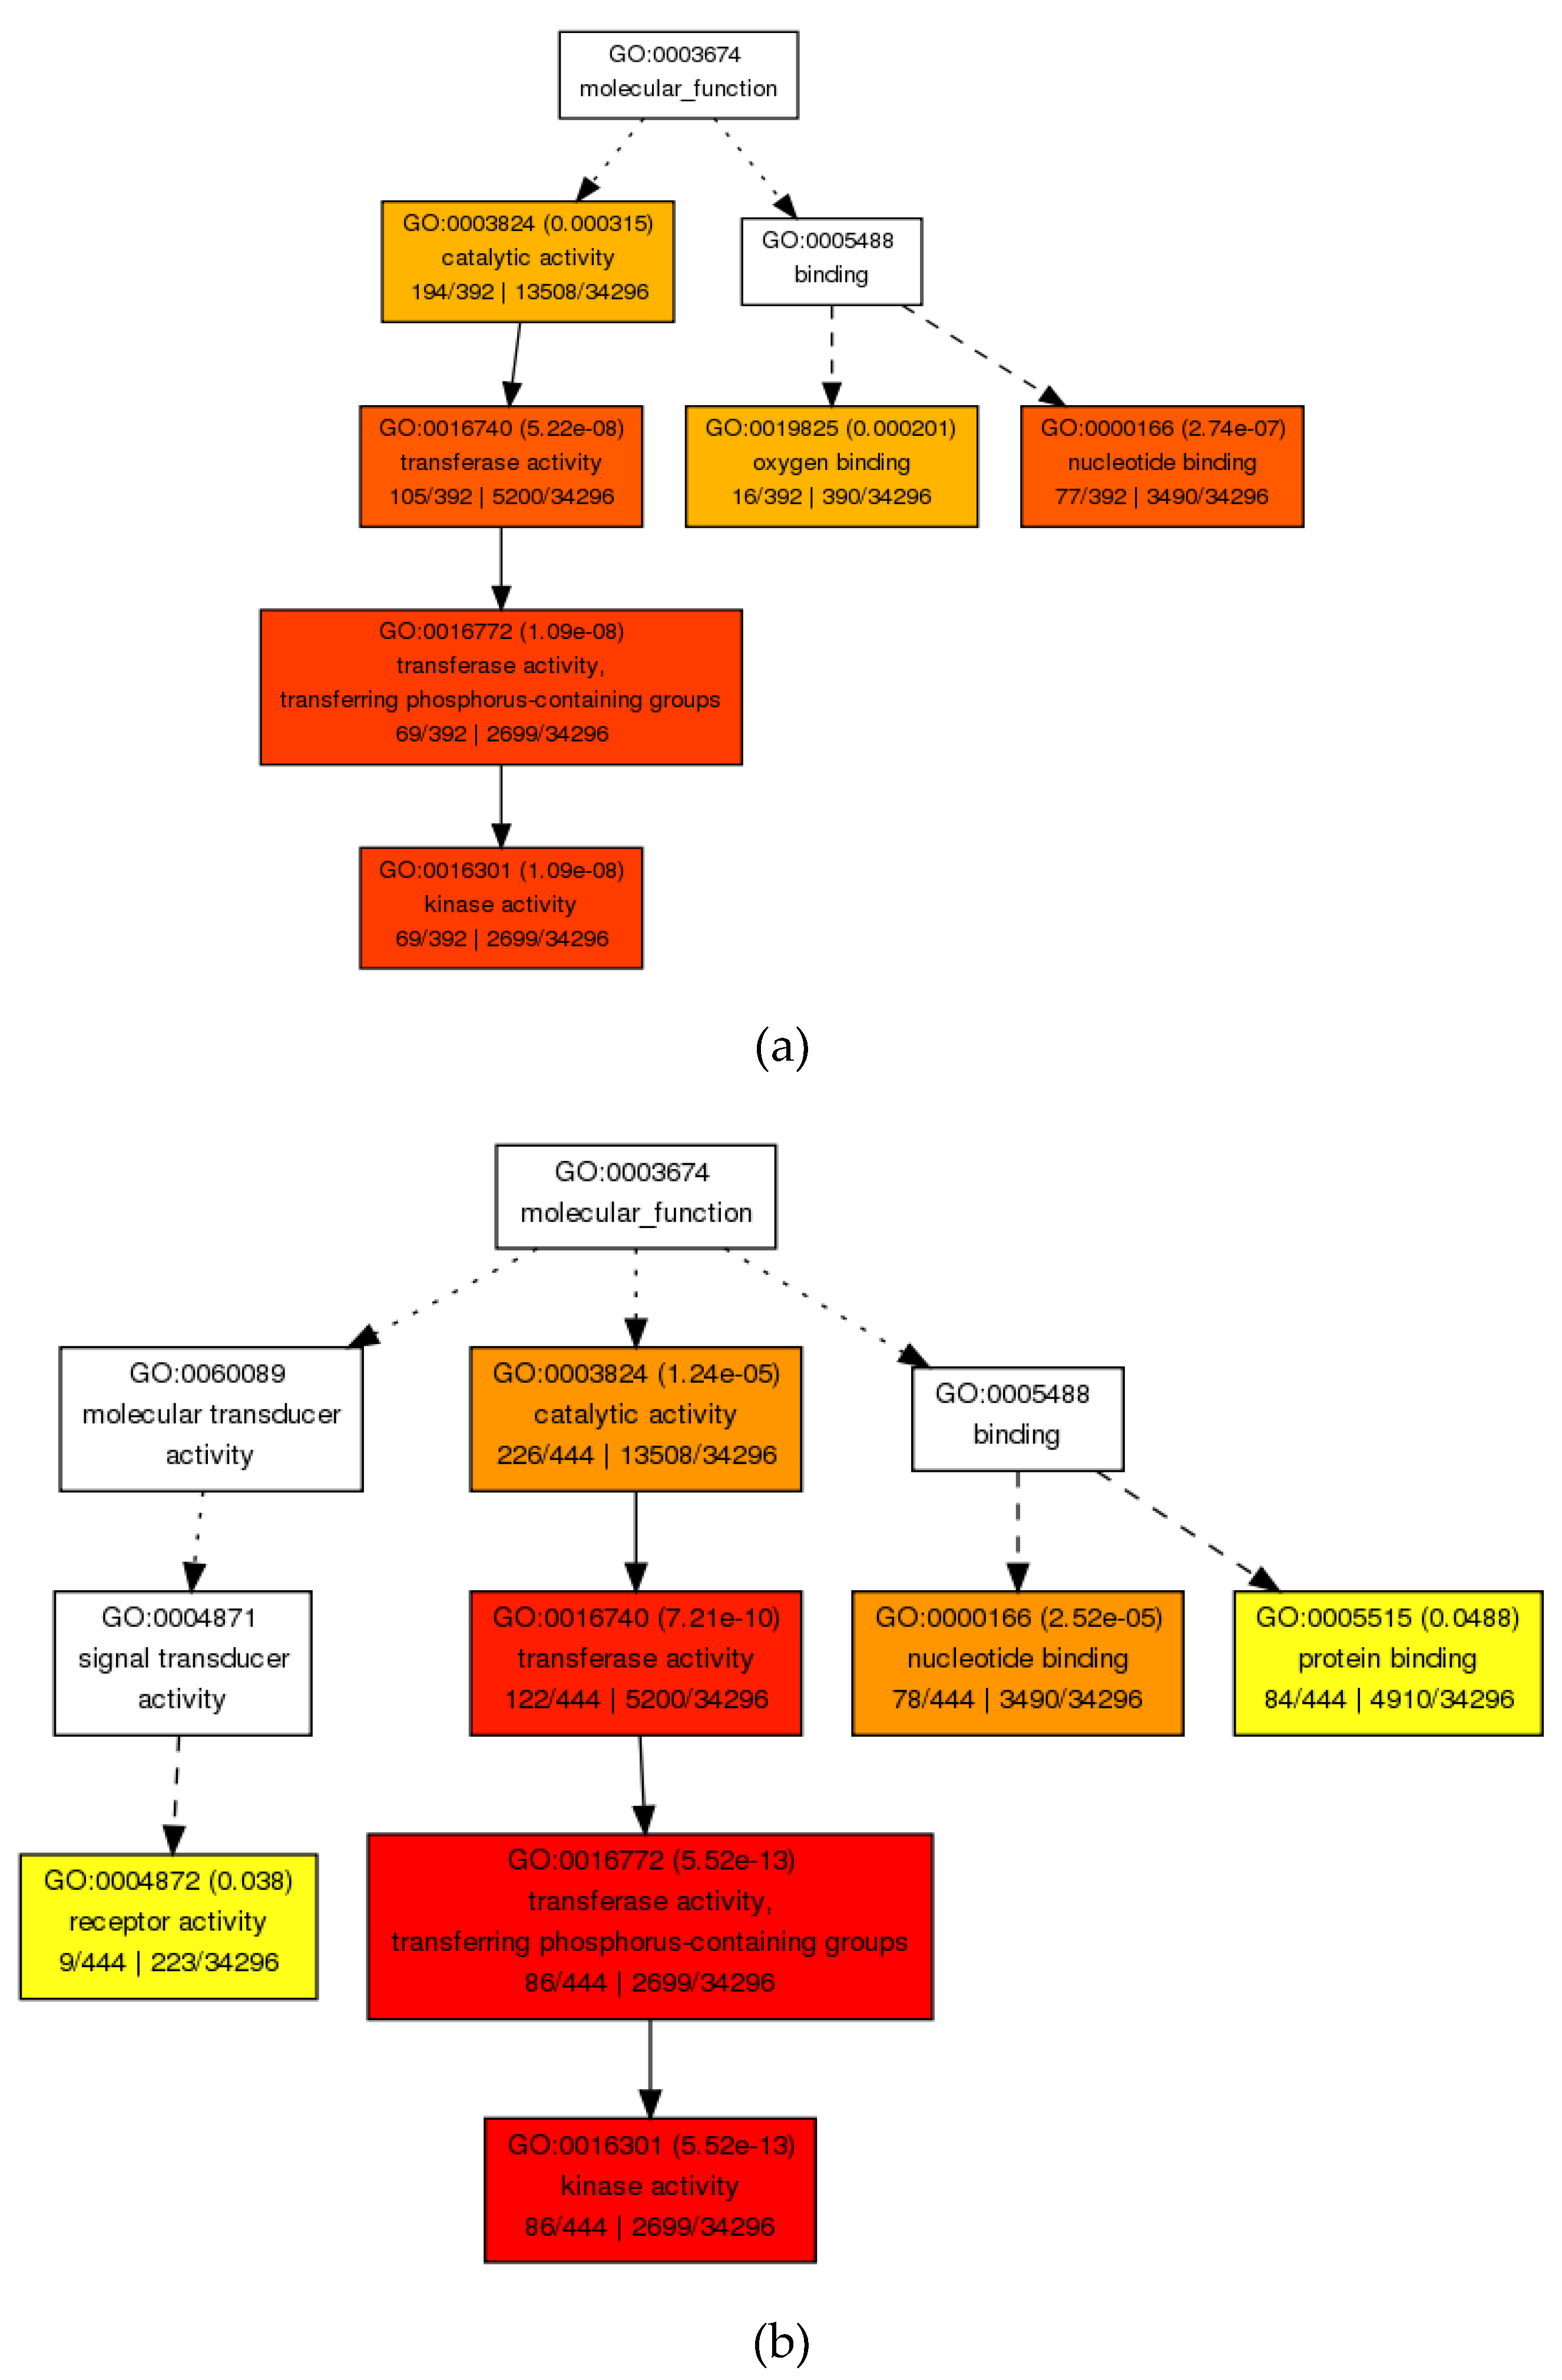
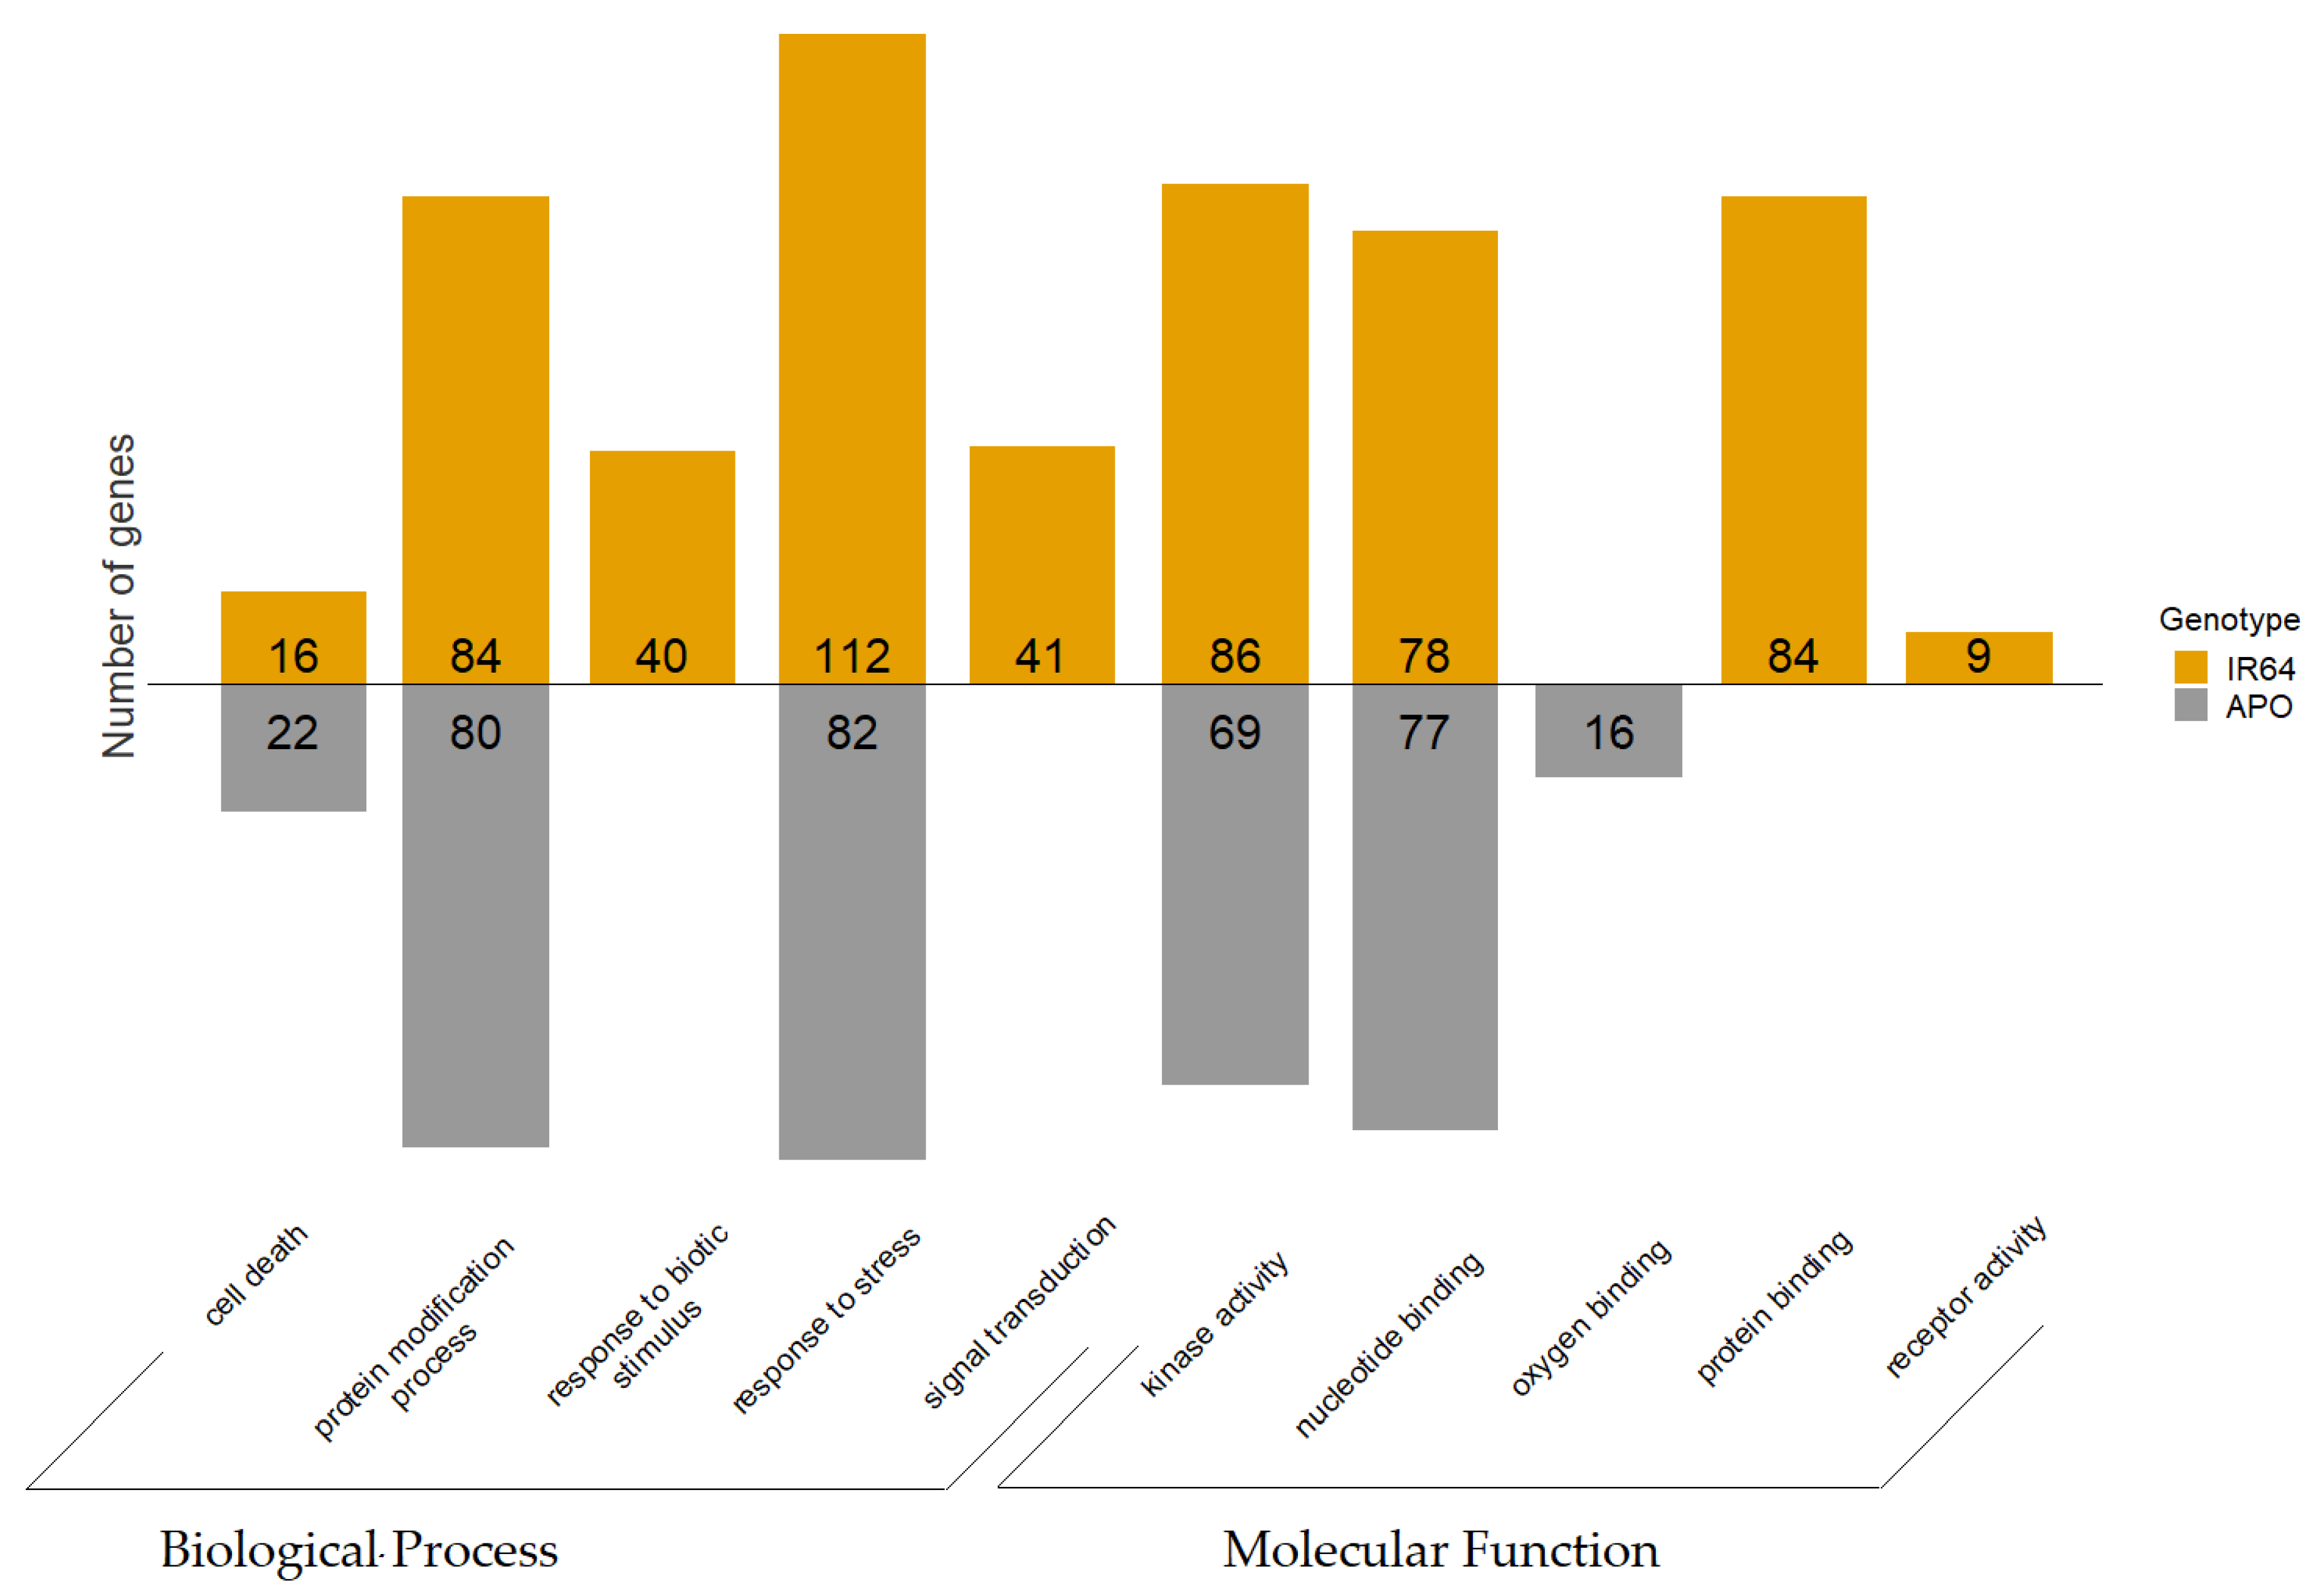
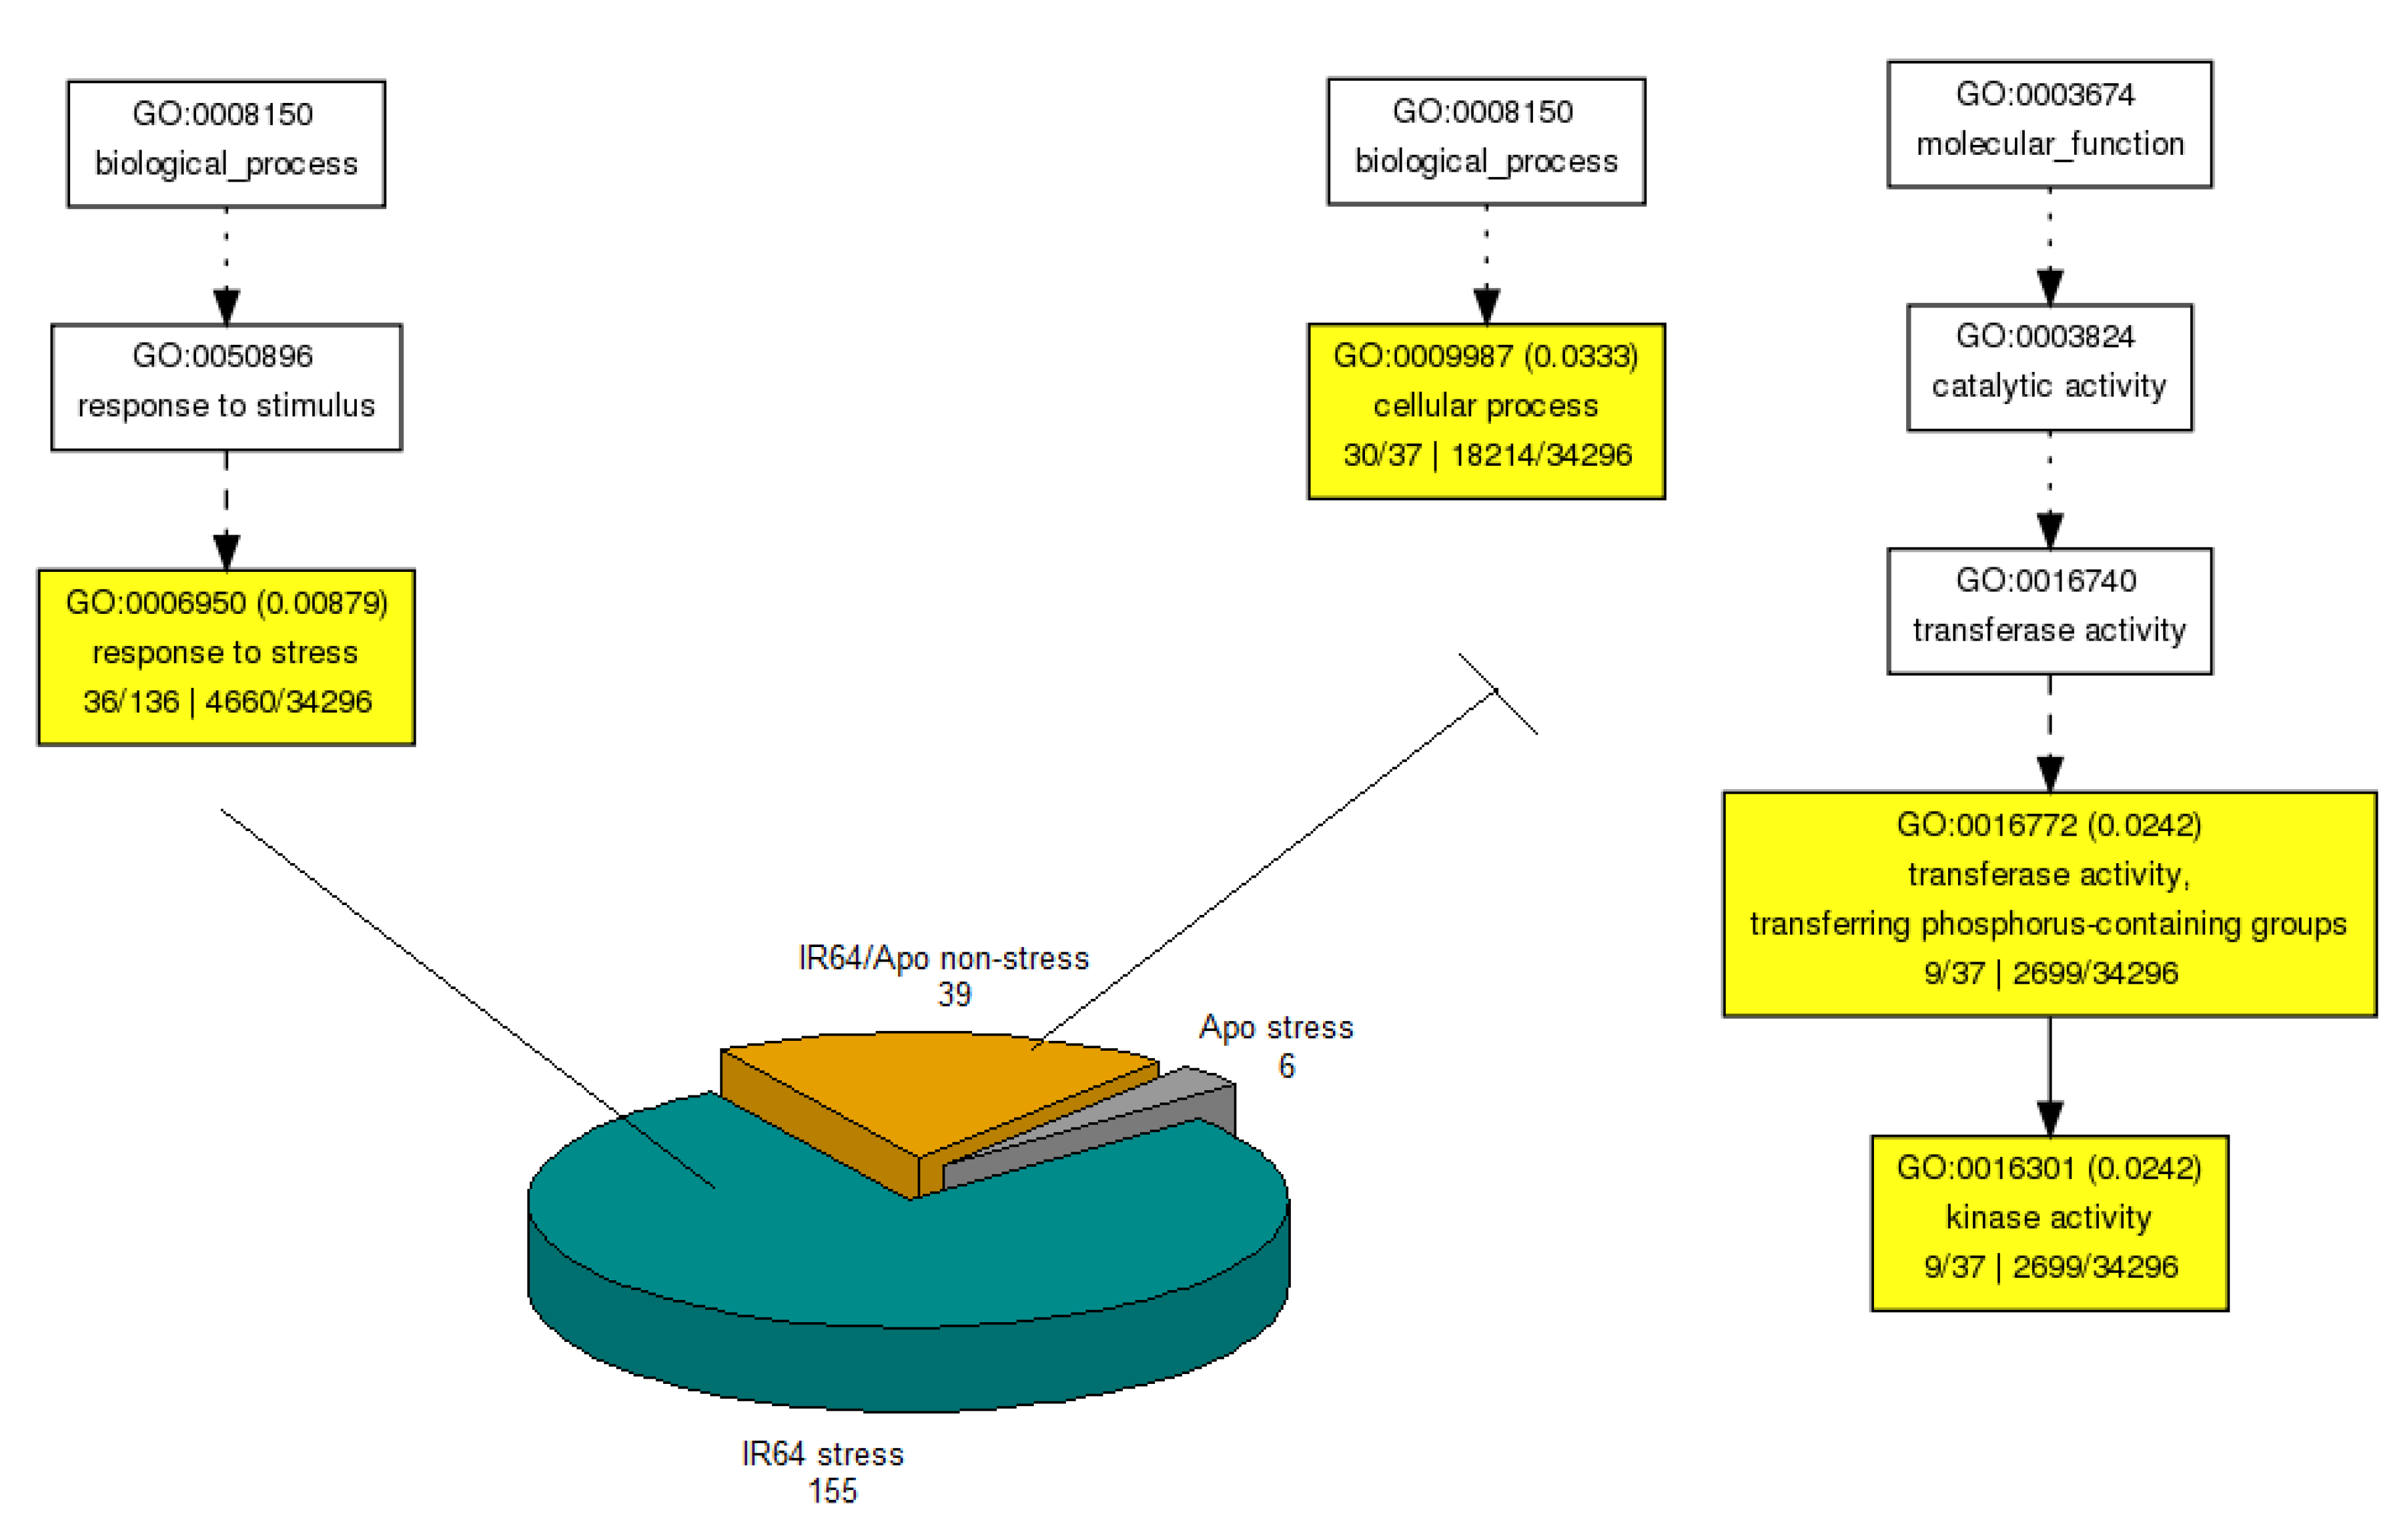
3.4.1. GO Enrichment Analysis

Biological Process. GO analysis provides information on the potential functions of genes. Using AgriGO [35,36], analysis revealed that both genotypes showed up-regulation of several genes enriched in response to stress, cell death, and protein modification process (biological process; FDR < 0.05; Figure 4). Between the two genotypes, IR64 induces a wider suite of genes (112 genes) associated with response to stress, as compared to Apo (82; FDR < 0.05; Figure 4).
Both varieties commonly induce genes which encode for disease resistance protein, NBS-LRR, and nucleotide-binding—APAF-1, R proteins, and CED-4 (NB-ARC) associated with cell death, one of the most frequently enriched biological processes. However, Apo uniquely encodes for AP2 (LOC_Os09g11480), Leucine Rich Repeat (LRR; LOC_Os04g26350 and LOC_Os06g16450) and heat-shock protein (LOC_Os08g32130) enriched in cell death, which are not found in IR64. On the other hand, IR64 showed the DE of genes associated with response to biotic stimulus and signal transduction, the most frequently enriched biological processes, which are not enriched in Apo (Figure 4b and Figure 6). Some of the genes associated with signal transduction encode for receptor-like protein kinases (12 genes), LRR (4 genes), NBS-LRR disease resistance protein (2 genes), receptor kinase (2 genes) and a serine/threonine-protein kinase receptor precursor.
Molecular Function. GO analysis using AgriGO of the up-regulated genes in both genotypes showed common significant enrichment (FDR < 0.05) of genes associated with kinase activity and nucleotide binding (Figure 5 and Figure 6).
Interestingly, Apo exhibits up-regulation of 16 genes distributed across its genome, all of which encode for cytochrome P450 associated with oxygen binding activity (FDR < 0.05) (Figure 5a and Figure 6). These genes are either not expressed or down-regulated in the drought-susceptible, IR64. Cytochrome P450 has been recently found to augment tolerance against drought stress in transgenic tobacco [62]. This information sheds hints that Apo is capable of scavenging reactive oxygen species (ROS), which may impose cellular damage and even death if not kept under control for a prolonged period of drought stress (reviewed in [63]).
Additionally, GO enrichment analysis showed that genes associated with protein binding and receptor activity were the most frequently enriched molecular functions of the GDE genes which are unique in IR64; hence not enriched in Apo (at FDR < 0.05; Figure 6). Some of the genes enriched in receptor activities include NBS-LRR disease resistance protein (LOC_Os02g38392, LOC_Os11g10760), LRR (LOC_Os09g15850), LRR receptor kinase (LOC_Os03g48890), serine/threonine-protein kinase (LOC_Os05g42210), 26S proteasome regulatory subunit S5A (LOC_Os10g05180). These genes are commonly induced during stress conditions.

3.4.2. KEGG Pathway Analysis of GDE Genes

ROS scavenging pathways. The accumulation of ROS during stressful conditions may cause damage against essential macromolecules and even death of plant cells. Plants, being sessile, have evolved important metabolic pathways to scavenge harmful ROS which include phenylpropanoid biosynthesis and peroxisome pathway (reviewed in [64,65]).
In the drought-susceptible IR64, four significantly differentially expressed isoforms were found to be involved in phenylpropanoid biosynthesis using KEGG pathway analysis. These included LOC_Os07g47990 (peroxidase precursor), LOC_Os02g26810 (cytochrome P450), LOC_Os05g30350 (beta-glucosidase), and LOC_Os08g34790 (AMP-binding domain).
Apo, on the other hand, showed significant up-regulation of four genes involved in both metabolic pathways. These included LOC_Os12g35890 (FAD-dependent oxidoreductase domain-containing protein) and LOC_Os01g53060 (peroxisomal membrane protein) of the peroxisome pathway; LOC_Os01g36240 (peroxidase precursor) and LOC_Os08g43040 (transferase family protein/ shikimate O-hydroxycinnamoyltransferase) of the phenylpropanoid biosynthesis.
Hormones. Hormones such as abscisic acid (ABA), auxin and jasmonic acids (JAs) play key roles in responding to both biotic and abiotic stresses (reviewed in [66]). Using KEGG pathway analysis, the drought-susceptible IR64 was found to induce LOC_Os03g08320 (jasmonate ZIM domain-containing protein) and indole acetic acid (IAA) synthetase (LOC_Os07g40290), both of which are associated with plant hormone signal transduction. Apo, on the other hand induces LOC_Os01g28450 (pathogenesis-related protein/SCP-like extracellular protein) which has been known to participate in a drought and salt response ([67]).
Transcription factors (TFs). Two genes significantly differentially expressed in IR64 were found to encode for MYB (LOC_Os01g50110) and MADS box (LOC_Os01g66030). Apo, on the other hand, induced genes including LOC_Os04g04390 (RFA1; replication factor A1/ retrotransposon), LOC_Os06g50510.1 (homeobox-leucine zipper protein), LOC_Os08g42600.2 (retinoblastoma-like protein 1) and LOC_Os08g38990.1 (WRKY).
Comparatively, Shuhui and MSU v7 as transcriptome references both suggest that IR64 was found to have a wider repertoire of DEGs relative to Apo (see Supplementary Discussion). A similar study performed between two maize inbred lines with contrasting response to drought exposed to varying levels of stress (drought and well-watered) revealed that TFs enhance tolerance to drought [68]. Moreover, the sensitive line showed a greater number of genes (2558 genes) responding to drought against the tolerant line (555 genes). These findings were consistent with our study in which the drought-intolerant line exhibited a wider dynamic transcriptional response over the drought-tolerant genotype. These studies [61,68], including this paper, suggest that drought-intolerant varieties are highly responsive or are more vulnerable while drought-tolerant are sturdier against drought stress at the transcriptional level.

3.5. Differences Due to Drought (G × E) Using 3-Way DE Model

Expression variation that arises due to the interactions between genotypes and environment (G × E) can be detected. Using a different model in baySeq (drought differential expression or DDE; see SI 2), genes responding to contrasting water treatments between the two genotypes could be identified. We used a three-way DE model to detect these types of genes with comparative components including: IR64 and Apo under non-stress vs. IR64 under stress vs. Apo under stress conditions (see Figure 7 for additional information).
Using this model, 39 genes were dominantly expressed by IR64/Apo non-stress, which were expressed in descending order by the other groups (i.e., IR64/Apo non-stress > IR64 stress > Apo stress or IR64/Apo non-stress > Apo stress > IR64 stress) (see Table S6). LOC_Os04g41510.1 (serine/threonine-protein kinase), for example, were expressed at 1050, 466 and 189 (average normalized read counts) by IR64/Apo non-stress, Apo stress and IR64 stress, respectively (FDR < 0.05); hence, in descending order of expression levels, IR64/Apo non-stress > Apo stress > IR64 stress.
These 39 genes were enriched in kinase activities (molecular functions; FDR < 0.05) and cellular process (biological process; FDR < 0.05) (Figure 7). As these are expressed under normal conditions, these are constitutively transcribed in both genotypes. Kinases play important functions in phosphorylating compounds involved in signaling pathways. Some of the genes found enriched in this group include LOC_Os03g50325.1 (phosphatidylinositol 4-kinase), LOC_Os07g18240.1 (lectin-like receptor kinase), LOC_Os07g45070.1 (FAT domain-containing protein), LOC_Os04g41510.1 (serine/threonine-protein kinase), and LOC_Os06g12590.2 (protein kinase).
Further results reveal six genes significantly up-regulated in Apo under drought conditions compared to the other groups (FDR < 0.05; Table S6) (Figure 7). Hence, a relatively modest number of genes are significantly induced in Apo under a water-stress regime. These genes include cytochrome (LOC_Os11g29720.1), MYB (LOC_Os06g51260.2), DNA-binding protein (LOC_Os02g47560.1), regulator of ribonuclease (LOC_Os02g52450.1), expressed (LOC_Os05g11428.1) and Proton-dependent Oligopeptide Transporter or POT (LOC_Os11g18110.1) (Table S6). Some of these genes, like cytochromes which participate in ROS scavenging and MYB transcription factors, were known to engage in water-stress conditions. No genes under “Apo stress” group were enriched in any of the GO domains or terms.
On the other hand, 155 genes were significantly up-regulated in IR64 under water-stress conditions relative to the other groups (see Table S6) further demonstrating that IR64 consistently exhibits a higher transcriptional response when exposed to drought conditions. Examples of IR64 genes responding to the stress (G × E genes) include auxin-induced protein, dehydrins, cytochromes, LEA proteins, stress-responsive protein and known TFs (see Table S6). KEGG pathway analysis further confirms the participation of TFs, six of which were detected: LOC_Os01g46970 (plant G-box-binding factor), LOC_Os08g36790 (ABA responsive element binding factor; bZIP TF), LOC_Os01g10320 (HD-ZIP; homeobox-leucine zipper protein), LOC_Os01g39020 (HSFF; heat shock transcription factor), LOC_Os04g42950 (MYB transcription factor) and LOC_Os03g48970 (NFYA; nuclear transcription factor Y, alpha).
GO analysis showed significant enrichment of up-regulated genes associated with “response to stress” (36 genes; FDR < 0.05; Figure 7) suggesting the induction of drought-response molecules. Notably, several of these genes encode for proteins known to participate in a stress response: LRR (LOC_Os01g06890), ethylene-responsive TF (LOC_Os04g32620), thioredoxin (LOC_Os04g44830), LOC_Os04g45810 (homeobox associated leucine zipper), universal stress proteins (LOC_Os01g32780, LOC_Os01g63010, LOC_Os02g47840, and LOC_Os05g07810), bZIP TF (LOC_Os08g36790), and dehydrins (LOC_Os11g26780 and LOC_Os11g26790).
Results using Shuhui and MSU v7 demonstrated that there were more IR64 genes responding to water stress including TFs which were not found in Apo (see Supplementary Discussion and Table S14 for Shuhui).

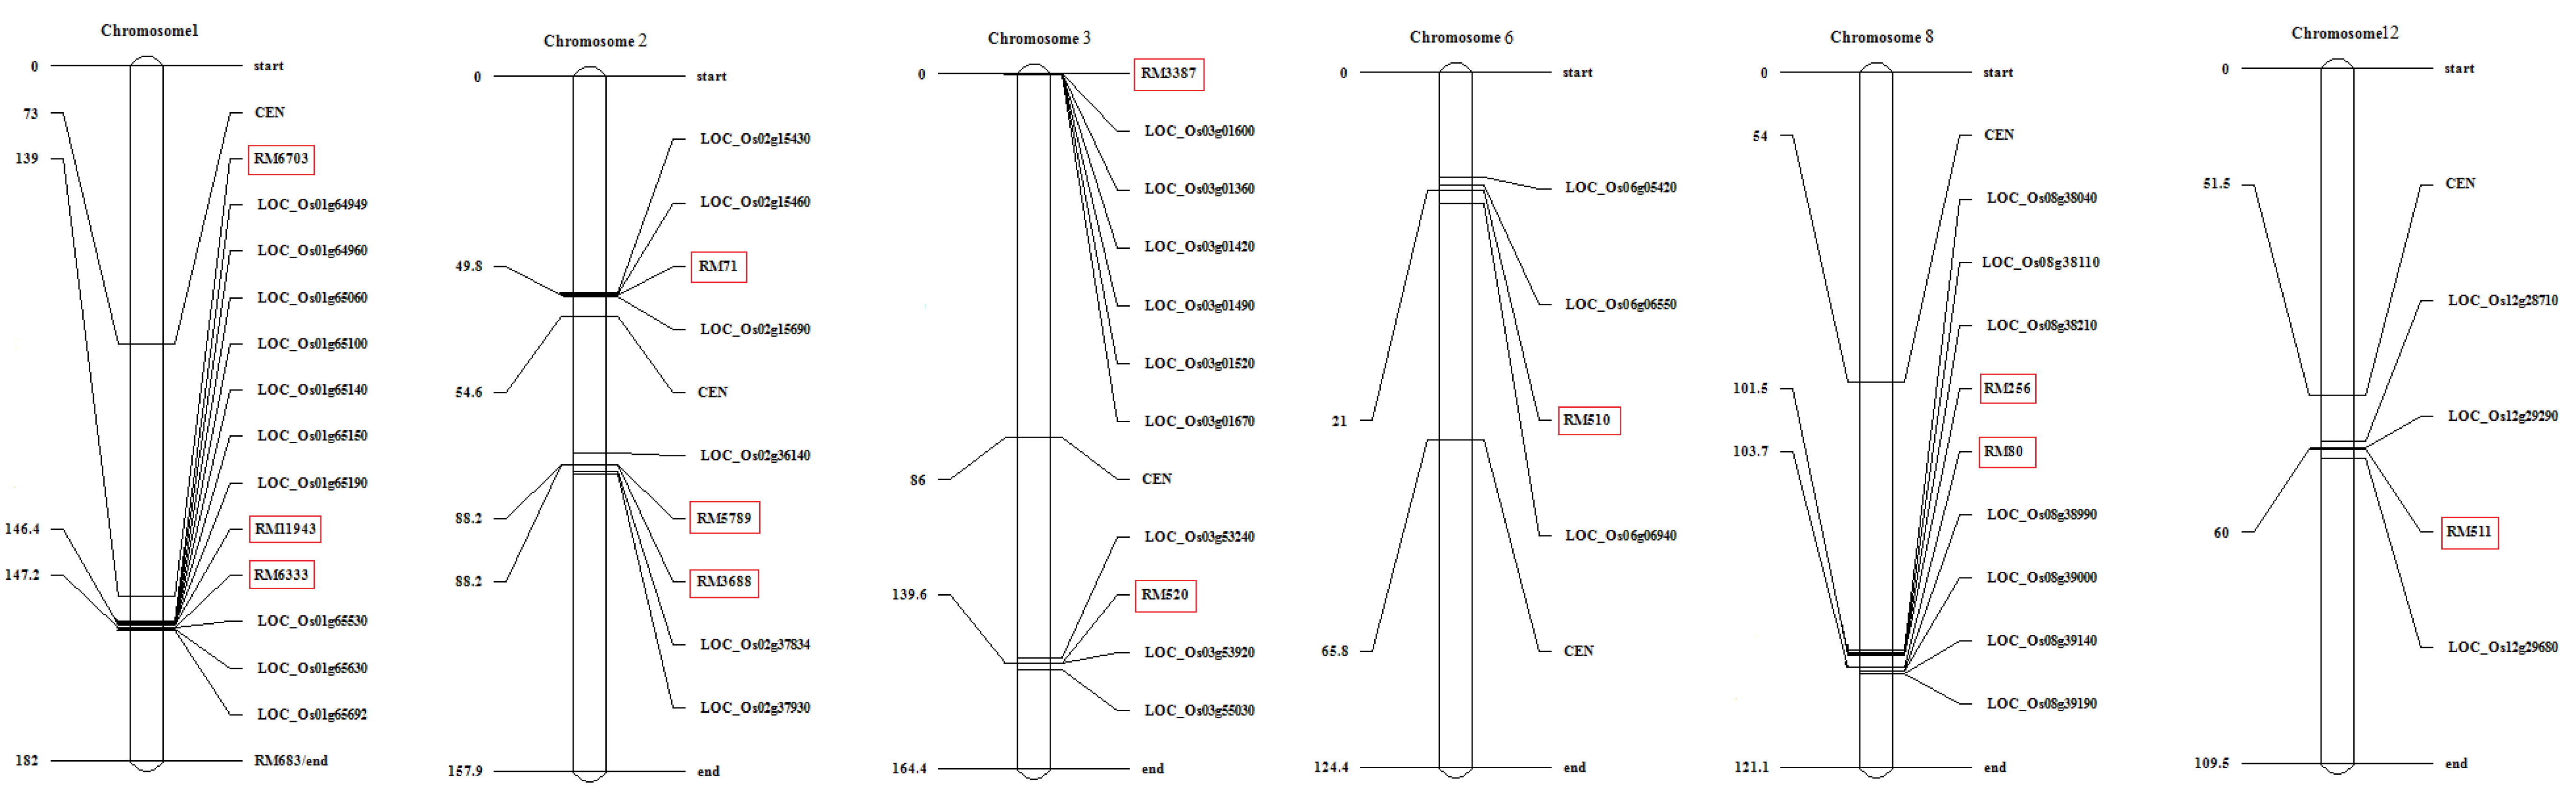
3.6. Several DEGs Co-Localize with Drought-Yield QTLs

In our previous study [41], we identified regions in the rice genome which were associated with a drought response using selective genotyping. These marker regions, along with drought-yield QTLs identified by Venuprasad et al. [12], were co-localized with genes differentially expressed (described above). Interestingly, several genes were found to align with drought-yield QTL regions located in chromosomes 1, 2, 3, 6, 8 and 12 (Figure 8). These genes are, therefore, the most interesting candidates for further studies on drought response in rice.
In chromosome 1, an aggregation of DEGs were found to collocate with markers RM11943/RM6333. This region is also associated with yield under drought in N22/IR64 population [70]. One of the most interesting DEGs in this region encodes for a chlorophyll a/b binding protein (LOC_Os01g64960). Its participation in drought tolerance has been reported in Arabidopsis [71].
A polygalacturonase-encoding gene (LOC_Os02g15690) is closely associated with RM71 in chromosome 2. On the other hand, an aminotransferase (LOC_Os03g01600) and a retrotransposon (LOC_Os03g01670) align with RM3387; a kinesin (LOC_Os03g53920) with RM520, all in chromosome 3.
In chromosome 6, a gene encoding for a protein of unknown function (LOC_Os06g06550) is tightly linked with RM510. On the other hand, a suite of genes are aligned with the marker region RM256/RM80 in chromosome 8, the most interesting of which include transposon (LOC_Os08g38110), transcription factor BIM2 (LOC_Os08g38210), WRKY (LOC_Os08g38990), and heat shock protein (LOC_Os08g39140). Finally, a disease resistance gene (LOC_Os12g29290) co-localizes with RM511 in chromosome 12.
The combination of two approaches—RNA-seq and QTL mapping with co-localization analysis—is a powerful strategy to identify potential segments involved in drought response. Further studies, however, to dissect the participation of these shortlisted candidate genes, including cytochromes, on drought response are highly recommended.

4. Summary and Conclusions

Using RNA-seq, the whole transcript population of IR64 and Apo were sequenced after exposure to two contrasting water regimes. We implemented a bowtie–salmon–bayseq pipeline to identify DEGs. Several filtering parameters were employed to reduce the influence of artifacts on our data analysis. We also showed that using two different transcriptome reference sequences (MSU v7 and Shuhui) can have an impact on the downstream analysis such as the number and variety of identified DEGs. Therefore, decisions on which reference assembly to be used should be taken into consideration for analysis on RNA-seq.
Taken together, our results suggest that IR64 and Apo have varying strategies of dealing with the stress. IR64 demonstrated a more extensive molecular reprogramming, presumably, a more energy-demanding route. Signaling pathways including ABA, jasmonic acid, and ethylene which interact with ROS were shown to be highly activated in IR64. ROS, which accumulates during abiotic stress such as drought conditions, are also responsible for signal transduction, receptor activity and cell signaling which are highly enriched in IR64 but not in Apo. Both genotypes, enabled programmed cell death in order to survive, which may eventually cause yield losses. Apo, on the other hand, showed enhancement of functions associated with oxygen binding and peroxisome pathway. Further studies to dissect these attributes of Apo is highly recommended.
Our results also showed several DEGs aligning with previous studies on drought-yield QTLs. These are most interesting candidates for further investigations on rice improvement on drought tolerance. Further validation procedures using different approaches (besides RNA-seq) are also recommended.

Supplementary Materials

The following are available online at https://www.mdpi.com/2073-4395/10/5/621/s1, SI 1. Commands used for the bioinformatics pipeline; SI 2. Commands used for DE using baySeq (R in Linux); Figure S1. To visualize if normalization procedure was adequate, MA plots with Loess curves were generated between IR64 reps 1 and 2 (left) and between Apo rep 1 and 2 (right). Blue line shows Loess curves; yellow, lines of symmetry at M = 0; Figure S2. MA plots with Loess curves were generated for IR64 control vs IR64 stress (left) and Apo control vs Apo stress (right). Legend similar to Figure S1. Table S1. Percentage alignment rates of the reads mapping to the MSU, IRGSP, and Shuhui mRNA pseudomolecules; Table S2. Complete report of bowtie2 on mapped and unmapped reads using the MSU v7 reference sequence. Table S3. List of DEGs in IR64 exposed under non- and water-stress conditions using MSU v7 as transcriptome reference sequence; Table S4. List of DEGs in Apo exposed under non- and water-stress conditions using MSU v7; Table S5. List of DEGs between IR64 and Apo using Genotypic Differential Expression (GDE) model and MSU v7 as transcriptome reference sequence; Table S6. List of DEGs between IR64 and Apo using Drought Differential Expression (DDE) model and MSU v7 transcriptome reference sequence; Table S7. List of DEGs in IR64 exposed under non- and water-stress conditions using Shuhui as transcriptome reference sequence; Table S8. List of DEGs in Apo exposed under non- and water-stress conditions using Shuhui; Table S9. List of DEGs between IR64 and Apo under non-stress conditions using Shuhui; Table S10. List of DEGs between IR64 and Apo under water-stress conditions using Shuhui; Table S11. List of DEGs between IR64 and Apo using Genotypic Differential Expression (GDE) model and Shuhui as transcriptome reference sequence; Table S12. List of DEGs between IR64 and Apo using Drought Differential Expression (DDE) model and Shuhui as transcriptome reference sequence.

Author Contributions

N.C.E. performed Bioinformatics analysis and wrote the manuscript; L.-y.L. performed statistical analysis and R scripting; A.G. coordinated the work and acquired financial support; W.P. wrote the original proposal, sought project funding and managed the initial part of the study; I.M. undertook critical review of the manuscript and sought financial support; H.L. coordinated the work among IRRI, NIAB and NTU and undertook project management. All authors have read and agreed to the published version of the manuscript.

Funding

Biotechnology and Biological Sciences Research Council: BBSRC: BB/F004265/1.

Acknowledgments

This work was supported in part by a grant from Biotechnology and Biological Sciences Research Council (BBSRC), National Institute of Agricultural Botany (NIAB), and the International Rice Research Institute (IRRI). BBSRC: BB/F004265/1. We thank the Bioinformatics group of the Department of Plant Sciences, University of Cambridge for assisting us in the Bioinformatics analysis.

Availability of Data and Materials

All sequencing data from this work are available at NCBI Sequence Read Archive with a submission entry: SUB1568816 with BioProject ID PRJNA338445.

Conflicts of Interest

The authors declare that they have no competing interests.

References

  1. Li, Z.K.; Xu, J.L. Breeding for drought and salt tolerant rice (Oryza sativa L.): Progress and perspectives. In Advances in Molecular Breeding toward Drought and Salt Tolerant Crops; Jenks, M.A., Hasegawa, P.M., Jain, S.M., Eds.; Springer: Dordrecht, The Netherlands, 2007; pp. 531–564. [Google Scholar]
  2. Pandey, S.; Bhandari, H. Drought: Economic costs and research implications. In Drought Frontiers in Rice: Crop Improvement for Increased Rainfed Production; Bennett, J., Hardy, B., Serraj, R., Eds.; World Scientific Publishing Co. International Rice Research Institute (IRRI): Los Baños, Philippines, 2009; pp. 3–17. [Google Scholar]
  3. IRRI (International Rice Research Institute). IRRI Rice Facts; IRRI (International Rice Research Institute): Los Baños, Philippines, 1995. [Google Scholar]
  4. Sandhu, N.; Jain, S.; Kumar, A.; Mehla, B.S.; Jain, R. Genetic variation, linkage mapping of QTL and correlation studies for yield, root, and agronomic traits for aerobic adaptation. BMC Genet. 2013, 14, 104. [Google Scholar] [CrossRef] [PubMed] [Green Version]
  5. Serraj, R.; McNally, K.L.; Slamet-Loedin, I.; Kohli, A.; Haefele, S.M.; Atlin, G.; Kumar, A. Drought Resistance Improvement in Rice: An Integrated Genetic and Resource Management Strategy. Plant Prod. Sci. 2011, 14, 1–14. [Google Scholar] [CrossRef]
  6. Wang, W.; Mauleon, R.; Hu, Z.; Chebotarov, D.; Tai, S.; Wu, Z.; Li, M.; Zheng, T.; Fuentes, R.R.; Zhang, F.; et al. Genomic variation in 3,010 diverse accessions of Asian cultivated rice. Nature 2018, 557, 43–49. [Google Scholar] [CrossRef] [PubMed]
  7. Rabbani, M.A.; Maruyama, K.; Abe, H.; Khan, M.A.; Katsura, K.; Ito, Y.; Yoshiwara, K.; Seki, M.; Shinozaki, K.; Yamaguchi-Shinozaki, K. Monitoring Expression Profiles of Rice Genes under Cold, Drought, and High-Salinity Stresses and Abscisic Acid Application Using cDNA Microarray and RNA Gel-Blot Analyses. Plant Physiol. 2003, 133, 1755–1767. [Google Scholar] [CrossRef] [PubMed] [Green Version]
  8. Lenka, S.K.; Katiyar, A.; Chinnusamy, V.; Bansal, K.C. Comparative analysis of drought-responsive transcriptome in Indica rice genotypes with contrasting drought tolerance. Plant Biotechnol. J. 2011, 9, 315–327. [Google Scholar] [CrossRef] [PubMed]
  9. Zhou, J.; Wang, X.; Jiao, Y.; Qin, Y.; Liu, X.; He, K.; Chen, C.; Ma, L.; Wang, J.; Xiong, L.; et al. Global genome expression analysis of rice in response to drought and high-salinity stresses in shoot, flag leaf, and panicle. Plant Mol. Biol. 2007, 63, 591–608. [Google Scholar] [CrossRef] [Green Version]
  10. Xu, J.L.; Lafitte, H.R.; Gao, Y.M.; Fu, B.Y.; Torres, R.; Li, Z.K. QTLs for drought escape and tolerance identified in a set of random introgression lines of rice. Theor. Appl. Genet. 2005, 111, 1642–1650. [Google Scholar] [CrossRef]
  11. Bernier, J.; Kumar, A.; Venuprasad, R.; Spaner, D.; Atlin, G.N. A large-effect QTL for grain yield under reproductive stage drought stress in upland rice. Crop Sci. 2007, 47, 505–516. [Google Scholar] [CrossRef]
  12. Venuprasad, R.; Dalid, C.O.; Del Valle, M.; Zhao, D.; Espiritu, M.; Cruz, M.S.; Amante, M.; Kumar, A.; Atlin, G.N. Identification and characterization of large-effect quantitative trait loci for grain yield under lowland drought stress in rice using bulk-segregant analysis. Theor. Appl. Genet. 2009, 120, 177–190. [Google Scholar] [CrossRef]
  13. Liu, G.; Mei, H.; Liu, H.; Yu, X.; Zou, G.; Luo, L. Sensitivities of rice grain yield and other panicle characters to late-stage drought stress revealed by phenotypic correlation and QTL analysis. Mol. Breed. 2010, 25, 603–613. [Google Scholar] [CrossRef]
  14. Gomez, S.M.; Boopathi, N.M.; Kumar, S.S.; Ramasubramanian, T.; Chengsong, Z.; Jeyaprakash, P.; Senthil, A.; Babu, R.C. Molecular mapping and location of QTLs for drought-resistance traits in indica rice (Oryza sativa L.) lines adapted to target environments. Acta Physiol. Plant. 2010, 32, 355–364. [Google Scholar] [CrossRef]
  15. Kamoshita, A.; Babu, R.C.; Boopathi, N.M.; Fukai, S. Phenotypic and genotypic analysis of drought-resistance traits for development of rice cultivars adapted to rainfed environments. Field Crops Res. 2008, 109, 1–23. [Google Scholar] [CrossRef]
  16. Guo, Z.; Yang, W.; Chang, Y.; Ma, X.; Tu, H.; Xiong, F.; Jiang, N.; Feng, H.; Huang, C.; Yang, P.; et al. Genome-Wide Association Studies of Image Traits Reveal Genetic Architecture of Drought Resistance in Rice. Mol. Plant 2018, 11, 789–805. [Google Scholar] [CrossRef] [PubMed] [Green Version]
  17. Atlin, G.N.; Laza, M.; Amante, M.; Lafitte, H.R. Agronomic performance of tropical aerobic, irrigated and traditional upland rice varieties in three hydrological environments at IRRI. In 4th International Crop Science Congress: New Directions for a Diverse Planet; Fischer, T., Turner, N., Eds.; Regional Institute, Limited: Brisbane, Australia, 2004. [Google Scholar]
  18. Zhang, J.; Chen, L.L.; Xing, F.; Kudrna, D.A.; Yao, W.; Copetti, D.; Mu, T.; Li, W.; Song, J.M.; Xie, W.; et al. Extensive sequence divergence between the reference genomes of two elite indica rice varieties Zhenshan 97 and Minghui 63. PNAS 2016, 113, E5163–E5171. [Google Scholar] [CrossRef] [Green Version]
  19. Hardcastle, T.J.; Kelly, K.A. baySeq: Empirical Bayesian methods for identifying differential expression in sequence count data. BMC Bioinform. 2010, 11, 422. [Google Scholar] [CrossRef] [Green Version]
  20. Hardcastle, T.J. Advanced Analysis Using baySeq; Generic Distribution Definitions (Vignette). 2017. Available online: https://www.bioconductor.org (accessed on 31 May 2017).
  21. Cal, A.J.; Liu, D.; Mauleon, R.; Hsing, Y.C.; Serraj, R. Transcriptome profiling of leaf elongation zone under drought in contrasting rice cultivars. PLoS ONE 2013, 8, e54537. [Google Scholar] [CrossRef]
  22. Serraj, R.; Dongcheng, L.; Hong, H.; Sellamuthu, R.; Impa, S.; Cairns, J.; Dimayuga, G.; Torres, R. Novel Approaches for Integration of Physiology, Genomics and Breeding for Drought Resistance Improvement in Rice. 2014. Available online: http://www.intlcss.org/ (accessed on 30 June 2016).
  23. Sinclair, T.; Ludlow, M. Influence of soil water supply on the plant water balance of four tropical grain legumes. Funct. Plant Biol. 1986, 13, 329. [Google Scholar] [CrossRef]
  24. Rice Plant Biology. Available online: http://rice.plantbiology.msu.edu/ (accessed on 25 May 2017).
  25. Gordon, A. FASTX-Toolkit: FASTQ/A Short-Reads Pre-Processing Tools. 2009. Available online: http://hannonlab.cshl.edu/fastx_toolkit/ (accessed on 30 June 2017).
  26. Li, H.; Handsaker, B.; Wysoker, A.; Fennell, T.; Ruan, J.; Homer, N.; Marth, G.; Abecasis, G.; Durbin, R. The sequence alignment/Map format and SAMtools. Bioinformatics 2009, 25, 2078–2079. [Google Scholar] [CrossRef] [Green Version]
  27. Patro, R.; Duggal, G.; Love, M.I.; Irizarry, R.A.; Kingsford, C. Salmon provides fast and bias-aware quantification of transcript expression. Nat. Methods 2017, 14, 417–419. [Google Scholar] [CrossRef] [Green Version]
  28. R Core Team. R: A Language and Environment for Statistical Computing; R Foundation for Statistical Computing: Vienna, Austria, 2019. [Google Scholar]
  29. Robinson, M.D.; Oshlack, A. A scaling normalization method for differential expression analysis of RNA-seq data. Genome Biol. Method 2010, 11, R25. [Google Scholar] [CrossRef] [PubMed] [Green Version]
  30. Guo, Y.; Sheng, Q.; Li, J.; Ye, F.; Samuels, D.C.; Shyr, Y. Large Scale Comparison of Gene Expression Levels by Microarrays and RNAseq Using TCGA Data. PLoS ONE 2013. [Google Scholar] [CrossRef] [PubMed] [Green Version]
  31. Siska, C.; Kechris, K. Differential correlation for sequencing data. BMC Res. Notes 2017, 10, 54. [Google Scholar] [CrossRef] [PubMed] [Green Version]
  32. Hardcastle, T.J. baySeq: Empirical Bayesian Analysis of Patterns of Differential Expression in Count Data (Vignette). 2017. Available online: https://www.bioconductor.org/ (accessed on 31 May 2017).
  33. Benjamini, Y.; Hochberg, Y. Controlling the false discovery rate: A practical and powerful approach to multiple testing. J. R. Stat. Soc. Ser. B Stat. Methodol. 1995, 57, 289–300. [Google Scholar] [CrossRef]
  34. Chandra, S.; Singh, D.; Pathak, J.; Kumari, S.; Kumar, M.; Poddar, R.; Balyan, H.S.; Gupta, P.K.; Prabhu, K.V.; Mukhopadhyay, K. De Novo Assembled Wheat Transcriptomes Delineate Differentially Expressed Host Genes in Response to Leaf Rust Infection. PLoS ONE 2016, 11, e0148453. [Google Scholar] [CrossRef] [PubMed]
  35. Tian, T.; Liu, Y.; Yan, H.; You, Q.; Yi, X.; Du, Z.; Xu, W.; Su, Z. agriGO v2.0: A GO analysis toolkit for the agricultural community, 2017 update. Nucleic Acids Res. 2017, 45, W122–W129. [Google Scholar] [CrossRef]
  36. Du, Z.; Zhou, X.; Ling, Y.; Zhang, Z.; Su, Z. agriGO: A GO analysis toolkit for the agricultural community. Nucleic Acids Res. 2010, 38, W64–W70. [Google Scholar] [CrossRef] [PubMed] [Green Version]
  37. AgriGO. Available online: http://systemsbiology.cau.edu.cn/agriGOv2/ (accessed on 31 July 2017).
  38. Heberle, H.; Meirelles, G.V.; da Silva, F.R.; Telles, G.P.; Minghim, R. InteractiVenn: A web-based tool for the analysis of sets through Venn diagrams. BMC Bioinform. 2015, 16, 169. [Google Scholar] [CrossRef]
  39. Kanehisa, M.; Goto, S. KEGG: Kyoto Encyclopedia of Genes and Genomes. Nucleic Acids Res. 2000, 28, 27–30. [Google Scholar] [CrossRef]
  40. KEGG. Available online: https://www.genome.jp/kaas-bin/ (accessed on 31 March 2020).
  41. Ereful, N.C.; Liu, L.Y.; Tsai, E.; Kao, S.M.; Dixit, S.; Mauleon, R.; Malabanan, K.; Thomson, M.; Laurena, A.; Lee, D.; et al. Analysis of Allelic Imbalance in Rice Hybrids Under Water Stress and Association of Asymmetrically Expressed Genes with Drought-Response QTLs. Rice 2016, 9, 50. [Google Scholar] [CrossRef] [Green Version]
  42. Plants Ensembl. Available online: http://plants.ensembl.org (accessed on 31 August 2017).
  43. Temnykh, S.; Park, W.D.; Ayres, N.; Cartinhour, S.; Hauck, N.; Lipovich, L.; Cho, Y.G.; Ishii, T.; McCouch, S.R. Mapping and genome organization of microsatellite sequences in rice (Oryza sativa L.). Theor. Appl. Genet. 2000, 100, 697–712. [Google Scholar] [CrossRef]
  44. Meng, L.; Li, H.; Zhang, L.; Wang, J. QTL IciMapping: Integrated software for genetic linkage map construction and quantitative trait locus mapping in biparental populations. Crop J. 2015, 3, 269–283. [Google Scholar] [CrossRef] [Green Version]
  45. Wade, L.J.; McLaren, C.G.; Quintana, L.; Harnpichitvitaya, D.; Rajatasereekul, S.; Sarawgi, A.K.; Kumar, A.; Ahmed, H.U.; Singh, A.K.; Rodriguez, R.; et al. Genotype by environment interactions across diverse rainfed lowland rice environments. Field Crops Res. 1999, 64, 35–50. [Google Scholar] [CrossRef]
  46. Lafitte, H.R.; Courtois, B.; Arraudeau, M. Genetic improvement of rice in aerobic systems: Progress from yield to genes. Field Crops Res. 2002, 75, 171–190. [Google Scholar] [CrossRef]
  47. Hsiao, T.C. The soil plant atmosphere continuum in relation to drought and crop production. In Drought Resistance in Crops with Emphasis on Rice; International Rice Research Institute: Los Baños, Philippines, 1982; pp. 39–52. [Google Scholar]
  48. O’Toole, J.C. Adaptation of rice to drought-prone environments. In Drought Resistance in Crops with Emphasis on Rice; International Rice Research Institute: Los Baños, Philippines, 1982; pp. 195–213. [Google Scholar]
  49. Yu, J.; Hu, S.; Wang, J.; Wong, G.K.; Li, S.; Liu, B.; Deng, Y.; Dai, L.; Zhou, Y.; Zhang, X.; et al. A draft sequence of the rice genome (Oryza sativa L. ssp. indica). Science 2002, 296, 79–92. [Google Scholar] [CrossRef]
  50. Du, H.; Yu, Y.; Ma, Y.; Gao, Q.; Cao, Y.; Chen, Z.; Ma, B.; Qi, M.; Li, Y.; Zhao, X.; et al. Sequencing and de novo assembly of a near complete indica rice genome. Nat. Commun. 2017. [Google Scholar] [CrossRef]
  51. Goff, S.A.; Ricke, D.; Lan, T.H.; Presting, G.; Wang, R.; Dunn, M.; Glazebrook, J.; Sessions, A.; Oeller, P.; Varma, H.; et al. A Draft Sequence of the Rice Genome (Oryza sativa L. ssp. Japonica). Science 2002, 296, 92–100. [Google Scholar] [CrossRef] [Green Version]
  52. International Rice Genome Sequencing Project. The map-based sequence of the rice genome. Nature 2005, 436, 11. [Google Scholar] [CrossRef]
  53. Langmead, B.; Salzberg, S. Fast gapped-read alignment with Bowtie 2. Nat. Methods 2012, 9, 357–359. [Google Scholar] [CrossRef] [Green Version]
  54. Ereful, N.C.; Liu, L.Y.; Kao, S.M.; Tsai, E.; Laurena, A.; Thomson, M.; Greenland, A.; Powell, W.; Mackay, I.; Leung, H. cis dominantly explains regulatory divergence between two indica rice genotypes; drought further enhances regulatory differences. bioRxiv 2019. [Google Scholar] [CrossRef]
  55. Dudoit, S.; Yang, Y.H.; Callow, M.J.; Speed, T.P. Statistical methods for identifying genes with DE in replicated cDNA microarray experiments. Stat. Sin. 2002, 12, 111–139. [Google Scholar]
  56. Cleveland, W.S.; Devlin, S.J.; Grosse, E. Regression by Local Fitting. J. Econom. 1988, 37, 87–114. [Google Scholar] [CrossRef]
  57. Cleveland, W.S.; Grosse, E. Computational Methods for Local Regression. Stat. Comput. 1991, 1, 47–62. [Google Scholar] [CrossRef]
  58. Cheng, X.; Gou, X.; Yin, H.; Mysore, K.S.; Li, J.; Wen, J. Functional characterisation of brassinosteroid receptor MtBRI1 in Medicago truncatula. Sci. Rep. 2017, 7, 9327. [Google Scholar] [CrossRef] [PubMed] [Green Version]
  59. Joshi, R.; Wani, S.H.; Singh, B.; Bohra, A.; Dar, Z.A.; Lone, A.A.; Pareek, A.; Singla-Pareek, S.L. Transcription Factors and Plants Response to Drought Stress: Current Understanding and Future Directions. Front. Plant Sci. 2016, 7, 1029. [Google Scholar] [CrossRef] [Green Version]
  60. Kosová, K.; Vítámvás, P.; Prášil, I.T. Wheat and barley dehydrins under cold, drought, and salinity—What can LEA-II proteins tell us about plant stress response? Front. Plant Sci. 2014, 5. [Google Scholar] [CrossRef] [Green Version]
  61. Yang, Z.; Dai, Z.; Lu, R.; Wu, B.; Tang, Q.; Xu, Y.; Cheng, C.; Su, J. Transcriptome Analysis of Two Species of Jute in Response to Polyethylene Glycol (PEG)-induced Drought Stress. Sci. Rep. 2017, 7, 16565. [Google Scholar] [CrossRef] [Green Version]
  62. Duan, F.; Ding, J.; Lee, D.; Lu, X.; Feng, Y.; Song, W. Overexpression of SoCYP85A1, a Spinach Cytochrome p450 Gene in Transgenic Tobacco Enhances Root Development and Drought Stress Tolerance. Front. Plant Sci. 2017, 9, 8. [Google Scholar] [CrossRef] [Green Version]
  63. De Carvalho, M.H.C. Drought stress and reactive oxygen species: Production, scavenging and signalling. Plant Signal. Behav. 2008, 3, 156–165. [Google Scholar] [CrossRef] [Green Version]
  64. Sharma, A.; Shahzad, B.; Rehman, A.; Bhardwaj, R.; Landi, M.; Zheng, B. Response of Phenylpropanoid Pathway and the Role of Polyphenols in Plants under Abiotic Stress. Molecules 2019, 24, 2452. [Google Scholar] [CrossRef] [Green Version]
  65. Su, T.; Li, W.; Wang, P.; Ma, C. Dynamics of Peroxisome Homeostasis and Its Role in Stress Response and Signaling in Plants. Front. Plant Sci. 2019, 10, 705. [Google Scholar] [CrossRef] [Green Version]
  66. Ullah, A.; Manghwar, H.; Shaban, M.; Khan, A.H.; Akbar, A.; Ali, U.; Ali, E.; Fahad, S. Phytohormones enhanced drought tolerance in plants: A coping strategy. Environ. Sci. Pollut. Res. 2018, 25, 33103–33118. [Google Scholar] [CrossRef] [PubMed]
  67. Landi, S.; Hausman, J.F.; Guerriero, G.; Esposito, S. Poaceae vs. Abiotic Stress: Focus on Drought and Salt Stress, Recent Insights and Perspectives. Front. Plant Sci. 2017, 8, 1214. [Google Scholar] [CrossRef] [PubMed] [Green Version]
  68. Zhang, X.; Liu, X.; Zhang, D.; Tang, H.; Sun, B.; Li, C.; Hao, L.; Liu, C.; Li, Y.; Shi, Y.; et al. Genome-wide identification of gene expression in contrasting maize inbred lines under field drought conditions reveals the significance of transcription factors in drought tolerance. PLoS ONE 2017, 12, e0179477. [Google Scholar] [CrossRef] [PubMed] [Green Version]
  69. Gramene. Available online: www.archive.grameme.org (accessed on 31 March 2017).
  70. Vikram, P.K.; Swamy, M.; Dixit, S.; Uddin, A.H.; Cruz, M.T.; Singh, A.K.; Kumar, A. qDTY 1.1.; a major QTL for rice grain yield under reproductive-stage drought stress with a consistent effect in multiple elite genetic backgrounds. BMC Genet. 2011, 12, 89. [Google Scholar] [CrossRef] [Green Version]
  71. Xu, Y.H.; Liu, R.; Yan, L.; Liu, Z.Q.; Jiang, S.C.; Shen, Y.Y.; Wang, X.F.; Zhang, D.P. Light-harvesting chlorophyll a/b-binding proteins are required for stomatal response to abscisic acid in Arabidopsis. J. Exp. Bot. 2012, 63, 1095–1106. [Google Scholar] [CrossRef] [Green Version]
Figure 1. Using large pots, rice plants inside the IRRI phytotron were exposed to either well-watered or water-stressed conditions. Inset: punctured conical tubes served as feeder pipes on each pot to deposit water.
Agronomy 10 00621 g001
Figure 2. Matrix indicating Spearman’s coefficient of correlations among sample replicates using normalized read counts. (Legend: I, IR64; A, Apo; C, control or non-stress; S, water-stress treatment. Numbers succeeding each letter indicates replicate number. Bottom figure shows color scale bar).
Agronomy 10 00621 g002
Figure 3. (a) Number of up- and down-regulated genes in each genotype. IR64, a relatively drought-susceptible cultivar induces and suppresses a wider number of genes as compared to Apo. (b) Analysis of DE showed that there are 170 and 4 genes differentially expressed in IR64 and Apo, respectively. Three of these genes were found to be commonly differentially expressed and are all up-regulated in both cultivars.
Agronomy 10 00621 g003
Figure 4. Graphical representation of GO enrichment analysis of up-regulated genes associated with biological process in Apo (a) and IR64 (b).
Agronomy 10 00621 g004
Figure 5. Graphical representation of GO enrichment analysis in up-regulated genes associated with molecular functions in Apo (a) and IR64 (b).
Agronomy 10 00621 g005
Figure 6. Summary of the number of genes enriched in each GO term for both IR64 and Apo using GDE or genotype differential expression model (at FDR < 0.05). (No genes were enriched in cellular components).
Agronomy 10 00621 g006
Figure 7. Central pie chart: number of up-regulated genes in each group in the three-way DE, drought differential expression (DDE) model. Notably, a huge proportion of genes are induced in IR64 under stress conditions. Also included are graphical representations of GO enrichment analysis of genes up-regulated in IR64 under stress condition (left) and IR64 and Apo under non-stress treatment (right).
Agronomy 10 00621 g007
Figure 8. Several DEGs were found to co-localize with QTL marker regions (boxed in red) identified to participate in drought-yield response in the same bi-parental population background (IR64/Apo) [12,41]. Markers and genes are said to co-localize if their estimated distance is less than 240 kb, the estimated equivalent of 1 cM. (CEN, centromere. Map was generated using ICIMapping [44]. Positions of markers were estimated based on Cornell and IRMI SSR map at www.archive.grameme.org [69]. Chromosome length not drawn to scale).
Agronomy 10 00621 g008
Table 1. Number of reads generated from each sample replicate from both IR64 and Apo and their overall alignment rates against the MSU v7.
TreatmentGenotypeRep 1Rep 2
Number of Reads% Overall Alignment RatesNumber of Reads% Overall Alignment Rates
Control
(Non-stressed)
APO16,037,80082.7726,626,25689.69
IR6416,083,45683.7225,871,13683.73
StressedAPO13,338,98084.4426,821,17589.49
IR6413,255,34071.4627,709,00076.82
Total 58,715,576 107,027,567

