Article

A Hypothetical Extraction Method Decomposition of Intersectoral and Interprovincial CO2 Emission Linkages of China’s Construction Industry

by
Adedayo Johnson Ogungbile
1,*,
Geoffrey Qiping Shen
1,
Jin Xue
1 and
Tobi Michael Alabi
2,3
1
Department of Building and Real Estate, The Hong Kong Polytechnic University, Hong Kong
2
Renewable Energy Research Group (RERG), Department of Building Environment and Energy Engineering, The Hong Kong Polytechnic University, Hong Kong
3
Department of Mechanical and Energy Engineering, Southern University of Science and Technology, Shenzhen 518055, China
*
Author to whom correspondence should be addressed.
Sustainability 2021, 13(24), 13917; https://doi.org/10.3390/su132413917
Submission received: 3 November 2021 / Revised: 7 December 2021 / Accepted: 13 December 2021 / Published: 16 December 2021
(This article belongs to the Topic Climate Change and Environmental Sustainability)

Abstract

:
Understanding the complex CO2 emissions in inter-sectoral and interregional interactions of the construction industry is significant to attaining sustainability in China. Many previous studies focused on aggregating the construction sector’s CO2 emissions on a national level, with the provincial characteristics and interactions often overlooked. Using extended environmental input–output tables, we adopted a hypothetical extraction method combined with extended-environmental multi-regional input–output tables for 2012, 2015, and 2017 data to decompose the CO2 emissions linkages in 30 provincial construction sectors. The provincial carbon emissions data from a complete system boundary informed the recategorization of China’s construction sector as a high-carbon-intensity industry. The interprovincial interactions results show relatively small backward CO2 emissions linkages compared to forward CO2 emissions linkages depicting the industry’s significant role in China’s economic growth and an essential target in CO2 emissions reduction plans. The provinces exhibited different impacts on the directional push–pull, with less developed provinces having one-way directional effects. The more developed provincial sectors behaved more like demand-driven industries creating an overall imbalance in CO2 emissions interaction between the sectors in interregional emission trades. We identified construction sectors in Gansu, Xingjian, Ningxia, and Inner Mongolia as the most critical, with more significant CO2 emissions interactions than other provinces. Improving the technical level in less developed provincial construction sectors, considering provincial characteristics in policy formulation, and a swift shift to renewable energy as a primary energy source would aid in reducing the emissions intensities in the construction sector, especially in the less developed provinces, and achieving China’s quest to reach a CO2 emissions peak by 2030.

1. Introduction

In recent times, one of the greatest battles of humankind is combating the changing climate believed to be a result of man’s industrial activities over the past century [1]. The United Nations Intergovernmental Panel on Climate Change (IPCC) warned that the irreversible worst impacts of climate change could be felt in 2030 if drastic and decisive actions are not taken in the coming years [2]. The effects of climate change are not only felt by humans as more than one million species are endangered due to global warming [3]. According to Wen and Li [4], CO2 is the most prominent of all the six greenhouse gases due to its global warming potentials, and as such, it is of more importance [5,6].
In 2007, China became the most significant CO2 emitting nation [7]. Pressure on China to reduce CO2 emissions caused the government to set a 17% CO2 intensity reduction plan in its “12th Five-Year Plan” (2011–2015) to cut carbon emissions across provinces [8]. According to Shen et al. [9], the construction sectors in the Chinese provinces are significant drivers of CO2 emissions in China. The industry contributed about 79.72 Mt of energy-related CO2 emissions in 2010, as Lin and Liu [10] reported. Chen and Zhang [11] affirmed that the Chinese construction sector is responsible for the most significant amount of the global construction sector’s total CO2 emissions, which Huang et al. [12] quantified to be 60% of global construction-related CO2.
The Chinese construction sector is a significant part of the China industrialization story, with a market value of USD 1049 billion in 2020 [13]. The large construction industry in China is categorized as a high-energy-consumption and carbon-emitting sector [14,15]. The continued growth of the Chinese construction industry has made it the most prominent construction sector globally and correspondingly it is regarded as one of the biggest contributors to China’s national CO2 emissions [16]. The industry had a share of 22.5–33.4% of total Chinese CO2 emissions in 2016 [17]. The CO2 emissions from the sector result from interdependent economic trade routes with other sectors within and outside the national economic structure [18]. Khanal et al. [19] described these interdependencies in supply chains of different sectors’ buying and selling as industrial linkages. Over the years, these industrial linkages in China’s construction sector have received less attention [20]. The few studies on carbon linkages in the sector are also limited in scope and methodology [14]. Guo, Zhang, and Meng [7] described the multi-regional input–output (MRIO) approach as a practical analysis tool to understand the complex relationship between different sectors within and outside a national economic sphere.
Some previous studies have combined MRIO analysis with life cycle analysis (LCA) [21], structural path analysis (SPA) [22], and structural decomposition analysis (SDA) [23], to analyze the Chinese construction sectors’ CO2 emission potentials. Hypothetical extraction methods (HEM) have also been adopted in a few studies to assess CO2 emissions on the national aggregated level [14,24]. Aggregating CO2 emissions at only the national level indicates a vague and incomplete decomposition analysis and the importance of provincial and project-contributing emission tendencies [25]. HEM adoption in the provincial construction sector’s CO2 emissions analysis is yet to be thoroughly analyzed. The HEM approach presents a better understanding of the pull and push effects in regional and inter-regional demand and the upstream supply chain [26].
Therefore, using a robust HEM model at the sectoral and provincial levels, this study expounds the complex CO2 emission linkages of the Chinese construction sector and other sectors of the Chinese economy spectrum. The paper adopts an MRIO approach combined with the HEM model to decompose CO2 emissions linkages of 30 provincial construction sectors of China and determine the CO2 emissions push and pull effects on other sectors within and outside their provinces. In addition, the directional paths of the CO2 emissions in the provincial construction sectors in terms of their origins and eventual destinations are further analyzed using a multi-level decomposition order. The study aims to inform relevant stakeholders and policymakers to understand the complex nature of CO2 emissions in the Chinese construction sector and create informed policies to further align with China’s CO2 emissions reduction plan.
The study highlights the importance of identifying the CO2 emissions trade patterns in China’s 30 provincial construction sectors. First, the paper utilizes the concept of HEM to recategorize the construction industry’s CO2 emissions intensities at the national decomposition level. The paper quantifies the total CO2 emissions linkages at the industry’s national and individual provincial levels through the modified HEM. The effects of provincial population density on CO2 emissions linkages are also discussed. Second, the modified HEM second-order decomposition of CO2 emissions is used to identify the critical provincial construction sectors contributing the most to the national CO2 emissions profile. Third, the paper traces the directional usage and sources of transferred CO2 emissions in each of the 30 provincial construction sectors decomposed to determine the extent of dependence on other provinces, with corresponding CO2 emissions policy reduction strategies proposed.
The paper is organized in the following sections. Section 2 synthesizes past and relevant literature to establish the paper’s premise and methodology choice. Section 3 extensively discusses the HEM methodology used in the paper. The data sources and empirical results of the study are presented in Section 4 of the article. Section 5 discusses the results and policy implications. Section 6 summarizes the paper.

2. Literature Review

The nature of complexities in the construction industry’s trade with other sectors within the same or external economic structure has been analyzed using many computational and systematic approaches. One approach that has stood out is using the input–output tables to analyze the inter-sectoral and inter-regional transactions [27,28,29]. Many methods have been adopted to analyze previous studies’ sectoral trade interactions using input–output tables [30,31]. Hong et al. [32] identified MRIO tables as a more effective tool to decompose relationships among intermediates and final demands of different sectors within a complex economic structure like China. MRIO identifies economic flows and embodied CO2 emissions in consumption, production, and exports between regions or countries [20].
In energy and emissions studies, MRIO analysis is widely used to analyze trade-related embodied energy consumption [23], GHG emissions [33], particularly CO2 emissions [14,34], water footprint [35], and other environmental issues [36]. Many tools are combined with MRIO analysis to decompose CO2 emissions in international trade interactions [37]. Some of these approaches include the combination of structural path analysis (SPA) [38,39], HEM [40], structural decomposition analysis (SDA) [41], and indexed decomposition analysis (IDA) [29]. However, HEM is widely used for research based on industrial linkages and investigating the corresponding effects one sector has over the others within the whole economic structure.
In recent studies, Zhang, Liu, Du, Liu, and Wang [14] adopted HEM to analyze CO2 emissions linkages of global construction sectors. Zhang, Liu, Du, Liu, Li, and Wang [20] examined the international trends of carbon linkages in the global construction sectors. Zhao, Zhang, Wang, Zhang, and Liu [40] investigated sectoral CO2 emissions linkages in South Africa. HEM traditionally is based on an assumption of extracting an economic sector from an entire economic structure, meaning the industry has no interaction in trade with other sectors within the same economic system. Conclusions are reached by comparing the sectoral linkages before and after the extraction [42,43]. Duarte, Sánchez-Chóliz, and Bielsa [35] extended HEM to include backward and forward linkages measuring the direction of effects of the extracted sector’s connections in the economic system.
Many studies used HEM to identify CO2 emissions sectoral linkages among different sectors at inter-regional levels in China [4,24]. However, these studies failed to decompose the construction sector’s CO2 emissions linkages at the various regional levels and in inter-regional trade. The characteristics of the construction sectors in all of China’s provinces varies with different industrial developmental stages [44,45]. With different industrial structures, demands, and consumption patterns, it is appropriate to treat each province different to fully understand the underlying CO2 emissions interactions with other sectors within and outside the province [45,46]. Therefore, this study investigates the Chinese construction sector’s CO2 emissions linkages beyond the national level. The study’s contribution in investigating CO2 emissions at provincial levels in China’s construction sector is to provide informed positions for proper localized policies considering the distinctive characteristics of provincial construction and internal and external trade activities [47]. Jia et al. [48] identified the need to be sector-focused in CO2 emissions studies in China and the importance of introducing provincial context into studies. Li and Chen [49] further identified the need to give provincial context to CO2 emissions studies in China because of the intricacies of economic policy-making required to achieve carbon neutrality. Therefore, we recognized the need to extensively study internal and external CO2 emissions interactions of China’s provincial construction sectors. This paper identifies the total CO2 emissions linkages in 30 provincial construction sectors, with the further decomposition of the linkages in directional effects, sources, and destinations in intra-regional and inter-regional decompositions.

3. Methodology

3.1. Multi-Regional Extended IO (MRE-IO) Table

The MRE-IO table in this paper was prepared from both economic (MRIO tables) and emission data, including the emission intensity of each aggregated block of the Chinese economy, as illustrated in Table 1. The input–output model follows the conventional IO model [50] of each economic sector’s total sectoral output, final demand, and technical coefficients.
T = A T + F
where T represents the total sectoral output vector; A = ( a i j ) = u i j / T i j , which is the technical coefficient sectoral inputs of i to produce per unit output in another sector j divided by the total sectoral output of i ; and F = i = 1 5 F i , which is the summation of the five final demand categories of i in the dataset. F is a column vector [51]. Equation (2) is a derivative from Equation (1) to reflect the Leontief inverse matrix.
T = ( I A ) 1 F
where ( I A ) 1 F is the Leontief inverse matrix with I as the identity matrix of the model.

3.2. Total and Direct CO2 Emission Intensities

The ’blocks’ of total and direct CO2 emissions were calculated using the MRE-IO table in Table 1. The direct CO2 emission intensities of each block were calculated as a ratio of total sectoral CO2 emissions and total sectoral output:
e i r = C i r T i r ,   i = 1 , 2 , , n
where e i r is the direct emission intensity for region i in country r . C i r is the total CO2 emission of sector i in country r . T i r is the total output of block i in country r . r represents a region in the national economic data, and i is the region of r . The total CO2 emission intensities of the blocks q i r , indicating the CO2 emission intensities of the whole economic structure of each block, were calculated by the multiplication of the Leontief inverse matrix by the direct CO2 emission intensities, e i r , of the blocks.
q = e ( I A ) 1
Therefore, the total CO2 emissions for each sector are expressed in terms of the Leontief inverse matrix in (5):
C = e T = e ( I A ) 1 F = H F
where H = e ( I A ) 1 F is the matrix of both direct and indirect CO2 sectoral emissions intensities of the MRE-IO economic model.

3.3. HEM Analysis of Critical CO2 Emission Paths of Construction Industry

This paper adopted the HEM methodology from Zhao, Zhang, Wang, Zhang, and Liu [40]. The HEM foundation assumes the MRE-IO tables to be categorized into two blocks of similar energy use, consumption, or industrial type [52]. This paper organized the Chinese economic structure into two blocks, namely block Hc and block H−c. The categorization was made based on industrial types. Construction industries in the provinces were categorized into block Hc, while other industrial types were classified into block H−c. Therefore, Equation (6) represents the matrix expression of the economic structure as:
H = [ H c , c H c , c   H c , c   H c , c ]
With the modified economic structure in Equation (6), we calculated the total CO2 emissions linkages for the economic system thus:
[ C c C c ] = [ e c 0   0 e c ] [ T c T c ] = [ H c , c H c , c   H c , c   H c , c ] [ F c F c ]
Expansively, following Equation (5), the total CO2 emissions can be expressed as:
[ C c C c ] = [ e c 0   0 e c ] ( [ A c , c A c , c   A c , c   A c , c ] [ T c T c ] + [ F c F c ] ) = [ e c 0   0 e c ] [ Δ c , c Δ c , c   Δ c , c   Δ c , c ] [ F c F c ]
where [ Δ c , c Δ c , c   Δ c , c   Δ c , c ] is the Leontief inverse matrix ( I A ) 1 ; [ e c 0   0 e c ] is the diagonal matrix of the direct CO2 emission intensities; and [ A c , c A c , c   A c , c   A c , c ] represents the technical coefficients matrix of direct consumption in the economic sectors.

3.4. Sectoral Extraction of CO2 Emissions Critical Paths

Following the model description of the HEM methodology in Cella [43], an extracted sector i from the categorized block Hc is considered to be self-existing within the block; i.e., it does not trade with other sectors in the same categorized block. The assumption implies that the direct technical coefficients of the intermediate consumption relationship are nonexistent [53]; therefore, we set them to zero (0). Consequently, we expressed the total CO2 emissions from the extracted economic system as:
[ C c * C c * ] = [ e c 0   0 e c ] [ T c * T c * ] = [ e c 0   0 e c ] ( [ A c , c 0   0   A c , c ] [ T c * T c * ] + [ F c F c ] ) = [ e c 0   0 e c ] [ ( I A c , c ) 1 0   0   ( I A c , c ) 1 ] [ F c F c ]
The total CO2 emissions linkages, C*, from Equation (9), describe the hypothetical relationship between the extracted industrial sector (construction sector in this case) and other sectors within the categorized block, Hc, in which the final demand of the economy remains the same. The difference in the total CO2 emissions of the unextracted and the extracted hypothetical block can be expressed as a difference between C and C*:
C C * = [ C c C c   C c * C c * ]
Combining both Equations (8)–(10), we expressed the difference in total CO2 emissions as:
C C * = [ e c 0   0 e c ] [ Δ c , c ( I A c , c ) 1 Δ c , c   Δ c , c   Δ c , c ( I A c , c ) 1 ] [ F c F c ] = [ e c ( Δ c , c ( I A c , c ) 1 ) e c Δ c , c   e c   Δ c , c   e c ( Δ c , c ( I A c , c ) 1 ) ] [ F c F c ] = [ δ c , c δ c , c   δ c , c   δ c , c ] [ F c F c ]

3.5. CO2 Emissions Critical Paths of the Chinese Construction Sector

Equations (1)–(11) present the foundational methodological expressions for HEM analysis as presented in [40,43]. Duarte, Sánchez-Chóliz, and Bielsa [35] further decomposed emission linkages into two components in a study of water usage in Spain using an input–output approach. The two decomposed components are the forward and the backward linkages. Duarte, Sánchez-Chóliz, and Bielsa [35] proved that the addition of the two components must equal the total emission linkages. The approach followed the foundational concept of a vertically integrated sector of the hypothetical economy extraction method of Pasinetti [54]. This study focused on the critical paths of CO2 emissions in the construction sector in China. Therefore, we analyzed the emission linkages explicitly in both the forward and the backward directions in regional construction sectors in China. From this point forward, the construction sector of China represents the extracted sector ‘c’ in block H. The total CO2 emission linkages, T E   c c , in the Chinese construction sector are expressed in Equation (12), indicating the linkage influence of the industry in other regions within the national economy.
T E c c = u ( C C * ) = u [ δ c , c δ c , c   δ c , c   δ c , c ] [ F c F c ] = u [ δ c , c δ c , c ] F c c + u [   δ c , c   δ c , c ] F c
where T E   c c represents the total CO2 emissions linkages of the Chinese construction sector. u is a unit vector u = (1, …, 1) with a dimension of the entire economic structure.
However, according to Duarte, Sánchez-Chóliz, and Bielsa [35], the total linkage should be decomposed into forward and backward effects, F E c c , B E c c . The forward effects are the transferred CO2 emissions from block ‘c’ (construction sector) into other sectors in block ‘−c’ (other sectors), to satisfy their intermediate products and final demand, and the backward effects are the transferred CO2 emissions generated in producing intermediate production in the construction sector from other sectors in block ‘−c’ of the entire economic structure [14]. As expressed in Equation (15), the sum of the two effects gives the total linkages from the sector.
B E c c = u [ δ c , c δ c , c ] F c c = u ( δ c , c ) F c c + u ( δ c , c ) F c c
F E c c = u [ δ c , c δ c , c ] F c = u ( δ c , c ) F c c + u ( δ c , c ) F c c
T E c c = B E c c + F E c c

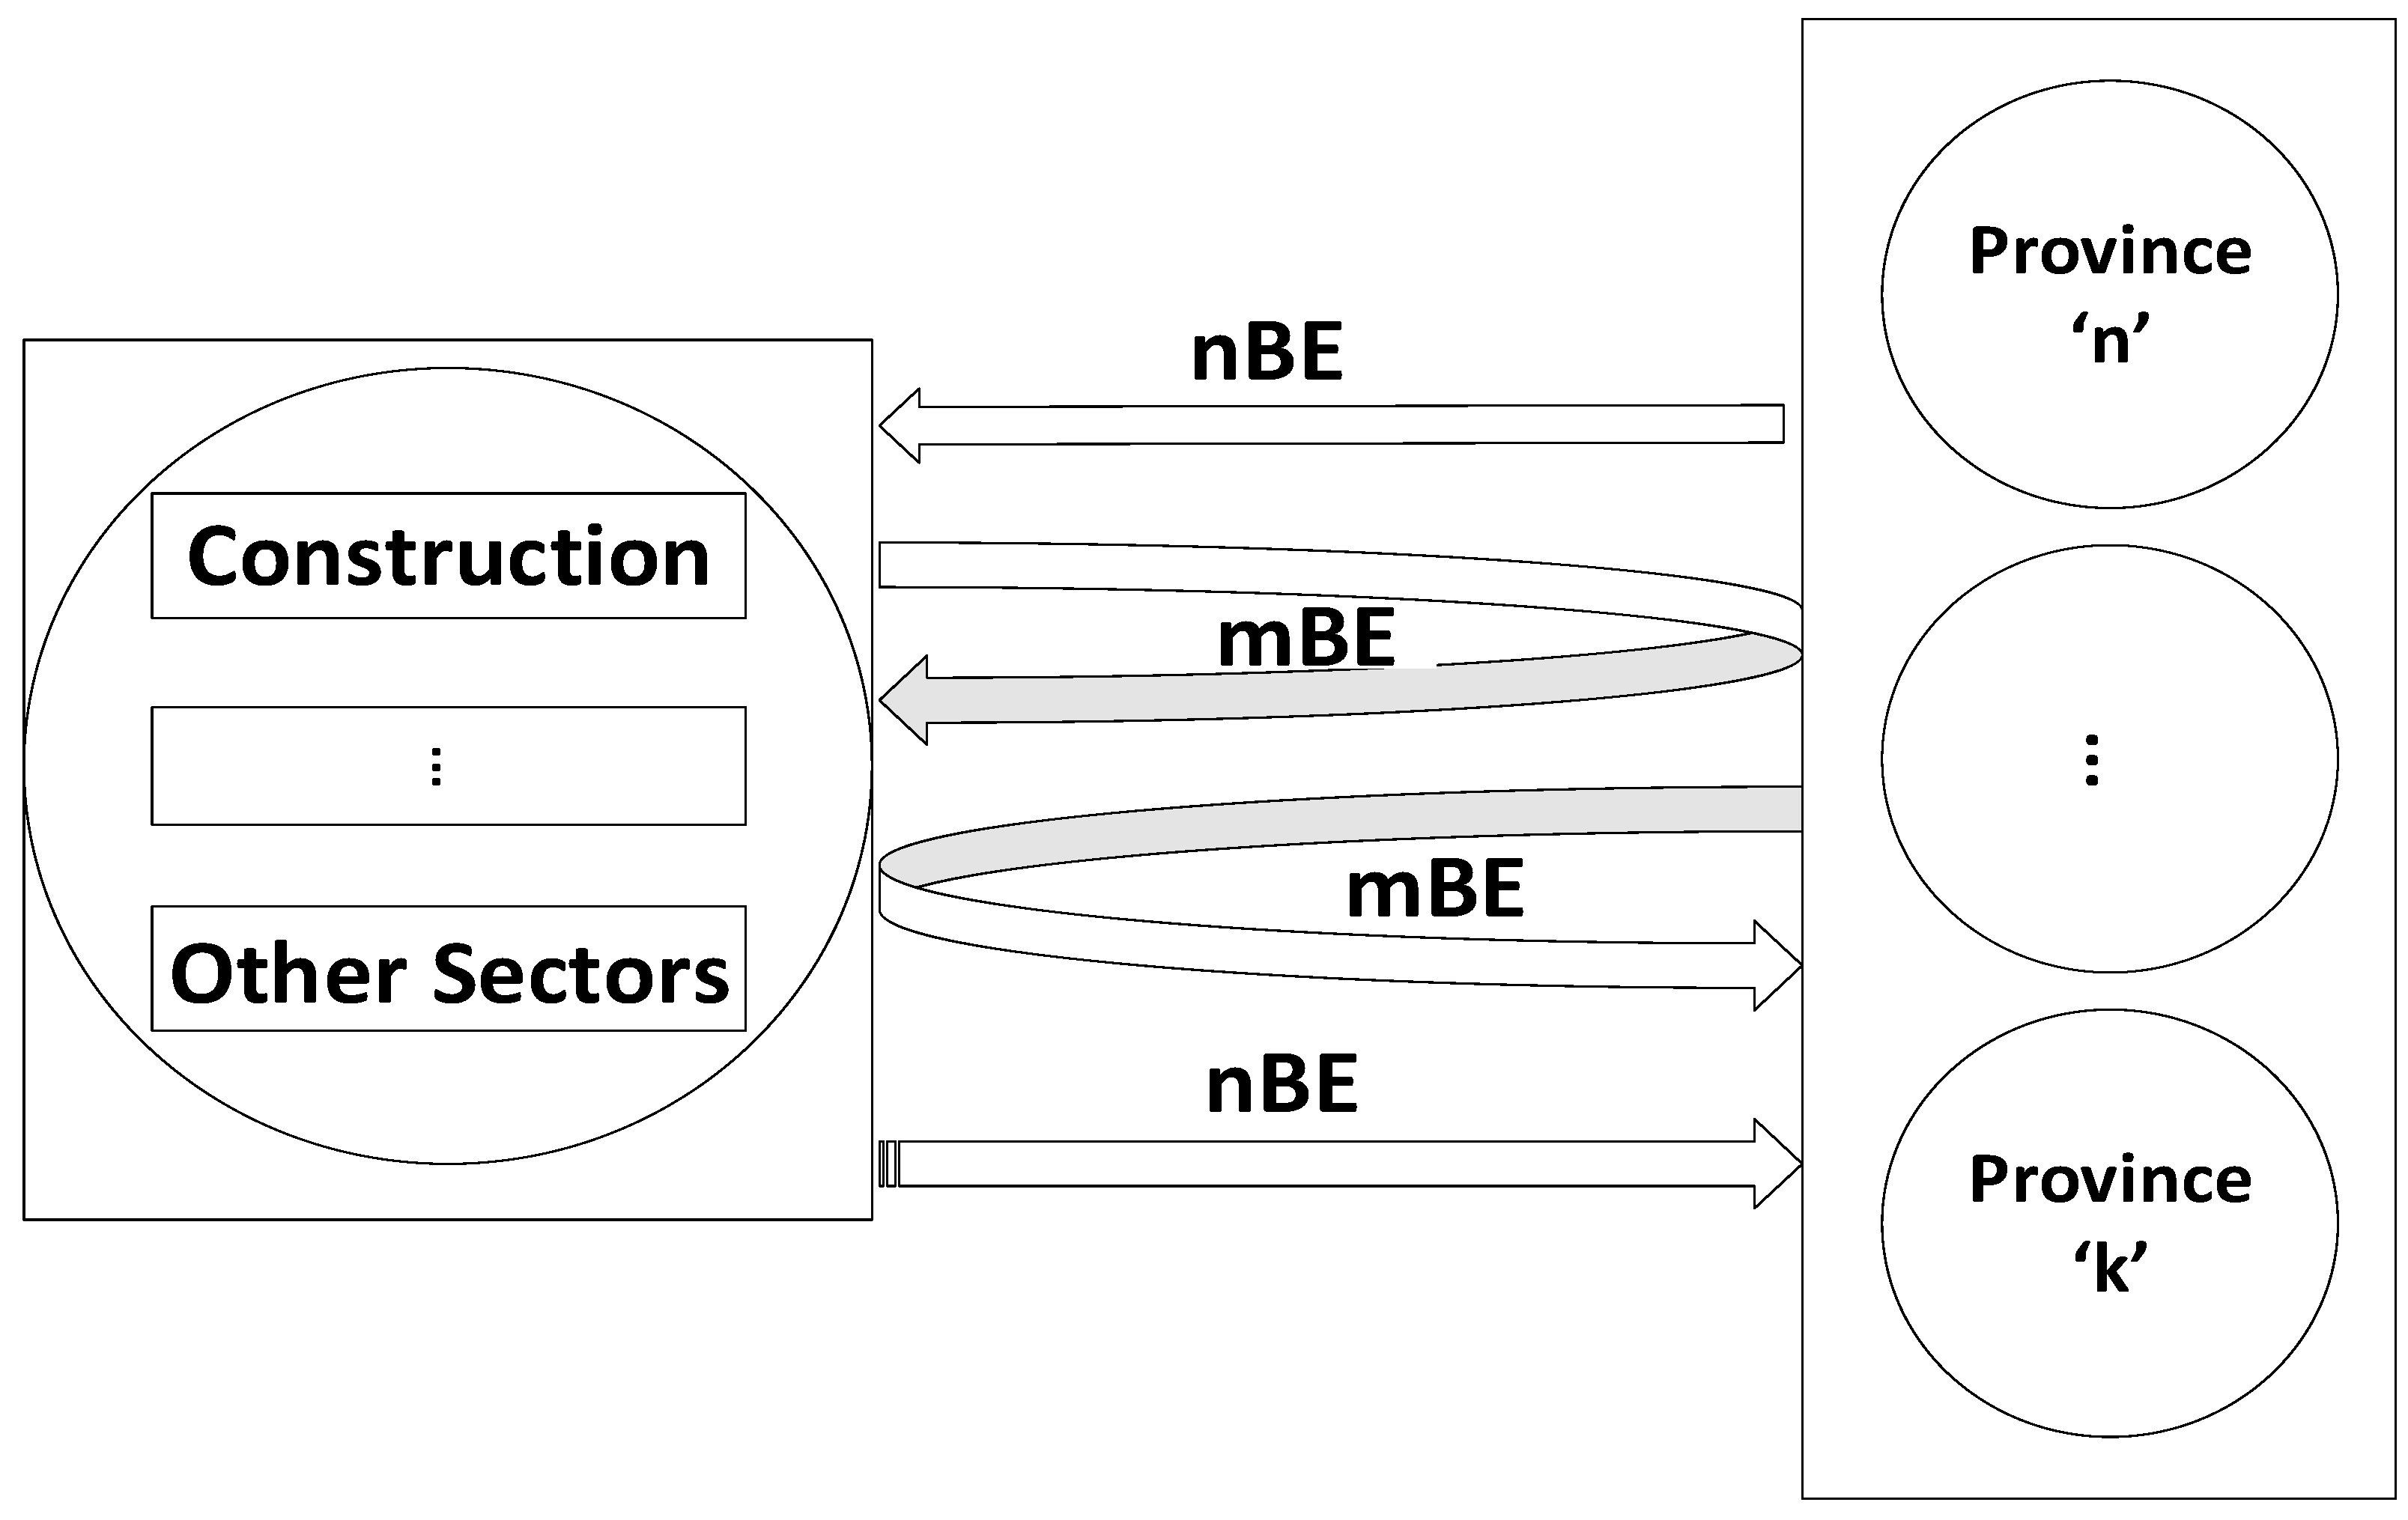
3.6. Modified HEM Decomposition of CO2 Emissions Linkages

The forward and backward effects are further decomposed to follow the approach of Duarte et al. (2002) [35], which modified HEM to divide the two-directional effects into four inter-directional components. The modified components are the net forward effects, the mixed forward effects, the net backward effects, and the mixed backward effects [53]. Zhao, Zhang, Wang, Zhang, and Liu [40] used the approach to decompose the directional effects of sectoral CO2 emissions linkages in South Africa. This paper uses the same method to decompose further the total CO2 emissions linkages in the Chinese construction sector. The mixed forward CO2 emissions effects, m F E c c , of the construction sector are the CO2 emissions generated in the sector’s products exported to other sectors of the national economic framework, which were used as intermediate inputs of the construction sector but sourced initially from other federal sectors. The net forward CO2 emissions effects, n F E c c , are CO2 emissions embodied in the construction sector’s products sold to satisfy the final demands of other sectors. The mixed backward effects, m B E c c , are linkages of final demands of the construction sector produced by other national sectors from materials initially sourced from the construction sector. The net backward effects, n B E c c , on the other hand, are CO2 emissions embodied in products of other global sectors purchased by the construction sector, which do not return to the national economic structure again. Figure 1 illustrates the relationship and pictorial representation of this study’s four CO2 emissions linkages. In this paper, we expressed the four decomposed effects in terms of CO2 emission intensity in Equations (16) to (19) as:
m F E c c = u δ c , c F c c = u e c c [ Δ c , c ( I A c , c ) 1 ] F c c
n F E c c = u δ c , c F c c = u   e c c   Δ c , c   F c c
m B E c c = u δ c , c F c c = u e c c [ Δ c , c ( I A c , c ) 1 ] F c c
n B E c c = u δ c , c F c c = u   e c c   Δ c , c   F c c
Furthermore, the relationship between the different decomposed components can be checked using the relationship definition in Duarte, Sánchez-Chóliz, and Bielsa [35], expressed in Equation (20). While the net transfer (NT) of CO2 emissions from the construction sector was calculated by the difference between the net forward effects and the net backward effects of the industry, as expressed in Equation (21). In addition, to determine the effects of each linkage component among the blocks, the relative indicators were calculated as defined in Equation (22), where M c c represents one of the decomposed components, m F E c c , n F E c c , m B E c c , n B E c c .
F E c c = m F E c c + n F E c c B E c c = m B E c c + n B E c c T E c c = B E c c + F E c c = m B E c c + m F E c c + n B E c c + n F E c c
N T c c = n F E c c n B E c c
R I c c = M c c T E c c

3.7. Inter-Sectoral and Inter-Provincial CO2 Emissions Linkages

To further understand the nature of the interactions between the construction industry and other sectoral blocks in a provincial economy and interactions with other provinces, we decomposed the net forward and the net backward effects. The method followed the approach in Zhang, Liu, Du, Liu, Li, and Wang [20] by decomposing in terms of domestic and international connections. The domestic linkages are CO2 emissions embodied in trade between the construction sectors and other local industrial blocks within the same province. In contrast, we define the international interactions as CO2 emissions embodied in trade between the construction sectors and industrial blocks in other provinces in China. To achieve this, we divided the whole economy into two hypothetical blocks, c and −c. Block c represents a particular province, while block −c represents other China provinces, assuming cp represents the construction sector for a specific province p, −cp as other sectors in province p, and -ci represents all sectors in the remaining 29 provinces in China. We used Equations (23) to (26) to express the domestic and inter-regional linkages of provincial construction sectors in China
D N B E c p = u   e   c p Δ c p , c   F c
I N B E c p = u   e   c i Δ c i , c   F c
D N F E c p = u   e   c Δ c , c p ,   F c p
I N F E c p = u   e   c Δ c , c i   F c i
where Fc represents the final demand of the specific province, and F c p represents the final demand of other sectors in the specific province except the construction industry. F c i represents the final demand of all sectors, including the construction sector in the other 29 provinces.

4. Results

In selecting the data for the study, we considered many international and local databases. The databases considered include the World Input–Output Database (WIOD), Carbon Emissions Accounts and Datasets (CEADs), OECD, Eurostat, Eora, EXIOPOL, ADB-MRIO, and IO accounts by the National Bureau of Statistics in China. Each IO account presents different challenges for usage in this study. Therefore, the study used the CEAD data for 2012, 2015, and 2017 (latest available MRIO tables of China) and corresponding CO2 emissions data for the three years. We chose the three years’ data because of the sectoral classifications of the IO tables in these years. Compared to other available years, 2012, 2015, and 2017 IO tables were constructed based on 42 sectoral categories, unlike previous tables with 30 sectors. Extending the data to include earlier years would require data assumptions in the reclassification of the sector, which may have invalidated the data integrity. As stated on CEAD’s website, all data published in the database are results from recent and current research funded by the Chinese Academy of Science, China’s Ministry of Science and Technology, National Natural Science Foundation of China, the Newton Funds, the Science and Technology Research Council of the UK, and other sponsoring institutions and agencies mentioned on its website [55].

4.1. Sectoral Classifications

There are 42 sectoral classifications in the Chinese economic structure used in this paper (Appendix A). The CO2 emissions data, on the other hand, were presented in the aggregated form of 45 sectoral classifications (Appendix B). To resolve the structural classification difference, we reclassified the 42 sectors into eight distinct blocks similar to the classification in Wang, Wang, Mao, Cai, Zuo, Wang, and Zhao [24]. We established the classification on the emission intensity potential of each sector of the economic structure. Sectors with similar intensities were aggregated together and categorized as shown in Table 2.
For the classification in Table 2, industrial blocks with direct CO2 emission intensities values equal to or greater than one are classified as high-carbon industries, and those with values less than one but greater than 0.1 as medium-carbon industries. In contrast, those with lower values are classified as low-carbon industries.
As presented in Table 2, the construction industry’s CO2 emission intensities in the three years are second to the emissions intensities in the energy industry block. We placed the construction industry in high-carbon industrial blocks based on the direct CO2 emission intensities. The total CO2 emission intensities were not used as a basis of classification. Suh [56] indicated that total CO2 emission intensities could be increased in sectoral blocks (especially in low-carbon industries) because of diluted overall monetary intensities based on value-added additions from other sectoral inputs.
Nonetheless, the direct CO2 emission intensity of the construction sector in China exhibits the features of a high-carbon industrial sector. The results of the CO2 emission intensities (total and direct) contradict many opinions inferring the construction industry as a low-carbon industry. Therefore, we establish the importance of studying the critical paths of CO2 emissions relating to the construction sector.
The contradictions in reporting the emission classification of the construction industry stem from the various aggregation systems available. In some classification systems, construction sectors are classified as buildings and civil engineering works, while other industry products in different sectors of the economic system are left out. Some industry classification system boundaries exclude emissions from the building life’s final use and demolition stages. In some classification systems, the cement industry is not considered part of the construction sector. The World Green Building Council provided a basic classification system for the building and construction sector [57]. These discrepancies in the classification system play defining roles in the contradictions of the sector’s categorization as a low-, medium-, or high-carbon sector. For this study, we categorized the sector as a high-carbon sector considering the system boundary in Giesekam et al. [58], including emissions from the production stage to the end of life of buildings, materials, and all appendixes used in the industry.

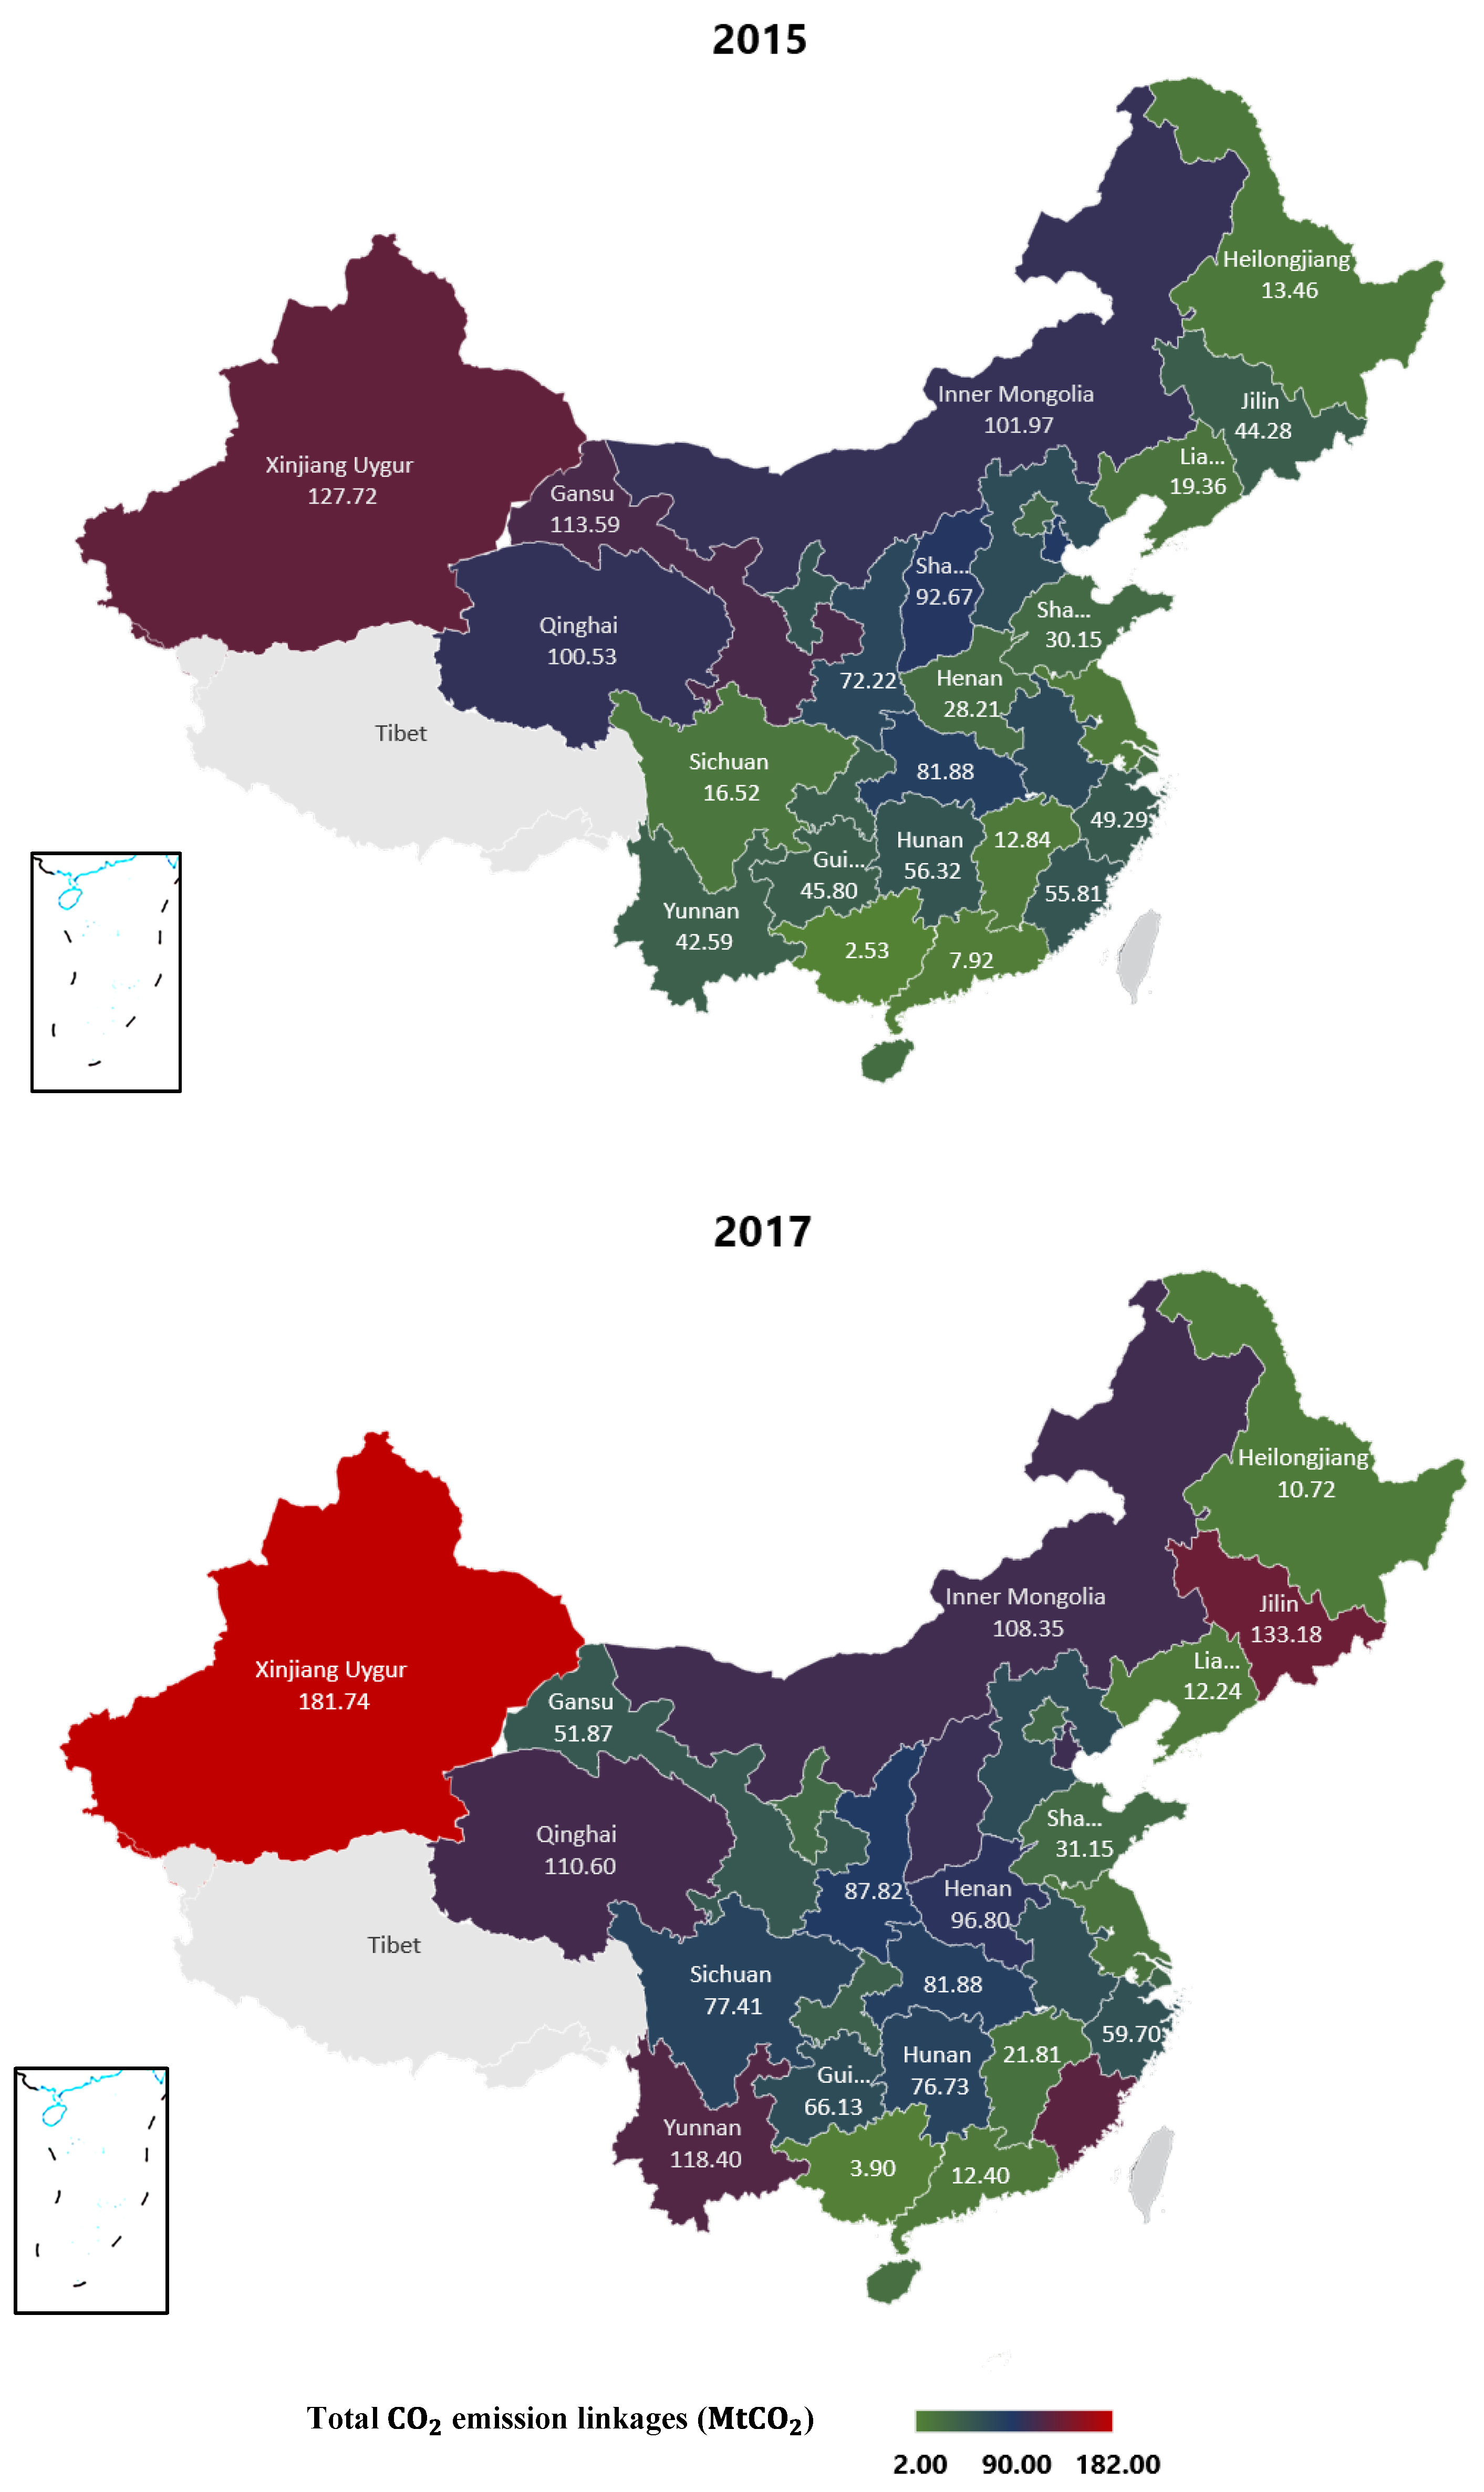
4.2. Total CO2 Emission Linkages

Using Equation (12), Figure 2 (2012) shows the total CO2 emissions linkages contributions of each of the 30 construction sectors in China. In 2012, the construction industry in China produced 1498.42 MtCO2. The construction industries in Shaanxi province had the largest share of more than 134 MtCO2, with Xinjiang’s 118 MtCO2 and Shanxi’s 94 MtCO2 being the second- and third-highest. In all the 30 provinces, the construction industry of fourteen provinces had a share of more than 50 MtCO2 in total CO2 emissions. Ten provinces had more than 20 MtCO2, with the remaining six provinces producing more than 2 MtCO2 each. Guangxi, Heilongjiang, and Jiangxi provinces had the least with 2.04, 2.86, and 7.21 MtCO2, respectively.
Figure 2 (2015) shows a visualization of the provinces’ CO2 emissions linkages in 2015. Xinjiang province’s construction sector became the highest CO2-emitting construction sector in China, with 8.2% (127.72 MtCO2) of the national construction sector’s CO2 emissions (1550.98 MtCO2). The CO2 emissions in China’s construction sector increased by 52.56 MtCO2 from 2012 levels in 2015. In 2015, Gansu province experienced the most significant increase in CO2 emissions, producing more than 51 MtCO2 more than in 2012. The most significant decrease in CO2 emissions was observed in Shaanxi province, from 134.22 MtCO2 in 2012 to 72.22 MtCO2 in 2015, amounting to a 62% CO2 emissions decrease. Heilongjiang province exhibited the lowest emission intensity efficiency by increasing CO2 emissions in the province by an alarming 370% of 2012 levels, from 2.86 to 13.46 MtCO2. The lowest CO2 emissions increases were in Tianjin, Yunnan, and Hebei provinces, respectively, with 5%, 6%, and 8%. The most significant CO2 emissions decreases were in Shandong, Liaoning, Jiangsu, and Shaanxi provinces, with a cutdown of 61%, 51%, 49%, and 46%, respectively. Shanxi province experienced a slight change in CO2 emissions in 2015, with a 1% decrease from 2012 levels.
Figure 2 (2017) represents the total CO2 emissions of the 30 provincial construction sectors in 2017. Xinjiang province contributed 9.1% (181.74 MtCO2) of the total national CO2 emissions linkages in the construction sector (1999.66 MtCO2). Xinjiang maintained the top spot as the biggest CO2 emissions source in the construction sector, contributing 181.74 MtCO2 (9.1% of the national construction sector’s CO2 emissions). In 2017, Jilin, Fujian, and Yunnan provinces, with an average of 50 MtCO2 in 2015, became the highest CO2 emitters after Xinjiang. The increase in CO2 emissions in these provinces amounted to significant increases of 88.9%, 67.5%, and 75.8%, respectively. The increases indicate a reduction in CO2 emissions efficiencies in the provinces. Henan, Sichuan, and Xinjiang provinces experienced a CO2 emissions growth of 68.6% (96.8 MtCO2), 60.9% (77.41 MtCO2), and 54% (181.74 MtCO2), respectively. In contrast, there was a significant reduction in CO2 emissions in Gansu province in 2017. The CO2 emissions reduction of 61.7% in 2017 in the region indicates Gansu kept CO2 emissions in 2017 below 2012 levels. Ningxia, Liaoning, Anhui, Chongqing, Hainan, and Heilongjiang provinces also achieved CO2 emissions reduction in 2017 to less than 2015 levels. Hubei province was the only province that maintained the same CO2 emissions linkages from 2015 levels (81.88 MtCO2).
The construction sector in China experienced a growth of more than 500 MtCO2 of CO2 emissions linkages from the 30 provinces between 2012 and 2017. The results show a significant reduction in the total CO2 emissions linkages of the Chinese construction industry when compared with the 2260 MtCO2 reported for 2009 by Zhang, Liu, Du, Liu and Wang [14]. A greater reduction in the CO2 emissions of the sector was observed in the more developed provincial constructions sectors such as Jiangsu, Beijing, Shanghai, and Chongqing. The construction sectors in these regions are more demand-driven as most of the CO2 emission linkages result from intra-provincial transactions. The total CO2 emission linkages in some less developed and more remote provinces, such as Xinjiang, Ningxia, Inner Mongolia, and Qinghai, intensified as more construction-based activities were carried out.
The total CO2 emission linkages per population density of each province for 2012, 2015, and 2017 indicate the CO2 emission intensities concerning people and space. The population density in many Chinese regions is high, and many studies suggest it as a primary driver of construction activities and increased CO2 emission within the provinces [59,60]. Figure 3 shows relatively stable growth in CO2 emission linkages in many provinces except in four provinces. Gansu, Inner Mongolia, Qinghai, and Xinjiang construction sectors indicated high and growing CO2 emission linkages per population density. The construction sectors in these provinces show that population density did not necessarily increase construction activities. Instead, demand from other developed and developing provinces’ final demand might have caused increasing CO2 emission linkages in these regions.

4.3. Forward and Backward CO2 Emission Linkages

The first-order decomposition of CO2 emissions linkages of China’s construction industry is the forward and backward CO2 emissions linkages. These directional decomposition components determine the pull and push effects of local construction with other industrial sectors. Figure 4 and Figure 5 show the backward and forward effects in China’s 30 local construction industries, respectively. The BE of all 30 local construction sectors increased from 24,678.09 tCO2 in 2012 to 27,910.17 tonnes of CO2 in 2015. In 2017, there was a slight decrease to 27,727.53 MtCO2, amounting to a reduction of 182.64 tonnes of CO2 from the 2015 levels. Guangxi, Shanghai, Zhejiang, and Henan contributed most to the backward linkages in 2015 with 24.1%, 13.3%, 12.8%, and 7.5%, respectively. With the addition of Sichuan and Hubei, these provinces had BE above 1000 tonnes of CO2, with Guangxi having 5949.94 tCO2 (Figure 4 (2012)). The BE in Guangxi intensified in 2015 with a contribution of 1940.30 tCO2 of the total national additions of 3232.08 tCO2 (Figure 4 (2015)). Henan added 1827.97 tCO2 to 2012 levels to have a BE of 3683.45 tCO2 in 2015. Shanghai and Tianjin provinces experienced the most significant reductions of more than 1000 tCO2 from 2012 to 782.38 tCO2 and 337.99 tCO2, respectively, in 2015. Figure 2 (2015) shows that Shandong, Fujian, Chongqing, and Hunan provinces significantly increased BE in 2015.
In 2017, Hubei province maintained the same BE as 2015 (523.53 tCO2). While most provinces reduced BE in 2017, Guangxi, Hunan, and Jiangxi significantly increased BE by more than 1000 tCO2 (Figure 4 (2017)). Zhejiang province had more than 3000 tonnes of CO2 BE in the three years. The most significant BE reduction was observed in Henan, Shandong, Fujian, and Chongqing provinces (2350.32 tCO2, 1240.75 tCO2, 1149.67 tCO2, and 650.36 tCO2, respectively). Fifty-nine percent of the national BE in 2017 were from Guangxi (34%), Zhejiang (12%), Hunan (8%), and Jiangxi (5%).
The construction sectors in Xinjiang, Shaanxi, Inner Mongolia, Shanxi, Tianjin, and Qinghai exhibited FE characteristics of the TL. Figure 5 shows the primary source of CO2 emissions in the construction industry is from products of the sector. The FE characteristics of local construction sectors in China indicate a high relative ratio with the BE, implying the sectors’ dominance in production activities within the economic structure. Overall, the construction sector in China is not a consumption sector as it contributes more to forward emissions than it receives on the backward path (the consumption activities). Appendix C gives details of the FE and BE in provincial economic structures in China. The low value of the BE in construction sectors in China indicates the Chinese economic dependence on infrastructural development. The construction industry in China drives the developmental activities of the economy by assuming the role of the core industrial sector in the Chinese economy. Figure 5 shows Xinjiang, Shaanxi, Inner Mongolia, Tianjin, and Qinghai as the main drivers of CO2 emissions in the construction sector in China.

4.4. Modified Directional Decomposition of CO2 Emission Linkages

The second-order decomposition of CO2 emissions linkages of China’s construction industry is the decomposition of the BE and FE to understand the dual nature effects of the first-order emission paths. The modified HEM approach disaggregated BE and FE CO2 emission linkages into sub-components of mixed and net CO2 emissions. The net backward linkages indicate the CO2 emissions inherent in the products of other sectors used in the construction industry. On the other hand, the net backward linkages indicate the CO2 emissions generated in products of the construction sector wholly used up in other sectors’ production activities. The mixed effects are two-directional features of pull and push CO2 emissions effects. The mixed forward effects are CO2 emissions accrued from products of other sectors used in construction sectors’ production and sold back to the economy to satisfy the final demands of different sectors. In contrast, mixed backward effects are CO2 emissions embodied in products originating from the construction sector, sold to make other sectors’ products, and returned to the construction sector to satisfy its final demand.
Table 3 presents the mixed and net backward effects of the 30 construction sectors in China. The CO2 emissions embodied in the intermediate demands of the construction sectors in most of the local construction sectors are unitary directional (NBE). In 2012, only Qinghai, Shanxi, and Gansu had more than 10% of CO2 emissions embodied in dual-directional BE, with Qinghai having 54%. In 2015 and 2017, the trend remained with mixed-backward linkages in only four provinces that exceeded 10%. Qinghai province had reduced its MBE to 28% by 2017. The NBE in Table 3 shows most of the CO2 emissions in the backward path of the Chinese construction sectors were from goods from other industries and hardly returned to the originating sector. The result implies the construction sector in China is more of a production sector than a consumption sector. The NBE indicates the sectors’ large amount of materials intake from other industries and discharge of considerable CO2 emissions back to the economy in its products.
In the same vein, Table 4 presents the directional effects of the FE in provincial construction sectors in China. The mixed directional FE are CO2 emissions in the construction sector’s intermediate products purchased initially as inputs from other sectors. In comparison, the one-directional net FE are CO2 emissions embodied in products of the construction sector that are sold and fully used in other sectors. The results in Table 4 show almost all the provincial construction sectors produced CO2 emissions from outward-bound products of the industry, with little return from other sectors after the intermediate products were converted to final products. The characteristics of all the provincial sectors tended towards more production-based CO2 emissions sources than demand-based. In 2017, Qinghai (27.7%), Guizhou (15.8%), Hubei (12.7%), Fujian (11.2%), Shanxi (8.5%), Yunnan (8.5%), and Sichuan (6.0%) had mixed FE of more than 5%. The relative indices in 2017 suggest a sector increasing its dependence on other sectors within the economic structure. Deductively, the construction industry is an overall net exporter of CO2 emissions in the Chinese economy with little usage of CO2 emissions produced from other sectors’ final products.

4.5. Transferred CO2 Emission Linkages Sources and Destinations

This section measured the domestic and inter-provincial paths of CO2 emissions interaction among the 30 construction industries and other sectoral blocks within and outside the provinces. The domestic exchanges (DNBE and DNFE) are CO2 emissions of the construction sector with other industrial blocks within the same province. On the other hand, the inter-provincial linkages (INBE and INFE) are CO2 emissions interactions of the construction industry with other industrial blocks in different regions in China. Due to the dual-directional features of the mixed linkages, only the net linkages are suitable for further decomposition to understand the sources of the emissions. Appendix D shows the detailed distributions of the domestic and inter-provincial CO2 emissions.

4.5.1. Net Backward CO2 Emission Linkages Sources

Figure 6 shows the percentages of CO2 emissions caused by intra-provincial exchanges in the 30 provinces in China for 2012, 2015, and 2017. In 2012, seventeen of the 30 provinces had more than 50% of their net backward CO2 emissions accruing from transactions within their provinces, while the remaining thirteen had more CO2 emissions from inter-provincial trades. Beijing had almost absolute CO2 emissions sources from interprovincial trades with more than 97% of the net backward CO2 emissions. Guangdong and Hebei provinces had similar CO2 emissions sourced from inter-provincial transactions (94%) (Figure 6 (2012)). Ningxia, Xinjiang, Inner Mongolia, Yunnan, Guizhou, and Qinghai are more domestic consumption provinces, with at least 90% of their CO2 emissions originating from domestic sources. In 2015, 19 local construction sectors had more than 50% of net backward CO2 emissions resulting from trades within their provinces (Figure 6 (2015)). In 2017, the number dropped to 17 (Figure 6 (2015)). Overall, Beijing, Hebei, Shaanxi, Shanghai, Hubei, Chongqing, and Guangdong construction sectors sourced more than 75% (on average) of their backward CO2 emissions from inter-provincial trades. These provinces are some of the most developed in China. These results show that the construction sectors in many developed areas are net consumption provinces, depending on products from other provinces to satisfy their final local demands. On the other hand, construction sectors in less developed provinces such as Ningxia, Xinjiang, Guizhou, and Hainan consume more locally produced goods within their provincial boundaries to meet their final demands.

4.5.2. Net Forward CO2 Emission Linkages Sources

In the same vein as the net backward CO2 emissions linkages, we decomposed the net forward linkages into domestic and inter-provincial paths. We traced the eventual destinations of CO2 emissions generated in each local construction sector in China. Over the years of investigation, Xinjiang, Ningxia, Qinghai, and Gansu construction sectors were China’s largest net exporters of CO2 emissions. On average, these provinces sold more than 80% of CO2 emissions outflows in trades to other industries in different provinces, while local sectors bought up the remaining 20% to satisfy their final demands (Figure 7). Likewise, Shanxi, Jiangsu, Heilongjiang, Hainan, and Guizhou construction sectors had more than 70% of CO2 emissions outflows embodied in interprovincial products. Some developed provinces, such as Beijing, Chongqing, Hunan, and Hebei, had their CO2 emissions outflows almost divided equally between domestic and inter-provincial destinations. However, most developed provinces, such as Shanghai, Hubei, Jiangsu, Zhenjiang, Guangdong, and Shandong, with significant population density, had most of their CO2 emissions outflows embodied within their provinces with small fractions embodied in inter-regional trades.

5. Discussion and Policy Implications

The results from the analyzed data of the study indicate essential observations regarding the criticality and influence of different provincial construction industries on the overall CO2 emissions of China. This section of the paper discusses the implications of the results and possible policy implications of the results in the following sub-headings:

5.1. Classification of China’s Construction Industry Carbon Intensity

Contrary to the previous categorization of the construction industry in China as a low-carbon industry [24], this study’s results classed the sector as a high-carbon industry with high CO2 direct intensities. It is important to recognize the sector’s downstream and supply chain in determining the carbon categorization of the industry. Classifying the carbon potential of the sector based on segregated sectoral classes would fail to indicate the significance and the tendencies of the sector in increasing carbon growth in China. The sector is only second to energy industries among China’s top CO2 intensity sectoral blocks. The average CO2 direct intensity of the industry increased from less than 0.5 t/104 Yuan in 2007 [24] to 4.85 t/104 Yuan in 2017. This means the construction sector in China has more significant tendencies to emit more CO2 than most industrial sectors currently receiving more attention in terms of sustainable policy changes. In addition, it could indicate the CO2 emission efficiency of the industry in China is low compared to other industrial sectors in the country. Investing in enhanced technology targeted at improving carbon efficiency in the industry could be a more feasible route to achieving net-zero carbon emissions in China. In addition, from the study and observations from previous studies, most policies are not reflective of the whole but fractions of the sector. Therefore, research on carbon emissions in the construction sector, especially in China, needs to follow robust boundary definitions in its scope to prevent issues of inadequate representation of the sector’s emitting potential [58].

5.2. CO2 Emissions Linkages of China’s Construction Sector

The total CO2 emissions linkages of the provincial construction sectors combined showed a significant increase from 1498 MtCO2 in 2012 to 2000 MtCO2 in 2017. With the observed increasing trend in CO2 emission flow in and out of the construction industry, the construction sector in the 30 provinces exhibited itself as an essential sector with significant economic and emissions interactions with other sectors. Cheng et al. [61] attributed this significance to rapid urbanization in China. However, the total CO2 emission linkage compared with the population density of most of the provinces showed a reasonable correlation except in Xinjiang, Qinghai, Inner Mongolia, and Gansu, with relatively high construction activities that are more than what is needed to satisfy population demands in the provinces. The results from the study indicate the nature of construction activities in these provinces tends towards producing for consumption in other regions. The trend is consistent with [45]. The four provincial construction sectors are net producers and exporters of CO2 emissions, affecting the final demands of other areas in direct trade with these provinces. The study identified the four provincial construction sectors as the most critical industries.
Developed provinces bear responsibility for the emissions taking place for developmental purposes within their borders, making them more demand-driven. The more remote provinces in China should aim to move away from behaving as net exporters of emissions to demand-driven sectors. Akan et al. [62] suggested the development of emission-reducing technologies focused on less developing areas as a better way to help these regions achieve a better emission behavior pattern. In addition to technological improvements in the provinces, tax incentives could be introduced to areas with critical emission indications, and encouragement of inter-provincial knowledge transfer.

5.3. Directional Push and Pull Effects of Provincial Construction Sectors’ CO2 Emission

The study results showed significant deficits in the CO2 emissions balance between the provinces’ BE and FE. The FE far outweigh the BE of the provincial construction sectors, indicating a tilt towards a net emitting sector in the upstream rather than a downstream position in most provincial construction industries. The results imply the construction sectors contribute more CO2 emission outflows through trade to other economic sectors and do not, in turn, absorb CO2 emissions in goods from those sectors. The observation is related to the characteristics of the global construction carbon emissions study in [63]. Further decomposition of the sectoral linkages of the 30 construction sectors further proved the sector as a net one-directional forward CO2-emitting sector. Both BE indicators (NBE and MBE) show extremely negligible values compared to the two indicators of FE (NFE and MFE). In particular, the minimal values of MBE CO2 emission in all the 30 provincial sectors indicate the construction sectors have low consumption of products manufactured from intermediate products used by other sectors to produce their final products.
The NBE values indicate the construction sectors consume more products from other sectors to satisfy final demand than intermediate consumption. The small BE also mean the construction sector provides more products to other industries in the economic structure than it receives, indicating the significant embodied CO2 emissions in products used in different industries. The NFE, on the other hand, suggests the dependence of other sectors on products of the construction sector. The indicators accentuate the construction sector’s pivotal role in developing Chinese technology and industrialization and the need to have more focused sustainability strategies. To that end, there is a need to focus on China’s construction and concrete industries as an important sector for climate change just as much as energy, transportation, and manufacturing industries. In agreement with [20], more attention should be given to compartmentalizing construction products to enable dual usage rather than them only being valuable as goods for satisfying final demand in other sectors.

5.4. Transferred CO2 Emissions Linkages of China’s Provincial Construction Sectors

The study showed the sources and destinations of the CO2 emissions in the provincial construction sectors of the 30 provinces in China. The results showed that local construction sectors’ CO2 emissions embodied in raw materials are sourced from within and outside their corresponding provinces. The observed pattern suggested developed provinces such as Beijing, Shanghai, and Chongqing averagely had more CO2 emissions inflows from inter-provincial sources. In contrast, many provinces especially, notable less developed provinces, such as Xinjiang, Ningxia, Gansu, and Inner Mongolia, had the most BE CO2 emissions embodied in products purchased within their provinces. In addition, the destinations of CO2 emissions in FE suggest that a good part of CO2 emissions from the construction industry are transferred to different sectors within the same provinces: 43% of CO2 emissions from the 30 provincial construction sectors combined were transferred to other industries within the same province and 56% in inter-provincial trades.
This result suggests products from construction sectors play vital developmental roles within and outside their provinces of origin, indicating a reasonable balance in the inter-sectoral and inter-provincial trades of the construction sector in China. However, Hubei, Jiangsu, Shanghai, Zhejiang, and Guangdong provinces had more CO2 emissions in inter-sectoral trade than inter-provincial trades, while Xinjiang, Ningxia, and Qinghai contributed more CO2 emissions in inter-provincial transactions. The balance in transferred CO2 emissions observed in many provinces needs to be maintained while developing policies to tackle the imbalance in remaining provinces, especially the critical ones, such as Xinjiang, Ningxia, Gansu, and Inner Mongolia, identified in the study.

6. Conclusions

The study focused on the calculation of CO2 emissions inflows and outflows in 30 provincial construction sectors in China, using a well-established HEM model combined with the constructed extended MRIO tables for 2012, 2015, and 2017. The study underlines the need for specific sectoral CO2 emission mitigation plans to consider the different provinces’ emission characteristics rather than a generic approach. More importantly, the materials used for construction require improved process innovations to achieve better CO2 emission intensities. Improved construction sector CO2 emissions policies in developed provinces such as Shanghai, Beijing, and Jiangsu show a significant change in the behavior of these regions. The more developed provinces’ construction sectors have shifted towards being demand-driven. At the same time, the less developed regions serve as net exporters of construction products to the entire economic system, resulting in imbalanced CO2 interactions between the provinces, thus increasing the CO2 linkages originating from the less developed provincial construction sectors.
Therefore, to achieve a reduction in CO2 in the industry, improving the technical level, especially in less developed provinces such as Xingjian, Ningxia, and Inner Mongolia, will benefit the entire construction sector’s CO2 emissions mitigation drive. Lastly, the construction sector in China needs to invest more into independent, innovative low-carbon research to reduce the industry’s process dependence on fuel and make renewable energy the primary energy source. An absolute and urgently increased share of low-carbon energy in provincial construction sectors will contribute substantially to the quest of achieving the national carbon reduction target and reaching zero-carbon by 2030.

Author Contributions

Conceptualization, A.J.O. and G.Q.S.; methodology and data curation, A.J.O., T.M.A., and J.X.; writing—original draft preparation, A.J.O.; writing—review and editing, A.J.O., T.M.A., J.X., and G.Q.S.; supervision, G.Q.S. All authors have read and agreed to the published version of the manuscript.

Funding

The APC was funded by the Research Grants Council and the Hong Kong Polytechnic University.

Institutional Review Board Statement

Not applicable.

Informed Consent Statement

Not applicable.

Data Availability Statement

Data is contained within the article.

Acknowledgments

The authors wish to thank the Research Grants Council, the Innovation and Technology Commission, the Policy Innovation and Co-ordination Office of the Government of the Hong Kong Special Administrative Region, the Research Institute for Sustainable Urban Development, and the Hong Kong Polytechnic University for funding support for the research which has contributed to the preparation of this paper.

Conflicts of Interest

The authors declare no conflict of interest.

Appendix A

Table A1. Original sector classifications of the Chinese MRIO tables.
S/NSector
1Agriculture, forestry, animal husbandry, and fishery
2Mining and washing of coal
3Extraction of petroleum and natural gas
4Mining and processing of metal ores
5Mining and processing of nonmetal and other ores
6Food and tobacco processing
7Textile industry
8Manufacture of leather, fur, feathers, and related products
9Processing of timber and furniture
10Manufacture of paper, printing and articles for culture, education and sport activity
11Processing of petroleum, coking, processing of nuclear fuel
12Manufacture of chemical products
13Manufacture of non-metallic mineral products
14Smelting and processing of metals
15Manufacture of metal products
16Manufacture of general-purpose machinery
17Manufacture of special-purpose machinery
18Manufacture of transport equipment
19Manufacture of electrical machinery and equipment
20Manufacture of communication equipment, computers and other electronic equipment
21Manufacture of measuring instruments
22Other manufacturing and waste resources
23Repair of metal products, machinery, and equipment
24Production and distribution of electric power and heat power
25Production and distribution of gas
26Production and distribution of tap water
27Construction
28Wholesale and retail trades
29Transport, storage, and postal services
30Accommodation and catering
31Information transfer, software, and information technology services
32Finance
33Real estate
34Leasing and commercial services
35Scientific research
36Polytechnic services
37Administration of water, environment, and public facilities
38Resident repair and other services
39Education
40Health care and social work
41Culture, sports, and entertainment
42Public administration, social insurance, and social organizations

Appendix B

Table A2. Sectoral classification of CO2 emissions in China.
S/NSector
1Production and supply of electric power, steam, and hot water
2Production and supply of gas
3Production and supply of tap water
4Transportation equipment
5Transportation, storage, post, and telecommunication services
6Coal mining and dressing
7Petroleum and natural gas extraction
8Ferrous metals mining and dressing
9Nonferrous metals mining and dressing
10Nonmetal minerals mining and dressing
11Other minerals mining and dressing
12Petroleum processing and coking
13Raw chemical materials and chemical products
14Medical and pharmaceutical products
15Chemical fiber
16Rubber products
17Plastic products
18Nonmetal mineral products
19Smelting and pressing of ferrous metals
20Smelting and pressing of nonferrous metals
21Metal products
22Scrap and waste
23Farming, forestry, animal husbandry, fishery, and water conservancy
24Logging and transport of wood and bamboo
25Food processing
26Food production
27Beverage production
28Tobacco processing
29Textile industry
30Garments and other fiber products
31Leather, furs, down, and related products
32Timber processing, bamboo, cane, palm fiber, and straw products
33Furniture manufacturing
34Papermaking and paper products
35Printing and record medium reproduction
36Cultural, educational and sports articles
37Wholesale, retail trade, and catering services
38Others
39Construction
40Ordinary machinery
41Equipment for special purposes
42Electric equipment and machinery
43Electronic and telecommunications equipment
44Instruments, meters, cultural and office machinery
45Other manufacturing industry

Appendix C

Table A3. CO2 emissions results of HEM in 30 provincial construction sectors in China.
Province201220152017
TL (MtCO2)BE (tCO2)FE (MtCO2)TL (MtCO2)BE (tCO2)FE (MtCO2)TL (MtCO2)BE (tCO2)FE (MtCO2)
Beijing47.22401.7047.2236.06346.4536.0634.76548.6434.76
Tianjin84.241498.0984.2488.86337.9988.86106.74456.02106.74
Hebei61.12269.8761.1265.78565.1165.7866.041133.9466.04
Shanxi94.0375.3094.0392.67102.0692.67104.7396.73104.73
Inner Mongolia91.91502.6091.91101.97180.06101.97108.35517.03108.35
Liaoning39.53810.7339.5319.36722.7519.3612.24786.7712.24
Jilin26.26447.3626.2644.28264.4744.28133.18912.83133.18
Heilongjiang2.86812.362.8613.4659.8613.4610.72134.8810.72
Shanghai37.663278.8837.6530.91782.3830.9138.431007.6138.43
Jiangsu24.51398.8224.5112.48729.2912.4819.50737.9719.50
Zhejiang29.853155.3729.8549.293782.4849.2859.703319.0759.70
Anhui52.52233.6152.5269.22314.3169.2264.13694.9864.13
Fujian30.67251.1630.6755.811180.6655.81123.3430.99123.34
Jiangxi7.21128.127.2112.84399.8312.8421.811472.9521.81
Shandong77.39625.2077.3930.151947.9230.1531.15707.1731.15
Henan16.041855.4816.0428.213683.4528.2196.801333.1396.80
Hubei88.941005.5088.9481.88523.5381.8881.88523.5381.88
Hunan62.95303.4562.9556.321206.6856.3276.732228.6076.73
Guangdong11.425949.9411.427.927890.247.9112.409335.4012.39
Guangxi2.04259.712.042.53347.322.533.90263.753.90
Hainan24.940.8224.9427.1635.3527.1624.2548.0524.25
Chongqing55.1921.6755.1946.58834.2746.5842.62183.9142.61
Sichuan12.641366.5612.6416.52625.8116.5277.41370.4177.41
Guizhou27.53165.2927.5345.80142.5845.8066.1394.6266.13
Yunnan40.20561.0740.2042.59322.4442.59118.40154.72118.40
Shaanxi134.22237.39134.2272.22538.2972.2287.82302.7887.82
Gansu62.5343.0862.53113.599.36113.5951.87107.0551.87
Qinghai63.481.9863.48100.533.68100.53110.607.03110.60
Ningxia71.026.1871.0258.2526.5358.2532.2862.2332.28
Xinjiang118.3010.81118.30127.725.02127.72181.74154.75181.74
China Total1498.4224,678.091498.401550.9827,910.171550.961999.6627,727.531999.63

Appendix D

Table A4. Domestic and inter-provincial CO2 source emissions distribution.
Province201220152017
DNBE
(tCO2)
INBE
(tCO2)
DNFE
(MtCO2)
INFE
(MtCO2)
DNBE
(tCO2)
INBE
(tCO2)
DNFE
(MtCO2)
INFE
(MtCO2)
DNBE
(tCO2)
INBE
(tCO2)
DNFE
(MtCO2)
INFE
(MtCO2)
Beijing18.87359.3724.6521.8012.25320.7215.6919.5217.56513.6714.5018.98
Tianjin200.671282.3639.9541.19182.87135.1341.1546.96331.48103.4624.1981.36
Hebei28.08238.4528.5930.1547.33510.3432.2930.4667.591061.0839.9222.67
Shanxi56.5610.1620.8073.0679.8513.8513.3679.0568.4620.0938.7465.41
Inner Mongolia456.0625.7332.2258.17159.538.5128.1472.42294.79209.2536.4570.57
Liaoning569.67223.2720.5517.77616.4498.837.7510.22692.2387.715.256.35
Jilin208.57231.1114.799.95199.5152.0118.7724.51114.75795.3711.90107.33
Heilongjiang713.4696.350.631.4838.7419.275.058.1674.0360.111.538.79
Shanghai216.143052.8929.536.34274.20496.6320.669.57239.66761.4525.0112.40
Jiangsu256.87136.2218.944.72437.92287.937.443.38173.28563.3513.890.83
Zhejiang1841.571253.7618.2510.751698.911986.3941.056.86762.462526.2038.8517.72
Anhui76.20151.4629.1722.52135.47167.7633.7034.47467.23215.2318.5344.84
Fujian71.48171.0825.025.2854.561113.0634.3617.8823.993.5347.3675.63
Jiangxi60.4865.802.274.60187.87206.754.856.78741.36729.141.1316.53
Shandong295.58295.6160.8915.821022.47889.5617.8911.22532.11168.2512.6817.51
Henan1491.32335.816.297.972304.051322.599.8114.50191.191133.8751.3943.19
Hubei53.71921.6678.609.57143.89312.9869.0412.51143.89312.9869.0412.51
Hunan240.7834.2931.0331.52806.20342.6920.3835.061025.821149.0030.7544.29
Guangdong2378.083519.997.142.202378.395469.353.422.23533.468798.498.422.38
Guangxi210.0249.090.591.20287.6858.581.180.97214.1549.360.612.83
Hainan0.550.215.6419.2930.891.115.3621.6241.155.8210.4713.49
Chongqing6.2114.8918.3036.84122.29702.4120.1425.5556.62125.3125.9414.66
Sichuan976.29328.146.815.24355.30222.3612.933.13218.17130.0913.9862.80
Guizhou139.0216.105.1522.07105.8319.3913.4932.0768.2411.4026.0339.93
Yunnan481.5952.8110.2629.47215.8068.1522.7719.63105.5036.0222.3395.88
Shaanxi9.41225.3167.3765.5031.02503.6430.7239.3770.97229.3221.1863.37
Gansu18.9519.5114.3247.796.130.6330.9182.4998.384.175.2446.39
Qinghai0.810.108.9154.551.510.227.3593.150.974.1133.2377.29
Ningxia5.460.187.0263.8823.520.946.8351.0959.421.348.9222.68
Xinjiang9.630.3323.3994.744.220.2717.21110.44149.145.013.55177.40
Total11,092.0913,112.04657.09815.4111,964.6315,332.06593.66925.297578.0619,814.17660.991286.01

References

  1. Velicogna, I.; Mohajerani, Y.; Landerer, F.; Mouginot, J.; Noel, B.; Rignot, E.; Sutterley, T.; van den Broeke, M.; van Wessem, M.; Wiese, D. Continuity of Ice Sheet Mass Loss in Greenland and Antarctica From the GRACE and GRACE Follow-On Missions. Geophys. Res. Lett. 2020, 47, e2020GL087291. [Google Scholar] [CrossRef] [Green Version]
  2. IPCC. The 2006 IPCC Guidelines for National Greenhouse Gas Inventories (2006 Guidelines). Available online: http://www.ipcc-nggip.iges.or.jp/public/2006gl/index.html. (accessed on 12 August 2021).
  3. Cheng, M.; Ries, J. The unexpected signal in GRACE estimates of C20. J. Geod. 2017, 91, 897–914. [Google Scholar] [CrossRef]
  4. Wen, L.; Li, Z. Provincial-level industrial CO2 emission drivers and emission reduction strategies in China: Combining two-layer LMDI method with spectral clustering. Sci. Total Environ. 2020, 700, 134374. [Google Scholar] [CrossRef]
  5. Acquaye, A.A.; Duffy, A.P. Input-output analysis of Irish construction sector greenhouse gas emissions. Build. Environ. 2010, 45, 784–791. [Google Scholar] [CrossRef] [Green Version]
  6. American Meteorological Society. State of the Climate in 2019; 0003-0007; American Meteorological Society: Boston, MA, USA, 2020; pp. S1–S429. [Google Scholar]
  7. Guo, J.E.; Zhang, Z.; Meng, L. China’s provincial CO2 emissions embodied in international and interprovincial trade. Energy Policy 2012, 42, 486–497. [Google Scholar] [CrossRef]
  8. Ogungbile, A.J.; Shen, G.Q.; Wuni, I.Y.; Xue, J.; Hong, J. A Hybrid Framework for Direct CO2 Emissions Quantification in China’s Construction Sector. Int. J. Environ. Res. Public Health 2021, 18, 11965. [Google Scholar] [CrossRef] [PubMed]
  9. Shen, L.; Wu, Y.; Lou, Y.; Zeng, D.; Shuai, C.; Song, X. What drives the carbon emission in the Chinese cities?—A case of pilot low carbon city of Beijing. J. Clean. Prod. 2018, 174, 343–354. [Google Scholar] [CrossRef]
  10. Lin, B.; Liu, H. CO2 mitigation potential in Chinua’s bilding construction industry: A comparison of energy performance. Build. Environ. 2015, 94, 239–251. [Google Scholar] [CrossRef]
  11. Chen, G.Q.; Zhang, B. Greenhouse gas emissions in China 2007: Inventory and input-output analysis. Energy Policy 2010, 38, 6180–6193. [Google Scholar] [CrossRef]
  12. Huang, L.; Krigsvoll, G.; Johansen, F.; Liu, Y.; Zhang, X. Carbon emission of global construction sector. Renew. Sustain. Energy Rev. 2018, 81, 1906–1916. [Google Scholar] [CrossRef] [Green Version]
  13. CEIC. Census and Economic Information Center, China Database. CDMNext. Available online: https://www.ceicdata.com/en/country/china (accessed on 21 September 2021).
  14. Zhang, L.; Liu, B.; Du, J.; Liu, C.; Wang, S. CO2 emission linkage analysis in global construction sectors: Alarming trends from 1995 to 2009 and possible repercussions. J. Clean. Prod. 2019, 221, 863–877. [Google Scholar] [CrossRef]
  15. Chen, W.D.; Wu, F.Y.; Geng, W.X.; Yu, G.Y. Carbon emissions in China’s industrial sectors. Resour. Conserv. Recycl. 2017, 117, 264–273. [Google Scholar] [CrossRef]
  16. Chen, J.; Shen, L.; Shi, Q.; Hong, J.; Ochoa, J.J. The effect of production structure on the total CO2 emissions intensity in the Chinese construction industry. J. Clean. Prod. 2019, 213, 1087–1095. [Google Scholar] [CrossRef]
  17. Chen, J.; Shi, Q.; Shen, L.; Huang, Y.; Wu, Y. What makes the difference in construction carbon emissions between China and USA? Sustain. Cities Soc. 2019, 44, 604–613. [Google Scholar] [CrossRef]
  18. Shi, Q.; Chen, J.; Shen, L. Driving factors of the changes in the carbon emissions in the Chinese construction industry. J. Clean. Prod. 2017, 166, 615–627. [Google Scholar] [CrossRef]
  19. Khanal, B.R.; Gan, C.; Becken, S. Tourism Inter-Industry Linkages in the Lao PDR Economy: An Input—Output Analysis. Tour. Econ. 2014, 20, 171–194. [Google Scholar] [CrossRef] [Green Version]
  20. Zhang, L.; Liu, B.; Du, J.; Liu, C.; Li, H.; Wang, S. Internationalization trends of carbon emission linkages: A case study on the construction sector. J. Clean. Prod. 2020, 270, 122433. [Google Scholar] [CrossRef]
  21. Huang, Y.; Duan, H.; Dong, D.; Song, Q.; Zuo, J.; Jiang, W. How to evaluate the efforts on reducing CO2 emissions for megacities? Public building practices in Shenzhen city. Resour. Conserv. Recycl. 2019, 149, 427–434. [Google Scholar] [CrossRef]
  22. Wang, J.; Wang, Z.; Peng, S.; Li, C.; Wei, L. Tracing CO2 emissions of China’s construction sector. J. Clean. Prod. 2020, 275, 124165. [Google Scholar] [CrossRef]
  23. Guan, J.; Jiang, L.; Zhang, Z. Structural decomposition analysis of the growth in the Chinese construction sector’s embodied energy. Res. Environ. Sci. 2016, 29, 1718–1724. [Google Scholar] [CrossRef]
  24. Wang, Y.; Wang, W.; Mao, G.; Cai, H.; Zuo, J.; Wang, L.; Zhao, P. Industrial CO2 emissions in China based on the hypothetical extraction method: Linkage analysis. Energy Policy 2013, 62, 1238–1244. [Google Scholar] [CrossRef]
  25. Hong, J.K.; Zhang, X.L.; Shen, Q.P.; Zhang, W.Q.; Feng, Y. A multi-regional based hybrid method for assessing life cycle energy use of buildings: A case study. J. Clean. Prod. 2017, 148, 760–772. [Google Scholar] [CrossRef]
  26. Costinot, A.; Rodríguez-Clare, A. Chapter 4-Trade Theory with Numbers: Quantifying the Consequences of Globalization. In Handbook of International Economics; Gopinath, G., Helpman, E., Rogoff, K., Eds.; Elsevier: Amsterdam, The Netherlands, 2014; Volume 4, pp. 197–261. [Google Scholar]
  27. Ang, B.W. Decomposition analysis for policy-making in energy: Which is the preferred method? Energy Policy 2004, 32, 1131–1139. [Google Scholar] [CrossRef]
  28. Lenzen, M. Aggregating input–output systems with minimum error. Econ. Syst. Res. 2019, 31, 594–616. [Google Scholar] [CrossRef]
  29. Zhang, X.; Li, Z.; Ma, L.W.; Chong, C.H.; Ni, W.D. Forecasting the Energy Embodied in Construction Services Based on a Combination of Static and Dynamic Hybrid Input-Output Models. Energies 2019, 12, 300. [Google Scholar] [CrossRef] [Green Version]
  30. Su, B.; Ang, B.W. Structural decomposition analysis applied to energy and emissions: Some methodological developments. Energy Econ. 2012, 34, 177–188. [Google Scholar] [CrossRef]
  31. Wang, Z.; Su, B.; Xie, R.; Long, H. China’s aggregate embodied CO2 emission intensity from 2007 to 2012: A multi-region multiplicative structural decomposition analysis. Energy Econ. 2020, 85, 104568. [Google Scholar] [CrossRef]
  32. Hong, J.; Li, C.Z.; Shen, Q.; Xue, F.; Sun, B.; Zheng, W. An Overview of the driving forces behind energy demand in China’s construction industry: Evidence from 1990 to 2012. Renew. Sustain. Energy Rev. 2017, 73, 85–94. [Google Scholar] [CrossRef]
  33. Leal, P.A.; Marques, A.C.; Fuinhas, J.A. Decoupling economic growth from GHG emissions: Decomposition analysis by sectoral factors for Australia. Econ. Anal. Policy 2019, 62, 12–26. [Google Scholar] [CrossRef]
  34. Das, A.; Paul, S.K. CO2 emissions from household consumption in India between 1993-94 and 2006-07: A decomposition analysis. Energy Econ. 2014, 41, 90–105. [Google Scholar] [CrossRef]
  35. Duarte, R.; Sánchez-Chóliz, J.; Bielsa, J. Water use in the Spanish economy: An input–output approach. Ecol. Econ. 2002, 43, 71–85. [Google Scholar] [CrossRef]
  36. Jiang, R.; Zhou, Y.; Li, R. Moving to a low-carbon economy in China: Decoupling and decomposition analysis of emission and economy from a sector perspective. Sustainability 2018, 10, 978. [Google Scholar] [CrossRef] [Green Version]
  37. Ang, B.W.; Zhang, F.Q. A survey of index decomposition analysis in energy and environmental studies. Energy 2000, 25, 1149–1176. [Google Scholar] [CrossRef]
  38. Itoh, H. Understanding of economic spillover mechanism by structural path analysis: A case study of interregional social accounting matrix focused on institutional sectors in Japan. J. Econ. Struct. 2016, 5, 22. [Google Scholar] [CrossRef] [Green Version]
  39. Lenzen, M. Environmentally important paths, linkages and key sectors in the Australian economy. Struct. Change Econ. Dyn. 2003, 14, 1–34. [Google Scholar] [CrossRef]
  40. Zhao, Y.; Zhang, Z.; Wang, S.; Zhang, Y.; Liu, Y. Linkage analysis of sectoral CO2 emissions based on the hypothetical extraction method in South Africa. J. Clean. Prod. 2015, 103, 916–924. [Google Scholar] [CrossRef]
  41. Wang, J.M.; Shi, Y.F.; Zhao, X.; Zhang, X.T. Factors Affecting Energy-Related Carbon Emissions in Beijing-Tianjin-Hebei Region. Math. Probl. Eng. 2017, 2017, 1524023. [Google Scholar] [CrossRef] [Green Version]
  42. Dietzenbacher, E.; Los, B.; Stehrer, R.; Timmer, M.; de Vries, G. The construction of world input–output tables in the wiod project. Econ. Syst. Res. 2013, 25, 71–98. [Google Scholar] [CrossRef]
  43. Cella, G. The input-output measurement of interindustry linkages. Oxf. Bull. Econ. Stat. 1984, 46, 73–84. [Google Scholar] [CrossRef]
  44. Chen, Y.; Ma, L.; Zhu, Z. The environmental-adjusted energy efficiency of China’s construction industry: A three-stage undesirable SBM-DEA model. Environ. Sci. Pollut. Res. 2021, 28, 58442–58455. [Google Scholar] [CrossRef]
  45. Chi, Y.; Liu, Z.; Wang, X.; Zhang, Y.; Wei, F. Provincial CO2 emission measurement and analysis of the construction industry under china’s carbon neutrality target. Sustainability 2021, 13, 1876. [Google Scholar] [CrossRef]
  46. Hung, C.C.W.; Hsu, S.C.; Cheng, K.L. Quantifying city-scale carbon emissions of the construction sector based on multi-regional input-output analysis. Resour. Conserv. Recycl. 2019, 149, 75–85. [Google Scholar] [CrossRef]
  47. Li, F.; Chen, J. Regional Differences and Dynamic Evolution of CO2 Emissions Distribution in China’s Construction Industry. J. Phys. Conf. Ser. 2020, 1624, 042038. [Google Scholar] [CrossRef]
  48. Jia, N.; Gao, X.; Liu, D.; Shi, J.; Jiang, M. Identification and evolution of critical betweenness sectors and transactions from the view of CO2 reduction in supply chain network. J. Clean. Prod. 2019, 232, 163–173. [Google Scholar] [CrossRef]
  49. Li, F.; Chen, J. Which Provinces Should Pay More Attention to CO2 Emissions in China’s Construction Industry? In Proceedings of the IOP Conference Series: Materials Science and Engineering, Ulaanbaatar, Mongolia, 10–13 September 2020.
  50. Leontief, W. Environmental Repercussions and the Economic Structure: An Input-Output Approach. Rev. Econ. Stat. 1970, 52, 262–271. [Google Scholar] [CrossRef]
  51. Miller, R.E.; Blair, P.D. Input-Output Analysis: Foundations and Extensions, 2nd ed.; Cambridge University Press: Cambridge, UK, 2009. [Google Scholar]
  52. Schultz, S. Approaches to identifying key sectors empirically by means of input-output analysis. J. Dev. Stud. 1977, 14, 77–96. [Google Scholar] [CrossRef]
  53. Zhang, Y.-J.; Bian, X.-J.; Tan, W. The linkages of sectoral carbon dioxide emission caused by household consumption in China: Evidence from the hypothetical extraction method. Empir. Econ. 2018, 54, 1743–1775. [Google Scholar] [CrossRef]
  54. Pasinetti, L.L. Contributi Alla Teoria della Produzione Congiunta—Production functions (Economic theory); Il mulino: New York, NY, USA, 1977. [Google Scholar]
  55. CEADs. Carbon Emissions Accounts and Datasets for Emerging Economies-Emission Inventories by Sectoral Approach. Available online: https://www.ceads.net/data/province/ (accessed on 11 July 2021).
  56. Suh, S. Are Services Better for Climate Change? Environ. Sci. Technol. 2006, 40, 6555–6560. [Google Scholar] [CrossRef] [Green Version]
  57. Ahmed Ali, K.; Ahmad, M.I.; Yusup, Y. Issues, Impacts, and Mitigations of Carbon Dioxide Emissions in the Building Sector. Sustainability 2020, 12, 7427. [Google Scholar] [CrossRef]
  58. Giesekam, J.; Barrett, J.R.; Taylor, P. Construction sector views on low carbon building materials. Build. Res. Inf. 2016, 44, 423–444. [Google Scholar] [CrossRef]
  59. Wang, H.; Liu, G.; Shi, K. What Are the Driving Forces of Urban CO2 Emissions in China? A Refined Scale Analysis between National and Urban Agglomeration Levels. Int. J. Environ. Res. Public Health 2019, 16, 3692. [Google Scholar] [CrossRef] [Green Version]
  60. Liu, Y.; Gao, C.; Lu, Y. The impact of urbanization on GHG emissions in China: The role of population density. J. Clean. Prod. 2017, 157, 299–309. [Google Scholar] [CrossRef]
  61. Cheng, M.; Lu, Y.; Zhu, H.; Xiao, J. Measuring CO2 emissions performance of China’s construction industry: A global Malmquist index analysis. Environ. Impact Assess. Rev. 2022, 92, 106673. [Google Scholar] [CrossRef]
  62. Akan, M.O.A.; Dhavale, D.G.; Sarkis, J. Greenhouse gas emissions in the construction industry: An analysis and evaluation of a concrete supply chain. J. Clean. Prod. 2017, 167, 1195–1207. [Google Scholar] [CrossRef]
  63. Gao, Q.; Liu, B.; Sun, J.; Liu, C.; Xu, Y. Trade decomposition of CO2 emissions of global construction industries. Eng. Constr. Archit. Manag. 2021. [Google Scholar] [CrossRef]
Figure 1. Conceptual diagram of provincial construction CO2 emission linkages.
Sustainability 13 13917 g001
Figure 2. Total CO2 emission linkages of provincial construction sectors in China.
Sustainability 13 13917 g002aSustainability 13 13917 g002b
Figure 3. Construction sectors’ total CO2 emissions per population density.
Sustainability 13 13917 g003
Figure 4. Backward CO2 emission linkages of provincial construction sectors in China.
Sustainability 13 13917 g004aSustainability 13 13917 g004b
Figure 5. Forward CO2 emission linkages of provincial construction sectors in China.
Sustainability 13 13917 g005aSustainability 13 13917 g005b
Figure 6. Transferred backward CO2 emission linkages.
Sustainability 13 13917 g006aSustainability 13 13917 g006b
Figure 7. Transferred forward CO2 emission linkages.
Sustainability 13 13917 g007aSustainability 13 13917 g007b
Table 1. Extended CO2 emissions multi-regional input–output table.
Output/InputIntermediate Outputs Final Demands CO₂ Emissions
pqTotalpqTotalTotal OutputAmountIntensity
1jn1lm
Intermediate Inputs...
r1
i U i j r p U i l r q U i r f i r p f i r q F i r T i r C i r e i r
n
s1
k U k j s p U k l s q U k s f k s p f k s q F k s T k s C k s e k s
m
...
Total U j p U l q
Total Value Added V j p V l q
Total Input T j p T l q
Table 2. Total and direct CO2 emissions of China’s economic sectoral structure.
CategoriesBlocksSectorsAverage Direct Emissions Intensity (t/104 ¥)Average Total Emissions Intensity (t/104 ¥)
201220152017201220152017
High-carbon IndustryB1: Energy IndustriesAll primary energy sectors, e.g., power sectors, water sectors9.897.958.5114.8712.1112.45
B2: Construction IndustryConstruction industry6.424.884.858.957.136.19
B3: Transportation IndustryTransportation and transportation ancillaries1.150.900.842.502.031.74
Medium-Carbon IndustriesB4: Basic IndustriesNon-fossil fuels; chemical; mining; minerals; metal; and nonmetal industries0.810.750.762.622.342.09
B5: Agriculture IndustryAll related agricultural industries (crops, hunting, fisheries etc.)0.180.140.150.910.820.49
Low-Carbon IndustriesB6: Light industriesFood, beverages, timber, leather, textile, and other manufacturing sectors0.090.060.060.630.600.33
B7: Service IndustriesRetail and catering, real estate, other service industries0.070.070.050.840.770.47
B8: Information and Communication Technology IndustriesElectronic, internet, and communication sectors0.050.050.051.051.020.61
Table 3. Mixed and net backward CO2 emission linkages of construction sectors.
ProvinceMBE (tCO2)NBE (tCO2)Relative Indices
201220152017
201220152017201220152017MBENBEMBENBEMBENBE
Beijing23.4613.4817.41378.24332.97531.235.8%94.2%3.9%96.1%3.2%96.8%
Tianjin15.0619.9921.081483.03318.00434.941.0%99.0%5.9%94.1%4.6%95.4%
Hebei3.347.445.27266.53557.681128.671.2%98.8%1.3%98.7%0.5%99.5%
Shanxi8.598.368.1866.7193.7088.5511.4%88.6%8.2%91.8%8.5%91.5%
Inner Mongolia20.8012.0212.99481.80168.04504.034.1%95.9%6.7%93.3%2.5%97.5%
Liaoning17.797.476.82792.94715.27779.942.2%97.8%1.0%99.0%0.9%99.1%
Jilin7.6812.952.72439.68251.53910.111.7%98.3%4.9%95.1%0.3%99.7%
Heilongjiang2.551.850.74809.8158.01134.140.3%99.7%3.1%96.9%0.5%99.5%
Shanghai9.8611.556.503269.02770.831001.110.3%99.7%1.5%98.5%0.6%99.4%
Jiangsu5.733.441.34393.09725.85736.621.4%98.6%0.5%99.5%0.2%99.8%
Zhejiang60.0497.1830.413095.333685.303288.661.9%98.1%2.6%97.4%0.9%99.1%
Anhui5.9511.0912.52227.66303.22682.462.5%97.5%3.5%96.5%1.8%98.2%
Fujian8.5913.043.47242.571167.6227.523.4%96.6%1.1%98.9%11.2%88.8%
Jiangxi1.845.212.44126.28394.621470.511.4%98.6%1.3%98.7%0.2%99.8%
Shandong34.0235.896.81591.191912.03700.365.4%94.6%1.8%98.2%1.0%99.0%
Henan28.3556.818.071827.133626.641325.061.5%98.5%1.5%98.5%0.6%99.4%
Hubei30.1366.6566.65975.37456.88456.883.0%97.0%12.7%87.3%12.7%87.3%
Hunan28.3857.7953.77275.071148.892174.839.4%90.6%4.8%95.2%2.4%97.6%
Guangdong51.8742.493.455898.077847.759331.950.9%99.1%0.5%99.5%0.0%100.0%
Guangxi0.601.060.24259.11346.26263.520.2%99.8%0.3%99.7%0.1%99.9%
Hainan0.063.351.080.7632.0046.977.3%92.7%9.5%90.5%2.2%97.8%
Chongqing0.579.571.9821.11824.70181.932.6%97.4%1.1%98.9%1.1%98.9%
Sichuan62.1348.1522.151304.43577.66348.274.5%95.5%7.7%92.3%6.0%94.0%
Guizhou10.1717.3614.98155.12125.2279.646.2%93.8%12.2%87.8%15.8%84.2%
Yunnan26.6738.4913.21534.40283.95141.524.8%95.2%11.9%88.1%8.5%91.5%
Shaanxi2.673.632.49234.72534.66300.291.1%98.9%0.7%99.3%0.8%99.2%
Gansu4.612.604.5038.466.75102.5510.7%89.3%27.8%72.2%4.2%95.8%
Qinghai1.071.951.950.911.735.0854.0%46.0%53.0%47.0%27.7%72.3%
Ningxia0.552.071.475.6324.4660.768.9%91.1%7.8%92.2%2.4%97.6%
Xinjiang0.840.530.619.964.49154.147.8%92.2%10.6%89.4%0.4%99.6%
Table 4. Mixed and net forward CO2 emission linkages of construction sectors.
ProvinceMFE (MtCO2)NFE (MtCO2)Relative Indices
201220152017
201220152017201220152017MFENFEMFENFEMFENFE
Beijing0.770.8417.41378.24332.97531.230.2%99.8%0.3%99.7%3.2%96.8%
Tianjin3.100.7621.081483.03318.00434.940.2%99.8%0.2%99.8%4.6%95.4%
Hebei2.373.035.27266.53557.681128.670.9%99.1%0.5%99.5%0.5%99.5%
Shanxi0.170.278.1866.7193.7088.550.3%99.7%0.3%99.7%8.5%91.5%
Inner Mongolia1.521.4212.99481.80168.04504.030.3%99.7%0.8%99.2%2.5%97.5%
Liaoning1.211.396.82792.94715.27779.940.2%99.8%0.2%99.8%0.9%99.1%
Jilin1.531.002.72439.68251.53910.110.3%99.7%0.4%99.6%0.3%99.7%
Heilongjiang0.750.250.74809.8158.01134.140.1%99.9%0.4%99.6%0.5%99.5%
Shanghai1.780.686.503269.02770.831001.110.1%99.9%0.1%99.9%0.6%99.4%
Jiangsu0.851.661.34393.09725.85736.620.2%99.8%0.2%99.8%0.2%99.8%
Zhejiang0.851.3830.413095.333685.303288.660.0%100.0%0.0%100.0%0.9%99.1%
Anhui0.831.0512.52227.66303.22682.460.4%99.6%0.3%99.7%1.8%98.2%
Fujian0.363.563.47242.571167.6227.520.1%99.9%0.3%99.7%11.2%88.8%
Jiangxi0.341.202.44126.28394.621470.510.3%99.7%0.3%99.7%0.2%99.8%
Shandong0.681.046.81591.191912.03700.360.1%99.9%0.1%99.9%1.0%99.0%
Henan1.783.908.071827.133626.641325.060.1%99.9%0.1%99.9%0.6%99.4%
Hubei0.770.3366.65975.37456.88456.880.1%99.9%0.1%99.9%12.7%87.3%
Hunan0.400.8853.77275.071148.892174.830.1%99.9%0.1%99.9%2.4%97.6%
Guangdong2.082.273.455898.077847.759331.950.0%100.0%0.0%100.0%0.0%100.0%
Guangxi0.240.380.24259.11346.26263.520.1%99.9%0.1%99.9%0.1%99.9%
Hainan0.000.171.080.7632.0046.970.0%100.0%0.5%99.5%2.2%97.8%
Chongqing0.050.891.9821.11824.70181.930.2%99.8%0.1%99.9%1.1%98.9%
Sichuan0.590.4722.151304.43577.66348.270.0%100.0%0.1%99.9%6.0%94.0%
Guizhou0.310.2414.98155.12125.2279.640.2%99.8%0.2%99.8%15.8%84.2%
Yunnan0.470.1913.21534.40283.95141.520.1%99.9%0.1%99.9%8.5%91.5%
Shaanxi1.362.122.49234.72534.66300.290.6%99.4%0.4%99.6%0.8%99.2%
Gansu0.420.184.5038.466.75102.551.1%98.9%2.6%97.4%4.2%95.8%
Qinghai0.010.031.950.911.735.081.1%98.9%1.7%98.3%27.7%72.3%
Ningxia0.120.331.475.6324.4660.762.1%97.9%1.3%98.7%2.4%97.6%
Xinjiang0.170.080.619.964.49154.141.7%98.3%1.8%98.2%0.4%99.6%
Publisher’s Note: MDPI stays neutral with regard to jurisdictional claims in published maps and institutional affiliations.

