Design of An Integration Model for Air Cargo Transportation Network Design and Flight Route Selection


1
Department of Industrial Engineering, the Hong Kong Polytechnic University, Hung Hom, Kowloon, Hong Kong 999077, China
2
Department of Information Management and Engineering, Zhejiang University of Finance & Economics, Hangzhou 310018, China
3
Department of Industrial Engineering, the Hong Kong Polytechnic University, Hung Hom, Kowloon, Hong Kong 999077, China
*
Author to whom correspondence should be addressed.
Sustainability 2019, 11(19), 5197; https://doi.org/10.3390/su11195197
Submission received: 20 August 2019
/
Revised: 18 September 2019
/
Accepted: 19 September 2019
/
Published: 23 September 2019
(This article belongs to the Special Issue Toward Sustainability: Reliable Transportation Network Design and Analysis)
Abstract
:Air cargo transportation is an essential component in the freight transportation market, primarily due to the transportation requirements of time-sensitive products. Air cargo transportation plays an increasingly important role alongside economic development. Cargo flight network design and fleet routing selection significantly affect the performance of the air cargo transportation. In this research, we propose an integrated model simultaneously considering cargo flight network design and the fleet routing selection for the air cargo transportation. Two transportation modes, the direct transportation mode in point-to-point networks and the transshipment mode in hub-and-spoke networks, are compared. In order to solve the proposed optimization problem, a swarm-intelligence-based algorithm is adapted. Numerical experiments were conducted to examine and validate the effectiveness and efficiency of the proposed model and algorithm. The computational results suggest that the proper settings of hub and transshipment route selection in an air cargo transportation network can significantly reduce the transportation cost, which can provide practical managerial insights for the air cargo transportation industry.
1. Introduction
The importance of air cargo transportation rises in step with economic development. Air cargo is an essential part of the global trading system [1]. The IATA annual review shows that in 2016, airlines transported 53.9 million metric tons of goods, representing more than 35% of global trade by value but less than 1% of world trade by volume, and it is reported that the average yearly growth of air cargo in 2017 and 2018 were 9.7% and 3.4%, respectively, among which the latter is partially due to protectionist policies [2]. Moreover, according to the world air cargo forecast provided by Boeing, the world air cargo traffic will more than double over the next twenty years. Among all the transported air cargoes, a large proportion is accomplished using mixed cargo–passenger aircrafts, especially in developing countries, which results in the dominance of air passenger transportation management over air cargo transportation [3]. The application of mixed cargo–passenger aircrafts favors the requirements of passengers as the first priority, and cannot satisfy the rapid development of air cargo transportation [4,5]. Therefore, the utilization of dedicated cargo aircraft for air cargo transportation is gradually becoming popular due to the development of e-commerce and express delivery. For example, Shunfeng (one major logistics company in China) has not only purchased more than 40 airplanes dedicated to air cargo transportation, but also built its own air cargo airport in Hubei province acting as its international logistics hub. The development of air cargo transportation is an inevitable trend along with regional and national economic development [6].
Air cargo transportation differs from air passenger transportation in many respects. Kasilingam [7] firstly explored similarities and differences between passenger and cargo capacity management in the airline context. The hub selection of passenger service networks usually involves long-term planning; in contrast, cargo movement is more flexible and dynamic [8]. Moreover, passengers are more time-sensitive than cargo, which means that passengers prefer direct flights, while cargo may be transshipped multiple times as long as it can be delivered on time. Therefore, existing passenger transportation networks and flight routes need to be adjusted in order to meet the latest requirements of air cargo transportation.
Airline network design underpins the performance of air cargo transportation. Two types of airline network (i.e., point-to-point and hub-and-spoke) and their combination are commonly observed in practice [9,10]. The comparison of these two network types has been conducted in many studies. For example, Lin et al. [11] compared the economic effect of center-to-center directs on hub-and-spoke networks for air express common carriers. Furthermore, they proposed an integral constrained generalized hub-and-spoke network design model in a capacitated and directed network configuration [12]. The point-to-point network is also known as direct transportation, which is suitable for the transportation of time-sensitive goods. Comparatively, the hub-and-spoke network suits transshipment transportation as it is capable of flow consolidation and dissemination [13]. The construction of the hub-and-spoke network comprises two components: the determination of hubs and the allocation of non-hub nodes to hubs. Oktal and Ozger [14] conducted a case study to determine the location of hub airports in air cargo transportation. O’Kelly et al. [15] firstly compared the hub network design with single and multiple allocation strategies, then further analyzed the flow economies of scale under different location strategies [16]. Bryan and O’Kelly [17] provided an analytical review regarding the design of hub-and-spoke networks. Kim [18] once introduced a p-hub protection model aiming to maximize the total interacting traffic over a set of origin–destination nodes based on different routing strategies. In addition to the air cargo transportation network design, the selection of an air cargo transportation route can be significantly different from air passenger transport routes. Kasilingam [7] pointed out that cargo can be shipped among different routes as long as it arrives at its destination on time. Especially in hub-and-spoke networks, the transshipment transportation of air cargo becomes a promising and popular trend in view of the low transportation cost. Ohashi et al. [19] applied an aggregate multinomial logit model to identify the critical factors influencing air cargo transshipment route choice decisions. Kim and Park [20] investigated the degree and quality of transshipment connectivity in an air cargo hub.
In this research, we propose an integrated model for air cargo transportation network design and flight route selection in view of the practical requirements of air cargo transportation. The balance between time-sensitivity and flow economy of scale can be handled by the integration of point-to-point network and hub-and-spoke network, and the corresponding flight route selection and transshipment arrangements. Due to the NP complexity feature of the proposed model, a swarm-intelligence-based approach is employed in this research. Swarm-intelligence-based approaches derive from the collective and intelligent foraging or hunting behavior of social insects and group animals. Among multiple swarm-intelligence-based approaches, the artificial bee colony (ABC) algorithm is one popular example, which is capable of balancing the diversified and intensified search performance by the proper adjustment of the involved parameters and control mechanisms, and can reach convergence in an acceptable computational time. A succinct solution representation scheme containing adequate information on hub determination and route selection was designed using the ABC algorithm’s search process. After that, a number of numerical experiments were conducted to examine and validate the performance of the proposed mathematical model and algorithm. The results indicate that the application of a hub-and-spoke network and transshipment can generate substantial savings in transportation costs, where the number of hubs and their determination are the critical factors.
The remainder of this paper is organized as follows. After the introduction of air cargo transportation and a brief review of the relevant literature, a mathematical formulation of the emerging problem is provided in Section 2. Section 3 describes the solution approach. Numerical experiments were conducted as presented in Section 4 to validate the effectiveness and efficiency of the proposed model and method. Finally, the conclusions are drawn in Section 5.
2. Problem Formulation
In this research, in order to construct the air cargo transportation network, full network connectivity was initially assumed. Regarding the hub allocation, we assumed that one non-hub node was associated with at most one designated hub, and that one hub node served the transshipment requirements of multiple non-hub airports within its coverage. The air cargo transportation in between each origin–destination pair had three possible scenarios, that is, direct transportation as , one-time transshipment at a hub as , and two transshipments at two consecutive hubs as , respectively. The shipment requirement from a specific origin node to a particular destination node cannot be split. A homogenous fleet of flights was assumed, with the same capacity and speed. Both the non-hub node and hub had enough flights to handle the transportation and transshipment demand. The operational time at the origin and destination nodes was not considered, but the transshipment time at the hub was considered if transshipment was needed. The problem was to determine which airport(s) could be redesigned as a hub airport, which non-hub airport(s) it/they served, and the transportation routes between each origin–destination (OD) pair.
The following notations were used to construct the air cargo transportation network.
| The set of nodes | |
| The cost of operating hub | |
| The predetermined number of hubs | |
| The maximum distance between a non-hub node and its associated hub | |
| The distance between nodes and | |
| The transportation cost between nodes and per shipment unit, per distance unit | |
| The discount factor for inter-hub transportation due to the economies of scale () | |
| The discount factor for the transportation cost between a non-hub node and a hub due to the economies of scale () | |
| The transshipment cost at hub per shipment unit | |
| The quantity of shipments from node to node |
The decision variables used in this research are described as follows.
| Whether node is a hub or not | |
| Whether the non-hub node is associated with hub or not | |
| The direct transportation between the origin node and the destination node | |
| The transportation between the origin node and the destination node , transshipped at hub | |
| The transportation between the origin node and the destination node , transshipped at hubs and |
The complete mathematical problem is described as follows.
| Objective | |
| (1) | |
| Subject to | |
| (2) | |
| (3) | |
| (4) | |
| (5) | |
| (6) | |
| (7) | |
| (8) | |
| (9) | |
| (10) | |
| (11) | |
| (12) | |
| (13) | |
| (14) | |
| (15) | |
| (16) | |
| (17) |
The objective function (1) is to minimize the entire cost, which consists of the air cargo transportation cost as illustrated in the first three terms, the transshipment cost as illustrated in the fourth and fifth terms, and the hub operating cost as illustrated in the sixth term. Constraint (2) indicates that a non-hub node can only be associated with an open hub. Constraint (3) reveals that a non-hub node can only be assigned to one hub. Constraint (4) means the number of hubs cannot exceed a predetermined number. Constraint (5) indicates that the distance between a non-hub node and its associated hub shall be within a reasonable distance range. Constraints (6) and (7) describe one-time transshipment transportation provided that the origin and destination node are associated with the same hub node. Constraints (8) and (9) describe the corresponding relationship between decision variables. Constraints (10) and (11) describe the two-time transshipment transportation provided that non-hub nodes and are associated with hub nodes and , respectively. Constraints (12) and (13) describe the relation between decision variables in the case of two-time transshipment. Constraint (14) expresses that there is only one option for the transportation between each OD pair, which can be direct transportation, or one-time transshipment transportation, or two times transshipment transportation. Constraints (15) and (16) indicate that direct transportation is the highest-cost option, and the transshipment operation can lower the transportation cost. Constraint (17) indicates that all decision variables are binary.
3. Solution Approach
In order to solve the proposed model, it was necessary to design a proper code mechanism for representing a candidate solution. A solution scheme with lengthy dimensions would cause a slow convergent search performance. Therefore, the proper solution scheme should be coded as succinctly as possible, yet in way sufficient to reconstruct the complete solution. After determination of the solution representation scheme, the ABC algorithm was employed with appropriate combinations of adjustment parameters and control mechanisms in order find the optimal solution.
3.1. Solution Representation
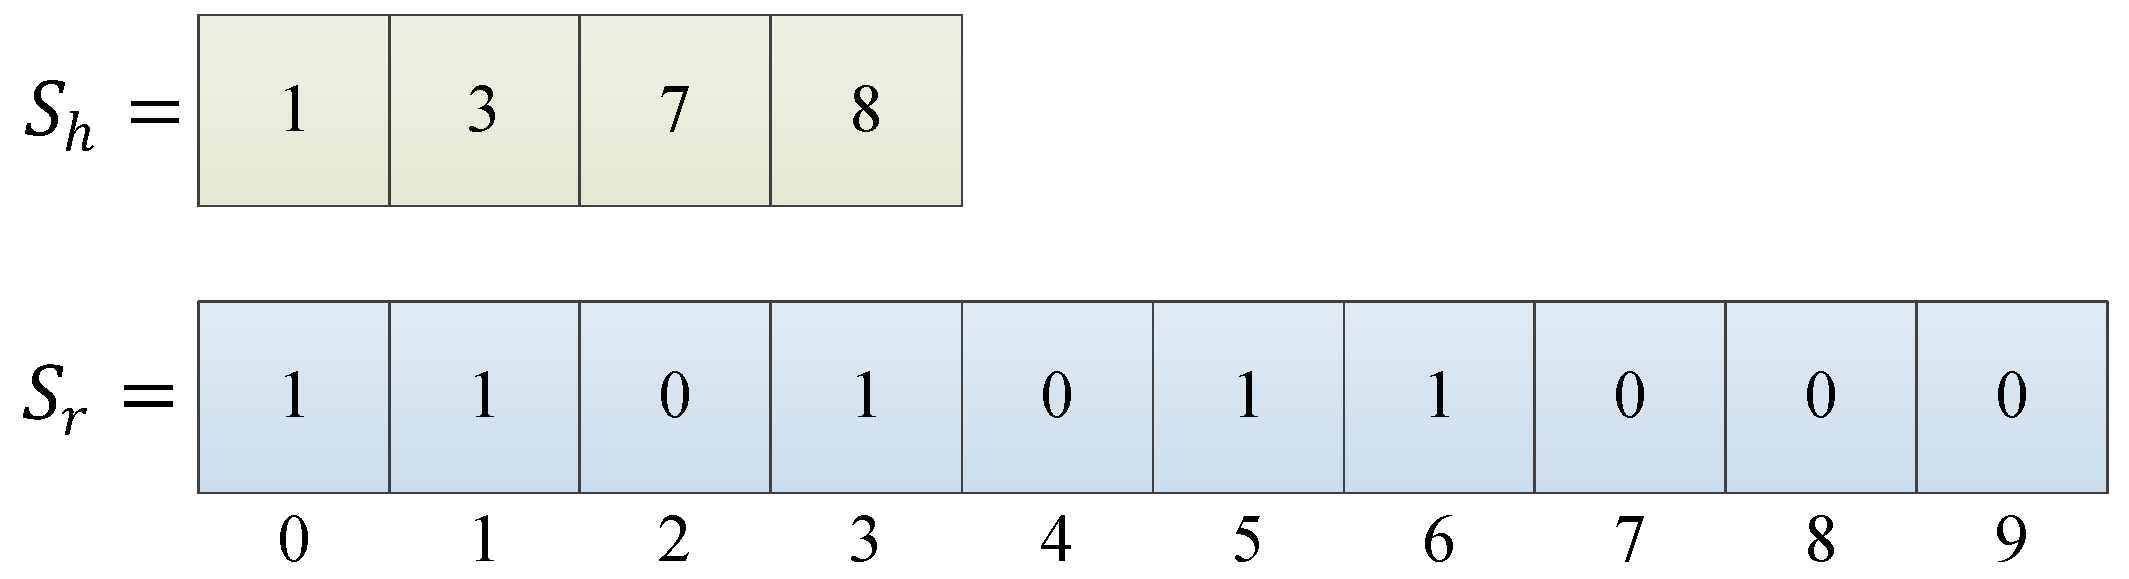
The proposed integrated model comprises two interrelated components: the network design and the route selection. The network design can be divided into two separate sections, the first being hub determination, and the second the allocation between hub nodes and non-hub nodes. Once the hub information is determined, the transportation cost can be calculated if the product transportation goes through transshipment. In this research, we designed a solution scheme as , in which denotes the candidate solution, denotes the hub determined in this network, and denotes whether each OD transportation is transshipped or not. Figure 1 illustrates a solution representation example. In this example, the network is comprised of 10 nodes indexed from 0 to 9, among which node 1, 3, 7, and 8 are designated as hub nodes. Concerning the allocation between hub nodes and non-hub nodes, a non-hub node is allocated to its closest hub node, which is drawn from the available hub node list . For the transportation mode, contains the information of whether transshipment is used. For example, in this case, nodes 0 and 1 transport products to their corresponding destination nodes using transshipment, and node 2 transports its product to its corresponding destination using direct transportation. A similar mechanism was applied to other nodes to calculate their OD transportation distance and cost.
3.2. ABC Algorithm
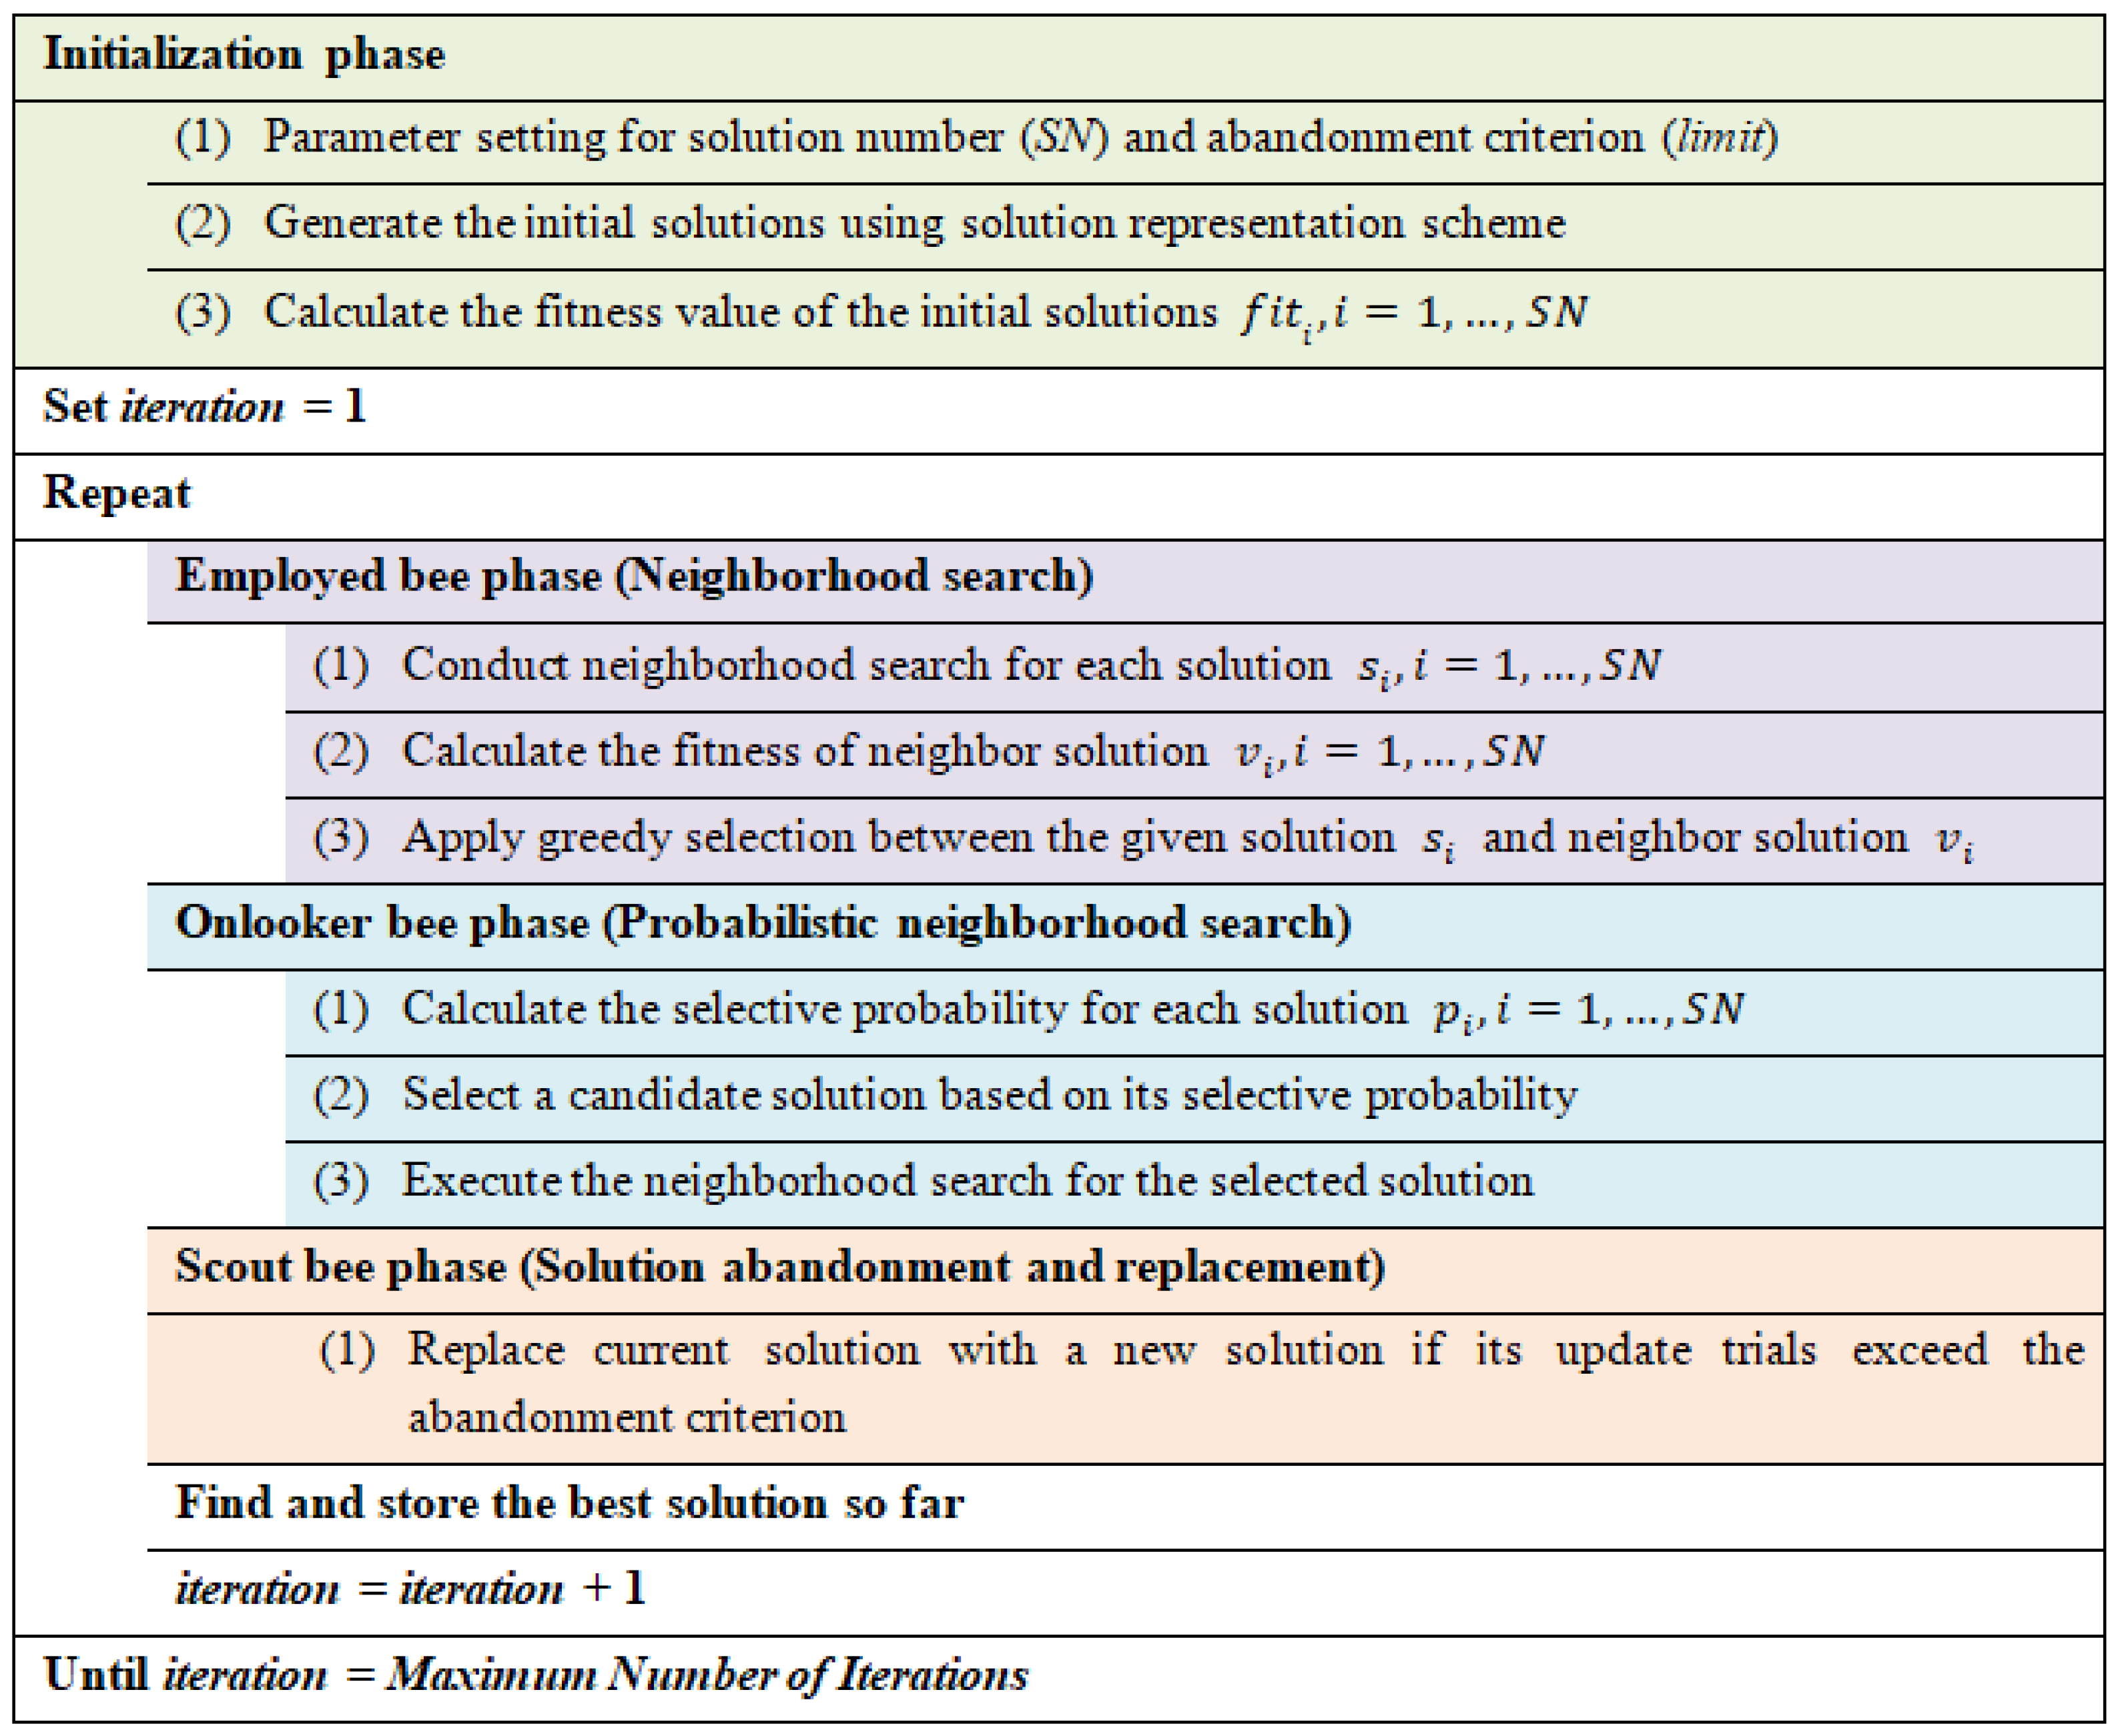
The ABC algorithm was inspired by the searching behavior of honey bees, which can find the most promising food source in a large neighborhood area [21]. A bee colony is composed of three types of bees: scout bees, employed bees, and onlooker bees. Different types of bees carry out different functions. The implementation of the ABC algorithm comprises four distinct phases. Phase 1 is the initialization phase. In this phase, a number of scout bees are sent out to search for food sources in a certain area. One food source corresponds to one solution, and the richness of the food source corresponds to the fitness of the solution. Phase 2 is the employed bee phase. Employed bees are designed to exploit the found food sources. One employed bee exploits one food source, and during the exploitation, it also searches the neighborhood of the current food source to determine whether a better food source exists. If a better food source is found, the corresponding employed bee replaces the current food source with the better one. Phase 3 is the onlooker bee phase. The onlooker bees receive food source information from the employed bees, and then decide whether to follow certain employed bees and repeat the exploitation and exploration operations. Phase 4 is the scout bee phase. As the food sources are gradually consumed, they are abandoned once they are depleted. In this case, scout bees are sent out to find alternative food sources. The pseudo code of the ABC algorithm is presented in Figure 2.
The proper balance between diversification and intensification of the search process is critical to find promising solutions [22]. In the ABC algorithm, this balance is accomplished by the algorithm’s parameter settings and control mechanism. The first parameter is the solution number (SN). More initial solutions indicate a more diversified search. The second parameter is the abandonment criterion, denoted as the limit. A higher abandonment criterion means that the algorithm will preserve the current solution by continuing to dig into its neighborhood search area for better solutions. In this case, the algorithm performs as a more intensified search. Moreover, both the greedy selection mechanism in the neighborhood search process and the probabilistic selection of solutions in the onlooker bee phase can aggravate the intensified search. The search performance using different combinations of parameters and mechanisms is illustrated in the following section.
4. Numerical Experiment
The test instances were designed using the following mechanism. Both the non-hub nodes and the hub nodes were randomly generated within a square range (e.g., 1000 × 1000 km2). Each node had a certain number of items to be transported to a destination node. The transportation amount for each OD pair was randomly generated within a range, such as [1,20] tons. Referring to reference [23], the unit transportation cost was set as 4.9 CNY (Chinese currency) per ton-km. Previous studies suggest that a reasonable value of the inter-hub transportation discount factor is between 0.6 and 0.8, and that a reasonable value of the non-hub-to-hub transportation discount factor is between 0.7 and 0.9 [9,15]. In this research, was initiated as 0.6, and was initiated as 0.8. The sensitivity analysis for these two parameters is provided in the following sections. First, we generated a test instance with 20 nodes, among which 4 hub nodes were predetermined. We labeled this instance as {1-4-20}, and we used this instance to find the proper settings for the ABC algorithm and analyze the sensitivity of the proposed model. After that, we applied the proposed model and algorithm to more complicated instances so as to examine their effectiveness and efficiency. The ABC algorithm was coded using Java language and implemented on a personal computer with a 2.5-GHz processor. Each numerical instance was executed 20 times repetitively, and the averaged output was used to illustrate the computational performance.
4.1. Parameter Analysis
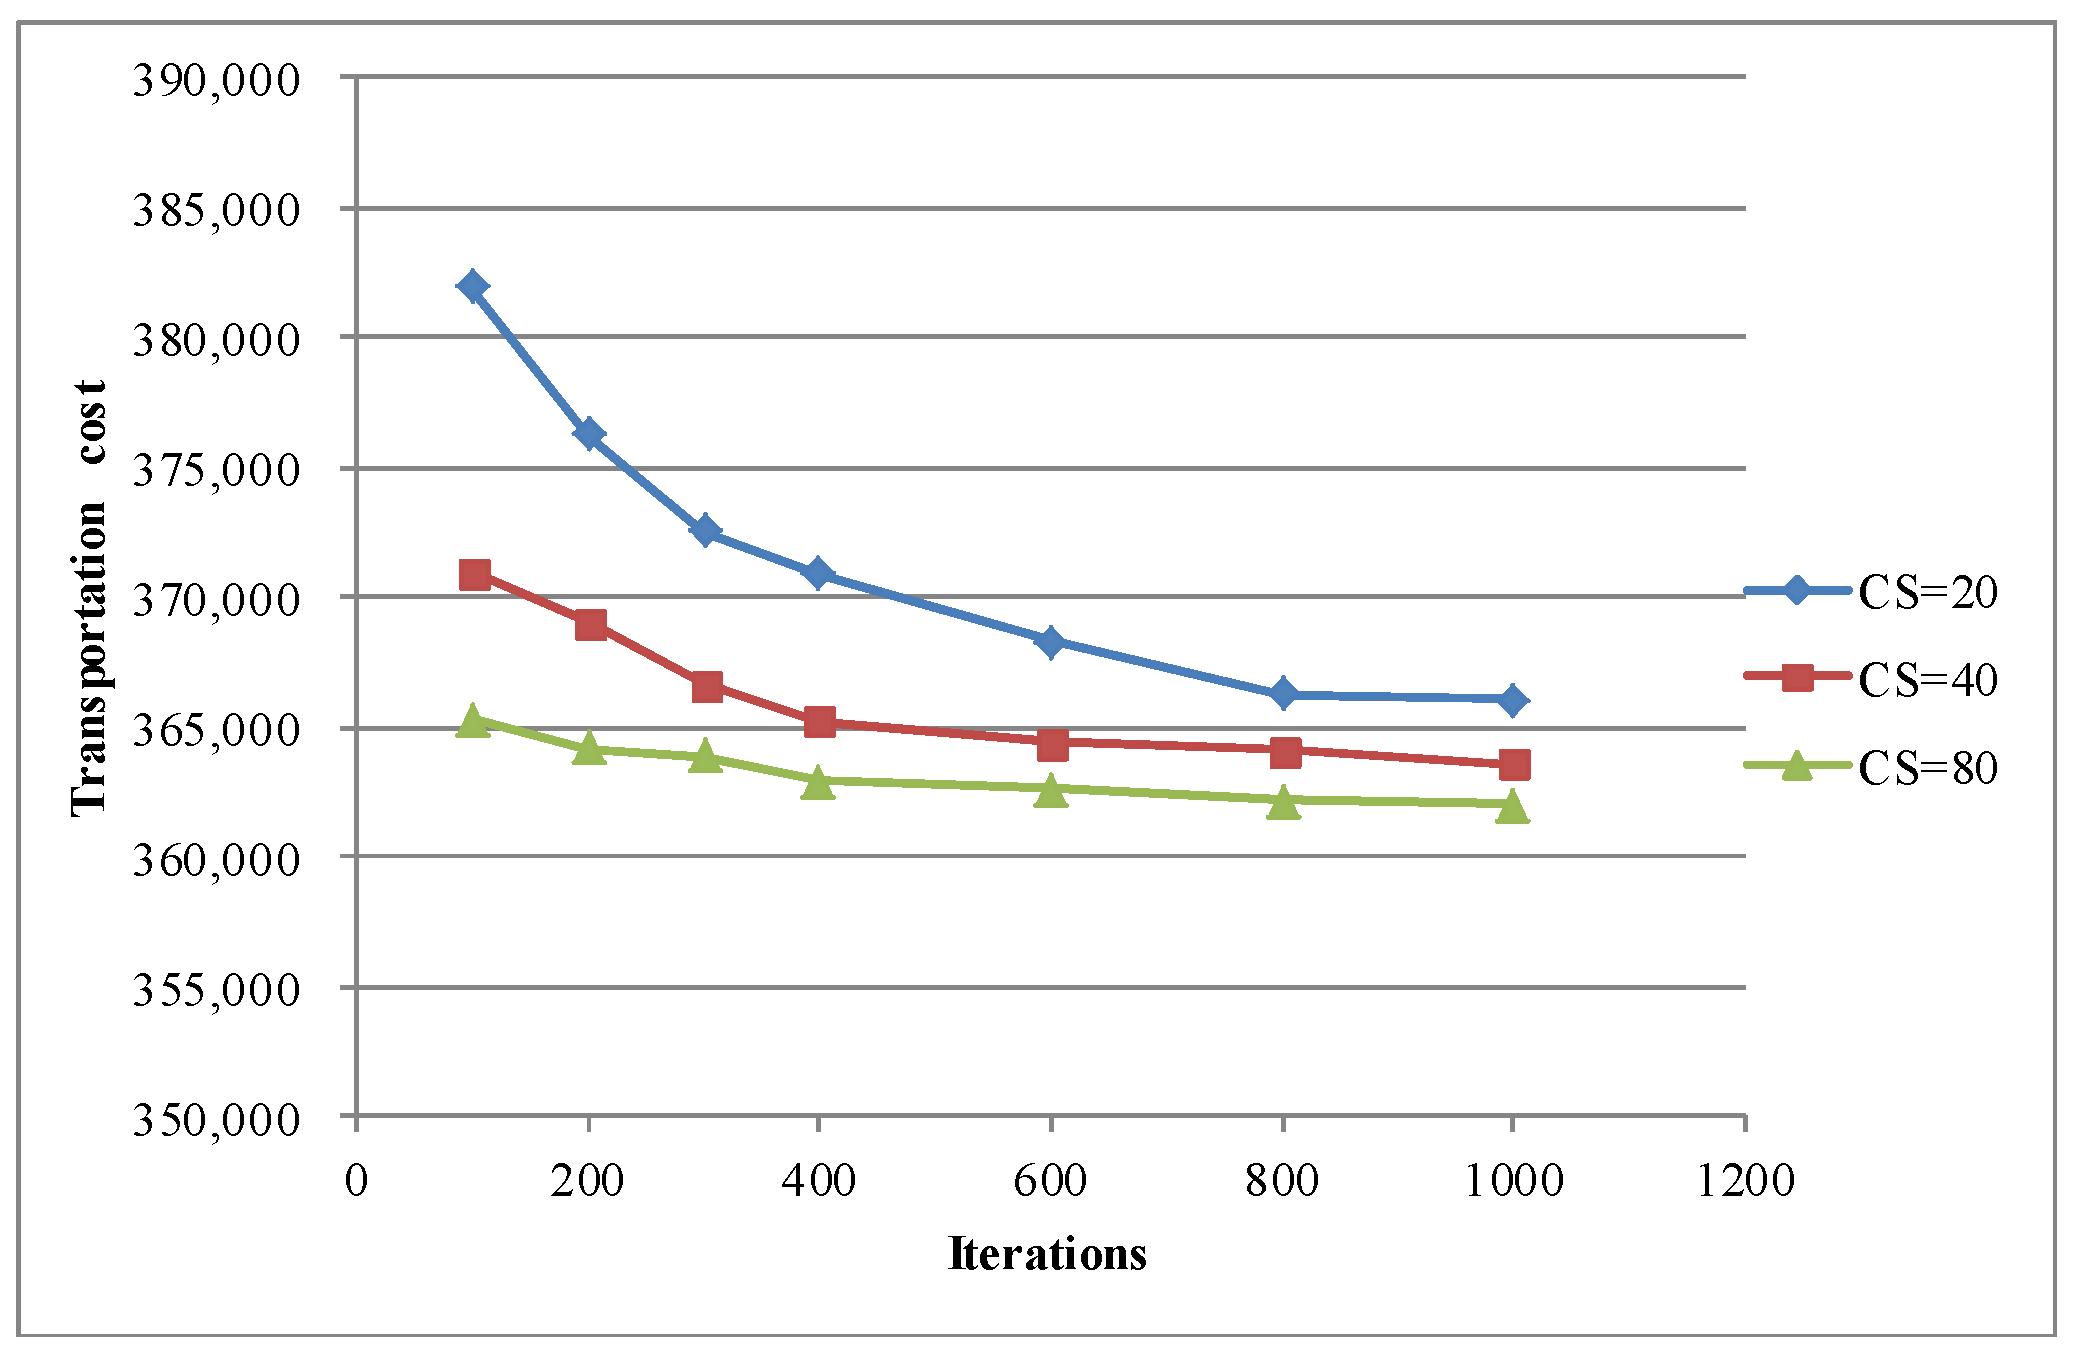
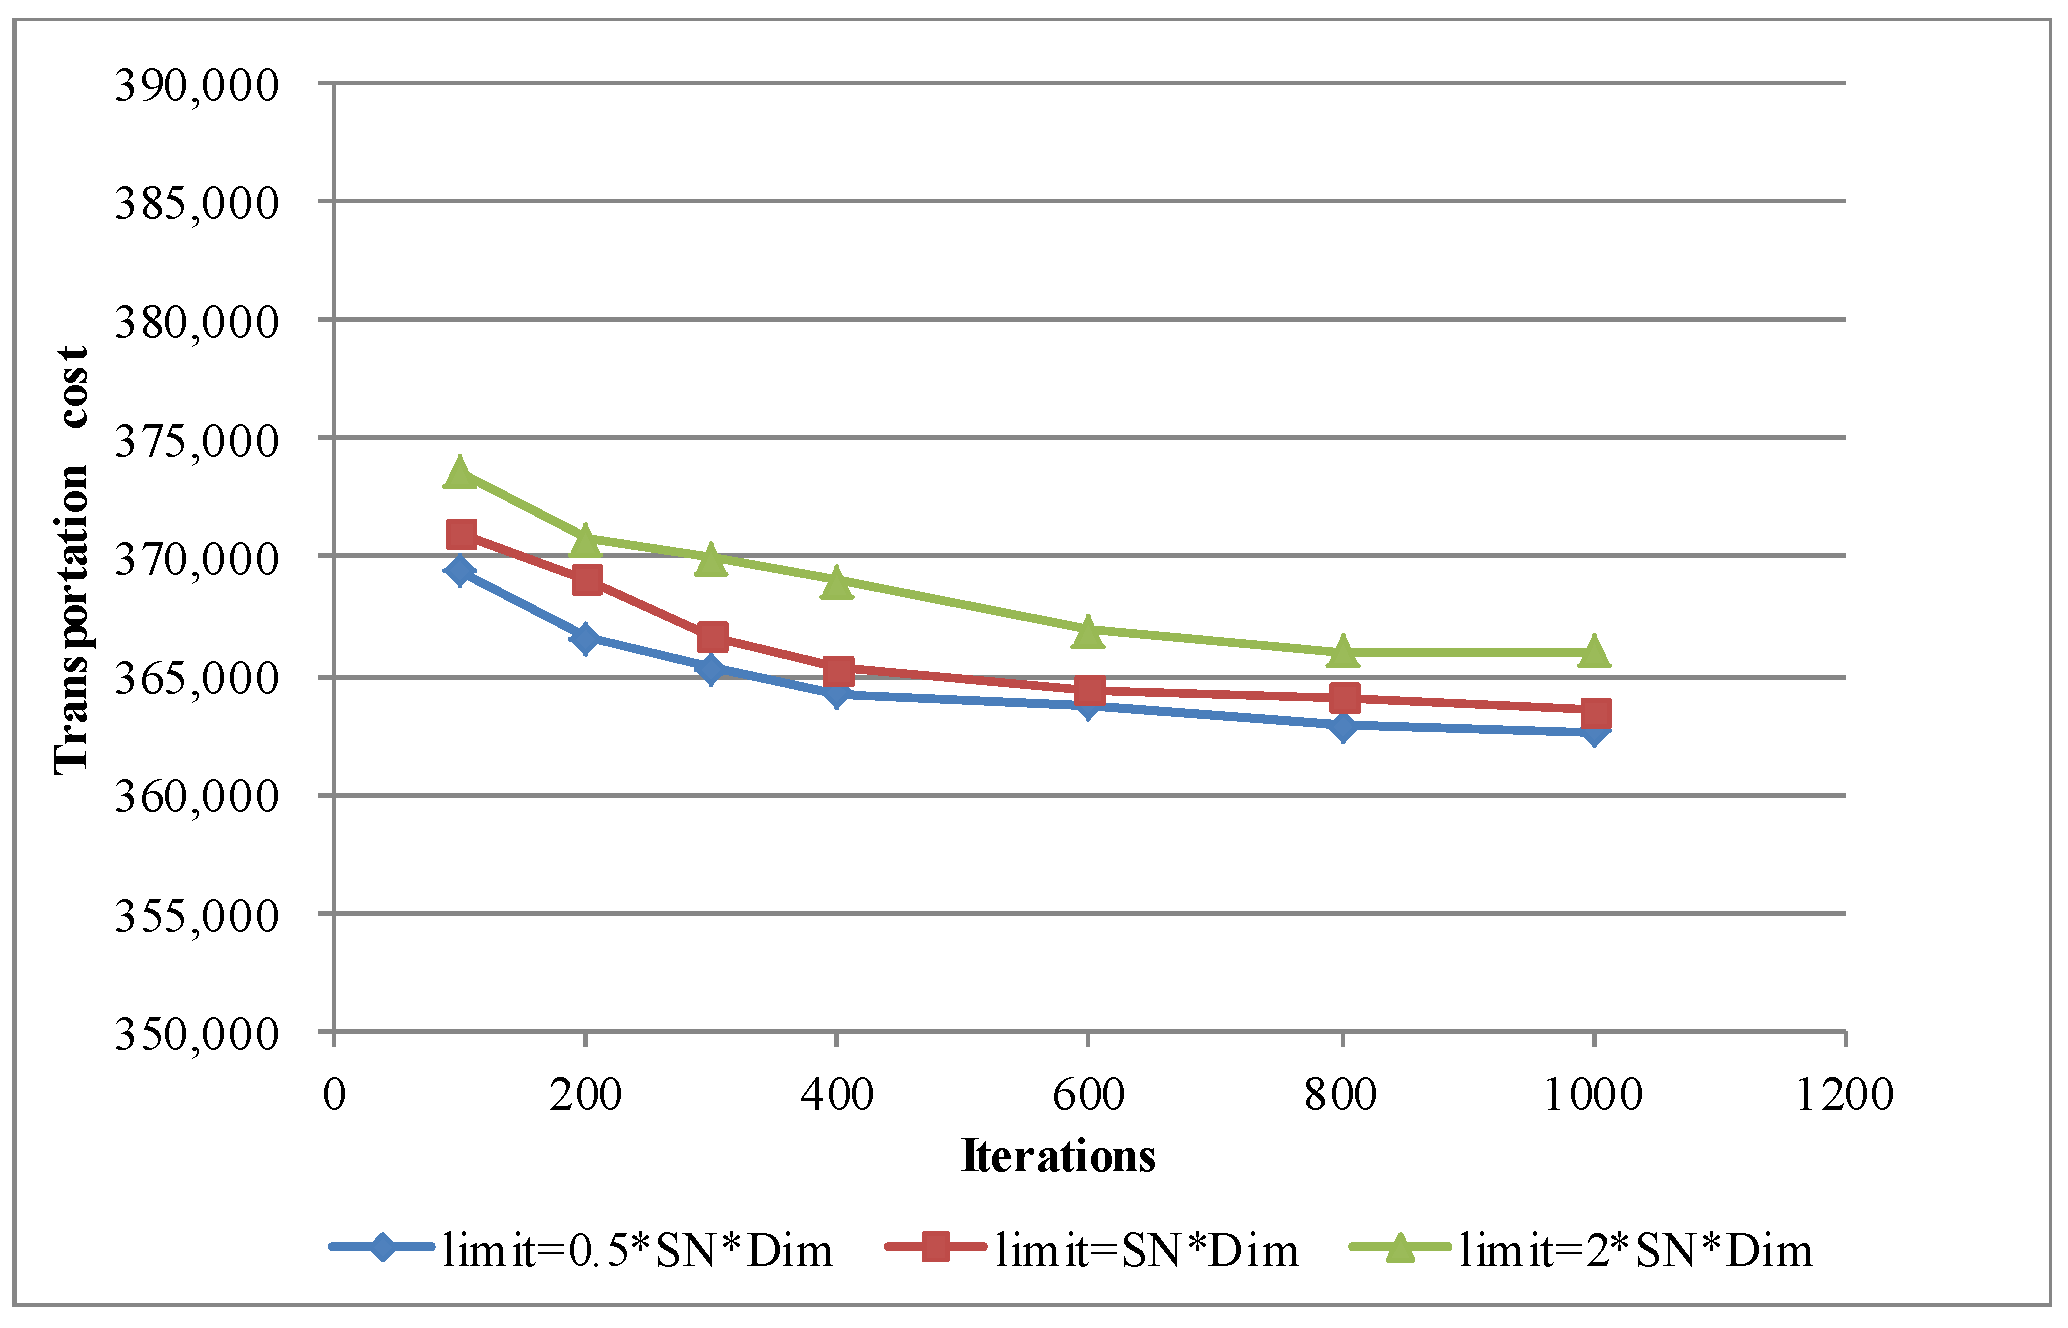
The control mechanism of the ABC algorithm is rather straightforward, as only two parameters need to be tuned (i.e., the size of bee colony () and the abandonment criterion ()). A larger setting of indicates a larger solution pool, which suggests a more diversified searching paradigm, while the setting of a higher abandonment criterion implies a more intensified searching scheme. However, both the setting of a larger number of initial solutions and a higher abandonment criterion would consume much more computational time. Therefore, we sought to balance the search capability and the computational time. Figure 3 and Figure 4 illustrate the performance of the ABC algorithm for solving the instance {1-4-20} with different settings of and . In this research, the size of colony and the abandonment criterion were set as and , in which is the number of solutions and is the dimensional length of each solution.
4.2. Sensitivity Analysis
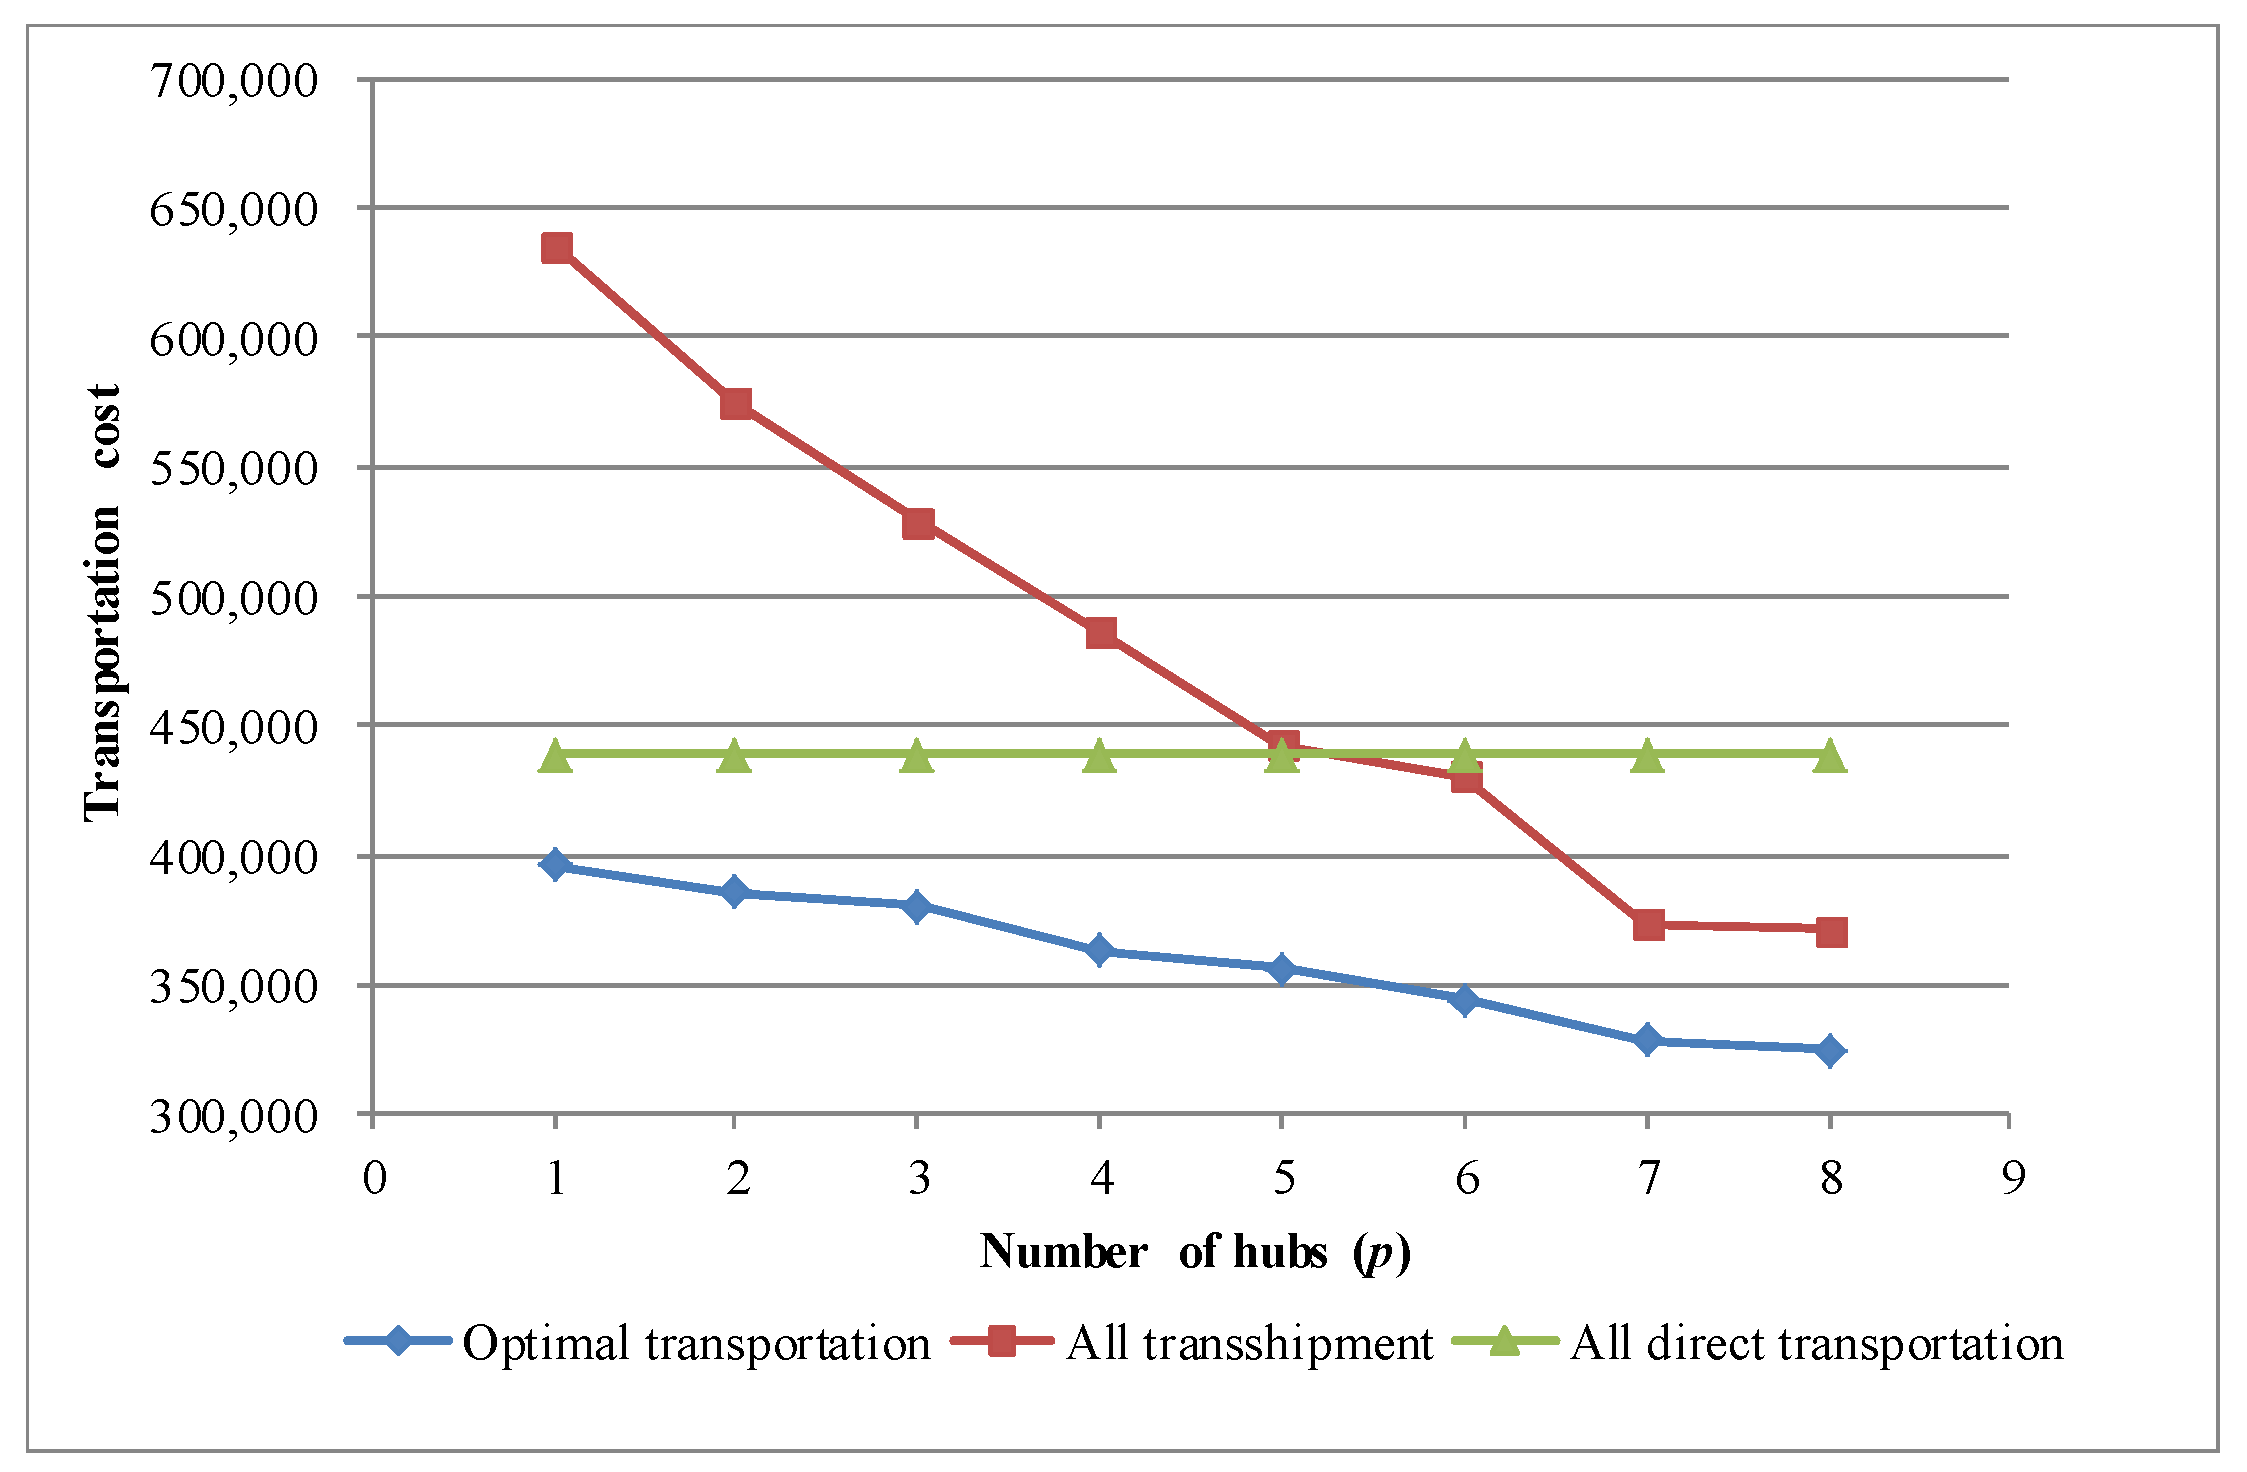
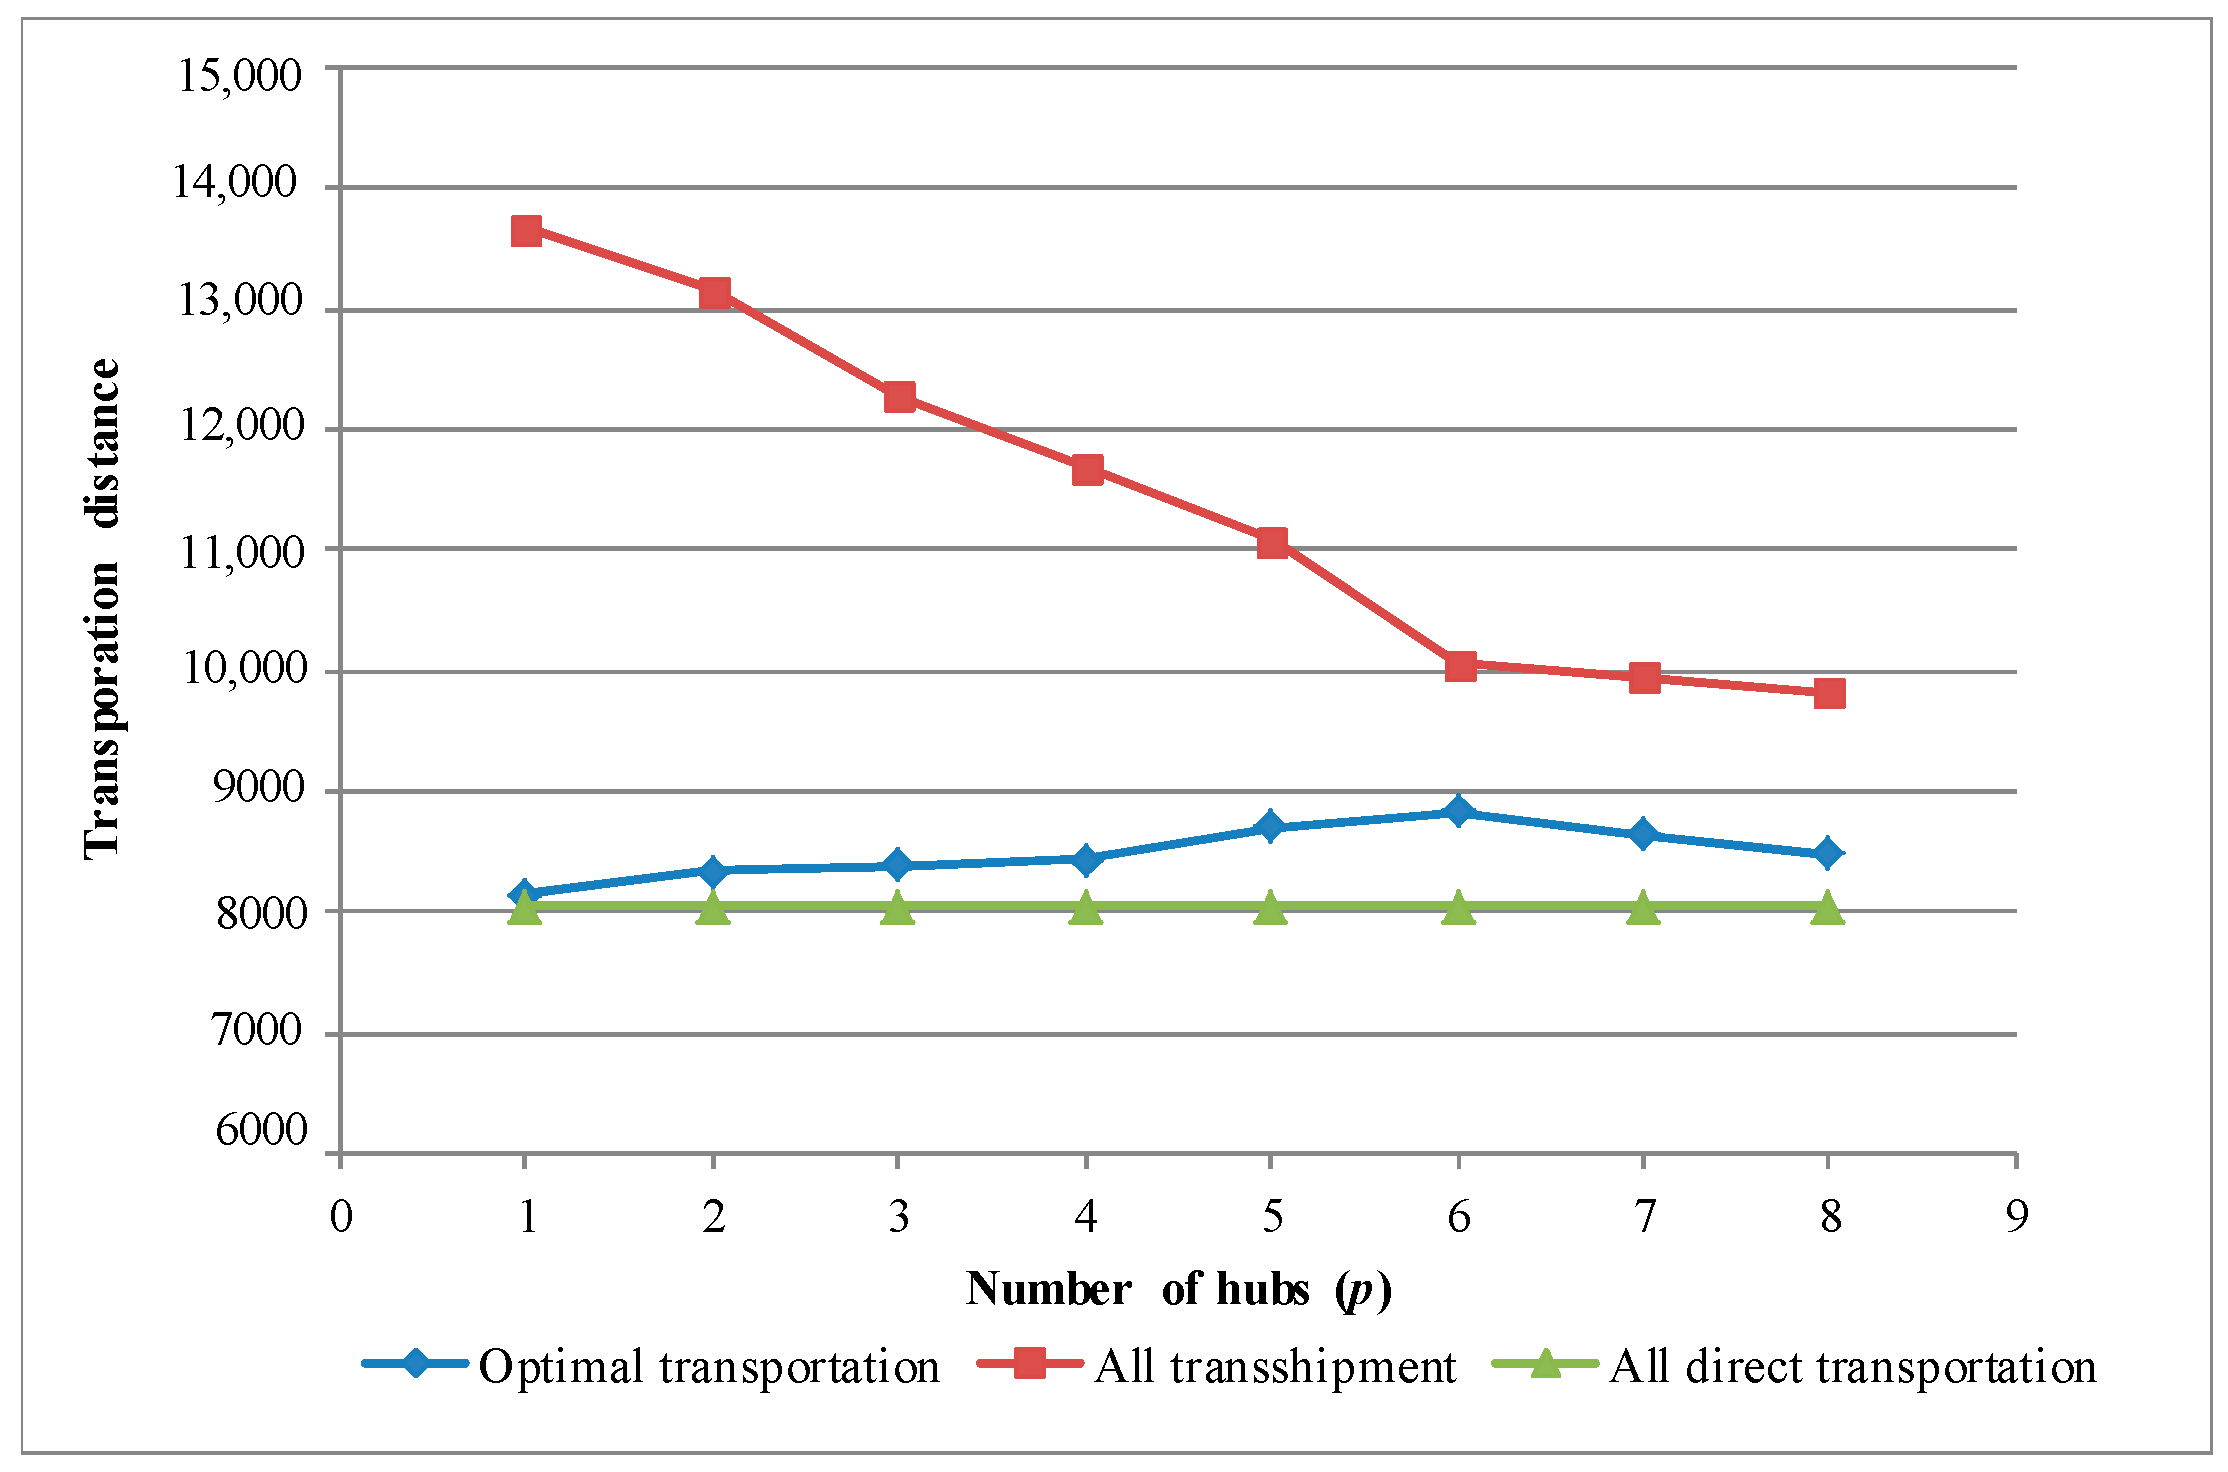
The determination of hubs is a critical factor affecting the entire air cargo transportation network. In the numerical experiment, we assumed that each node had the potential to be a hub node. However, the upgrading from a non-hub node to a hub node is a strategic decision. In other words, once a node is determined to be a hub node, its status will be maintained for a long period. Therefore, we analyzed the impact of hub numbers on the transportation cost and distance. We also compared the transportation cost and distance with two other scenarios (i.e., all direct transportation and all transshipment transportation). As shown in Figure 5 and Figure 6, the transportation cost and distance were practically fixed in the all-direct-transportation scenario, which is intuitively understandable as all the transportation from the origin node to the destination node is transported directly without any stopover. By comparison, the scenario of all transshipment transportation always possessed a larger transportation distance than the scenario with all direct transportation. The transportation cost in the all transshipment scenario was also higher than the all-direct-transportation scenario when the number of hubs was small. However, with the increase of hub number, the transportation cost in the all-transshipment scenario gradually decreased and finally became lower than the all-direct-transportation scenario even though all transportation had to be transshipped.
Comparatively speaking, Figure 5 reveals that the optimal transportation solution had the smallest transportation cost in comparison with the other two scenarios. One thing to notice is that the difference between the optimal solution and the all-transshipment scenario became less with the increasing number of hubs. Figure 6 shows that the transportation distance in the optimal solution slowly increased with the increasing number of hubs, and then reached a maximum distance, after which it began to decrease.
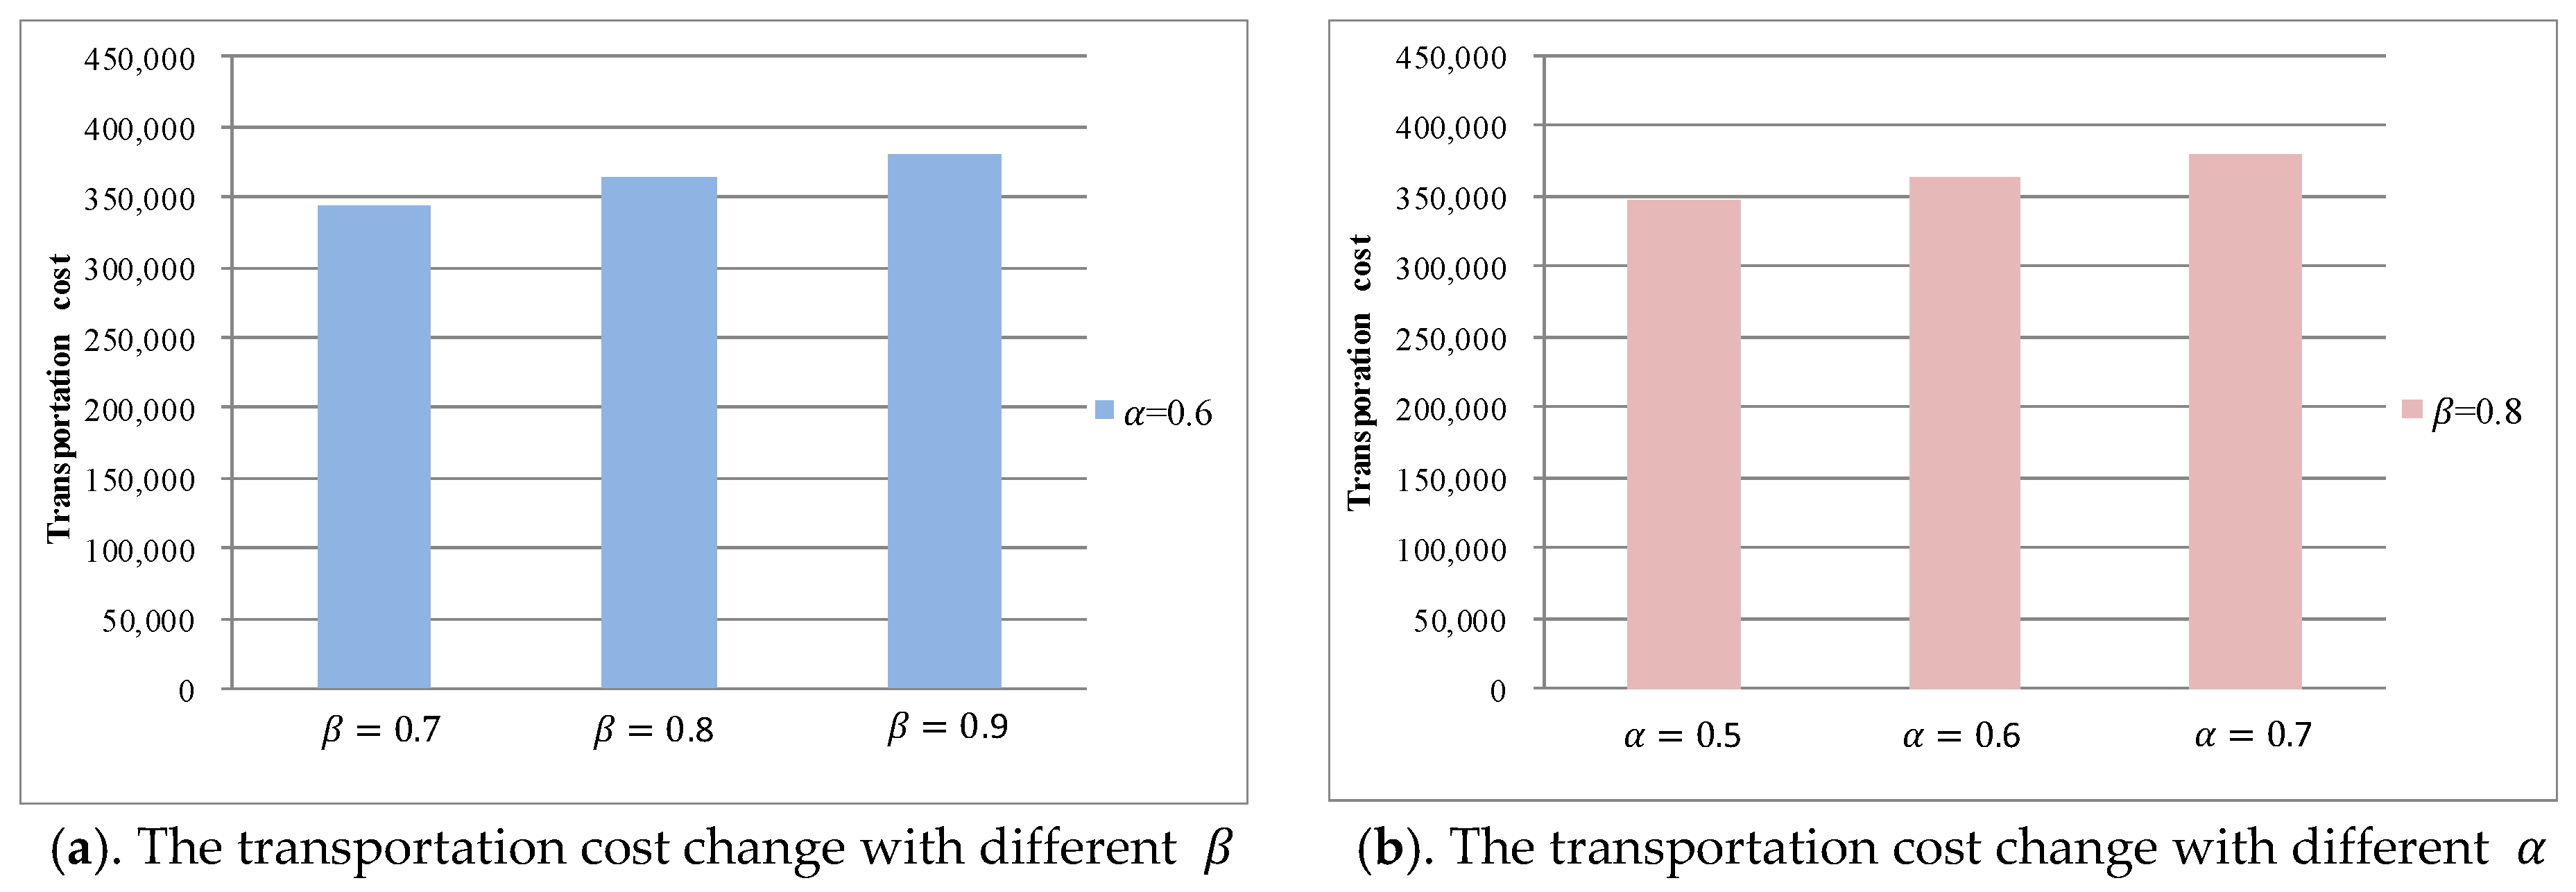
Apart from the determination of hubs, the discount factor of inter-hub transportation and the non-hub to hub transportation due to the economies of transportation scale also affect the route selection of the air cargo transportation. As shown in Figure 7a,b, we conducted more numerical experiments with different combinations of and . Given that the inter-hub transportation discount factor was set as 0.6, the non-hub to hub transportation discount factor increased from 0.7 to 0.8 and from 0.8 to 0.9, the total transportation cost increased by 5.80% and 4.93% respectively, as shown in Figure 7a. When we fixed the non-hub to hub transportation discount factor as 0.8 and increased the inter-hub transportation discount factor from 0.5 to 0.6 and from 0.6 to 0.7, the entire transportation cost increased by 4.46% and 4.80% respectively, as shown in Figure 7b. In conclusion, the number of hubs and their locations determine the structure of the air cargo transportation network, and the determination of hubs and the transportation discount factor integrally affect the route selection for air cargo transportation.
4.3. Algorithm Performance
In order to further examine and validate the effectiveness and efficiency of the proposed model and algorithm, we generated more instances with different settings. As shown in Table 1, 10 instances were generated with the naming schema as (instance ID–hub number–node number). Also, for each instance, we compared the optimal solution with the scenarios of all direct transportation and all transshipment. In Table 1, the column of cost saving 1 was calculated by comparison of the optimal transportation cost and the all-direct-transportation cost, while the column of cost saving 2 was calculated by the comparison of the optimal transportation cost with the all-transshipment-transportation cost. From Table 1, for all instances, the optimal solution can provide average transportation cost savings of 16.42% and 13.89% in contrast to the all-direct-transportation scenario and the all-transshipment scenario respectively. For the instances with same node number, the increase of hub number in a certain range could reduce the optimal transportation cost and the all-transshipment-transportation cost. Moreover, it is a popular trend to employ transshipment transportation along with the increase of the network complexity and the number of hubs. From instance 4 to instance 10, the all-transshipment-transportation cost became lower than that of the all-direct-transportation mode, and this differentiation became even larger. Regarding the transportation distance, as shown in Table 1, the optimal solution generated 8.33% more distance on average in contrast to the all-direct-transportation mode. However, in comparison with the all-transshipment mode, the optimal solution could actually reduce the transportation distance by 21.65% on average. In addition, increasing network complexity and hub numbers could reduce the extra transportation distance due to the transshipment arrangements.
5. Conclusions
Air cargo transportation has been taking an increasingly important role in transportation industry, which requires different network design and route selection in contrast to air passenger transportation. In this research, we proposed an integrated model simultaneously considering air cargo transportation network design and flight route selection. The ABC algorithm was adapted to solve the proposed model with a succinct solution representation scheme and proper combinations of parameters and control mechanisms. The numerical experiment suggests that the determination of hubs and the selection of transshipment mode is core to air cargo transportation management. This research can provide managerial insights for the development of air cargo transportation.
There are some limitations to this research. One is the lack of consideration regarding the extra time and cost required due to consolidation and transshipment operations, which may weaken the solution effect. Another limitation is that the parameter-value settings are drawn from previous literature; it would be more convincing if practical operational data could be collected and analyzed. Therefore, our future research direction is to investigate more practical data and conduct some real case studies applying the proposed model.
Author Contributions
Conceptualization, C.K.M.L.; methodology, K.K.H.N. and S.Z.; software, K.K.H.N. and S.Z.; validation, K.K.H.N. and S.Z.; writing—original draft preparation, K.K.H.N. and S.Z.; writing—review and editing, C.K.M.L.
Funding
This work was funded in part by the National Natural Science Foundation of China under grant number 71902171, in part by the Humanities and Social Science Foundation of Ministry of China under grant number 19YJC630216, in part by the Natural Science Foundation of Zhejiang Province, China under the grant number LY19G010003, and supported by a grant from a collaborative research project of the Department of Industrial and Systems Engineering, the Hong Kong Polytechnic University (Project No. K-ZM2K).
Conflicts of Interest
The authors declare no conflicts of interest.
References
- Merkert, R.; Van de Voorde, E.; de Wit, J. Making or breaking-Key success factors in the air cargo market. J. Air Transp. Manag. 2017, 61, 1–5. [Google Scholar] [CrossRef]
- IATA. Annual Review. Available online: https://www.iata.org/publications/Pages/annual-review.aspx, (accessed on 10 September 2019).
- Suwanwong, T.; Sopadang, A.; Hanaoka, S.; Rodbundith, T. Evaluation of air cargo connectivity and policy in Thailand. Transp. Policy 2018, 72, 24–33. [Google Scholar] [CrossRef]
- Hong, S.J.; Randall, W.; Han, K.; Malhan, A.S. Estimation viability of dedicated freighter aircraft of combination carriers: A data envelopment and principal component analysis. Int. J. Prod. Econ. 2018, 202, 12–20. [Google Scholar] [CrossRef]
- Lange, A. Does cargo matter? The impact of air cargo operations on departure on-time performance for combination carriers. Transp. Res. Part A Policy Pract. 2019, 119, 214–223. [Google Scholar] [CrossRef]
- Kim, H.K.; Lee, C.W. Development of a Cost Forecasting Model for Air Cargo Service Delay Due to Low Visibility. Sustainability 2019, 11, 4390. [Google Scholar] [CrossRef]
- Kasilingam, R.G. Air cargo revenue management: Characteristics and complexities. Eur. J. Oper. Res. 1997, 96, 36–44. [Google Scholar] [CrossRef]
- Yan, S.; Chen, S.C.; Chen, C.H. Air cargo fleet routing and timetable setting with multiple on-time demands. Transp. Res. Part E Logist. Transp. Rev. 2006, 42, 409–430. [Google Scholar] [CrossRef]
- Aykin, T. Networking Policies for Hub-and-Spoke Systems with Application to the Air Transportation System. Transp. Sci. 1995, 29, 201–221. [Google Scholar] [CrossRef]
- Yang, T.H. Stochastic air freight hub location and flight routes planning. Appl. Math. Model. 2009, 33, 4424–4430. [Google Scholar] [CrossRef]
- Lin, C.C.; Lin, Y.J.; Lin, D.Y. The economic effects of center-to-center directs on hub-and spoke networks for air express common carriers. J. Air Transp. Manag. 2003, 9, 255–265. [Google Scholar] [CrossRef]
- Lin, C.C.; Chen, S.H. An integral constrained generalized hub-and-spoke network design problem. Transp. Res. Part E Logist. Transp. Rev. 2008, 44, 986–1003. [Google Scholar] [CrossRef]
- Tan, P.Z.; Kara, B.Y. A hub covering model for cargo delivery systems. Networks 2005, 49, 28–39. [Google Scholar] [CrossRef]
- Oktal, H.; Ozger, A. Hub location in air cargo transportation: A case study. J. Air Transp. Manag. 2013, 27, 1–4. [Google Scholar] [CrossRef]
- O’Kelly, M.E.; Bryan, D.L.; Skorinkapov, D.; Skorinkapov, J. Hub network design with single and multiple allocation: A computational study. Locat. Sci. 1996, 4, 125–138. [Google Scholar] [CrossRef]
- O’Kelly, M.E.; Bryan, D. Hub location with flow economies of scale. Transp. Res. Part B Methodol. 1998, 32, 605–616. [Google Scholar] [CrossRef]
- Bryan, D.L.; O’Kelly, M.E. Hub and spoke networks in air transportation: An analytical review. J. Reg. Sci. 1999, 39, 275–295. [Google Scholar] [CrossRef]
- Kim, H. p-Hub protection models for survivable hub network design. J. Geogr. Syst. 2012, 14, 437–461. [Google Scholar] [CrossRef]
- Ohashi, H.; Kim, T.; Oum, T.H.; Yu, C. Choice of Air Cargo Transshipment Airport: An Application to Air Cargo Traffic to/from Northeast Asia. J. Air Transp. Manag. 2005, 11, 149–159. [Google Scholar] [CrossRef]
- Kim, J.Y.; Park, Y. Connectivity analysis of transshipments at a cargo hub airport. J. Air Transp. Manag. 2012, 18, 12–15. [Google Scholar] [CrossRef]
- Karaboga, D.; Basturk, B. A powerful and efficient algorithm for numerical function optimization: artificial bee colony (ABC) algorithm. J. Glob. Optim. 2007, 39, 459–471. [Google Scholar] [CrossRef]
- Zhang, S.Z.; Lee, C.K.M.; Yu, K.M.; Lau, H.C.W. Design and development of a unified framework towards swarm intelligence. Artif. Intell. Rev. 2016, 47, 253–277. [Google Scholar] [CrossRef]
- Lin, C.C.; Lin, J.Y.; Chen, Y.C. The capacitated p-hub median problem with integral constraints: An application to a Chinese air cargo network. Appl. Math. Model. 2012, 36, 2777–2787. [Google Scholar] [CrossRef]
Figure 1.
Solution illustration example.

Figure 2.
Pseudo code of the artificial bee colony (ABC) algorithm.

Figure 3.
Algorithm performance with different settings of .

Figure 4.
Algorithm performance with different settings of .

Figure 5.
The transportation cost with different numbers of hubs.

Figure 6.
The transportation distance with different numbers of hubs.

Figure 7.
The transportation cost change with different settings of and .


Table 1.
The comparison of transportation cost and distance with different instances. The Instance naming format is (instance ID–hub number–node number).
Table 1.
The comparison of transportation cost and distance with different instances. The Instance naming format is (instance ID–hub number–node number).
| Transportation Cost (CNY) | Transportation Distance (km) | |||||||||
|---|---|---|---|---|---|---|---|---|---|---|
| Instance | Scenario A | Scenario B | Scenario C | Cost Saving 1 | Cost Saving 2 | Scenario A | Scenario B | Scenario C | Distance Increase | Distance Decrease |
| (1–2–20) | 438,713.91 | 390,969.50 | 583,109.91 | 10.88% | 32.95% | 8052.38 | 8550.10 | 13,462.65 | 6.18% | 36.49% |
| (2–4–20) | 438,713.91 | 365,149.01 | 483,464.52 | 16.77% | 24.47% | 8052.38 | 8427.06 | 11,934.45 | 4.65% | 29.39% |
| (3–4–30) | 885,976.78 | 751,349.91 | 900,557.43 | 15.20% | 16.57% | 13,990.30 | 14,966.31 | 20,446.80 | 6.98% | 26.80% |
| (4–5–30) | 885,976.78 | 730,280.24 | 833,628.52 | 17.57% | 12.40% | 13,990.30 | 15,076.91 | 19,424.46 | 7.77% | 22.38% |
| (5–5–40) | 967,544.72 | 808,134.01 | 927,595.89 | 16.48% | 12.88% | 17,942.00 | 19,564.89 | 24,579.63 | 9.05% | 20.40% |
| (6–6–40) | 967,544.72 | 799,572.63 | 897,651.72 | 17.36% | 10.93% | 17,942.00 | 19,683.74 | 24,457.99 | 9.71% | 19.52% |
| (7–6–60) | 1,442,330.17 | 1,217,137.02 | 1,341,243.04 | 15.61% | 9.25% | 29,271.50 | 32,091.78 | 39,037.06 | 9.63% | 17.79% |
| (8–8–60) | 1,442,330.17 | 1,183,377.64 | 1,276,808.14 | 17.95% | 7.32% | 29,271.50 | 32,135.35 | 37,950.30 | 9.78% | 15.32% |
| (9–8–80) | 1,604,880.79 | 1,329,213.29 | 1,425,454.36 | 17.18% | 6.75% | 34,978.61 | 38,268.57 | 45,217.90 | 9.41% | 15.37% |
| (10–10–80) | 1,604,880.79 | 1,296,770.24 | 1,371,033.86 | 19.20% | 5.42% | 34,978.61 | 38,518.37 | 44,278.34 | 10.12% | 13.01% |
| Average | 16.42% | 13.89% | 8.33% | 21.65% | ||||||
© 2019 by the authors. Licensee MDPI, Basel, Switzerland. This article is an open access article distributed under the terms and conditions of the Creative Commons Attribution (CC BY) license (http://creativecommons.org/licenses/by/4.0/).
Share and Cite
MDPI and ACS Style
Lee, C.K.M.; Zhang, S.; Ng, K.K.H. Design of An Integration Model for Air Cargo Transportation Network Design and Flight Route Selection. Sustainability 2019, 11, 5197. https://doi.org/10.3390/su11195197
AMA Style
Lee CKM, Zhang S, Ng KKH. Design of An Integration Model for Air Cargo Transportation Network Design and Flight Route Selection. Sustainability. 2019; 11(19):5197. https://doi.org/10.3390/su11195197
Chicago/Turabian StyleLee, Carman K.M., Shuzhu Zhang, and Kam K.H. Ng. 2019. "Design of An Integration Model for Air Cargo Transportation Network Design and Flight Route Selection" Sustainability 11, no. 19: 5197. https://doi.org/10.3390/su11195197
Note that from the first issue of 2016, this journal uses article numbers instead of page numbers. See further details here.