1. Introduction
Cannabis sativa L. (Cannabis), is one of the oldest domesticated plants, cultivated for the purpose of food, fibre, psychoactives and medicine. In recent years, its medicinal properties have gained a renewed interest given its therapeutic potential in the treatment of a variety of disease conditions. To date, over 100 different cannabinoids have been identified, with Δ9-THC (tetrahydrocannabinol), well known for its psychoactive properties, and others, such as CBD (cannabidiol) recognised for therapeutic and medicinal value [
1,
2].
Historically, cannabis samples were analysed mostly in a legal or regulatory context for the purpose of determining Δ9-THC content. However, as more cannabinoids were identified and their pharmacological potential was examined, the quantification of cannabinoids other than Δ9-THC gained importance. Additional cannabinoids of interest now include Δ9-tetrahydrocannabinolic acid (THCA), cannabidiol (CBD), cannabidiolic acid (CBDA), cannabigerol (CBG), cannabigerolic acid (CBGA), Δ9-tetrahydrocannabivarin (THCV), Δ9-tetrahydrocannabivarinic acid (THCVA), cannabidivarin (CBDV), and cannabidivarinic acid (CBDVA) [
2,
3]. A recent study on virus neutralizing capabilities of naturally occurring cannabinoids (in acid form) has found that CBDA and CBGA are capable of binding to spike protein of SARS-CoV-2 therefore possible candidates for the treatment as well as prevention of COVID-19 [
4]. Clearly, accurate methods of quantification are needed to determine the concentrations of both major and minor cannabinoids of pharmacological potential in cannabis inflorescence, the source of cannabinoids in the plant.
Despite the rising demand and importance of accurate quantification of cannabinoids, the number of studies with a clear focus on analytical method development remains relatively small. This might be in part due to the regulatory constraints, which necessitate specific licences to handle this scheduled drug and limit the availability of standard compounds and test samples. Due to this, the cannabis testing industry remains poorly established, with only a relatively limited number of laboratories offering analytical services and a lack of standardized protocols for extraction and analysis [
5].
Two review articles published recently [
6,
7] contain critical evaluations of methods used for cannabinoid analysis and the recent trends, therefore a detailed comparison of methods is not included here. Chromatographic techniques are generally used for the separation of cannabinoids. Liquid chromatography (LC) has gained preference over gas chromatography (GC) as LC avoids conversion of the acid forms of cannabinoids to their neutral forms which occurs at the high temperatures used in GC [
8]. Until recently, the detection of column-separated cannabinoids was predominantly carried out using UV spectrophotometry, which provides low specificity and makes base-line separation of all cannabinoids imperative. However, complete separation of structurally similar cannabinoids, especially isomeric compounds such as Δ8-THC and Δ9-THC, is challenging [
3]. Due to the lack of specificity of UV detection, any unknown compound/s co-eluting at the same retention time as the target cannabinoid can cause overestimation of its concentration. To overcome this specificity problem, the detection method of choice has been changing to mass spectrometry (MS) [
6,
7]. As MS detection can identify molecules according to differences in mass, the chromatographic separation becomes less important. However, since some of the major cannabinoids, e.g., Δ8-THC, Δ9-THC, CBD, CBC (cannabichrome) and CBL (cannabicyclol), have the same molecular mass, chromatographic separation is still required. Most of the methods using MS detection of cannabinoids are based on tandem mass spectrometry (MS-MS) [
6,
7]. However, there is no real advantage of using this approach over basic mass spectrometry (MS), as cannabinoids of the same molar masses produce similar fragmentation patterns in the second MS event thus not providing additional selectivity. Therefore, base-line separation by chromatography followed by simple MS detection is well suited for the routine analysis of cannabinoids.
According to a recent review of cannabinoid analysis, variabilities in extraction (solvent/s, method, time, and temperature) significantly contribute to differential analytical results [
6]. Most of the recent analytical methods have used ethanol for extraction of both acidic and neutral cannabinoids [
3,
9], although the exact method used for extraction varied in terms of sample to solvent ratio, the technique of extraction, and the duration of extraction. Therefore, a study of the effects of these variables on the amounts of cannabinoids extracted is warranted.
The aims of this study were to develop a simple yet effective method for the extraction of cannabinoids from cannabis inflorescences, and to develop a reliable, robust and simple chromatography-mass spectrometry (LC-MS) method that can be used for routine analysis of 17 phytocannabinoids for which standards are available. In this study, a time of flight (TOF) mass spectrometer was used as the detector. The acquisition of spectral data was by simple MS mode rather than MS-MS because there was no advantage in using tandem MS. As many natural products laboratories are equipped with a TOF instrument (primarily used for qualitative analysis), a quantification method based on a TOF-MS would facilitate adoption of this method. The extraction conditions were optimised to develop a simple and robust method to extract cannabinoids from inflorescence, without altering the composition of cannabinoids. A separation method that uses a low flow rate enabled the use of HPLC (high performance liquid chromatography) rather than requiring an expensive UHPLC (ultra high-performance liquid chromatography) system. The chromatographic separation of the cannabinoids with the same molar mass was made sufficiently robust so that small changes in column and/or mobile phase do not cause the isobaric cannabinoids to co-elute.
2. Materials and Methods
2.1. Materials
Medicinal cannabis samples, proprietary material of Cann Group Limited, were supplied by New South Wales Department of Primary Industries (NSW DPI, Orange, Australia) under an Office of Drug Control (ODC) permit and received by Southern Cross University (SCU) under a NSW Health authority. Samples of contrasting lines for THC/A and CBD/A content were used for method establishment and validation.
All cannabinoid reference standards were purchased from Novachem Pty Ltd. (Heidelberg, Australia) as ampoules of 1000 µg/mL solutions. The standards for (±)-delta9-Tetrahydrocannabinolic acid A (Δ9-THCA-A), Tetrahydrocannabivarinic Acid (THCVA), Cannabidiolic acid (CBDA), Cannabidivarinic acid (CBDVA), Cannabigerolic acid (CBGA), Cannabinolic Acid (CBNA), Cannabichromenic Acid (CBCA), (±)-Cannabicyclol (CBL), and Cannabicyclolic Acid (CBLA) were supplied in acetonitrile. While the standards for (−)-delta9-Tetrahydrocannabinol (Δ9-THC), (−)-delta8-Tetrahydrocannabinol (Δ8-THC), Tetrahydrocannabivarin (THCV), Cannabidiol (CBD), Cannabidivarin (CBDV), Cannabigerol (CBG), Cannabinol (CBN), and Cannabichromene (CBC) were supplied in methanol. Ibuprofen was purchased from Sigma-Aldrich Pty Ltd. (North Ryde, NSW, Australia). HPLC grade ethanol (Scharlau, Scharlab S.L., Barcelona, Spain) was used for sample extractions, and LC-MS grade solvents (Honeywell Research Chemicals, Seelze, Germany) and MilliQ water (Merck Millipore, Billerica, MA, USA) were used to prepare mobile phase.
2.2. Sample Preparation
Apical and mature female inflorescences were cut from the main stems and any large stem pieces were removed. Samples were dried for approximately 7 days at 24 °C under low humidity (50–58%) until a dry weight of 21% of the starting wet weight was achieved, after which they were weighed, double vacuum packed and stored at ambient room temperature in the dark.
Two grams of inflorescence were ground to a fine powder using a 50 mL stainless steel screw top Retsch grinding canister, containing a single 20 mm stainless steel grinding ball, in a Retsch Mixer Mill MM301 (Retsch GmbH, Mettmann, Germany) at 30 rotations per second for 10 s. Ground samples were stored in polypropylene tubes at −20 °C until extracted for analysis (note: flash-cooling the grinding canister and ball in liquid nitrogen before adding the sample prior to grinding helped to prevent clumping of material, especially in high resin samples, thus producing a homogenous fine powder).
2.3. Optimisation of the Extraction
For extraction, 0.1g of ground sample was accurately weighed into a 20 mL polypropylene centrifuge tube. An aliquot of 2.50, 5.00 or 10.00 mL of 100% ethanol was accurately pipetted into the tube. Three replicates were extracted for each volume added. The mixture was sonicated in an ultrasound bath (SONICLEAN, Soniclean®, Dudley Park, Australia) at 50/60 Hz and 150 W for 15 min, then centrifuged at 3000 rpm (Sigma 3–16 L, Sigma Laborzentrifugen GmbH, Osterode am Harz, Germany) for 10 min. The supernatant was carefully removed and stored in an Eppendorf tube at −20 °C. The extract was diluted as necessary with 100% ethanol for instrumental analysis using HPLC-MS. Volumes of injection of 1, 2 and 4 µL (for 2.50, 5.00 and 10.00 mL extractions, respectively) were used to obtain the same peak area (if each treatment were to extract the same amount). Ten cannabinoids were used for comparison (CBDV, CBDA, CBG, CBD, THCV, CBGA, THCVA, CBN, Δ9-THC, THCA). The peak areas of each cannabinoid were divided by the mass of the sample, and the peak area per gram of sample was used for comparison.
2.4. Separation and Detection
The chromatographic separation of cannabinoids was performed using Ultra High Performance Liquid Chromatography (UHPLC) on an Agilent 1290 Infinity ii series system (Agilent Technologies, Santa Clara, CA, USA). The UHPLC was coupled to an Agilent 6545 high resolution accurate mass (HRAM) QToF mass spectrometer equipped with a dual nebulizer jet stream electrospray source for ionization (Agilent) and controlled using Agilent MassHunter Acquisition Software, Tokyo, Japan (Version 10.1). Separation was achieved using an Agilent Poroshell C18 2.7 µm particle size, narrow bore, 15 cm column, held at 30 °C. The chromatographic analysis was performed using 0.1% (v/v) formic acid in 30% v/v methanol in water (mobile phase A), and 0.1% formic acid (v/v) in acetonitrile (mobile phase B), at a flow rate of 0.3 mL/min. The column was pre-equilibrated with 47% (v/v) A and 53% (v/v) B. After injection (of 1 µL sample or standard), the composition of mobile phase was maintained at 53% (v/v) B for the first 25 min. It was then changed from 53% (v/v) B to 70% (v/v) B over the next 15 min (to 40 min mark), changed from 70% (v/v) B to 97% (v/v) B over the next 2 min (to 42 min mark), and then held at 97% (v/v) B for 1 min (to 43 min mark). The column was then returned to the starting composition of 53% (v/v) B over the next 1 min (to 44 min mark). Finally, the column was re-equilibrated using 53% (v/v) B for 6 min (to 50 min mark) prior to the next injection. The injection volume was kept low to avoid peak distortion (as explained in the discussion).
The mass spectrometer was used in MS1-positive mode to scan from m/z 190 to 370 for all samples at a scan rate of 1.5 spectra/s. The general parameters of the source were: capillary voltage 4000 V, nozzle voltage 0 V, fragmentor voltage 180 V, skimmer voltage 45 V and octopole RF Peak voltage 750 V, nebulizer pressure 20 psi, drying gas 10 L/min, drying gas temperature 325 °C, sheath gas flow 12, and sheath gas temperature 400 °C.
2.5. Data Analysis and Calculations
Data analysis was performed using Agilent MassHunter Quantitative Analysis (for QToF) Software, Tokyo, Japan (Version 10.1). Each cannabinoid in a chromatogram of standard compounds was identified based on its spectrum and the retention time. A processing method was prepared to extract each peak based on the m/z value of each compound within a ±0.03 m/z window. Peaks were integrated and exported to EXCEL for calculations. External standard calibration was performed using a five-point calibration curve up to 12.5 µg/mL concentration with 1 µL injections. The regression values obtained (slope and intercept) in EXCEL were formatted to contain the same number of significant figures as the peak area values to avoid rounding errors. Standards used in calibration were used as unknowns/samples to predict concentrations and estimate the validity of the calibration. Concentrations calculated for the samples injected were checked to ensure that they were within the calibration/linear range. If not, they were re-run after dilution. After multiplying by the dilution factor, concentrations were expressed as µg/g of the sample using the exact mass of the sample used in extraction. Dilution factors (of the 5 mL extract) used for minor and major cannabinoids in this study were 2.5 and 200, respectively. A pooled sample of ground inflorescence was prepared using a mixture of high THC and high CBD plant material and used as the quality control (QC) sample with each batch of the samples analysed.
2.6. Extraction Method Used for Routine Analysis
A sample of 0.1g ground cannabis inflorescence was accurately weighed into a 20 mL polypropylene centrifuge tube. A 5.00 mL aliquot of 100% ethanol was accurately pipetted into the tube. The mixture was sonicated in an ultrasound bath at 50/60 Hz and 150 W for 30 min, then centrifuged at 3000 rpm (Sigma 3–16 L, Germany) for 10 min. The supernatant was carefully removed and stored in a 2 mL Eppendorf tube at −20 °C. The extract was diluted as necessary (below) with 100% ethanol prior to the instrumental analysis using HPLC-MS.
2.7. Preparation of Samples for Major Cannabinoids—THC, THCA, CBD, CDBA
The extract was diluted 80 times by mixing 20 µL sample extract and 1580 µL ethanol. The extract was then further diluted by mixing 400 µL of the diluted extract, 40 µL of 0.025 mg/mL Ibuprofen and 560 µL ethanol in an HPLC vial to be used for LC-MS analysis. This resulted in a 200 times diluted extract containing 1 µg/mL Ibuprofen (internal standard).
2.8. Preparation of Samples for Minor Cannabinoids
The extract was diluted by mixing 400 µL of the extract, 40 µL of 0.025 mg/mL Ibuprofen and 560 µL ethanol in an HPLC vial to be used for LC-MS analysis. This resulted in a 2.5 times diluted extract containing 1 µg/mL Ibuprofen (internal standard).
2.9. Preparation of Standard Solutions
A 0.05 mg/mL solution of 17 cannabinoid standards was prepared by mixing 100 µL each of the 17 cannabinoid stock standards (1 mg/mL), and 300 µL of HPLC grade ethanol in a 2 mL Eppendorf tube. A 0.025 mg/mL mix of standards was prepared by diluting the 0.05 mg/mL solution and used as the working standard stock solution.
Ibuprofen was weighed into a 1.5 mL Eppendorf tube and dissolved in an appropriate volume of HPLC grade ethanol to make a 1 mg/mL stock solution. This solution was diluted with an appropriate volume of ethanol to make the 0.025 mg/mL working stock standard.
Five calibration standards were prepared by diluting the appropriate volumes of 0.025 mg/mL mix of 17 standards, and 0.025 mg/mL Ibuprofen to contain 2.5, 5, 7.5, 10 and 12.5 µg/mL cannabinoids and 1 µg/mL Ibuprofen (internal standard).
2.10. Method Validation
Linearity for each cannabinoid was estimated by injecting 1µL each of five mixed standard solutions containing 0.5 to 12.5 µg/mL of the 17 cannabinoids. The linearity was assessed by plotting the peak area of each cannabinoid versus the concentration. Limit of detection (LOD) and limit of quantification (LOQ) for each cannabinoid was determined based on the peak heights (and then the concentrations) corresponding to 3× noise and 10× noise, respectively. Repeatability was estimated by analysing seven individual 0.1 g ground cannabis inflorescence samples (that were prepared by pooling samples containing high CBD and high THC levels), followed by the calculation of relative standard deviation of the concentrations determined for each cannabinoid. Recovery was determined by using the concentrations of each cannabinoid in spiked and un-spiked extracts using seven of the individual extracts prepared for the repeatability experiment. Each extract was spiked to give an added concentration that was below the mid-point of the calibration (linear) range.
3. Results and Discussion
3.1. Sample Preparation
A significantly larger (than the amount used for analysis) amount of inflorescence (2 g) was ground in order to minimize effects of within sample variation due to the architecture/morphology of the inflorescence (containing bracts, stigma, sugar leaves, stem remnants etc.) of varying trichome density. After homogenisation by grinding, a representative 0.1 g sample was extracted for analysis.
3.2. Optimisation of the Extraction
Ethanol has been the most common solvent of choice in recent studies of cannabinoid analysis, and the high extracting efficiency of ethanol is attributed to the high affinity of ethanol to the cannabinoid molecular structure [
6]. Important advantages of using ethanol extraction for cannabinoid analysis are its general availability, low toxicity, low cost and easy storage and handling. Furthermore, the concentrations determined by the analytical methods that used ethanol for extraction are likely in the range of concentrations used for actual extraction in formulations intended for human consumption, as ethanol is a common extraction solvent in preparations. An extraction that does not involve heat is more appropriate for cannabinoid extraction because heat can change the ratio of acid forms to neutral forms [
8] thereby altering the composition of cannabinoids in the sample prior to analysis.
An optimisation study of the extraction of cannabinoids from dried, ground cannabis inflorescence, using factorial design, found that the extraction solvent (80% methanol vs methanol-chloroform mixture), technique of extraction, and the time of extraction beyond 15 min did not significantly affect the amounts of cannabinoids extracted. The most significant variable that affected the amounts extracted was the sample to solvent ratio [
10]. In recent methods that used ethanol as the extraction solvent, the ratio (grams of dried inflorescence/mL ethanol) varied from 1/100 [
9,
11] to 1/15 [
3]. Therefore, a study of the effect of this ratio on the amounts of cannabinoids extracted was warranted in order to establish an optimum extraction procedure prior to instrumental analysis. A systematic study of the effects of solvents other than the ones studied in the previous study [
10], and extraction times below 15 min was beyond the scope of this study.
In this study, the effect of the ratio: grams of ground inflorescence / mL ethanol, on the amount of cannabinoids extracted was studied using 0.1g of dried inflorescence in 2.5, 5 and 10 mL volumes of ethanol (ratios of 1/25, 1/50, and 1/100, respectively), using triplicate extractions for each ratio. Volumes of injection of 1, 2 and 4 µL (respectively) were used to obtain the same peak area (if each treatment were to extract the same amount). Ten cannabinoids that were present in significant amounts in the sample were used for comparison (CBDV, CBDA, CBG, CBD, THCV, CBGA, THCVA, CBN, Δ9-THC, THCA). Peak area per gram of sample was used for comparison.
According to the results of one-way ANOVA (plus a Duncan’s multiple range test for the means), sample/solvent ratio of 1/100 extracted significantly lower (p < 0.05) amounts of all cannabinoids in comparison to the other two ratios. The amounts extracted with the ratios 1/25 and 1/50 were not significantly different (at p = 0.05) for all cannabinoids. However, the precision (based on the coefficient of variance) was better with the ratio 1/50. Therefore, that ratio (0.1 g of ground inflorescence in 5 mL ethanol) was used for all extractions in this study.
3.3. Optimisation of Chromatographic Separation and Mass Spectrometry
Chromatographic separation for all cannabinoids was optimised with the main emphasis on the baseline separation of the critical isomeric pair: Δ8-THC and Δ9-THC. Chromatographic separation with good resolution was also targeted for individual cannabinoids in two groups of isobaric compounds: CBD, Δ8-THC, Δ9-THC, CBC, CBL (
m/z = 315.2) and CBDA, THCA, CBLA, CBCA (
m/z = 359.2). In order to conduct these separations, a column with small particle size and/or maximum possible length was important. However, because of the aim of making this separation suitable for HPLC rather than UHPLC, it was decided to use a poroshell type column (thin layer of porous stationary phase coated on solid silica cores) that can produce resolutions similar to sub-2 µm body-porous stationary phase particles used in UHPLC columns, without having to use very high pressure. As the longest available LC-MS column (15 cm) was used in this separation, the high pressure required was compensated by using a low flow rate (0.3 mL/min). Although the run time could have been shortened by using a higher flow rate, the flow rate was kept low in order to operate the LC in HPLC mode rather than UHPLC mode because our aim was to produce a method that can be run on a simple HPLC system. The polarity of a C18 column is suitable for the separation when a low pH is used (when the acid forms are not ionised to produce highly polar carboxylates). The detector (MS) sensitivities for neutral compounds were much higher than those for acid forms at low pH. Another advantage of using low pH was, that the neutral forms of cannabinoids naturally occur at much lower concentrations compared to the acid forms. Therefore, the difference in sensitivities was well suited for analysing a mixture of acids and neutrals without having to make additional dilutions to quantify the range of cannabinoids of interest. Formic acid (0.1%) was used to achieve a low pH of around 3 in the mobile phase. Organic modifiers, methanol and acetonitrile - from two different classes of selectivity, were tested in different ratios and combinations to improve the selectivity factor of the separations [
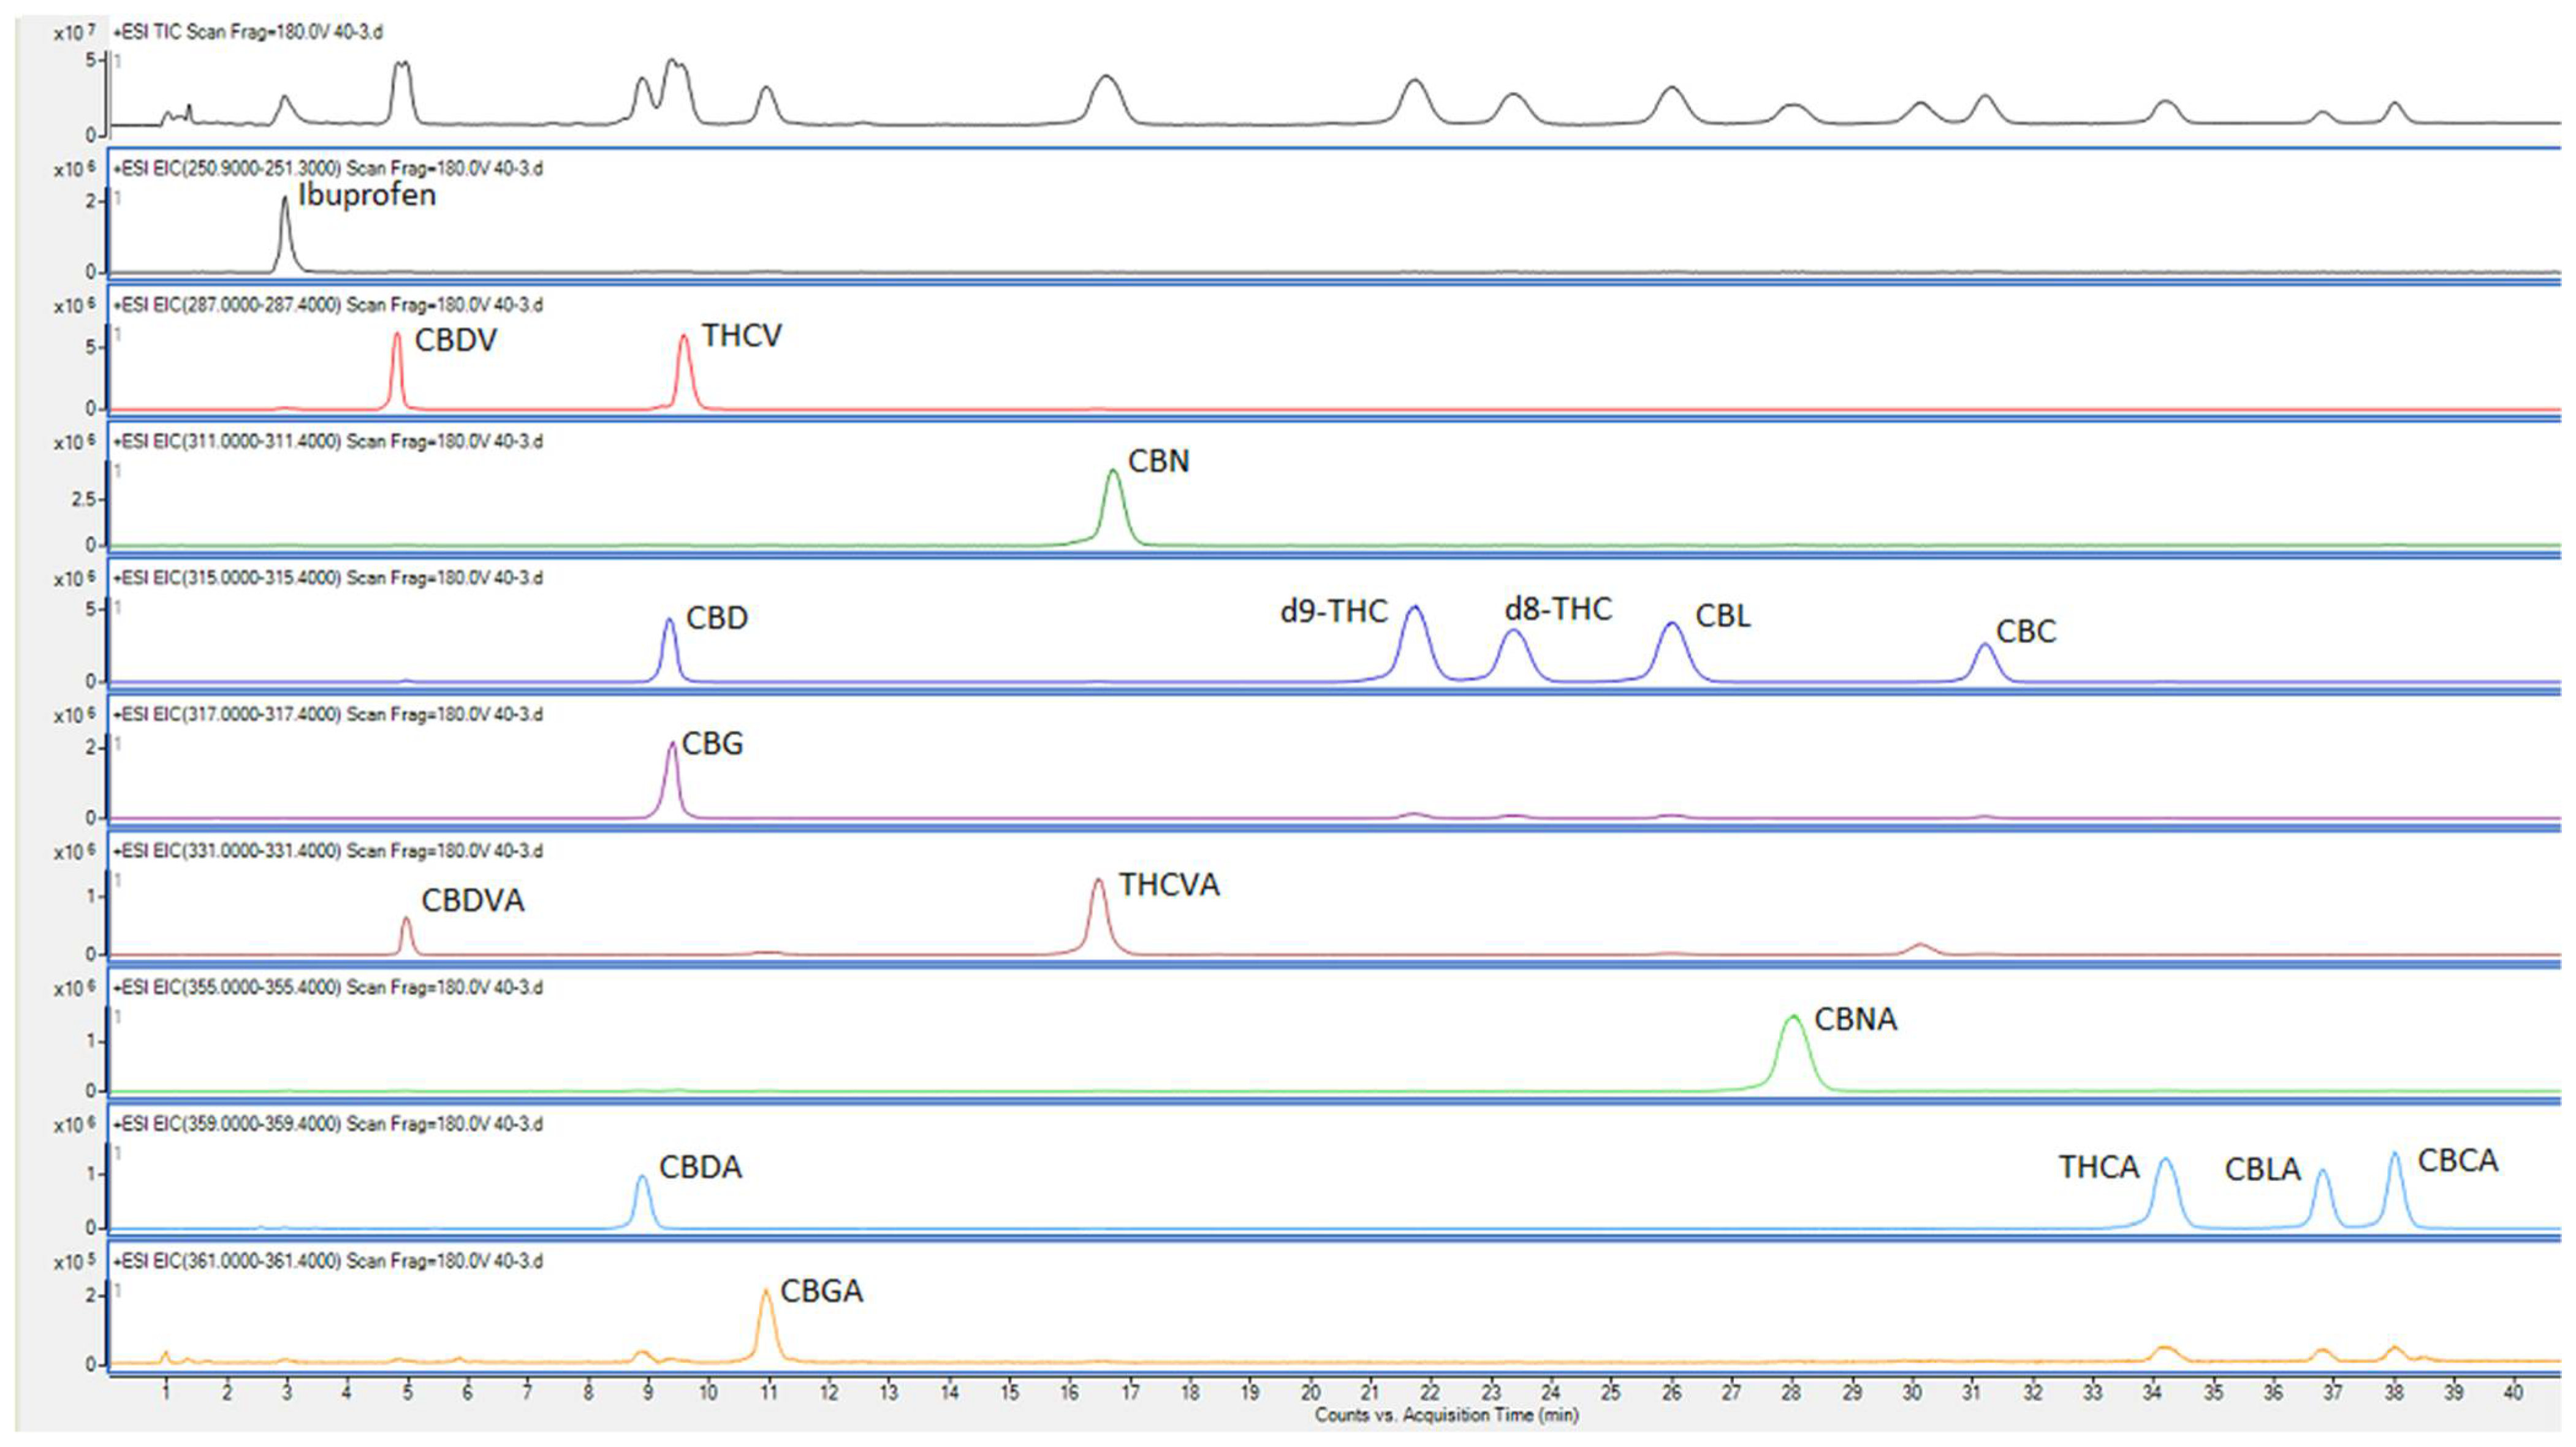
12]. The optimal separation of all 17 cannabinoids was achieved within the isocratic section at the beginning of the gradient using 53%
v/v methanol/water (with 0.1% formic acid) as mobile phase A and acetonitrile (with 0.1% formic acid) on a Poroshell C
18 column with a particle size of 2.7 µm (as detailed under
Section 2 above) (
Figure 1). The
m/z values used for detection and the retention times for each cannabinoid are listed in
Table 1. Since the samples and standards were in 100% organic solvent (ethanol), and the start of the gradient was only about 53% organic (weaker eluent strength), the chromatographic peaks were prone to distortion. With the column size and flow rate used in this study, we found that peak distortion could be prevented as long as the volume of injection was kept below 4 µL. The injection volume was kept at 1 µL throughout this study.
As described above, our aim was to develop an MS detection method rather than a tandem MS detection method. This was partly to be able to use an inexpensive HPLC-MS system, and partly because there is no advantage in using MS-MS detection (the isobaric cannabinoids produced the same fragments in MS-MS therefore needed to be chromatographically separated). We used the QToF and its processing software to mimic a single ion monitoring (SIM) mode of detection and quantification that is normally used in quadrupole MS systems. Data was acquired as spectra in total ion current (TIC) mode within the range of
m/z 190–370, and each cannabinoid peak was extracted (as listed in
Table 1) from these spectra for processing. An advantage of using the TIC mode is the possibility of detection of other compounds that have their molar masses within the range of detection used. Since we started using this method to analyse samples from other projects, we were able to detect (and tentatively identify based on literature reported mass values) some other cannabinoids, in some samples (data not shown). This could not have been possible with a quadrupole MS instrument that is usually used for quantification.
Since there was concern regarding the source temperature (325 °C) causing decarboxylation of the acid forms [
6,
8,
13], the presence of peaks for neutral forms were checked at the retention times of the acid forms. As evident from
Figure 1, they were absent, confirming that the acid forms were not decarboxylated in MS. In the case of CBDA and CBD that have very similar retention times, this was established by running only CBDA standard, and confirming the absence of a peak at
m/z of 315.2 (corresponding to CBD).
3.4. Data Analysis and Processing
The extract ion chromatography (EIC) option in Agilent MassHunter Quantitative Analysis (for QToF) software (Version 10.1) was used to extract peaks. We used a window of ±0.03 m/z for EIC in this software, in order to prevent MS line overlapping between CBD and CBG that have the same retention time although they are 2 m/z value apart. Since the sensitivities for (abundant) acid forms were deliberately suppressed (relative to the neutral forms), a single dilution of the extract by 2.5 times allowed all minor cannabinoid levels to fall within the calibration range. The extracts were required to be diluted by 200 times to make the concentrations of the major cannabinoids (CBD, CBDA, THC, THCA) to fall within the calibration/linear range. We were able to quantify all 17 cannabinoids using only two dilutions because of the use of low pH elution to improve the sensitivities of neutral forms relative to those of acid forms, and because of the use of a low flowrate (therefore lower peak heights).
Matrix effects (mostly by causing ion-suppression) are a major problem that impair the accuracy of LC-MS data [
14,
15,
16]. As matrix effects cannot be completely eliminated in practise, the data is corrected for matrix effects by running a co-eluting internal standard for each analyte and subsequent calibration using internal standard method [
14,
15]. In our work, we did not correct for matrix effects because co-eluting compounds (stable isotope labelled analogues of the cannabinoids) were not yet commercially available for most of the cannabinoids. When available, they can easily be incorporated into to the current method, and the calibration can be carried out using an internal standard method. Until then, the data is not completely free of matrix effects. However, using lengthier retention times as well as achieving high resolution of all peaks in our method ensure minimal matrix effects because the likelihood of co-elution of matrix compounds with the peaks of interest is minimised. In addition, the high dilutions used, especially for the major cannabinoids (0.1 g sample diluted to 1 L), ensured negligible matrix effects on their concentration data [
15]. The high sensitivity of the method enables the detection of very low concentrations therefore high dilution to minimise matrix effects was possible.
Using an internal standard that does not co-elute with the analyte is not an option in addressing LC-MS matrix effects [
16]. This is because the matrix effects at each time point of the chromatogram are different for different matrices. This was the reason that the internal standard (Ibuprofen) used in method development was not used in actual calculations. However, if a study was undertaken using all samples containing the same matrix (e.g., studying the effect of some variable on the same plant matrix), Ibuprofen could be used as the internal standard to eliminate procedural errors (but no effect on matrix effects).
3.5. Method Validation
The LOD and LOQ, estimated based on 3× and 10× noise, respectively, ranged from 9 to 1734 picograms, as shown in
Table 2. In general, acid forms of cannabinoids have higher LOD values (i.e., lower sensitivities) relative to the neutral forms. As discussed above, the suppression of sensitivities of acid forms (that are more abundant than the neutral forms) was deliberate in order to fit the MS responses of acid forms within the calibration range. In addition,
Table 2 shows LOD and LOQ values calculated based on the concentrations of the extract that was injected to the column (with 1 µL volume of injection), and the concentrations in dried, ground inflorescence (based on 2.5-fold dilution of the 5 mL extract).
Table 2 also shows the linearity, along with the upper limits of concentrations. Good linearities (r
2 of >0.99) were obtained for all cannabinoids for the concentration ranges used for calibration.
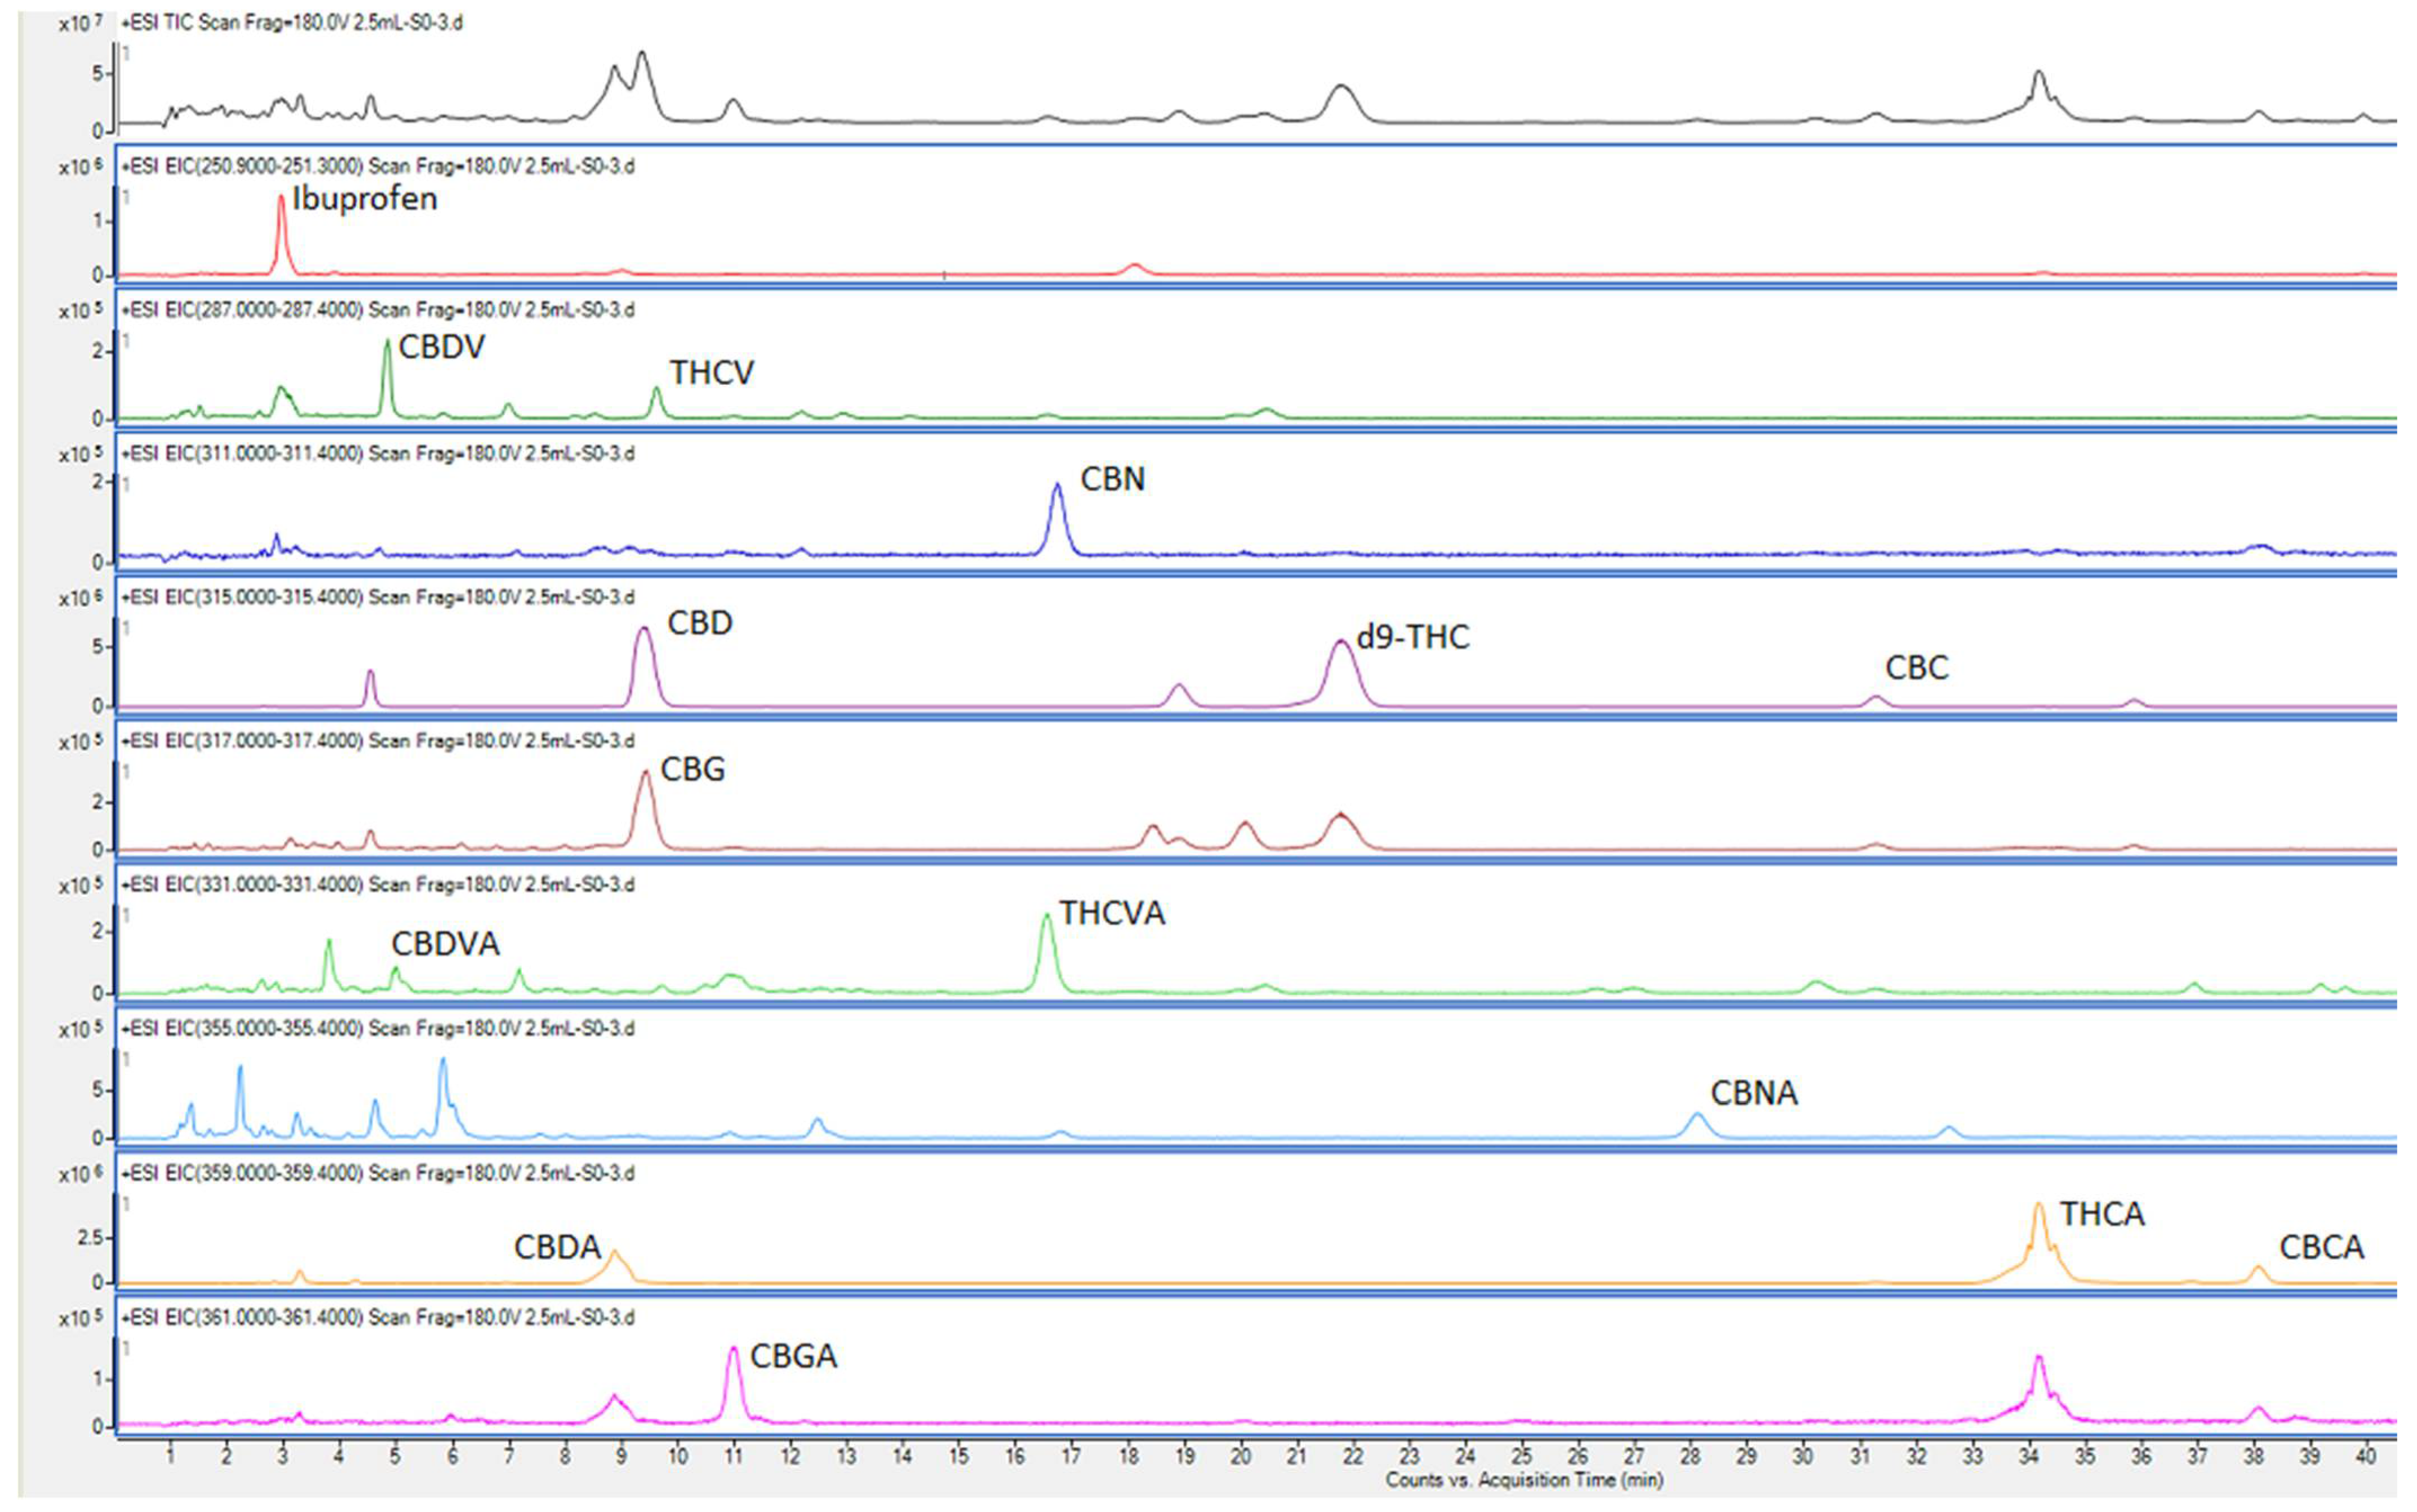
The repeatability values (n = 7), determined by analysing multiple sub-samples of the pooled ground inflorescence and expressed as percentage standard deviations, are shown in
Table 3. The chromatograms for the pooled sample are shown in
Figure 2. The percentage standard deviations were larger for the cannabinoids that have high LOD values/lower sensitivities. It is likely that lack of complete homogeneity of the ground samples, due to the formation of resin aggregates, contributed to the high RSD values. As suggested in the
Section 2.2, snap-cooling the sample (in dry ice) before grinding produces homogeneous samples, although heat produced by friction during the grinding process might still cause resins to aggregate to some extent.
The mean recoveries, calculated using the percent ratio of observed/spiked concentrations, are also shown in
Table 3, along with their SD values (n = 7). In the case of CBG, both the low dilution (×2.5) and high dilution (×200) produced peaks that were within the linear range. However, the recovery from low dilution samples was about 30% compared to almost 100% recovery for the high dilution samples. The mean concentration value was also about 3 times higher with the high dilution. This clearly demonstrates the ion-suppression effects on CBG, and the elimination of this effect by sample dilution, as discussed above [
14]. As CBG and CBD have similar retention times, the CBG signal was supressed by CBD in high CBD samples. In the pool sample used in
Table 3, the CBD concentration is >10 times that of CBG.
The method was applied to quantify cannabinoids in several different samples containing high levels of CBD and high levels of THC. The concentrations of each cannabinoid quantified are listed in
Table 4.


 ,
, 

