
Hyaluronic Acid-Chitosan Nanoparticles to Deliver Gd-DTPA for MR Cancer Imaging

Abstract
:1. Introduction

2. Results and Discussion
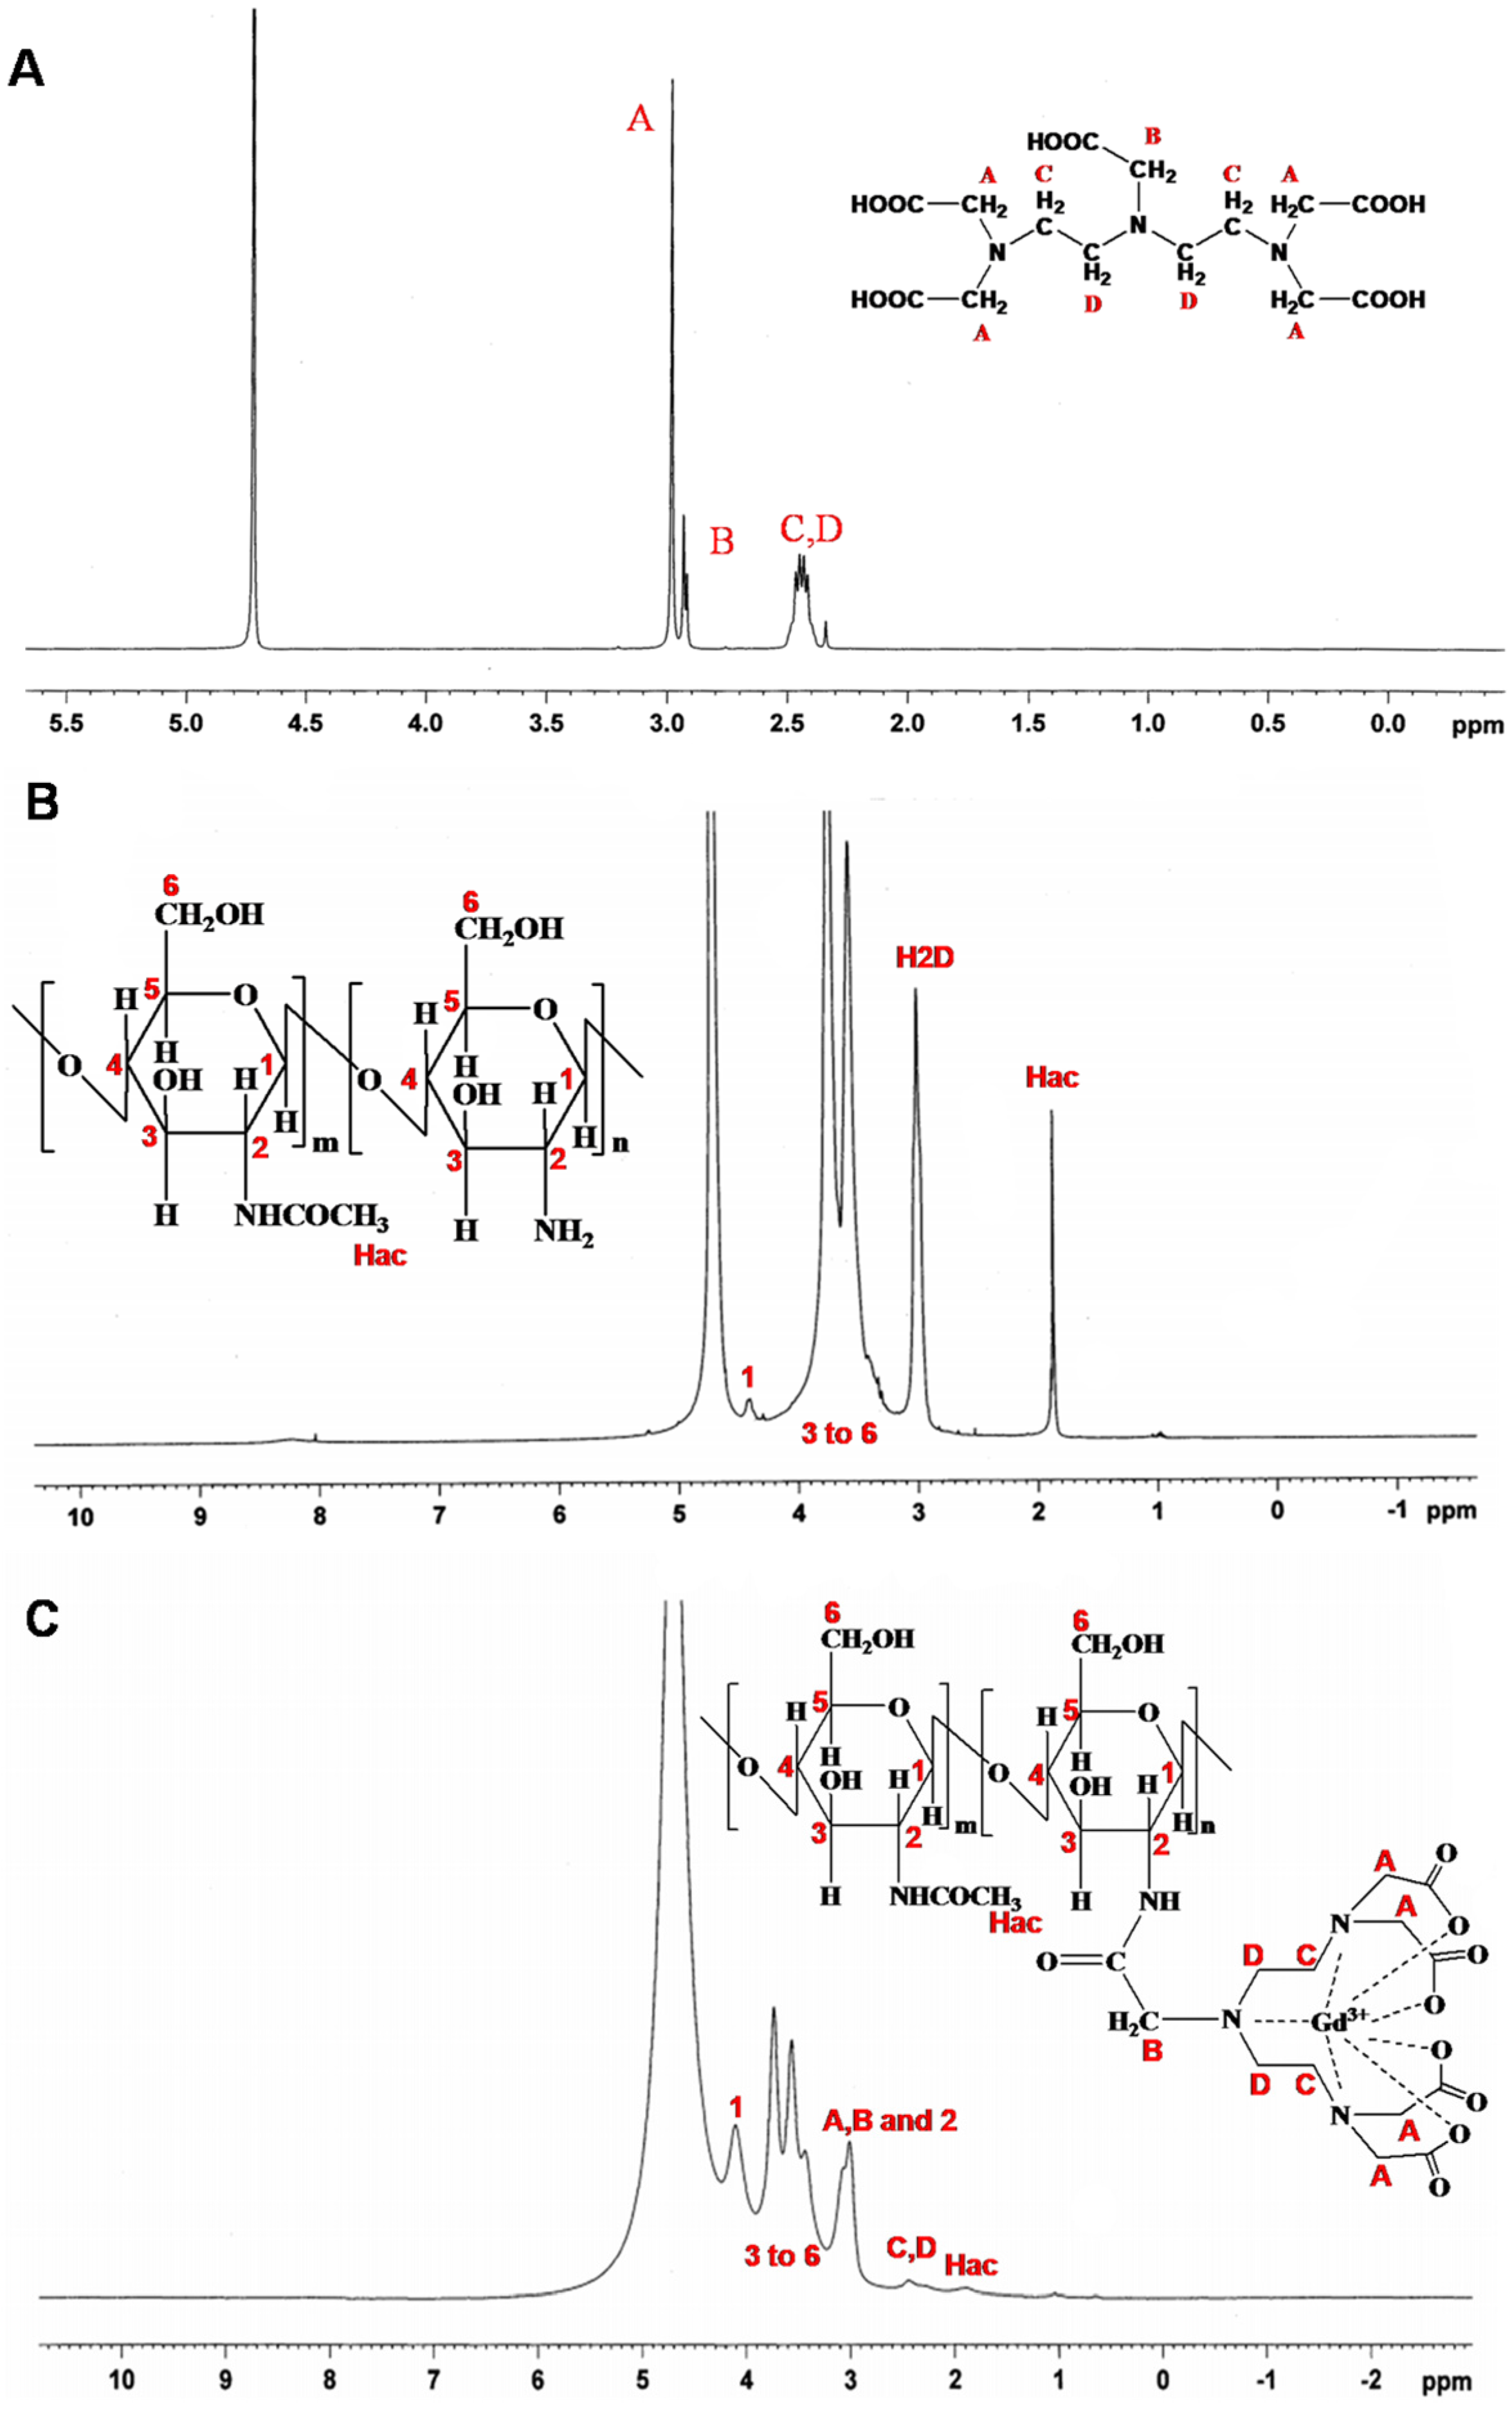
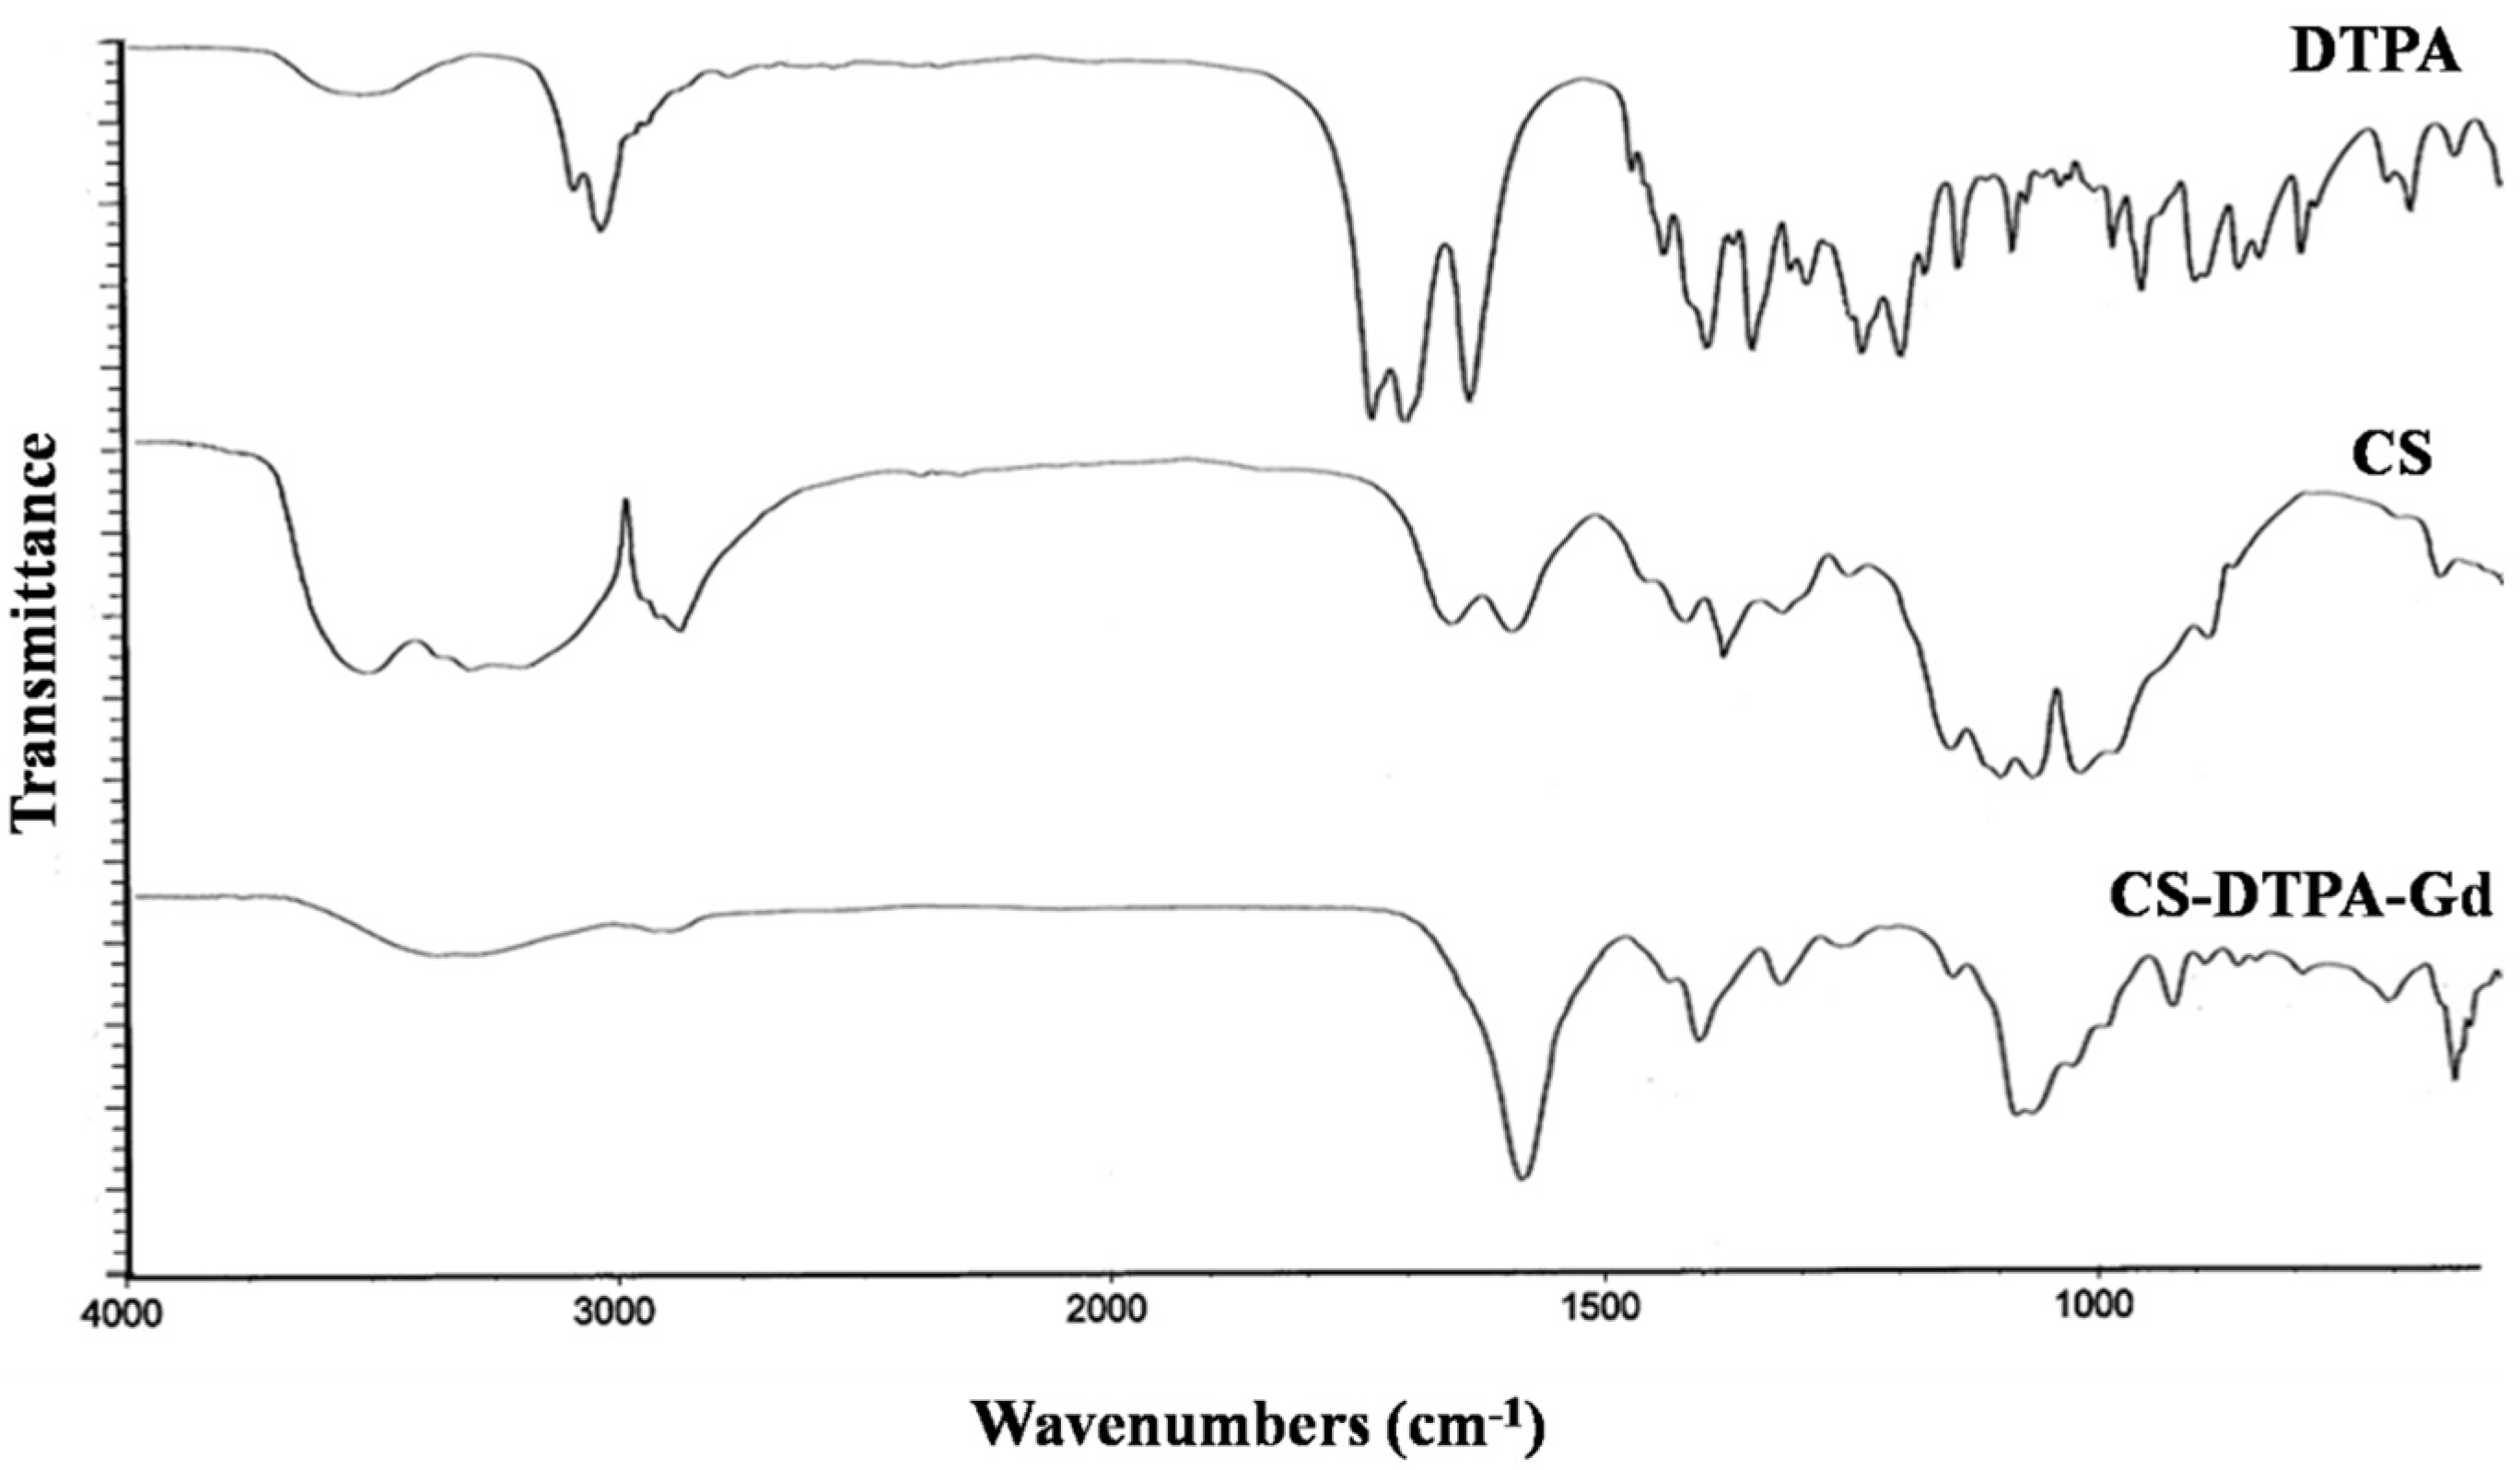
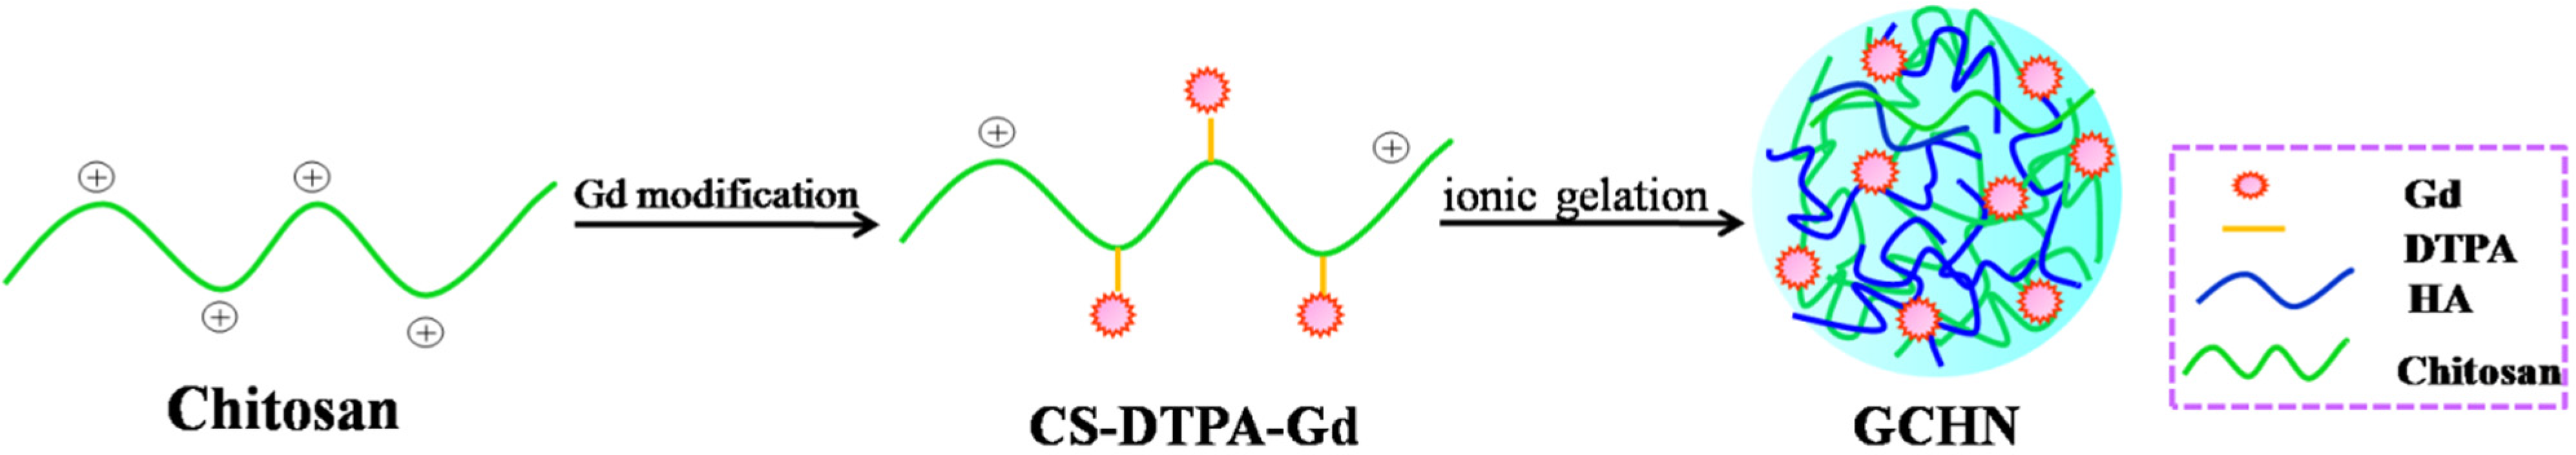
2.1. Synthesis of CS-DTPA-Gd


| Name | CS-DTPA-Gd20 | CS-DTPA-Gd40 | CS-DTPA-Gd60 |
|---|---|---|---|
| [DTPA]/[NH2] | 0.2 | 0.4 | 0.6 |
| nNH2 (mmol) | 0.3 | 0.3 | 0.3 |
| nDTPA (mmol) | 0.06 | 0.12 | 0.18 |
| nEDC (mmol) | 0.39 | 0.78 | 1.17 |
| nNHS (mmol) | 0.39 | 0.78 | 1.17 |
| mGd (mg) | 5.7 | 10.4 | 10.6 |
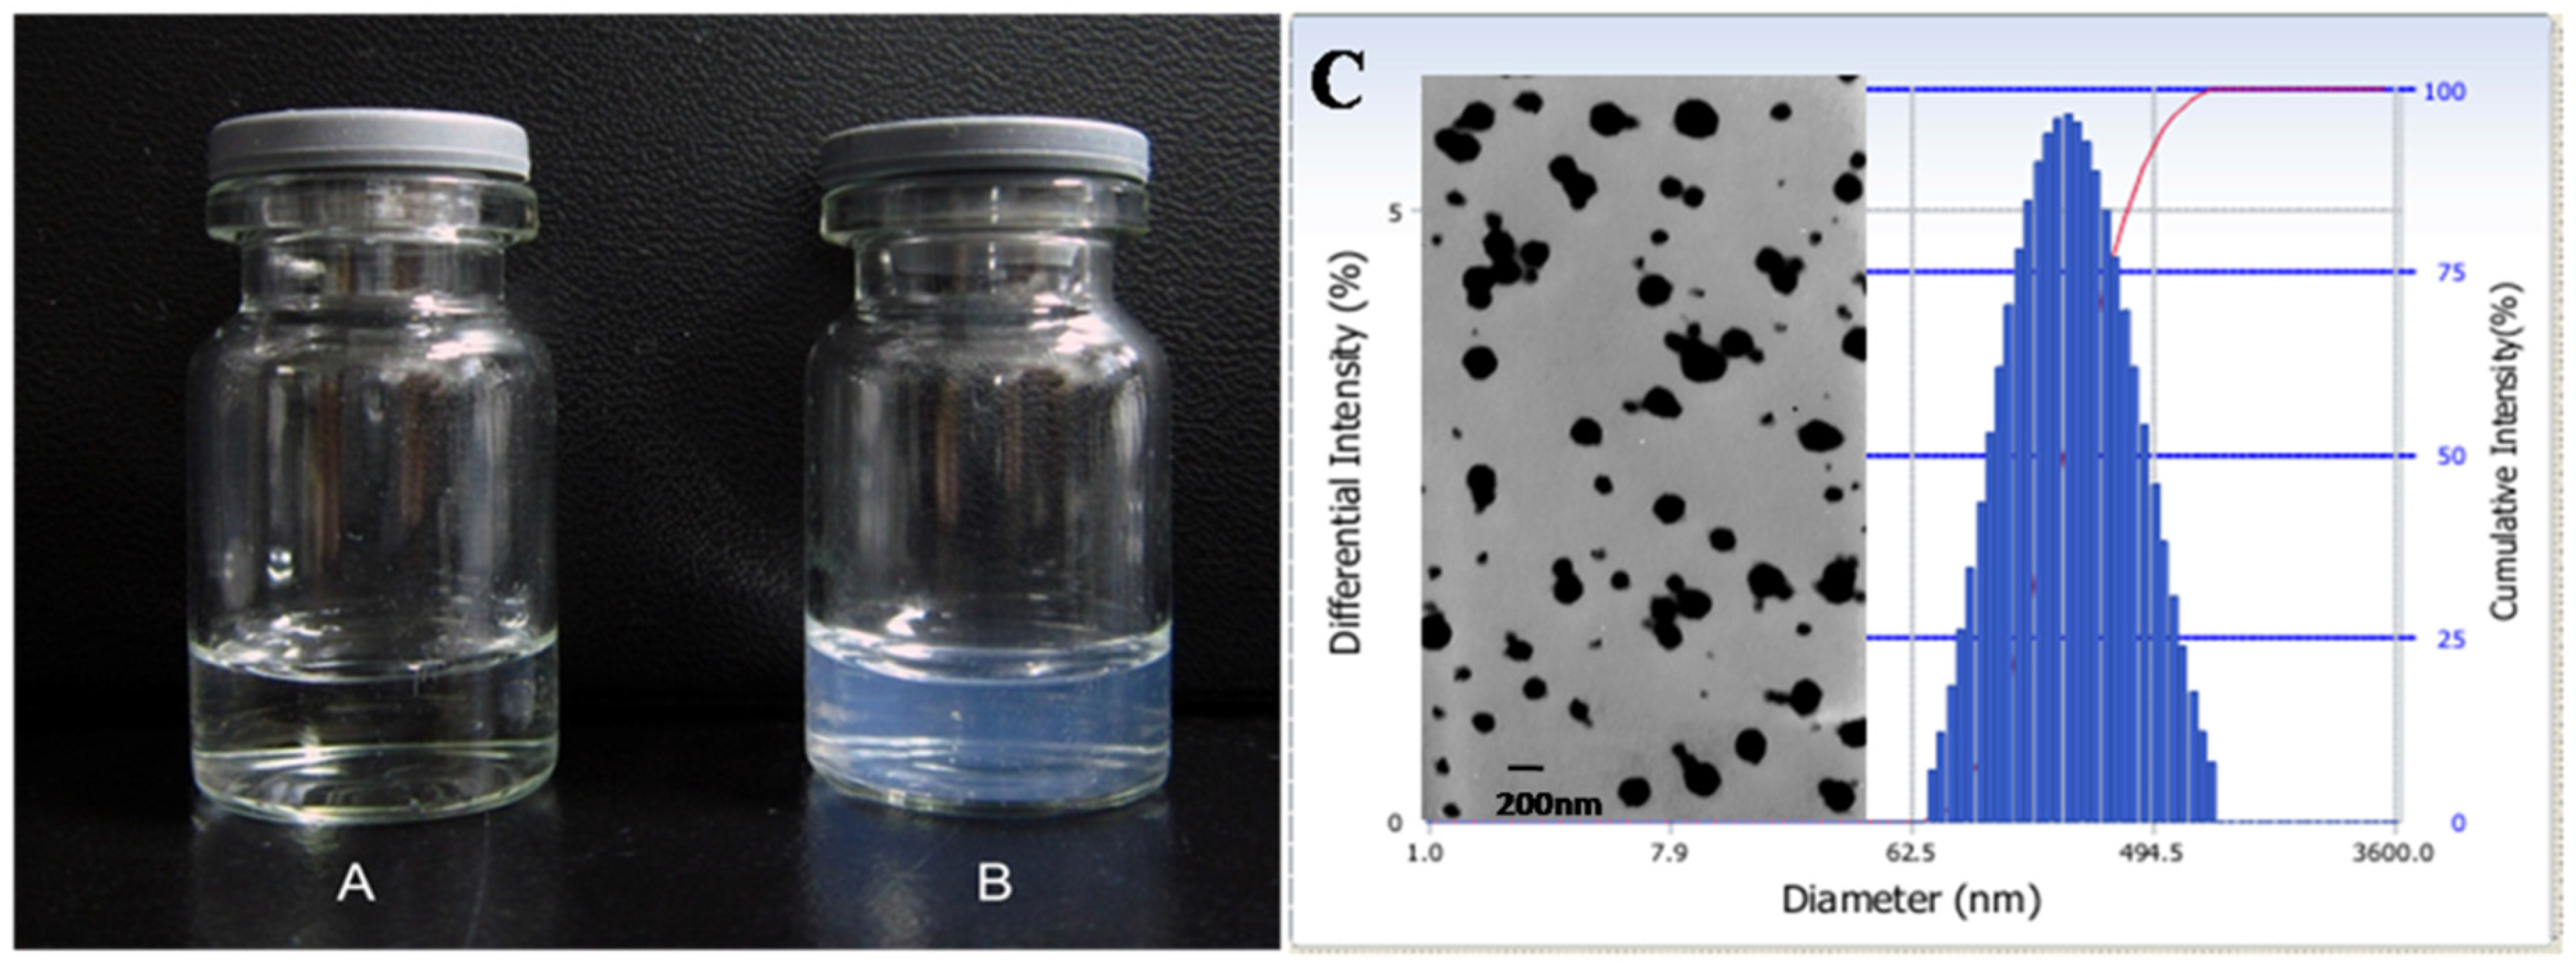
2.2. Preparation and Characterization of GCHN

2.3. In Vitro Cytotoxicity

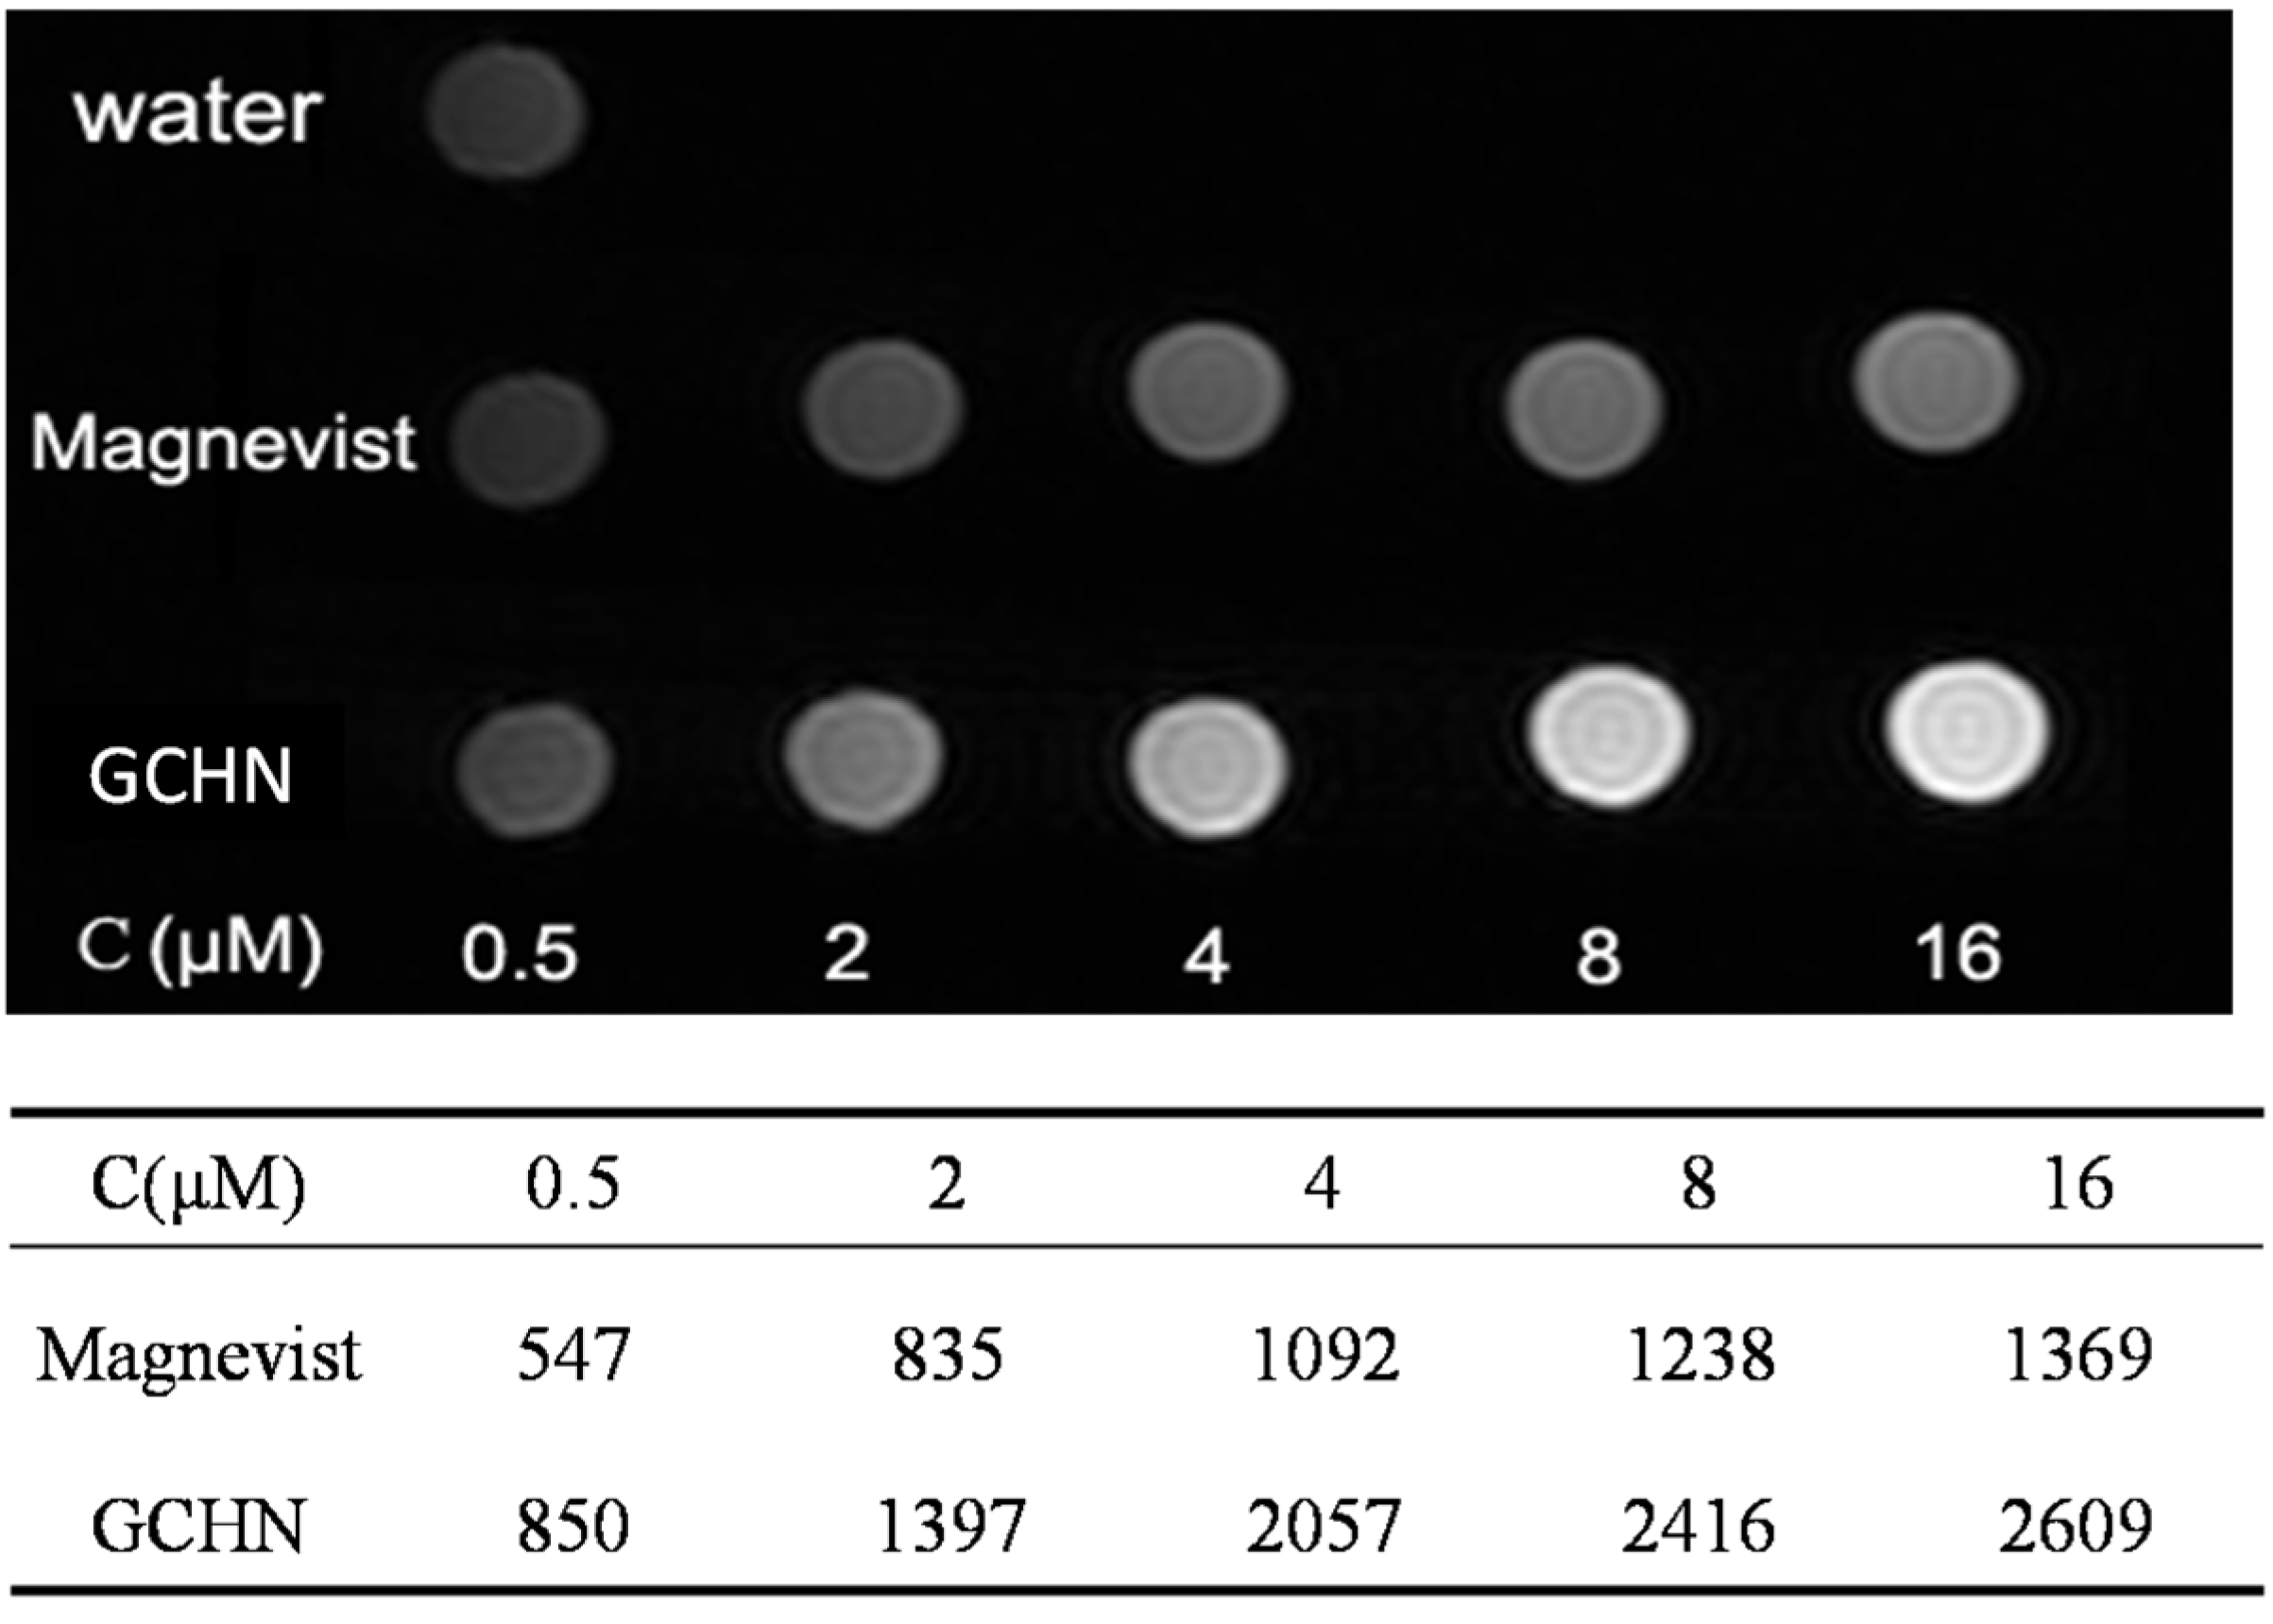
2.4. MRI In Vitro

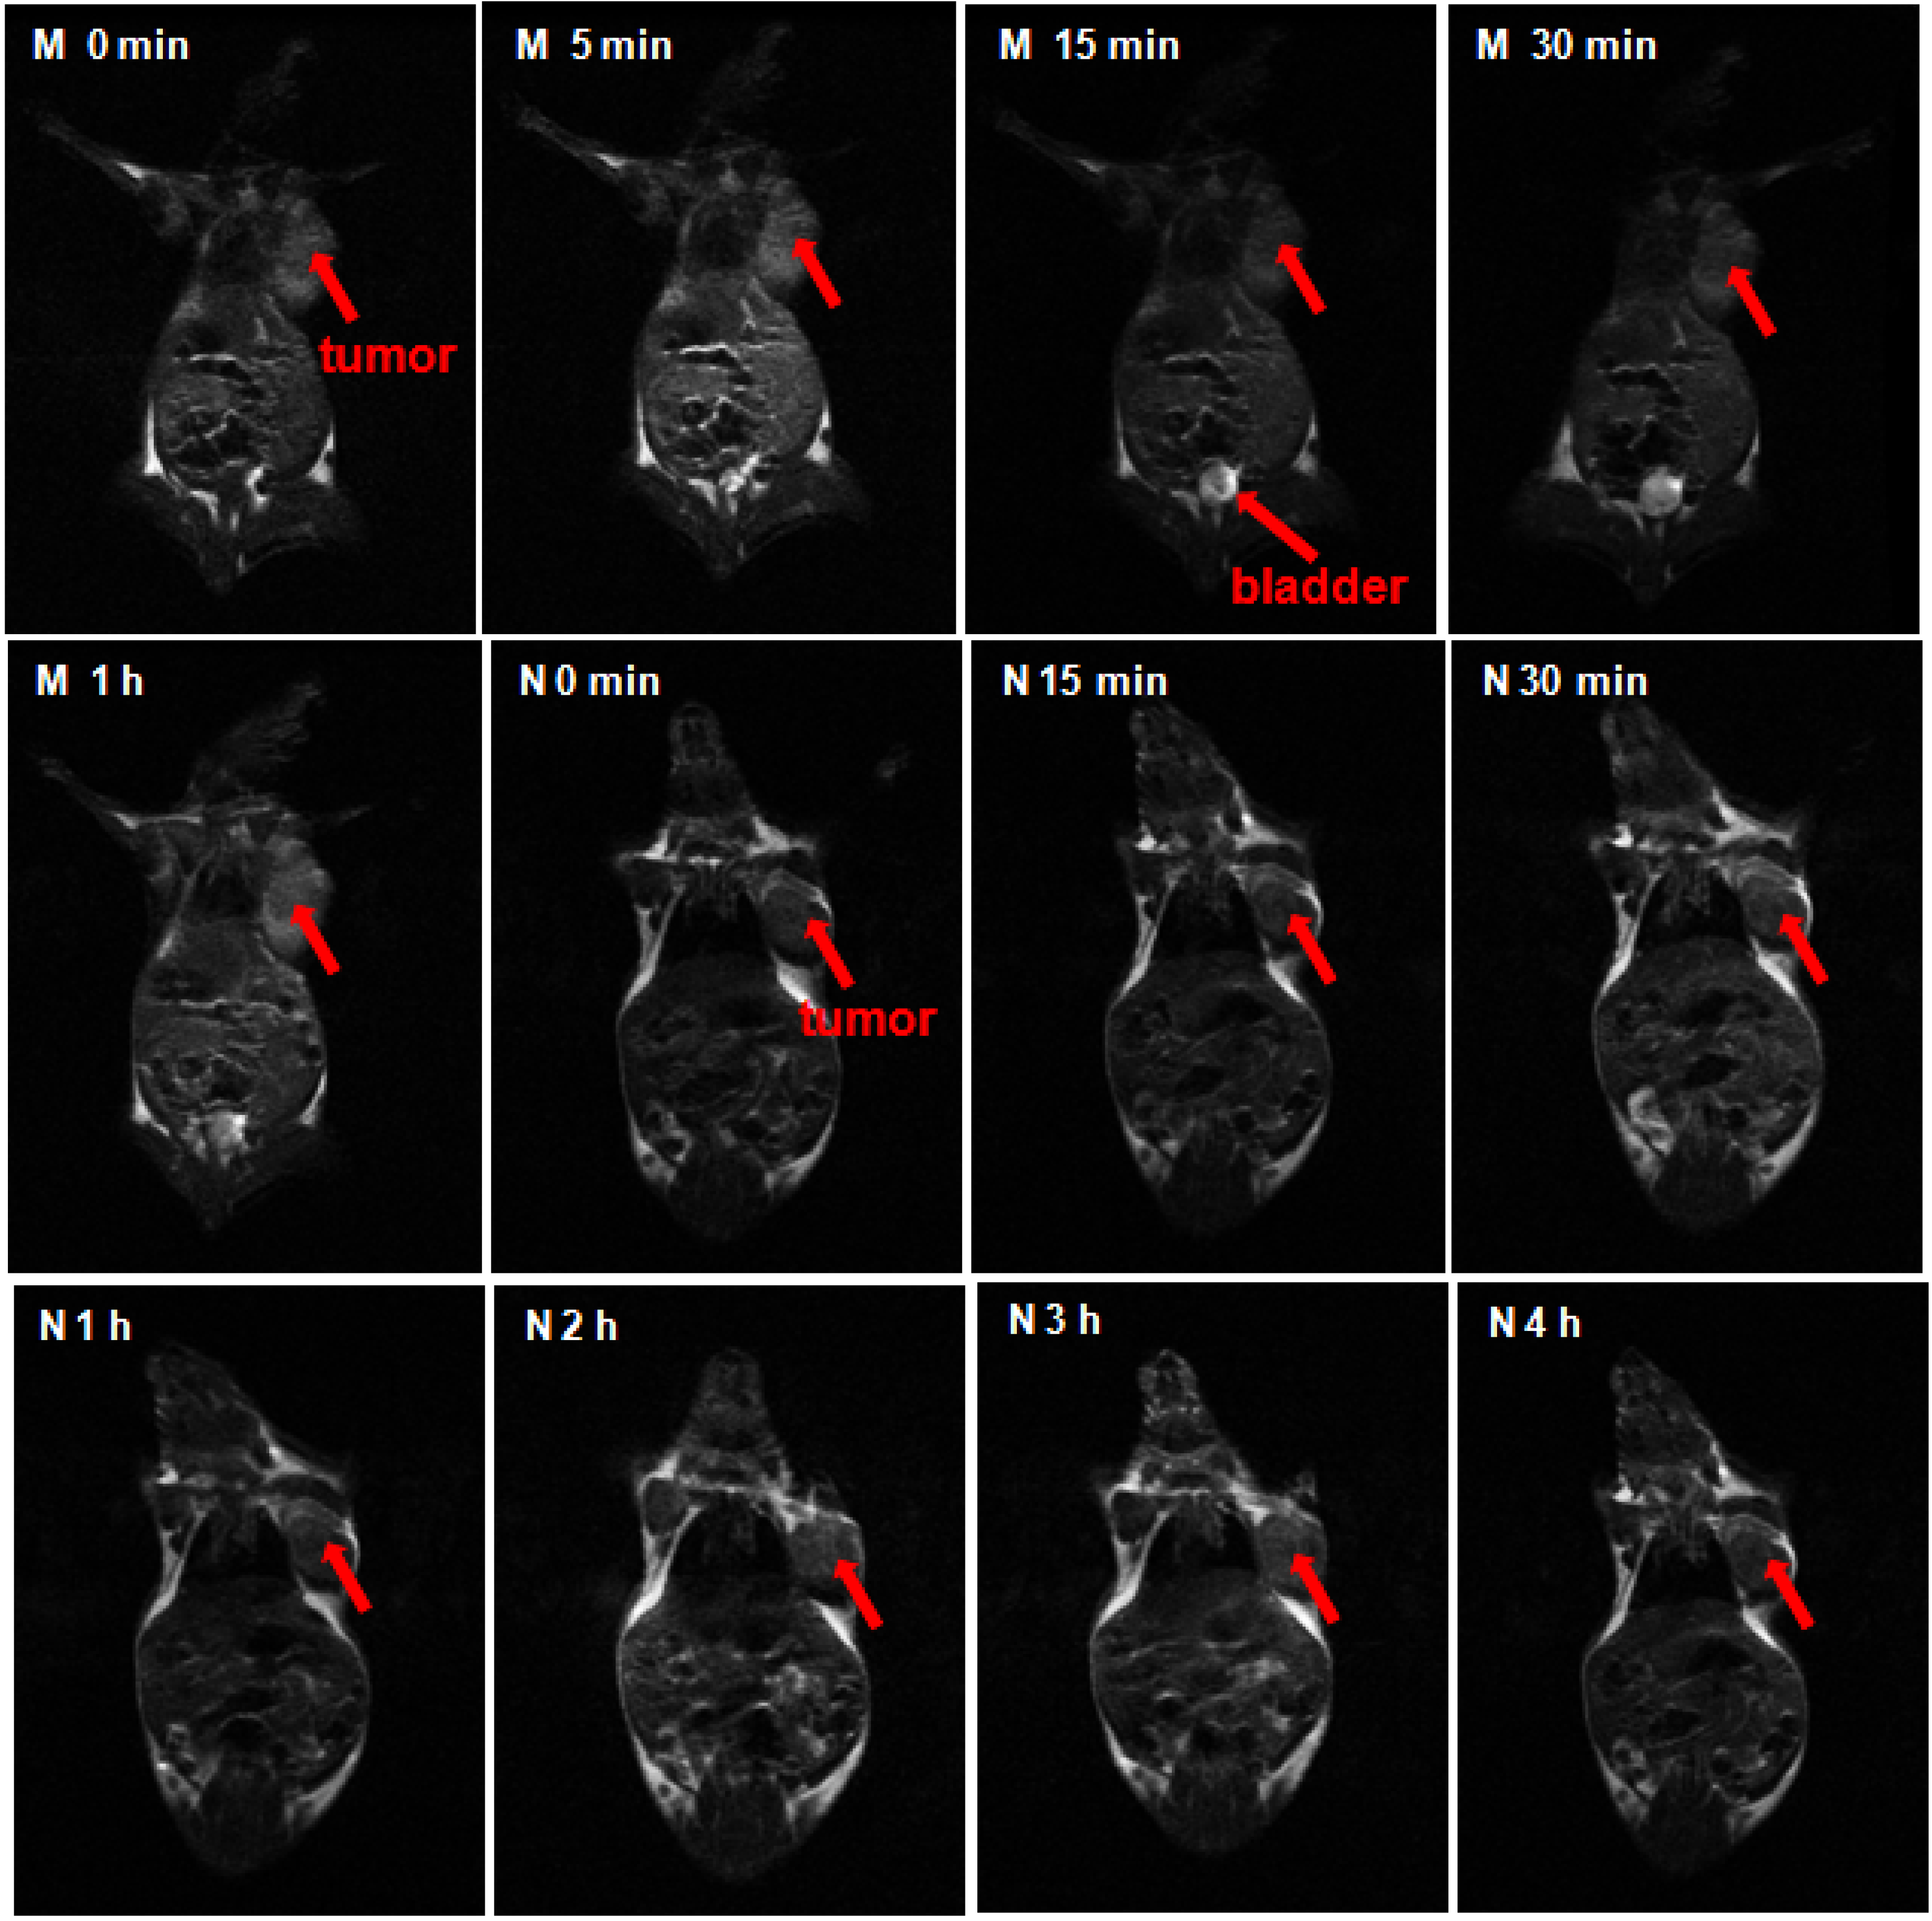
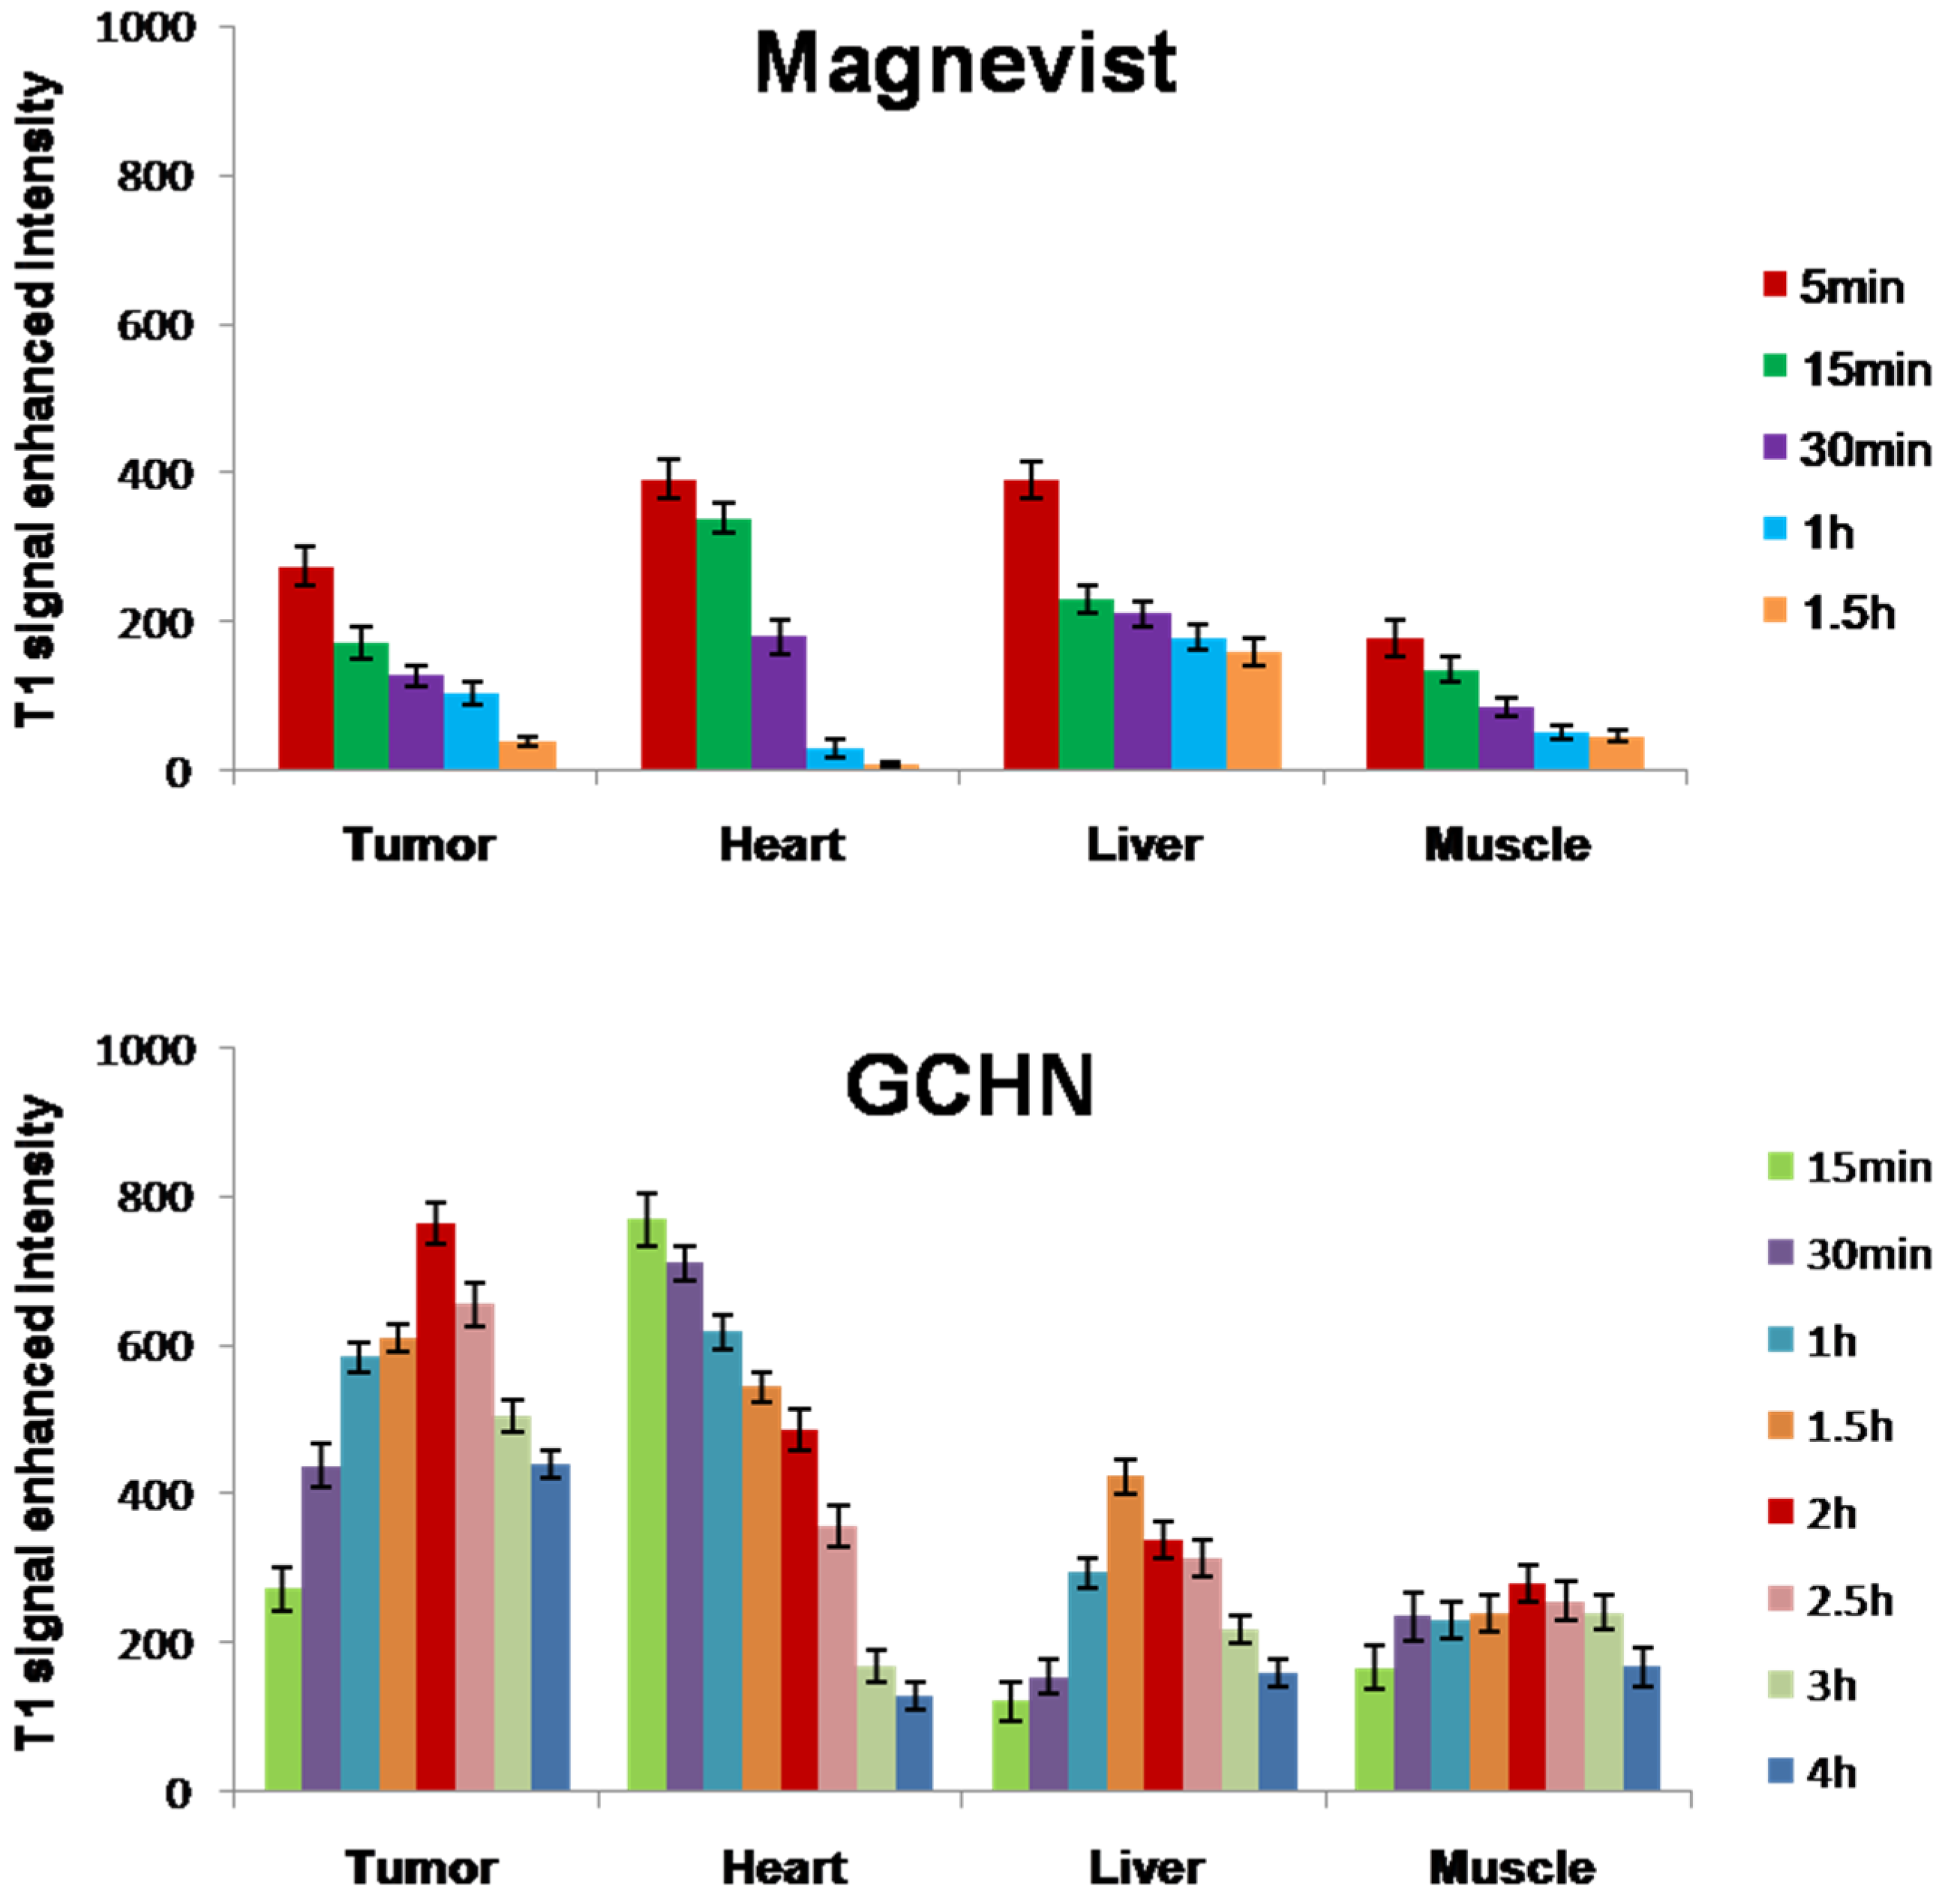
2.5. MRI In Vivo


2.6. Histological Assessment

3. Experimental Section
3.1. Materials
3.2. Synthesis of CS-DTPA-Gd
3.3. Preparation of GCHN
3.4. Characterization of GCHN
3.5. Cell Culture
3.6. In Vitro Cytotoxicity
3.7. MRI In Vitro
3.8. MRI In Vivo
3.9. Histological Assessment
3.10. Statistical Analysis
4. Conclusions
Acknowledgment
Author Contributions
Conflicts of Interest
References
- Weissleder, R. Molecular imaging in cancer. Science 2006, 312, 1168–1171. [Google Scholar] [CrossRef] [PubMed]
- Mi, P.; Cabral, H.; Kokuryo, D.; Rafi, M.; Terada, Y.; Aoki, I.; Saga, T.; Takehiko, I.; Nishiyama, N.; Kataoka, K. Gd-DTPA-loaded polymer–metal complex micelles with high relaxivity for MR cancer imaging. Biomaterials 2013, 34, 492–500. [Google Scholar] [CrossRef] [PubMed]
- Weissleder, R.; Pittet, M.J. Imaging in the era of molecular oncology. Nature 2008, 452, 580–589. [Google Scholar] [CrossRef] [PubMed]
- Manus, L.M.; Mastarone, D.J.; Waters, E.A.; Zhang, X.-Q.; Schultz-Sikma, E.A.; MacRenaris, K.W.; Ho, D.; Meade, T.J. Gd (III)-nanodiamond conjugates for MRI contrast enhancement. Nano Lett. 2009, 10, 484–489. [Google Scholar] [CrossRef] [PubMed]
- Tang, J.; Sheng, Y.; Hu, H.; Shen, Y. Macromolecular MRI contrast agents: Structures, properties and applications. Prog. Polym. Sci. 2013, 38, 462–502. [Google Scholar] [CrossRef]
- Xu, Q.; Zhu, L.; Yu, M.; Feng, F.; An, L.; Xing, C.; Wang, S. Gadolinium (III) chelated conjugated polymer as a potential MRI contrast agent. Polymer 2010, 51, 1336–1340. [Google Scholar] [CrossRef]
- Park, J.Y.; Baek, M.J.; Choi, E.S.; Woo, S.; Kim, J.H.; Kim, T.J.; Jung, J.C.; Chae, K.S.; Chang, Y.; Lee, G.H. Paramagnetic ultrasmall gadolinium oxide nanoparticles as advanced T1 MRI contrast agent: Account for large longitudinal relaxivity, optimal particle diameter, and in vivo T1 MR images. ACS Nano 2009, 3, 3663–3669. [Google Scholar] [CrossRef] [PubMed]
- Kim, K.S.; Park, W.; Hu, J.; Bae, Y.H.; Na, K. A cancer-recognizable MRI contrast agents using pH-responsive polymeric micelle. Biomaterials 2014, 35, 337–343. [Google Scholar] [CrossRef] [PubMed]
- Liu, F.; Feng, L.; Zhang, L.; Zhang, X.; Zhang, N. Synthesis, characterization and antitumor evaluation of CMCS-DTX conjugates as novel delivery platform for docetaxel. Int. J. Pharm. 2013, 451, 41–49. [Google Scholar] [CrossRef] [PubMed]
- Moriggi, L.; Cannizzo, C.; Dumas, E.; Mayer, C.R.; Ulianov, A.; Helm, L. Gold nanoparticles functionalized with gadolinium chelates as high-relaxivity MRI contrast agents. J. Am. Chem. Soc. 2009, 131, 10828–10829. [Google Scholar] [CrossRef] [PubMed]
- Cho, E.C.; Glaus, C.; Chen, J.; Welch, M.J.; Xia, Y. Inorganic nanoparticle-based contrast agents for molecular imaging. Trends Mol. Med. 2010, 16, 561–573. [Google Scholar] [CrossRef] [PubMed]
- Tan, M.; Ye, Z.; Jeong, E.-K.; Wu, X.; Parker, D.L.; Lu, Z.-R. Synthesis and evaluation of nanoglobular macrocyclic Mn (II) chelate conjugates as non-gadolinium (III) MRI contrast agents. Bioconjugate Chem. 2011, 22, 931–937. [Google Scholar] [CrossRef] [PubMed]
- Meyre, M.-E.; Raffard, G.; Franconi, J.-M.; Duguet, E.; Lambert, O.; Faure, C. Production of magnetic multilamellar liposomes as highly T2-efficient MRI contrast agents. Nanomed. Nanotechnol. Biol. Med. 2011, 7, 18–21. [Google Scholar] [CrossRef] [PubMed]
- Shiraishi, K.; Kawano, K.; Maitani, Y.; Yokoyama, M. Polyion complex micelle MRI contrast agents from poly (ethylene glycol)-b-poly (l-lysine) block copolymers having Gd-DOTA; preparations and their control of T1-relaxivities and blood circulation characteristics. J. Controlled Release 2010, 148, 160–167. [Google Scholar] [CrossRef] [PubMed]
- Nwe, K.; Bryant, L.H., Jr.; Brechbiel, M.W. Poly (amidoamine) dendrimer based MRI contrast agents exhibiting enhanced relaxivities derived via metal preligation techniques. Bioconjugate Chem. 2010, 21, 1014–1017. [Google Scholar] [CrossRef] [PubMed]
- Suma, T.; Miyata, K.; Ishii, T.; Uchida, S.; Uchida, H.; Itaka, K.; Nishiyama, N.; Kataoka, K. Enhanced stability and gene silencing ability of siRNA-loaded polyion complexes formulated from polyaspartamide derivatives with a repetitive array of amino groups in the side chain. Biomaterials 2012, 33, 2770–2779. [Google Scholar] [CrossRef] [PubMed]
- Zhang, Y.; Liu, J.; Fu, Y.; Tan, K.; Ye, Z.; Lang, M. Self-assembly of polyion complex nanocarriers from ammonium glycyrrhizinate and monomethoxy poly(ethylene glycol)-b-poly(γ-amino-ε-caprolactone). J. Mater. Chem. B 2013, 1, 1614–1621. [Google Scholar] [CrossRef]
- Yang, Y.; Wang, S.; Wang, Y.; Wang, X.; Wang, Q.; Chen, M. Advances in self-assembled chitosan nanomaterials for drug delivery. Biotechnol. Adv. 2014, 32, 1301–1316. [Google Scholar] [CrossRef] [PubMed]
- Agnihotri, S.A.; Mallikarjuna, N.N.; Aminabhavi, T.M. Recent advances on chitosan-based micro-and nanoparticles in drug delivery. J. Controlled Release 2004, 100, 5–28. [Google Scholar] [CrossRef] [PubMed]
- Dash, M.; Chiellini, F.; Ottenbrite, R.M.; Chiellini, E. Chitosan—A versatile semi-synthetic polymer in biomedical applications. Prog. Polym. Sci. 2011, 36, 981–1014. [Google Scholar] [CrossRef]
- Sonaje, K.; Chuang, E.-Y.; Lin, K.-J.; Yen, T.-C.; Su, F.-Y.; Tseng, M.T.; Sung, H.-W. Opening of epithelial tight junctions and enhancement of paracellular permeation by chitosan: Microscopic, ultrastructural, and computed-tomographic observations. Mol. Pharm. 2012, 9, 1271–1279. [Google Scholar] [CrossRef] [PubMed]
- Bhang, S.H.; Won, N.; Lee, T.-J.; Jin, H.; Nam, J.; Park, J.; Chung, H.; Park, H.-S.; Sung, Y.-E.; Hahn, S.K. Hyaluronic acid-quantum dot conjugates for in vivo lymphatic vessel imaging. ACS Nano 2009, 3, 1389–1398. [Google Scholar] [CrossRef] [PubMed]
- Zhang, L.; Zhang, N. How nanotechnology can enhance docetaxel therapy. Int. J. Nanomed. 2013, 8, 2927. [Google Scholar] [CrossRef] [PubMed]
- Oh, E.J.; Park, K.; Kim, K.S.; Kim, J.; Yang, J.-A.; Kong, J.-H.; Lee, M.Y.; Hoffman, A.S.; Hahn, S.K. Target specific and long-acting delivery of protein, peptide, and nucleotide therapeutics using hyaluronic acid derivatives. J. Controlled Release 2010, 141, 2–12. [Google Scholar] [CrossRef] [PubMed]
- Oyarzun-Ampuero, F.; Brea, J.; Loza, M.; Torres, D.; Alonso, M. Chitosan-hyaluronic acid nanoparticles loaded with heparin for the treatment of asthma. Int. J. Pharm. 2009, 381, 122–129. [Google Scholar] [CrossRef] [PubMed]
- Al-Qadi, S.; Alatorre-Meda, M.; Zaghloul, E.M.; Taboada, P.; Remunán-López, C. Chitosan-hyaluronic acid nanoparticles for gene silencing: The role of hyaluronic acid on the nanoparticles’ formation and activity. Colloids Surf. B 2013, 103, 615–623. [Google Scholar] [CrossRef] [PubMed]
- Deng, X.; Cao, M.; Zhang, J.; Hu, K.; Yin, Z.; Zhou, Z.; Xiao, X.; Yang, Y.; Sheng, W.; Wu, Y. Hyaluronic acid-chitosan nanoparticles for co-delivery of MIR-34A and doxorubicin in therapy against triple negative breast cancer. Biomaterials 2014, 35, 4333–4344. [Google Scholar] [CrossRef] [PubMed]
- Caravan, P. Strategies for increasing the sensitivity of gadolinium based MRI contrast agents. Chem. Soc. Rev. 2006, 35, 512–523. [Google Scholar] [CrossRef] [PubMed]
- Zhang, L.; Liu, Y.; Yu, D.; Zhang, N. Gadolinium-loaded chitosan nanoparticles as magnetic resonance imaging contrast agents for the diagnosis of tumor. J. Biomed. Nanotechnol. 2013, 9, 863–869. [Google Scholar] [CrossRef] [PubMed]
- Chung, T.W.; Yang, J.; Akaike, T.; Cho, K.Y.; Nah, J.W.; Kim, S.I.; Cho, C.S. Preparation of alginate/galactosylated chitosan scaffold for hepatocyte attachment. Biomaterials 2002, 23, 2827–2834. [Google Scholar] [CrossRef]
- Huang, M.; Huang, Z.L.; Bilgen, M.; Berkland, C. Magnetic resonance imaging of contrast-enhanced polyelectrolyte complexes. Nanomed. Nanotechnol. Biol. Med. 2008, 4, 30–40. [Google Scholar] [CrossRef] [PubMed]
- Duceppe, N.; Tabrizian, M. Factors influencing the transfection efficiency of ultra low molecular weight chitosan/hyaluronic acid nanoparticles. Biomaterials 2009, 30, 2625–2631. [Google Scholar] [CrossRef] [PubMed]
- Nasti, A.; Zaki, N.M.; de Leonardis, P.; Ungphaiboon, S.; Sansongsak, P.; Rimoli, M.G.; Tirelli, N. Chitosan/TPP and chitosan/TPP-hyaluronic acid nanoparticles: Systematic optimisation of the preparative process and preliminary biological evaluation. Pharm. Res. 2009, 26, 1918–1930. [Google Scholar] [CrossRef] [PubMed]
- Yang, X.-Y.; Li, Y.-X.; Li, M.; Zhang, L.; Feng, L.-X.; Zhang, N. Hyaluronic acid-coated nanostructured lipid carriers for targeting paclitaxel to cancer. Cancer Lett. 2013, 334, 338–345. [Google Scholar] [CrossRef] [PubMed]
- Pilon-Thomas, S.; Verhaegen, M.; Kuhn, L.; Riker, A.; Mulé, J.J. Induction of anti-tumor immunity by vaccination with dendritic cells pulsed with anti-CD44 IgG opsonized tumor cells. Cancer Immunol. Immunother. 2006, 55, 1238–1246. [Google Scholar] [CrossRef]
- Darras, V.; Nelea, M.; Winnik, F.M.; Buschmann, M.D. Chitosan modified with gadolinium diethylenetriaminepentaacetic acid for magnetic resonance imaging of DNA/chitosan nanoparticles. Carbohydr. Polym. 2010, 80, 1137–1146. [Google Scholar] [CrossRef]
- Chen, Z.; Yu, D.; Liu, C.; Yang, X.; Zhang, N.; Ma, C.; Song, J.; Lu, Z. Gadolinium-conjugated PLA-PEG nanoparticles as liver targeted molecular MRI contrast agent. J. Drug Target 2011, 19, 657–665. [Google Scholar] [CrossRef] [PubMed]
- De la Fuente, M.; Seijo, B.; Alonso, M.J. Novel hyaluronic acid-chitosan nanoparticles for ocular gene therapy. Investig. Ophthalmol. Vis. Sci. 2008, 49, 2016–2024. [Google Scholar] [CrossRef] [PubMed]
- Liu, Y.; Chen, Z.; Liu, C.; Yu, D.; Lu, Z.; Zhang, N. Gadolinium-loaded polymeric nanoparticles modified with anti-VEGF as multifunctional MRI contrast agents for the diagnosis of liver cancer. Biomaterials 2011, 32, 5167–5176. [Google Scholar] [CrossRef] [PubMed]
- Luo, K.; Li, C.; Li, L.; She, W.; Wang, G.; Gu, Z. Arginine functionalized peptide dendrimers as potential gene delivery vehicles. Biomaterials 2012, 33, 4917–4927. [Google Scholar] [CrossRef] [PubMed]
© 2015 by the authors; licensee MDPI, Basel, Switzerland. This article is an open access article distributed under the terms and conditions of the Creative Commons Attribution license (http://creativecommons.org/licenses/by/4.0/).
Share and Cite
Zhang, L.; Liu, T.; Xiao, Y.; Yu, D.; Zhang, N. Hyaluronic Acid-Chitosan Nanoparticles to Deliver Gd-DTPA for MR Cancer Imaging. Nanomaterials 2015, 5, 1379-1396. https://doi.org/10.3390/nano5031379
Zhang L, Liu T, Xiao Y, Yu D, Zhang N. Hyaluronic Acid-Chitosan Nanoparticles to Deliver Gd-DTPA for MR Cancer Imaging. Nanomaterials. 2015; 5(3):1379-1396. https://doi.org/10.3390/nano5031379
Chicago/Turabian StyleZhang, Li, Tingxian Liu, Yanan Xiao, Dexin Yu, and Na Zhang. 2015. "Hyaluronic Acid-Chitosan Nanoparticles to Deliver Gd-DTPA for MR Cancer Imaging" Nanomaterials 5, no. 3: 1379-1396. https://doi.org/10.3390/nano5031379