5.1. Gemmological Properties and 3D Visualisation of the Tourmaline Inclusions
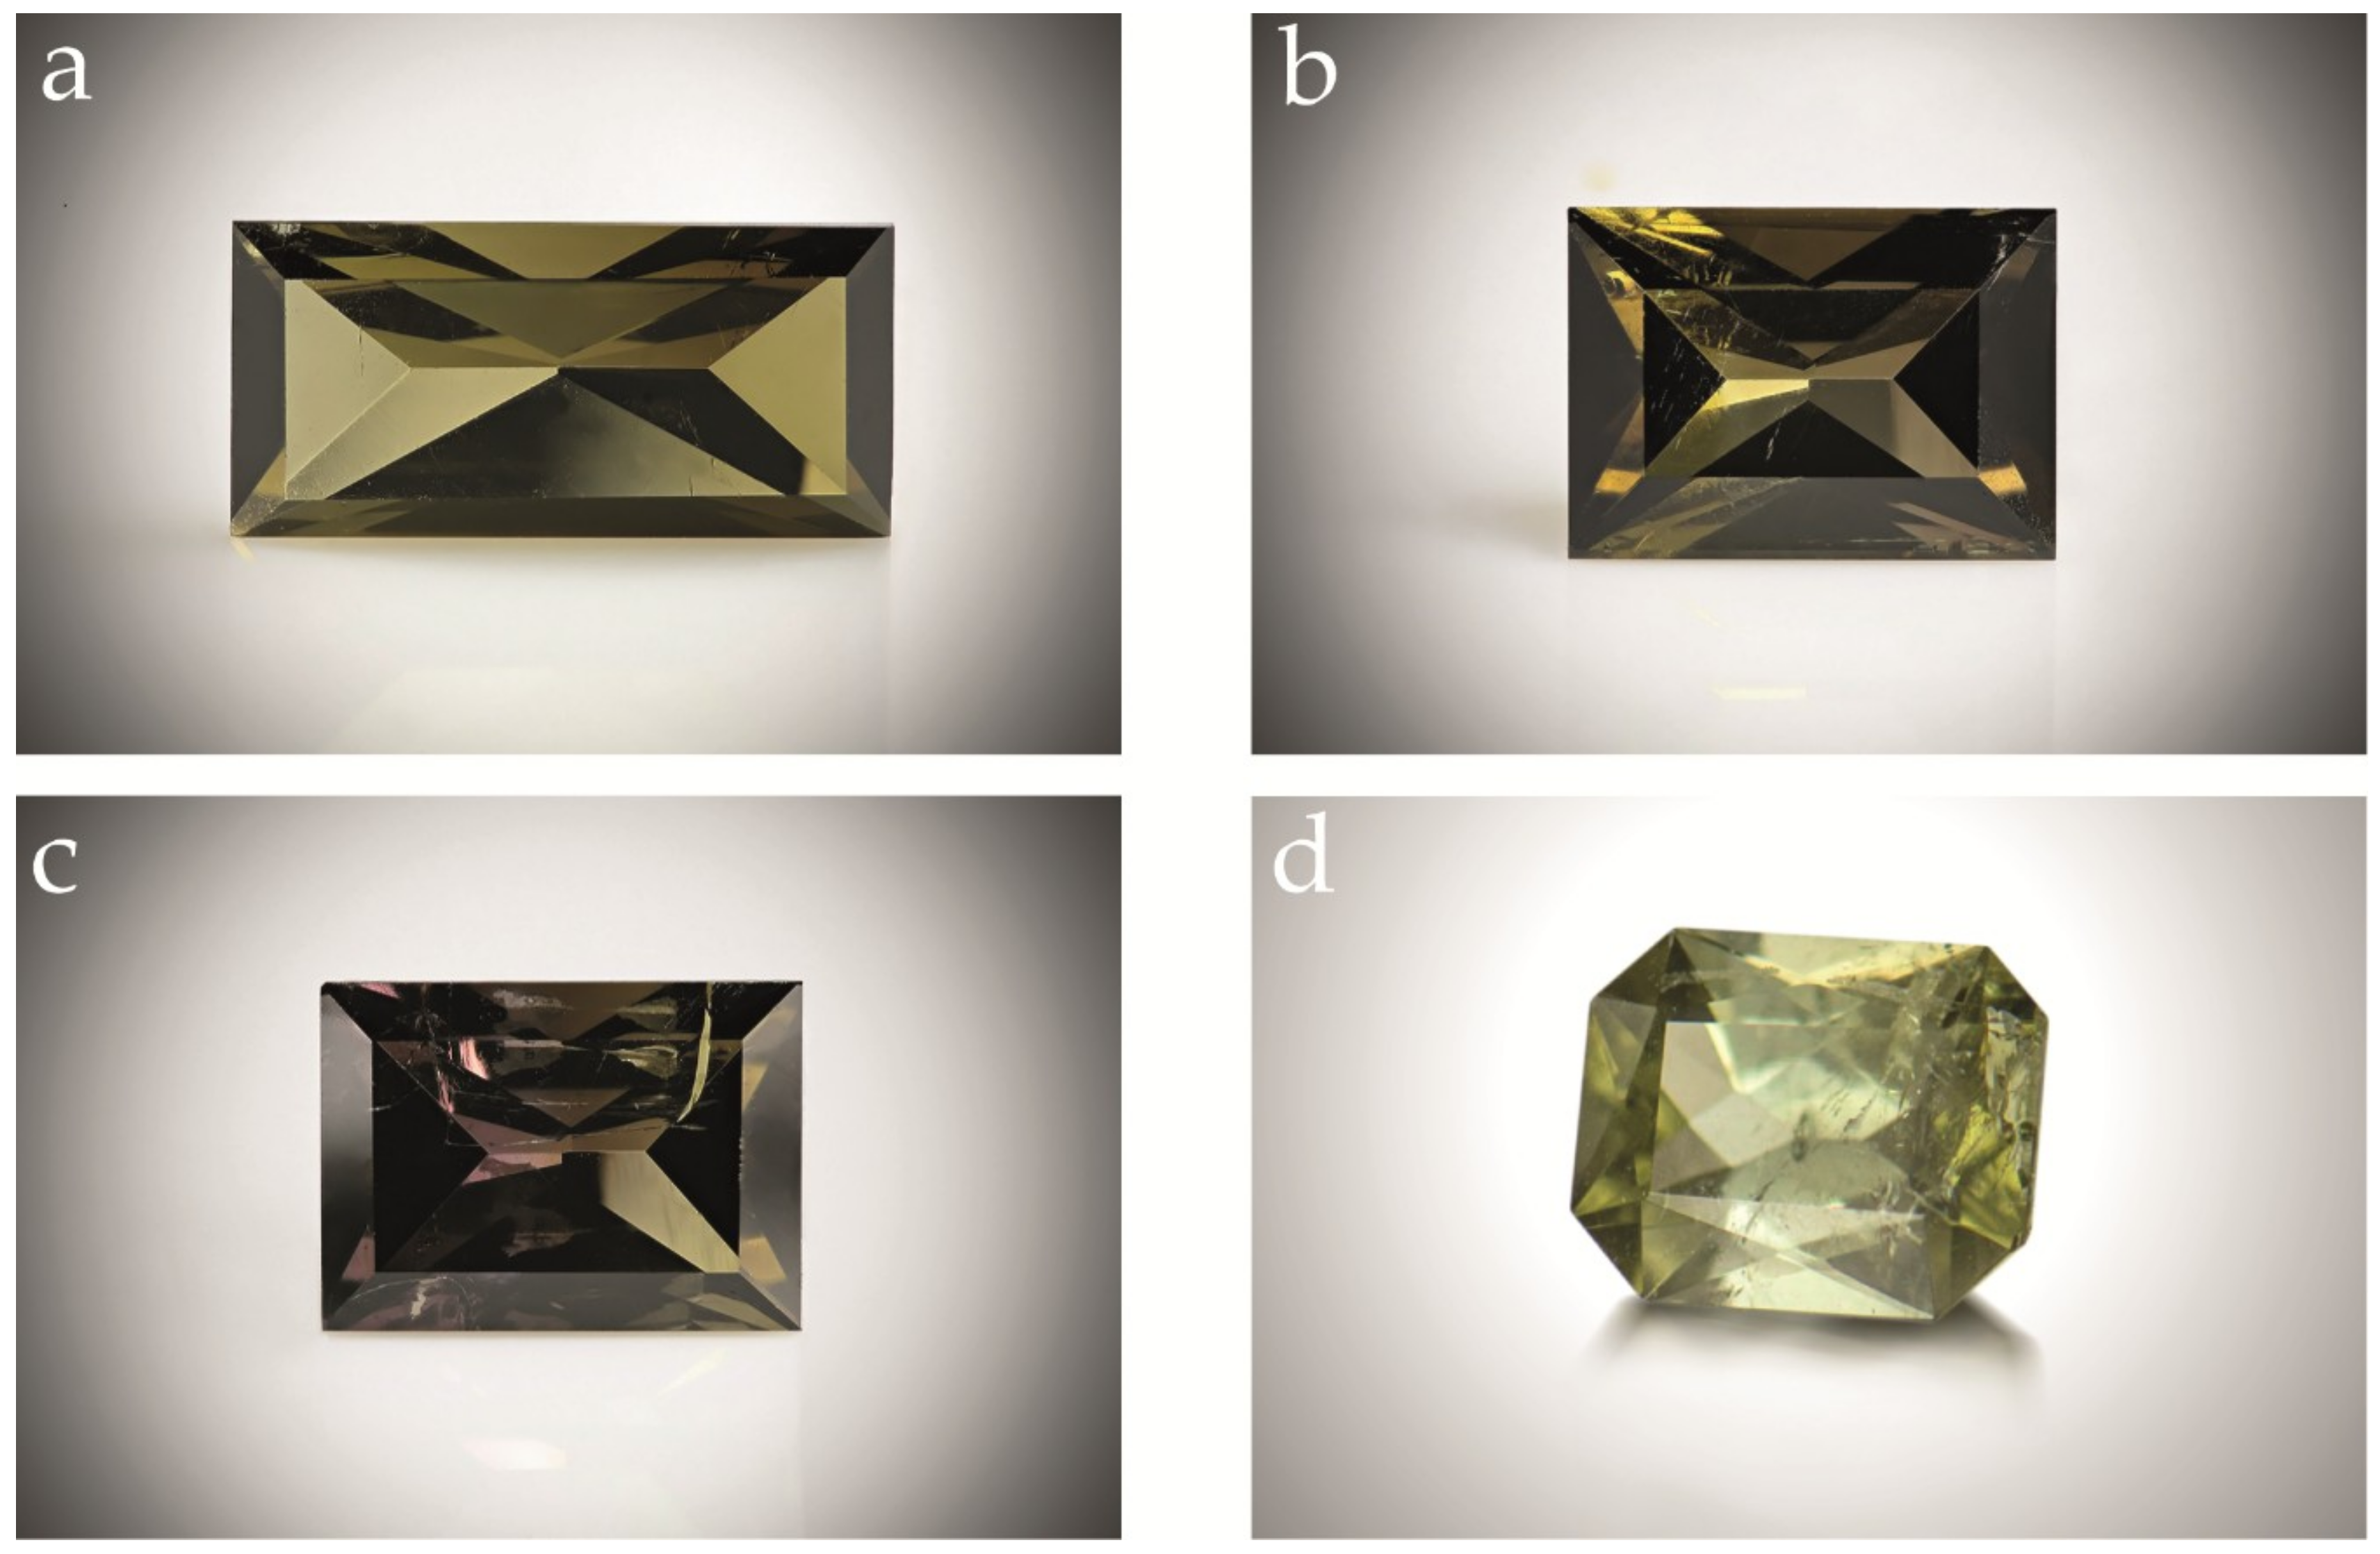
From a gemmological point of view, the four faceted tourmalines are all transparent, with a colour ranging from green to brown (
Figure 2). The specific gravity results from 3.09 to 3.13 g/cm
3, which is typical of elbaitic tourmaline [
22]. The optic character is uniaxial negative, and the refractive indices are
nω = 1.640 and
nε = 1.620 with a birefringence of 0.020, which is in agreement with the values of elbaite [
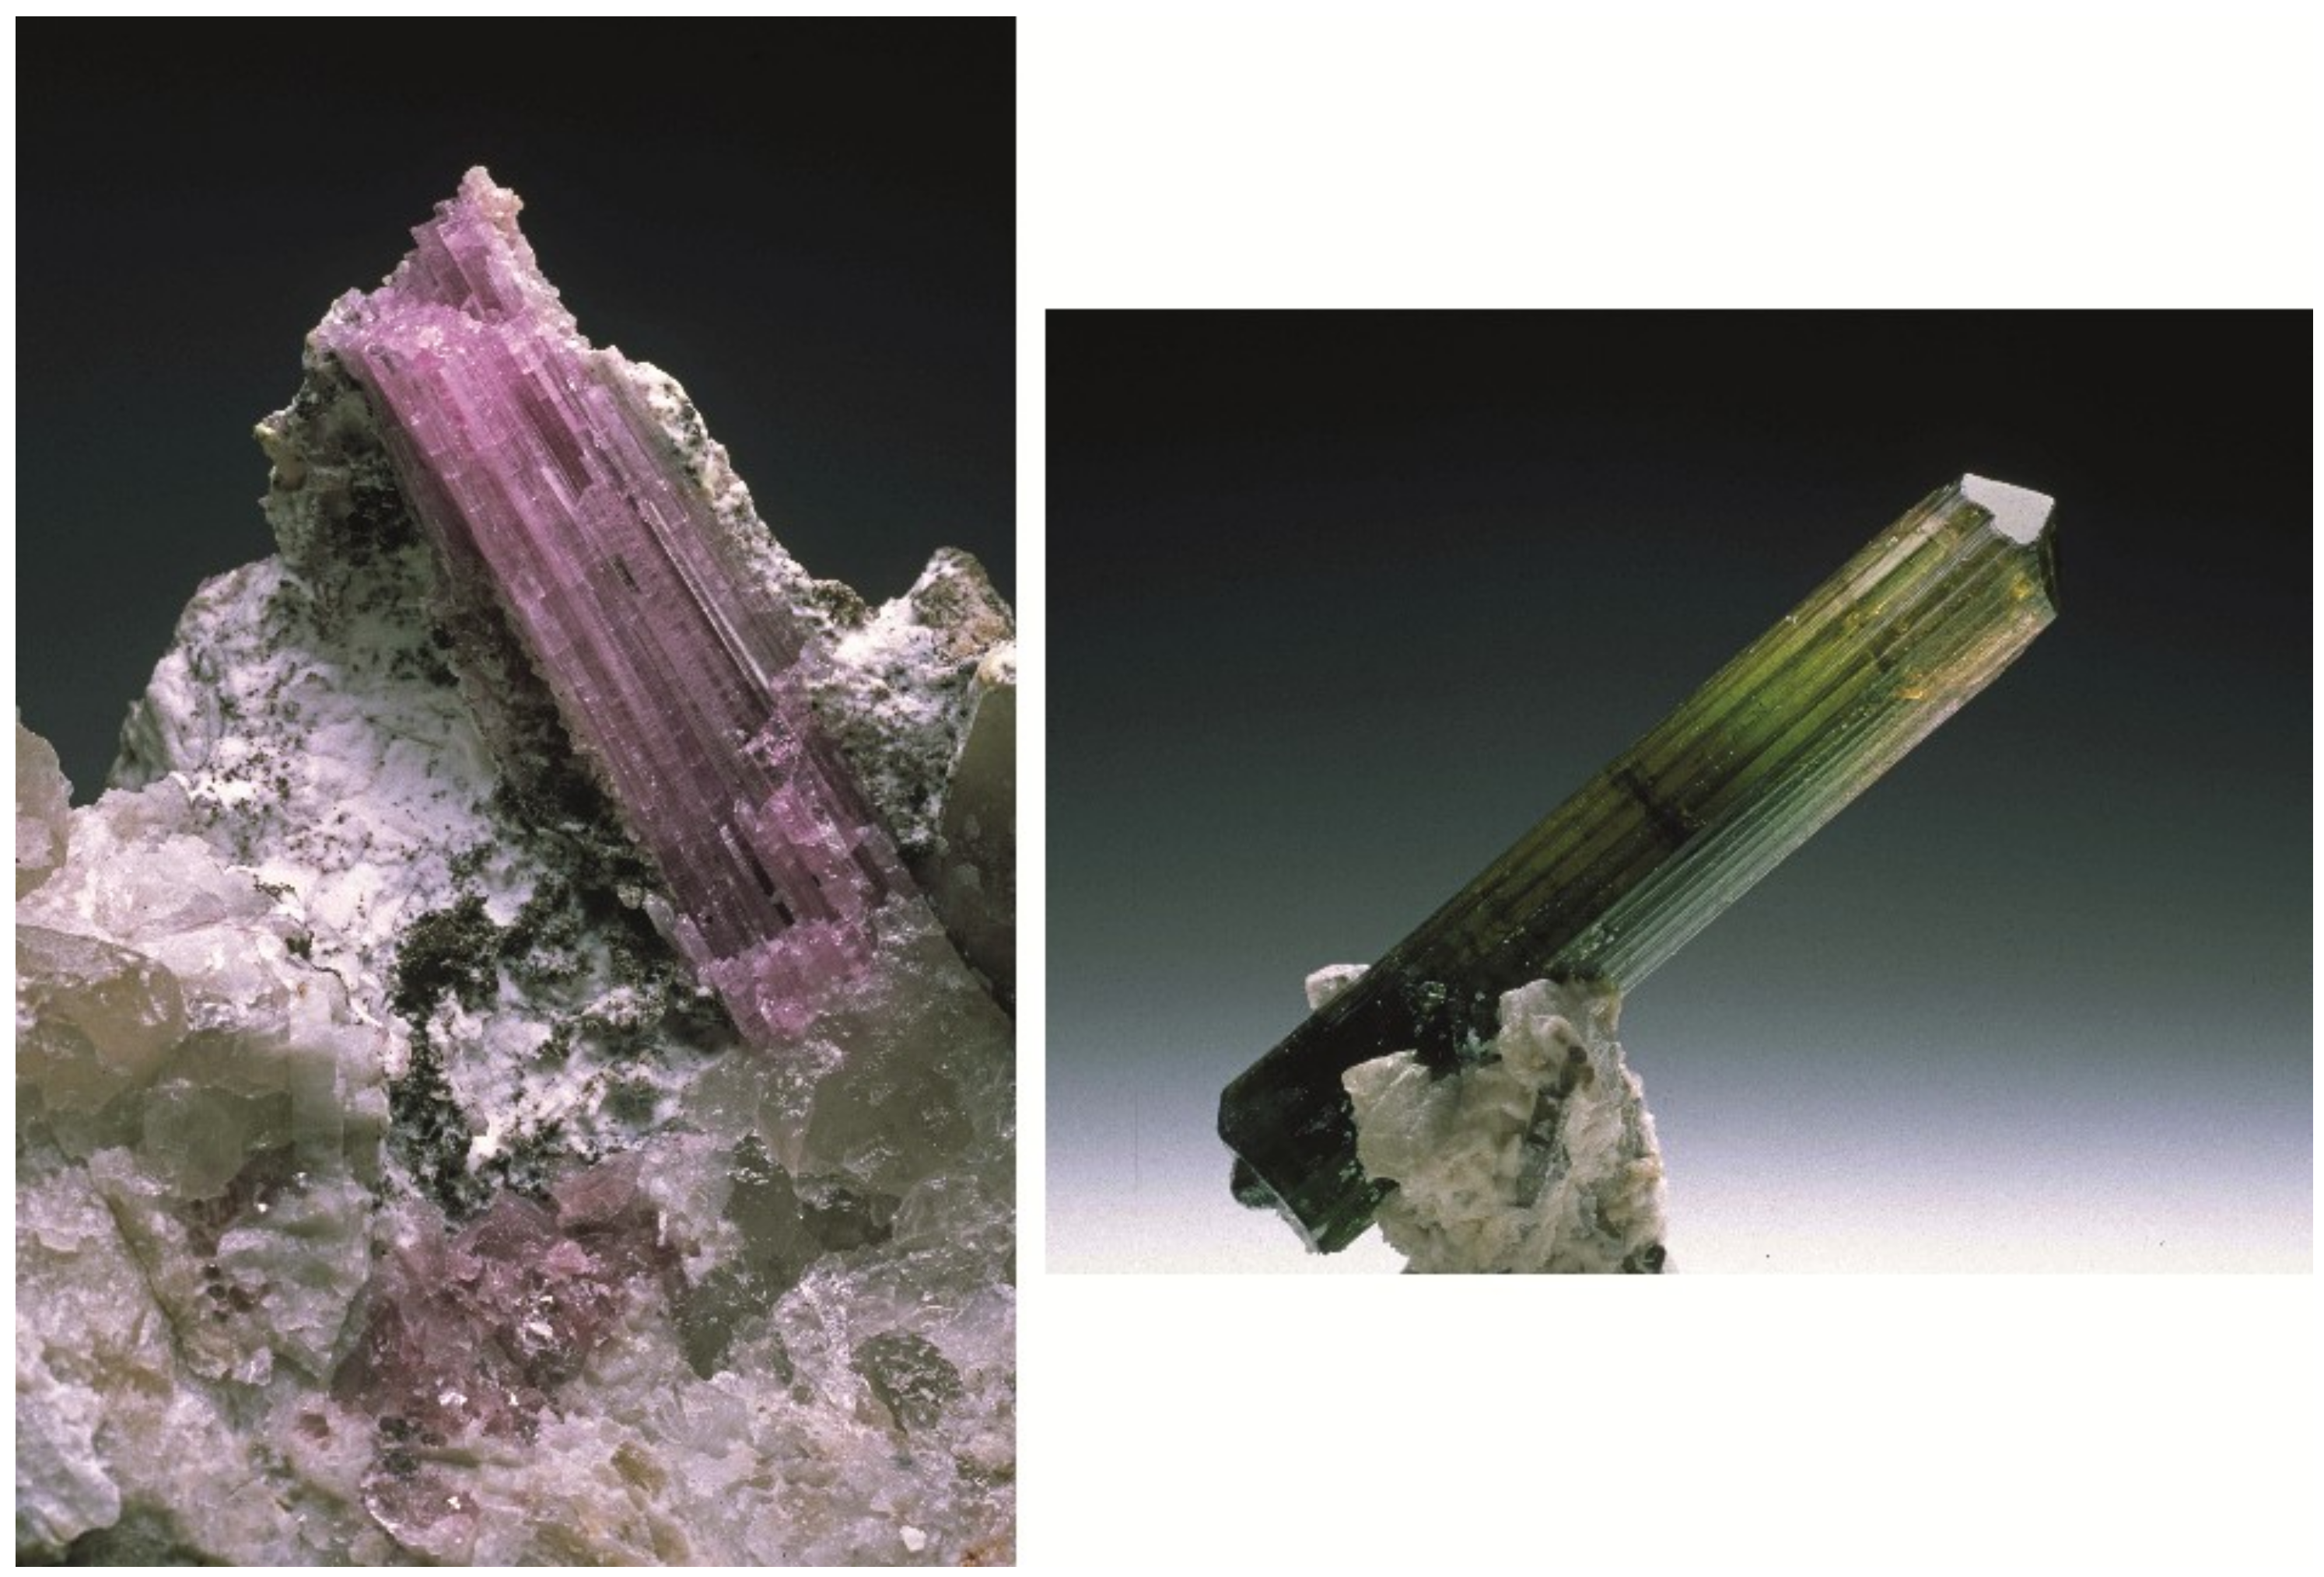
22]. The samples show a strong dichroism, in the green and brown hues, and they are all inert to ultraviolet radiation. Microscopic observations revealed that the samples contain a few inclusions, typically fluid inclusions, often with a fringed aspect, also called “thrichites” in gemology [
23].
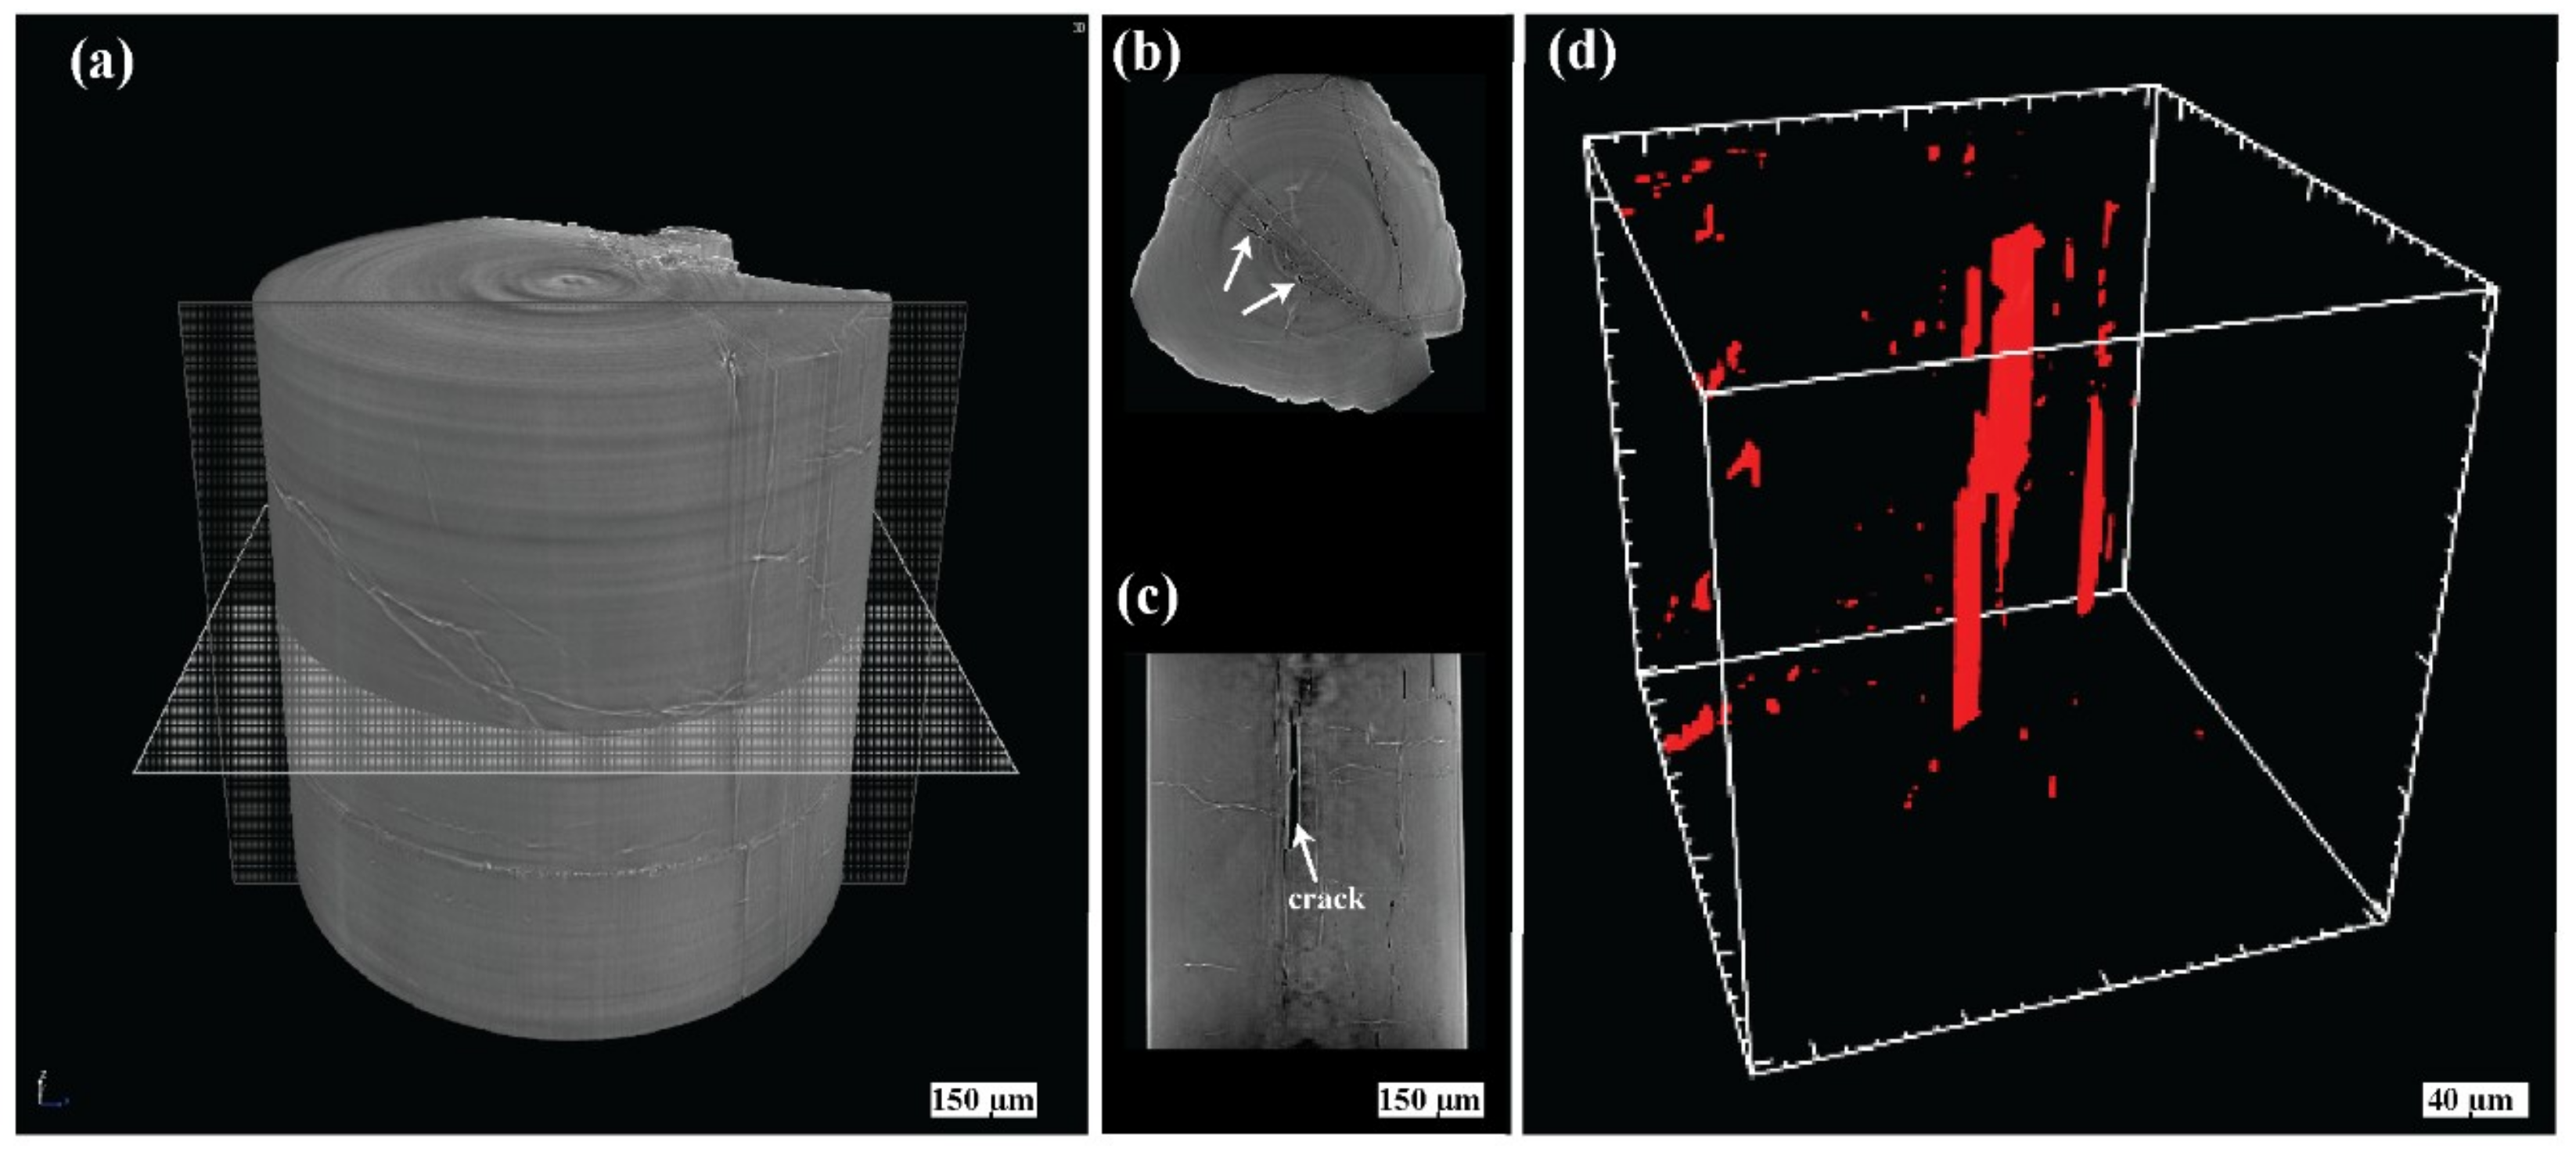
More details were provided by the 3D visualisation, which made it possible to display internal features and to quantify the porosity, cracks and voids of fragments from the prismatic portion of samples 7 and 8.
The volume rendering of the tourmaline sample is reported in
Figure 4a, whereas the cross sectional slices, displaying the general appearance of the microstructural features in the grains, are highlighted in
Figure 4b,c. In particular, the reconstructed 3D images show that tourmalines are characterised by pores and cracks, the detail of whose volume rendering is displayed in
Figure 4d.
The total measured porosity accounts for about 0.9 vol.% and is given as the sum of the voids/pores (0.1 vol.%) and cracks (0.8 vol.%), respectively. Please note that the distinction between voids and cracks, which are characterised by the same grey scale values, was performed by considering some morphological features as described in [
24]. In particular, the voids appear as spherical bubbles with a small surface/volume ratio (normalized to a sphere) and a low aspect ratio as well. On the contrary, cracks show a medium to medium-high surface/volume ratio, together with high values of aspect ratio.
The rendering pointed out that the voids appear spherical in shape, with an equivalent diameter ranging from 10 to 15 μm. Morphometric data showed that they are homogeneously distributed within the entire volume and are mostly isolated without any preferred orientation.
Tourmaline crystals show a predominance of crack spacing from the centre to the outer part of the crystals, with a non-homogenous spatial distribution and a heterogeneous size ranging from 20 to 200 μm. The fractures are mostly flat with a regular surface and appear oriented preferentially parallel to the z-axis. Finally, the results of the skeleton analysis pointed out that the crack connectivity is null, because they lack a connected network.
5.2. Chemical Composition
Electron microprobe analyses (EMPA) and backscattered electron (BKSE) images were performed to chemically characterize 10 of the selected samples. Analytical profiles from core to rim or from rim to rim were carried out with step width depending on the crystal size. LA-ICP-MS analyses were performed on the same samples in the areas previously analysed by EMPA-WDS.
The values of Li
2O measured by LA-ICP-MS indicated that tourmalines contain an average of 1.8 wt % of Li
2O (ranging from 0.7 to 2.7 wt %), and the result is comparable to that calculated by stoichiometry from the results of the electron microprobe analyses. The studied tourmaline samples exhibit extremely convoluted chemical zoning and are very similar in composition, all classifiable as Li-bearing tourmalines: elbaite (Na(Li
1.5,Al
1.5)Al
6(BO
3)
3Si
6O
18(OH)
4), rossmanite (γ(LiAl
2)Al
6(BO
3)
3Si
6O
18(OH)
4), fluor-elbaite (Na(Li
1.5,Al
1.5)Al
6(BO
3)
3Si
6O
18(OH)
3F) and fluor-liddicoatite (Ca(LiAl
2)Al
6(BO
3)
3Si
6O
18(OH)
3F). Minor foitite (γFe
2+2Al)Al
6(BO
3)
3Si
6O
18(OH)
4), a rare tourmaline iron rich in
Y-site and with more than 50% vacant
X-sites [
25], was also found.
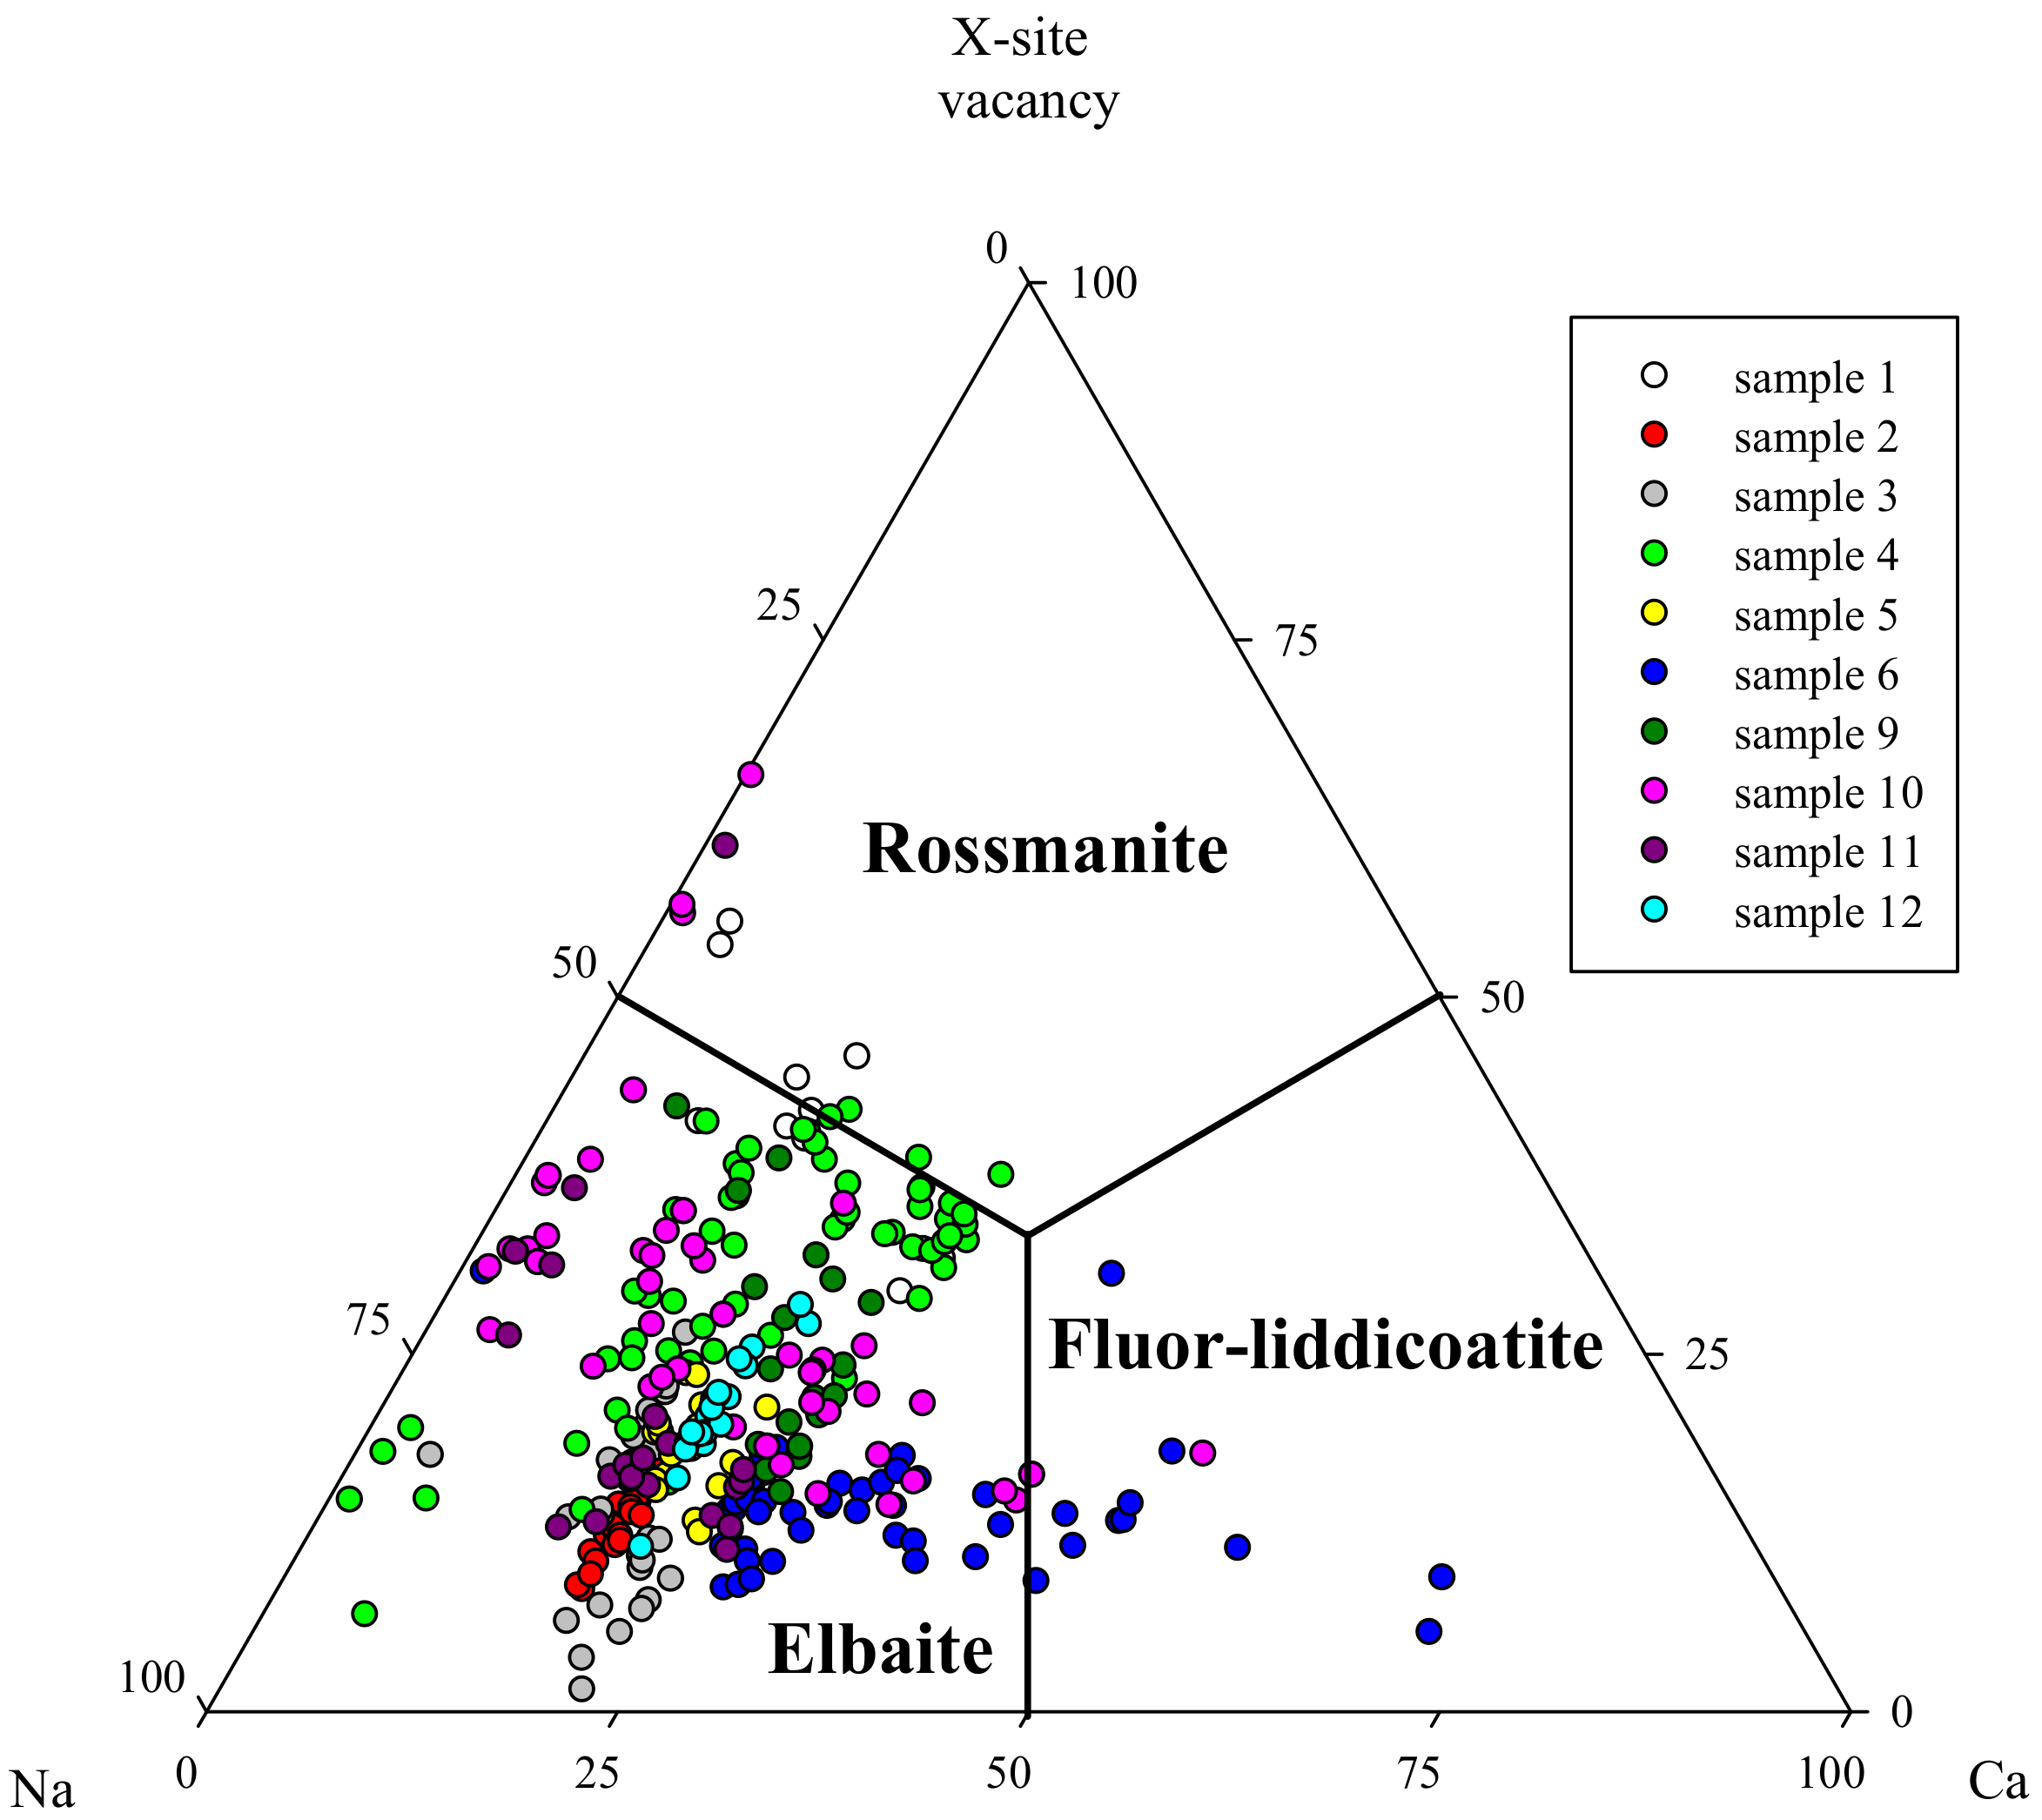
The complete set of chemical analyses is graphically plotted in the ternary diagram of
X-site composition (
Figure 5).
Most analyses fall in the elbaite/fluor-elbaite field, although a few correspond to rossmanite (samples 1, 4, 10, 11) and fluor-liddicoatite (samples 6, 10). Foitite was found at the analogous pole of the crystals of tourmalines 10, 11 and as fibrous overgrowth on sample 9b. The foitite analyses are not reported in the diagram where they would fall in the rossmanite field due to their >50% vacant in
X-site [
25].
Selected electron microprobe analyses are reported in
Table 2.
Colour changes are generally controlled by a combination of concentration and oxidation states of chromophore elements such as Ti, V, Fe and Mn [
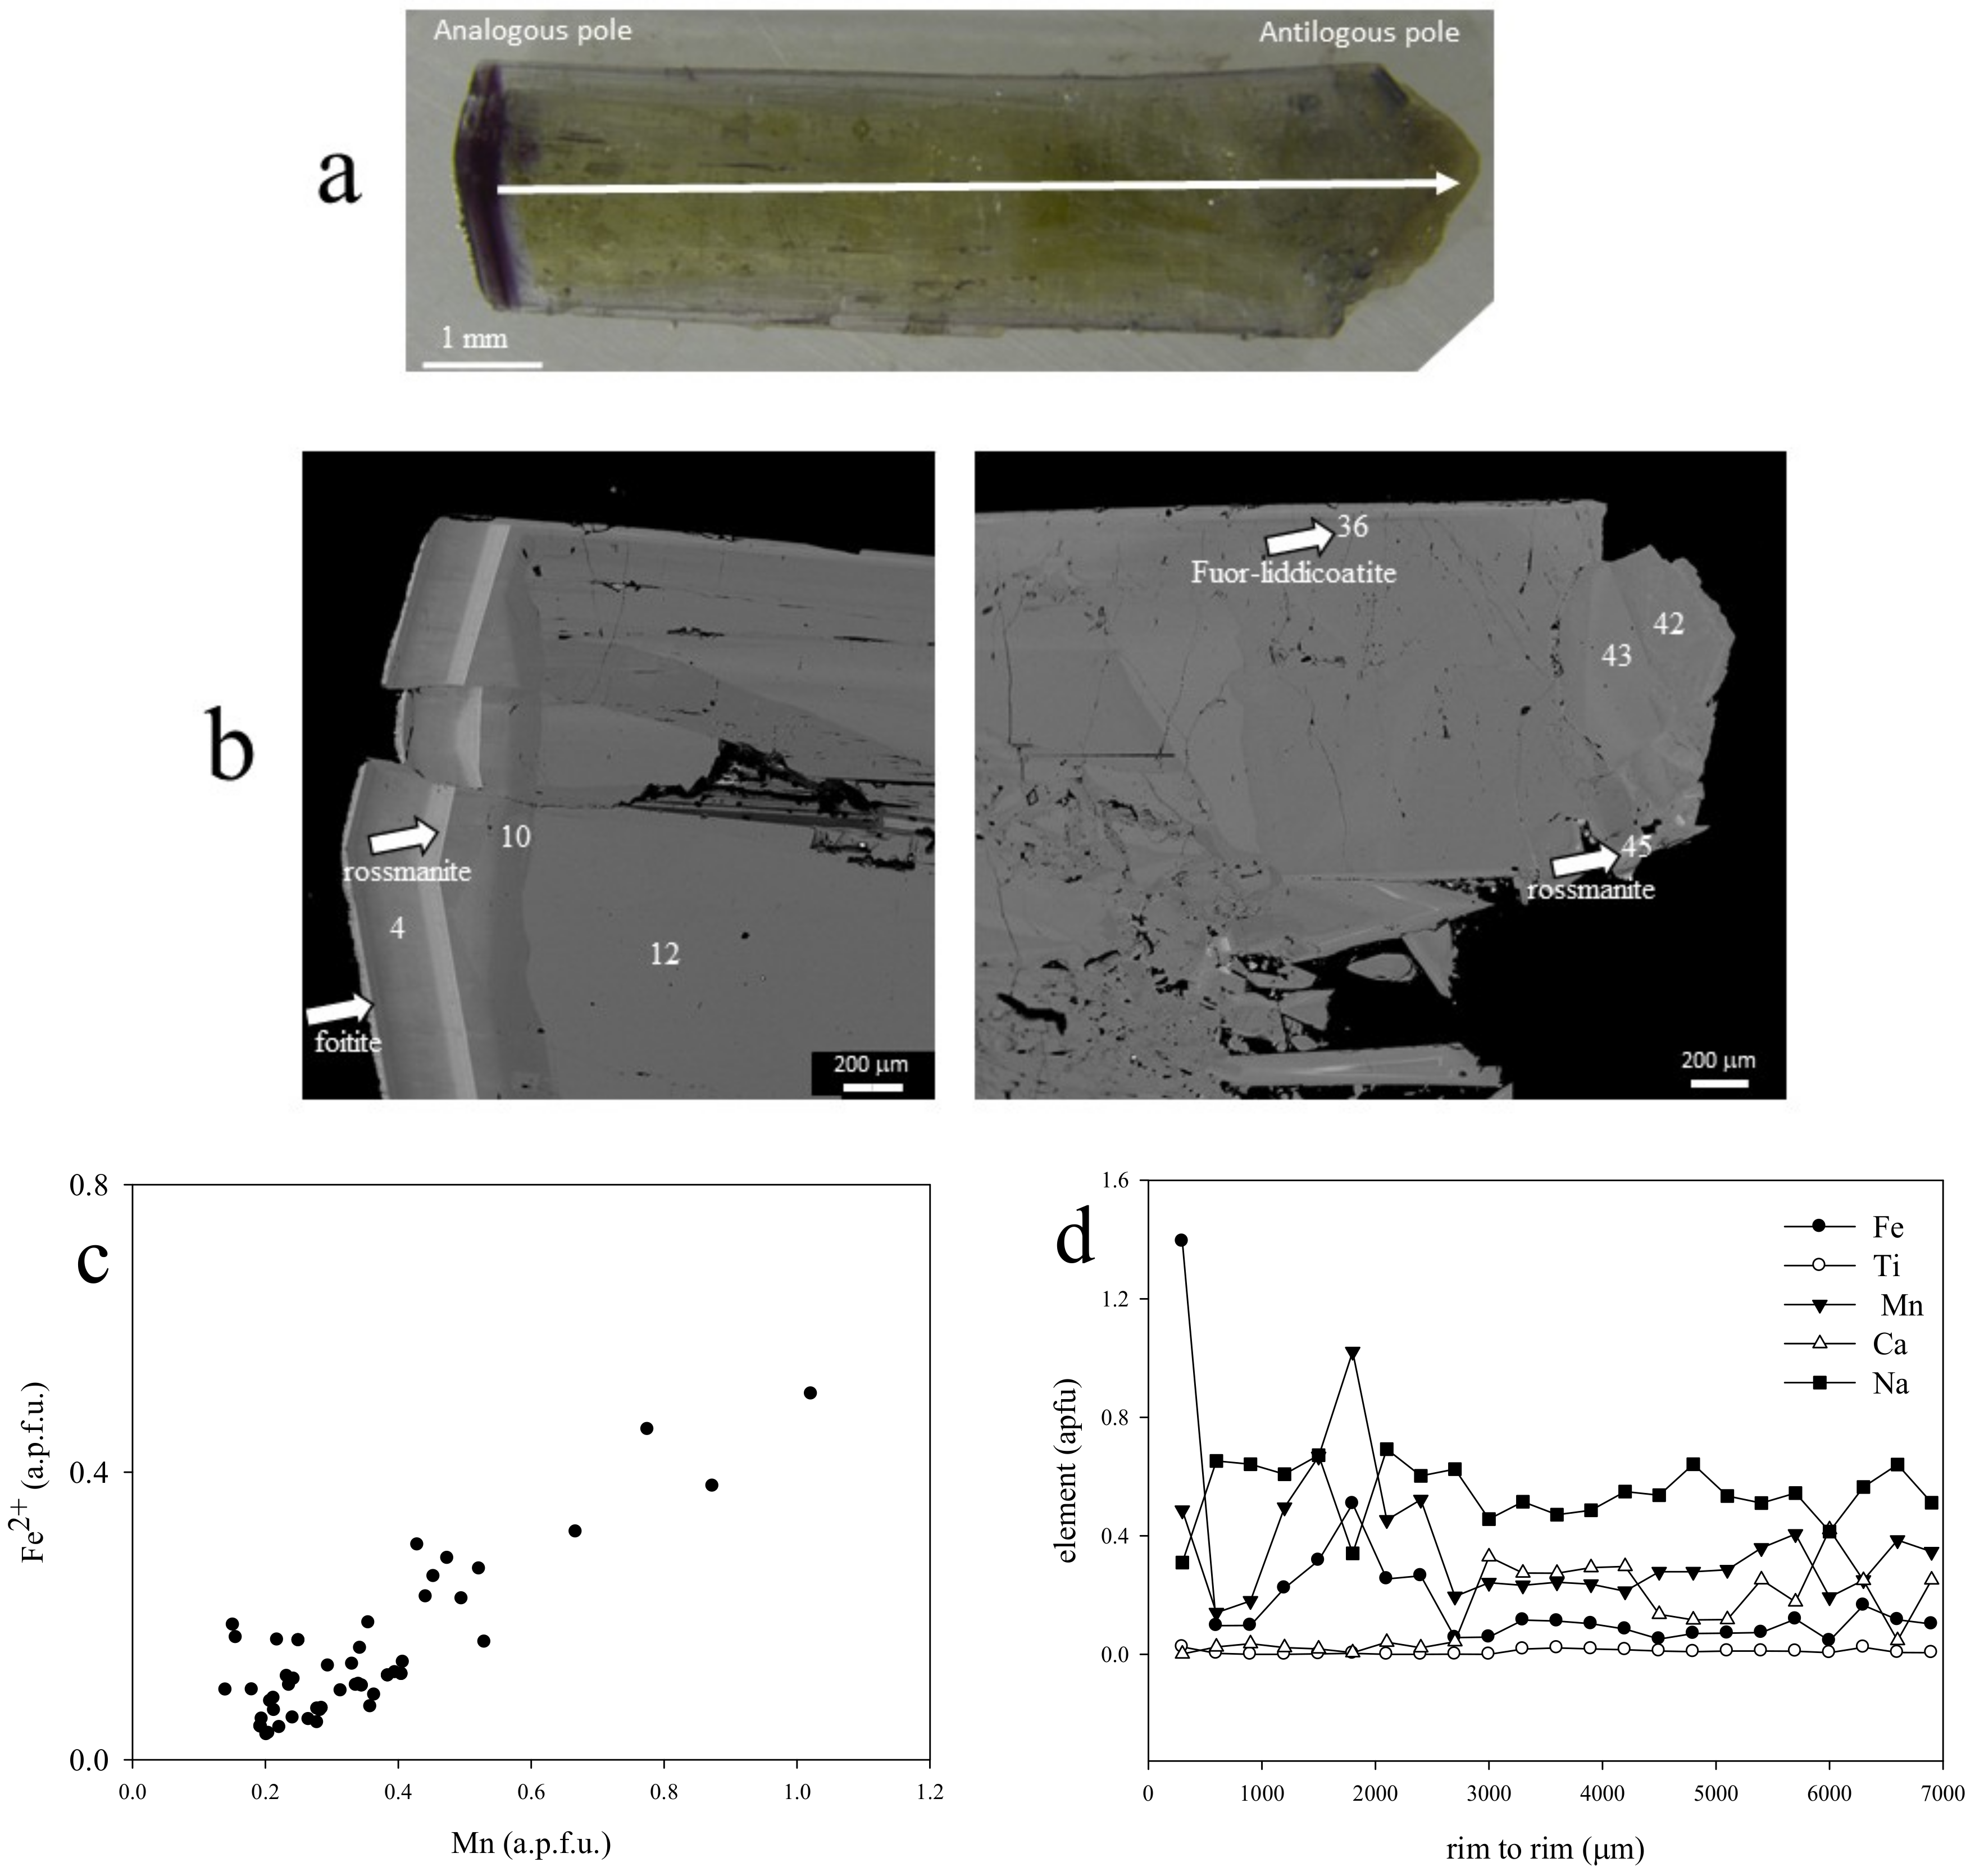
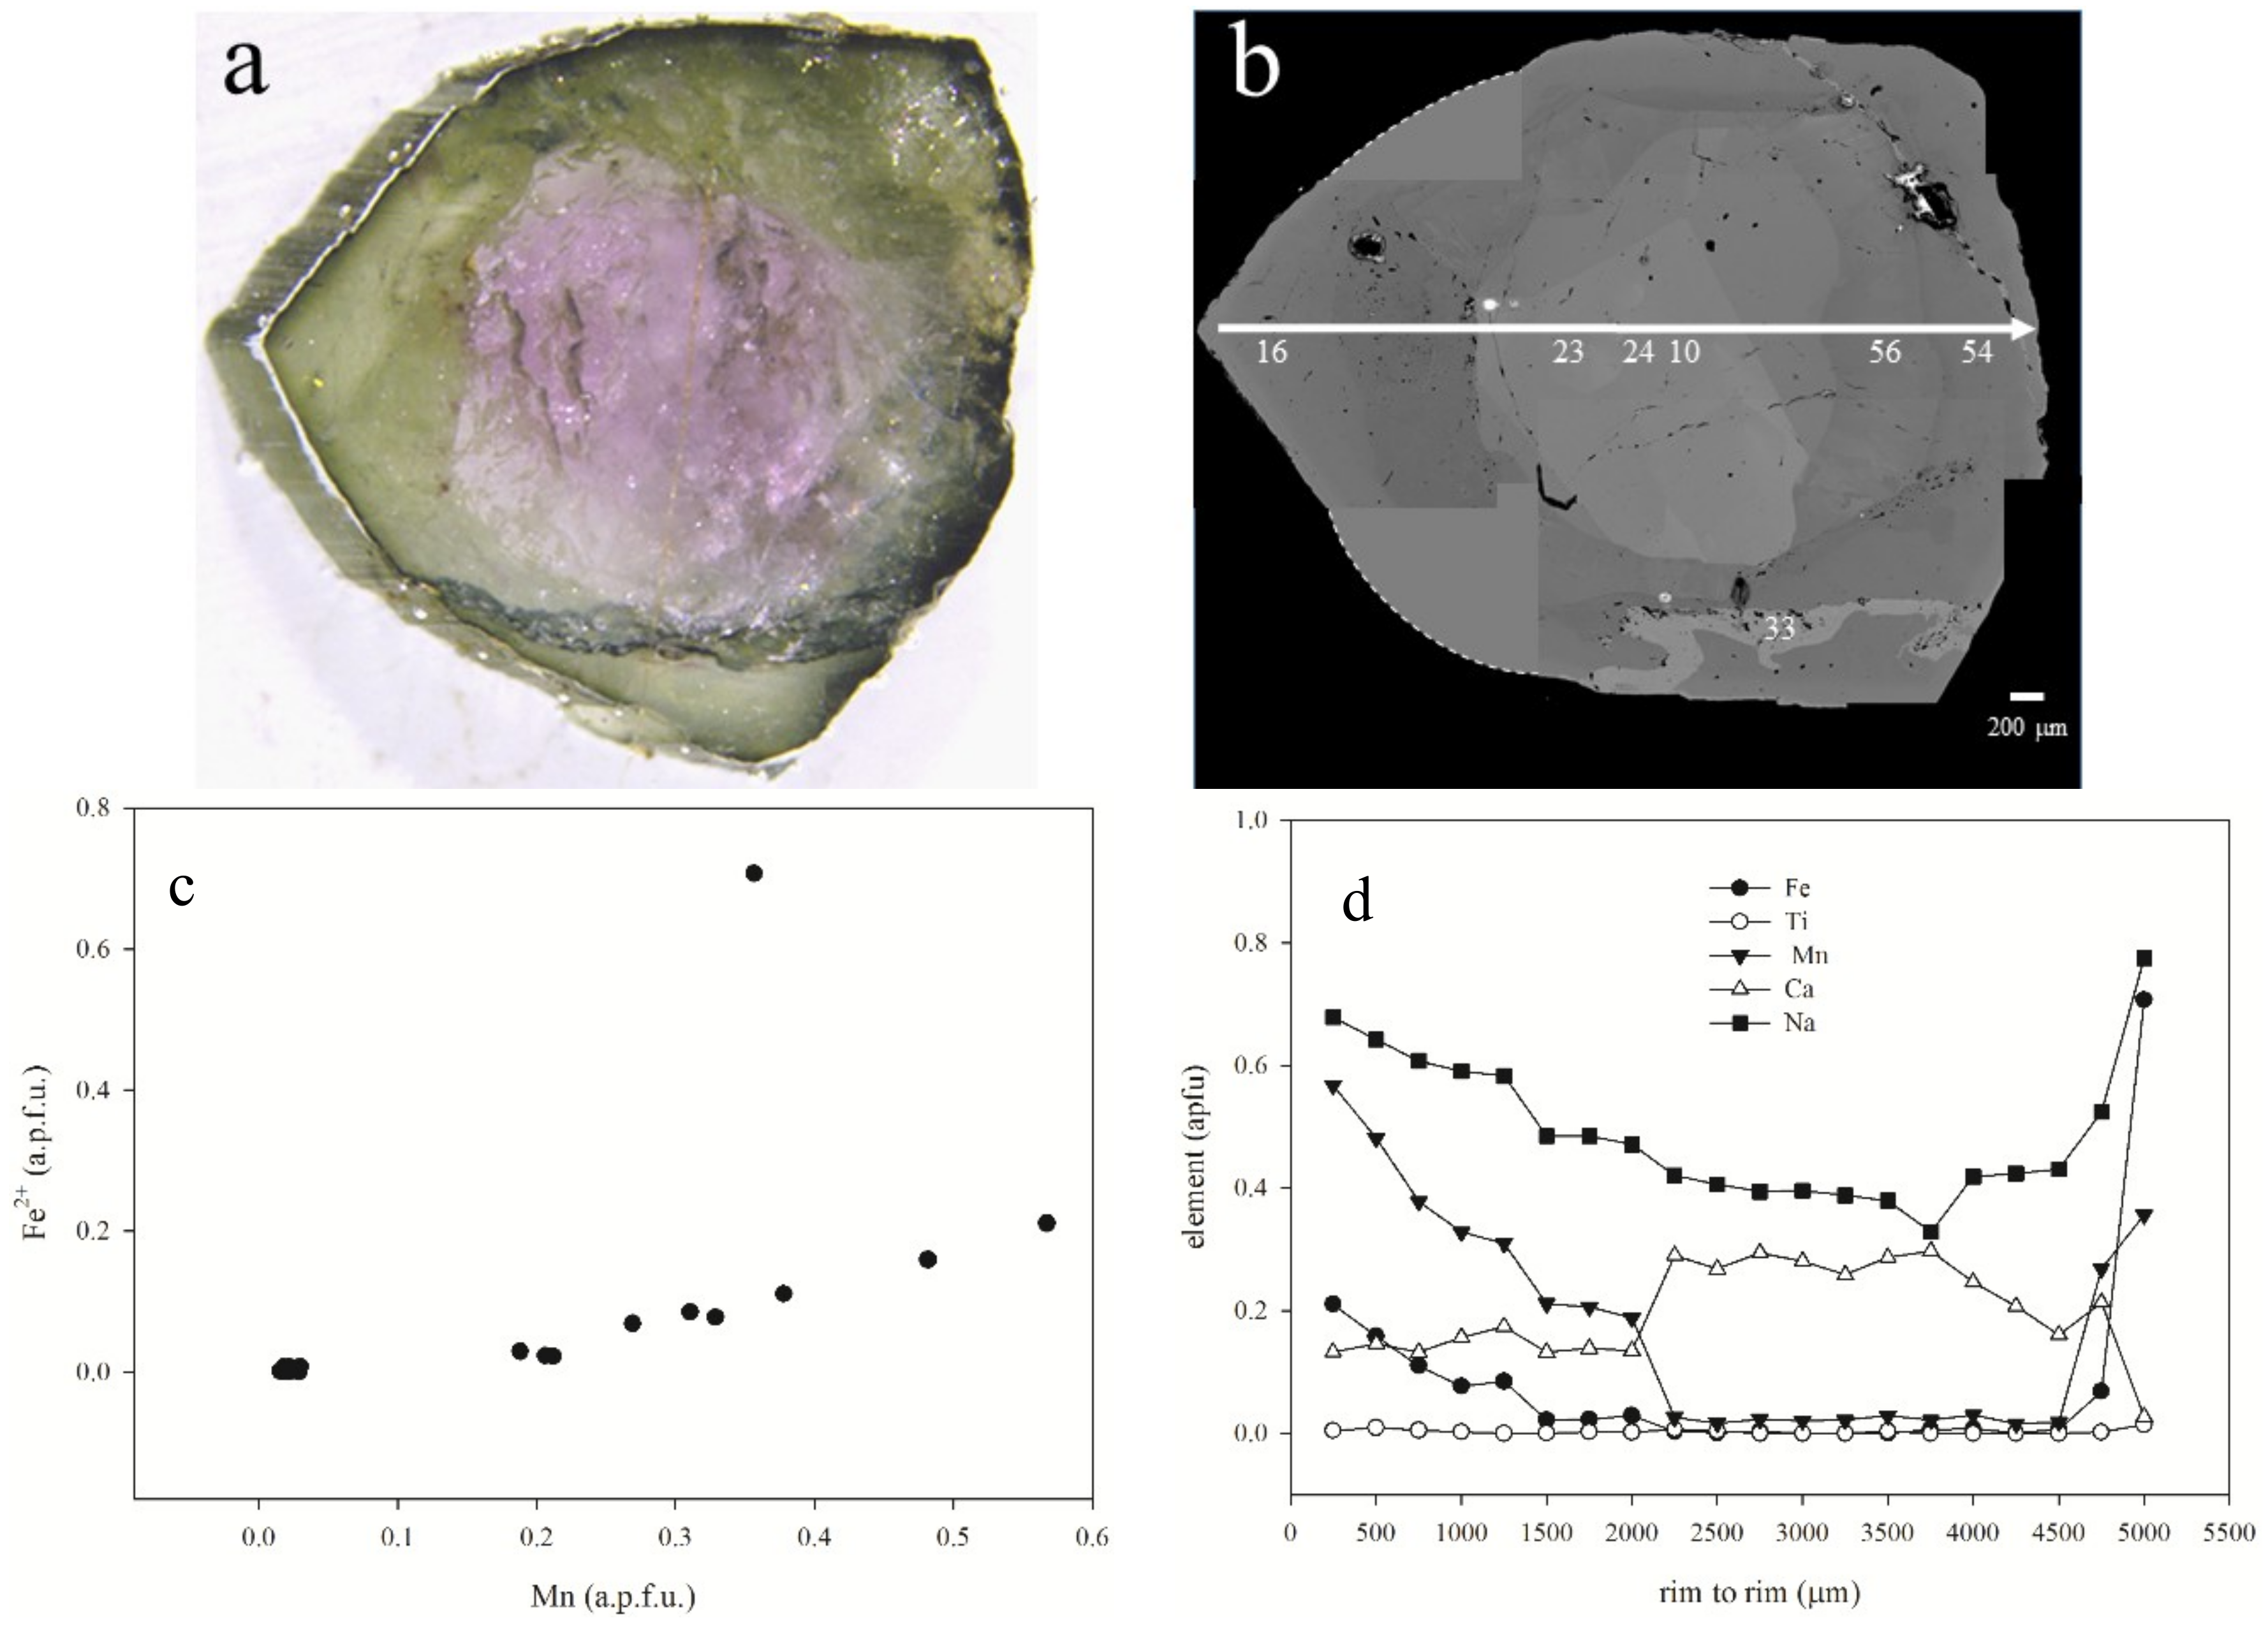
26]: in samples 3, 10 and 11, a higher content of iron is detected in the portion typically brown-black. Sample 10 (
Figure 6a,b) is the only one including the analogous and antilogous pole and shows compositional variations with changes in Mn, Fe (
Figure 6c) and Ca. This last displays the highest values in the central part of the crystal (
Figure 6d). Titanium ranges from 0 to 0.04 a.p.f.u., whereas V and Cr are very low or below the detection limit. Rossmanite is present both at the analogous and antilogous poles (
Figure 6b).
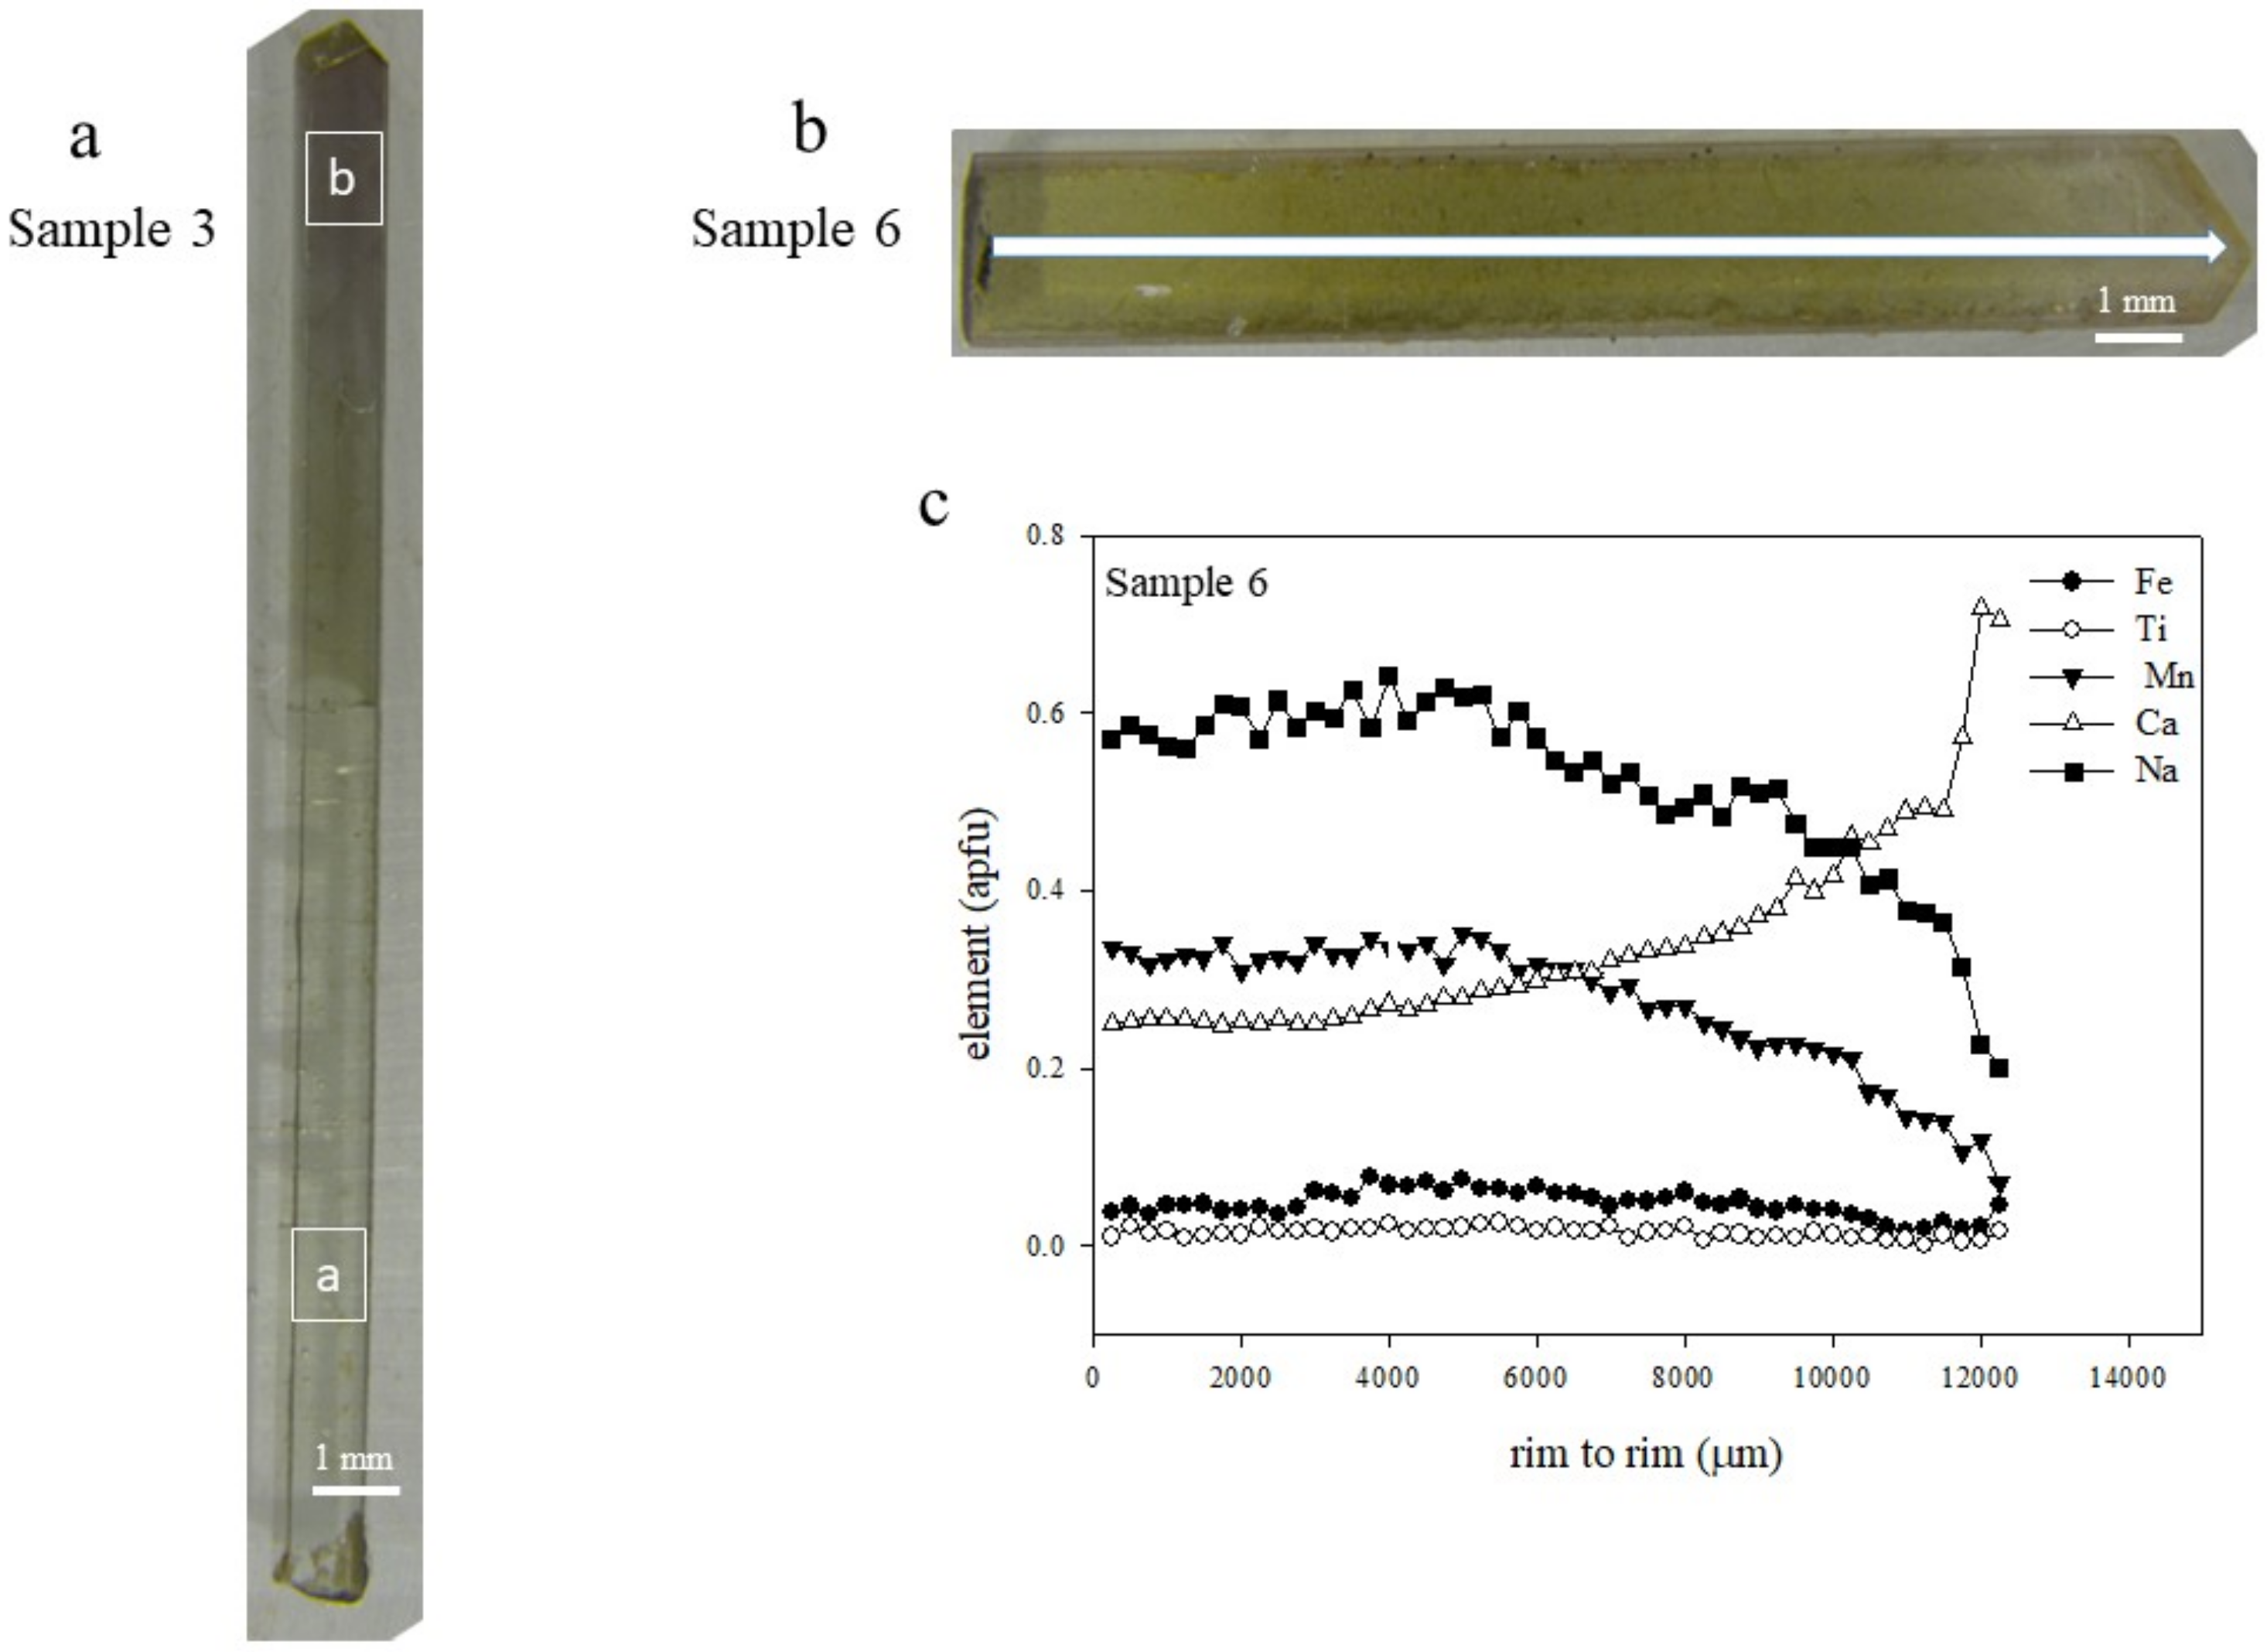
Sample 3 (
Figure 7a), along the
c-axis, shows a colourless (a) and a brown (b) zone with an iron content of up to 0.106 and up to 0.762 a.p.f.u., respectively. Sample 6 shows an elbaite composition with a decrease of Mn and Na together with an increase of Ca from light yellow to near colourless zones where a fluor-liddicoatite composition is identified (
Figure 7b,c). Ti and Fe are very low, and therefore manganese content seems to be mainly responsible of the colour changes.
Samples 2 and 12 have a homogeneous composition with the higher content of Mn that may induce the deep blue colour (up to 0.548 and 0.443 a.p.f.u., respectively).
The pink tourmaline (sample 1,
Figure 8a) is nearly devoid of iron and presents the lowest Mn content with two different compositional zones: one with higher Ca + Mn (on average, 0.27 a.p.f.u., i.e., pts 4 and 8), the second one with lower Ca + Mn (on average, 0.12 a.p.f.u.), Mn < 0.04 a.p.f.u. and higher mole fraction of rossmanite (i.e., pts 6 and 9). Lighter-coloured areas included in rossmanite resulted in being muscovite (
Figure 8b).
Sample 4 (
Figure 9a) occurs in the same geode of sample 3 and has been cut perpendicular to the
c-axis. The slice reveals a complex growth history characterized by a central part, pink in colour, depleted in Mn and Fe, but enriched in Ca with respect to the green rim, with a composition ranging from fluor-liddicoatite-rich elbaite to elbaite. The lighter-coloured zone at the bottom of the sample (
Figure 9b, e.g., point 33, analysis 33 in
Table 2) presents an enrichment in Fe
2+ with respect to Mn
2+ (
Figure 9c). In
Figure 9d, an example of the variation from rim to rim of these elements, including Ti, Ca and Na, is shown.
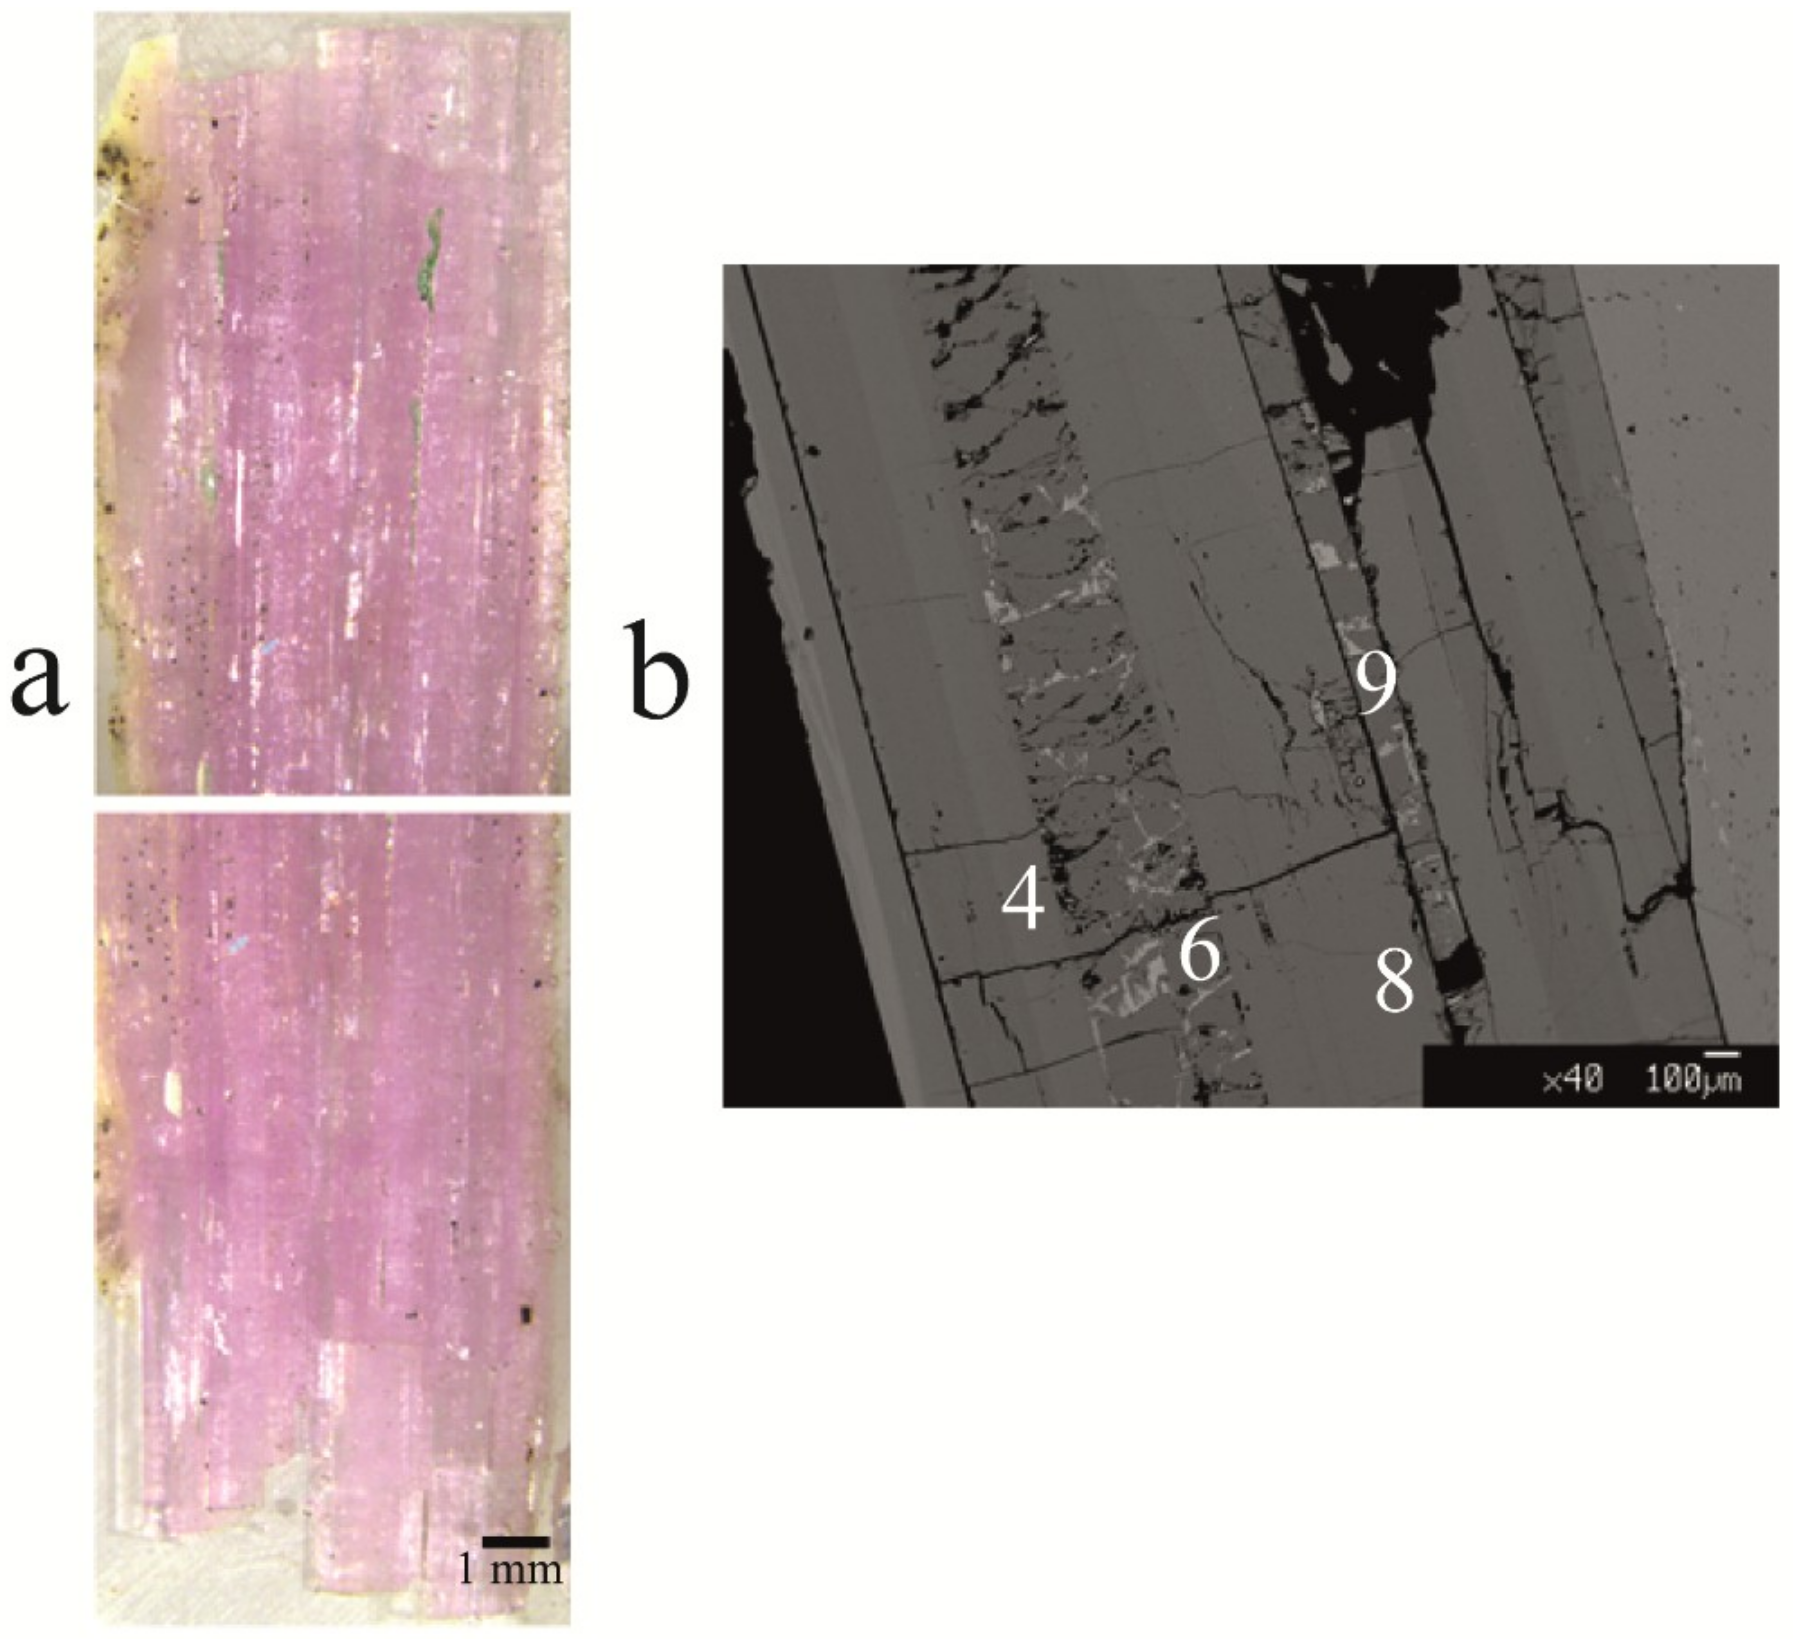
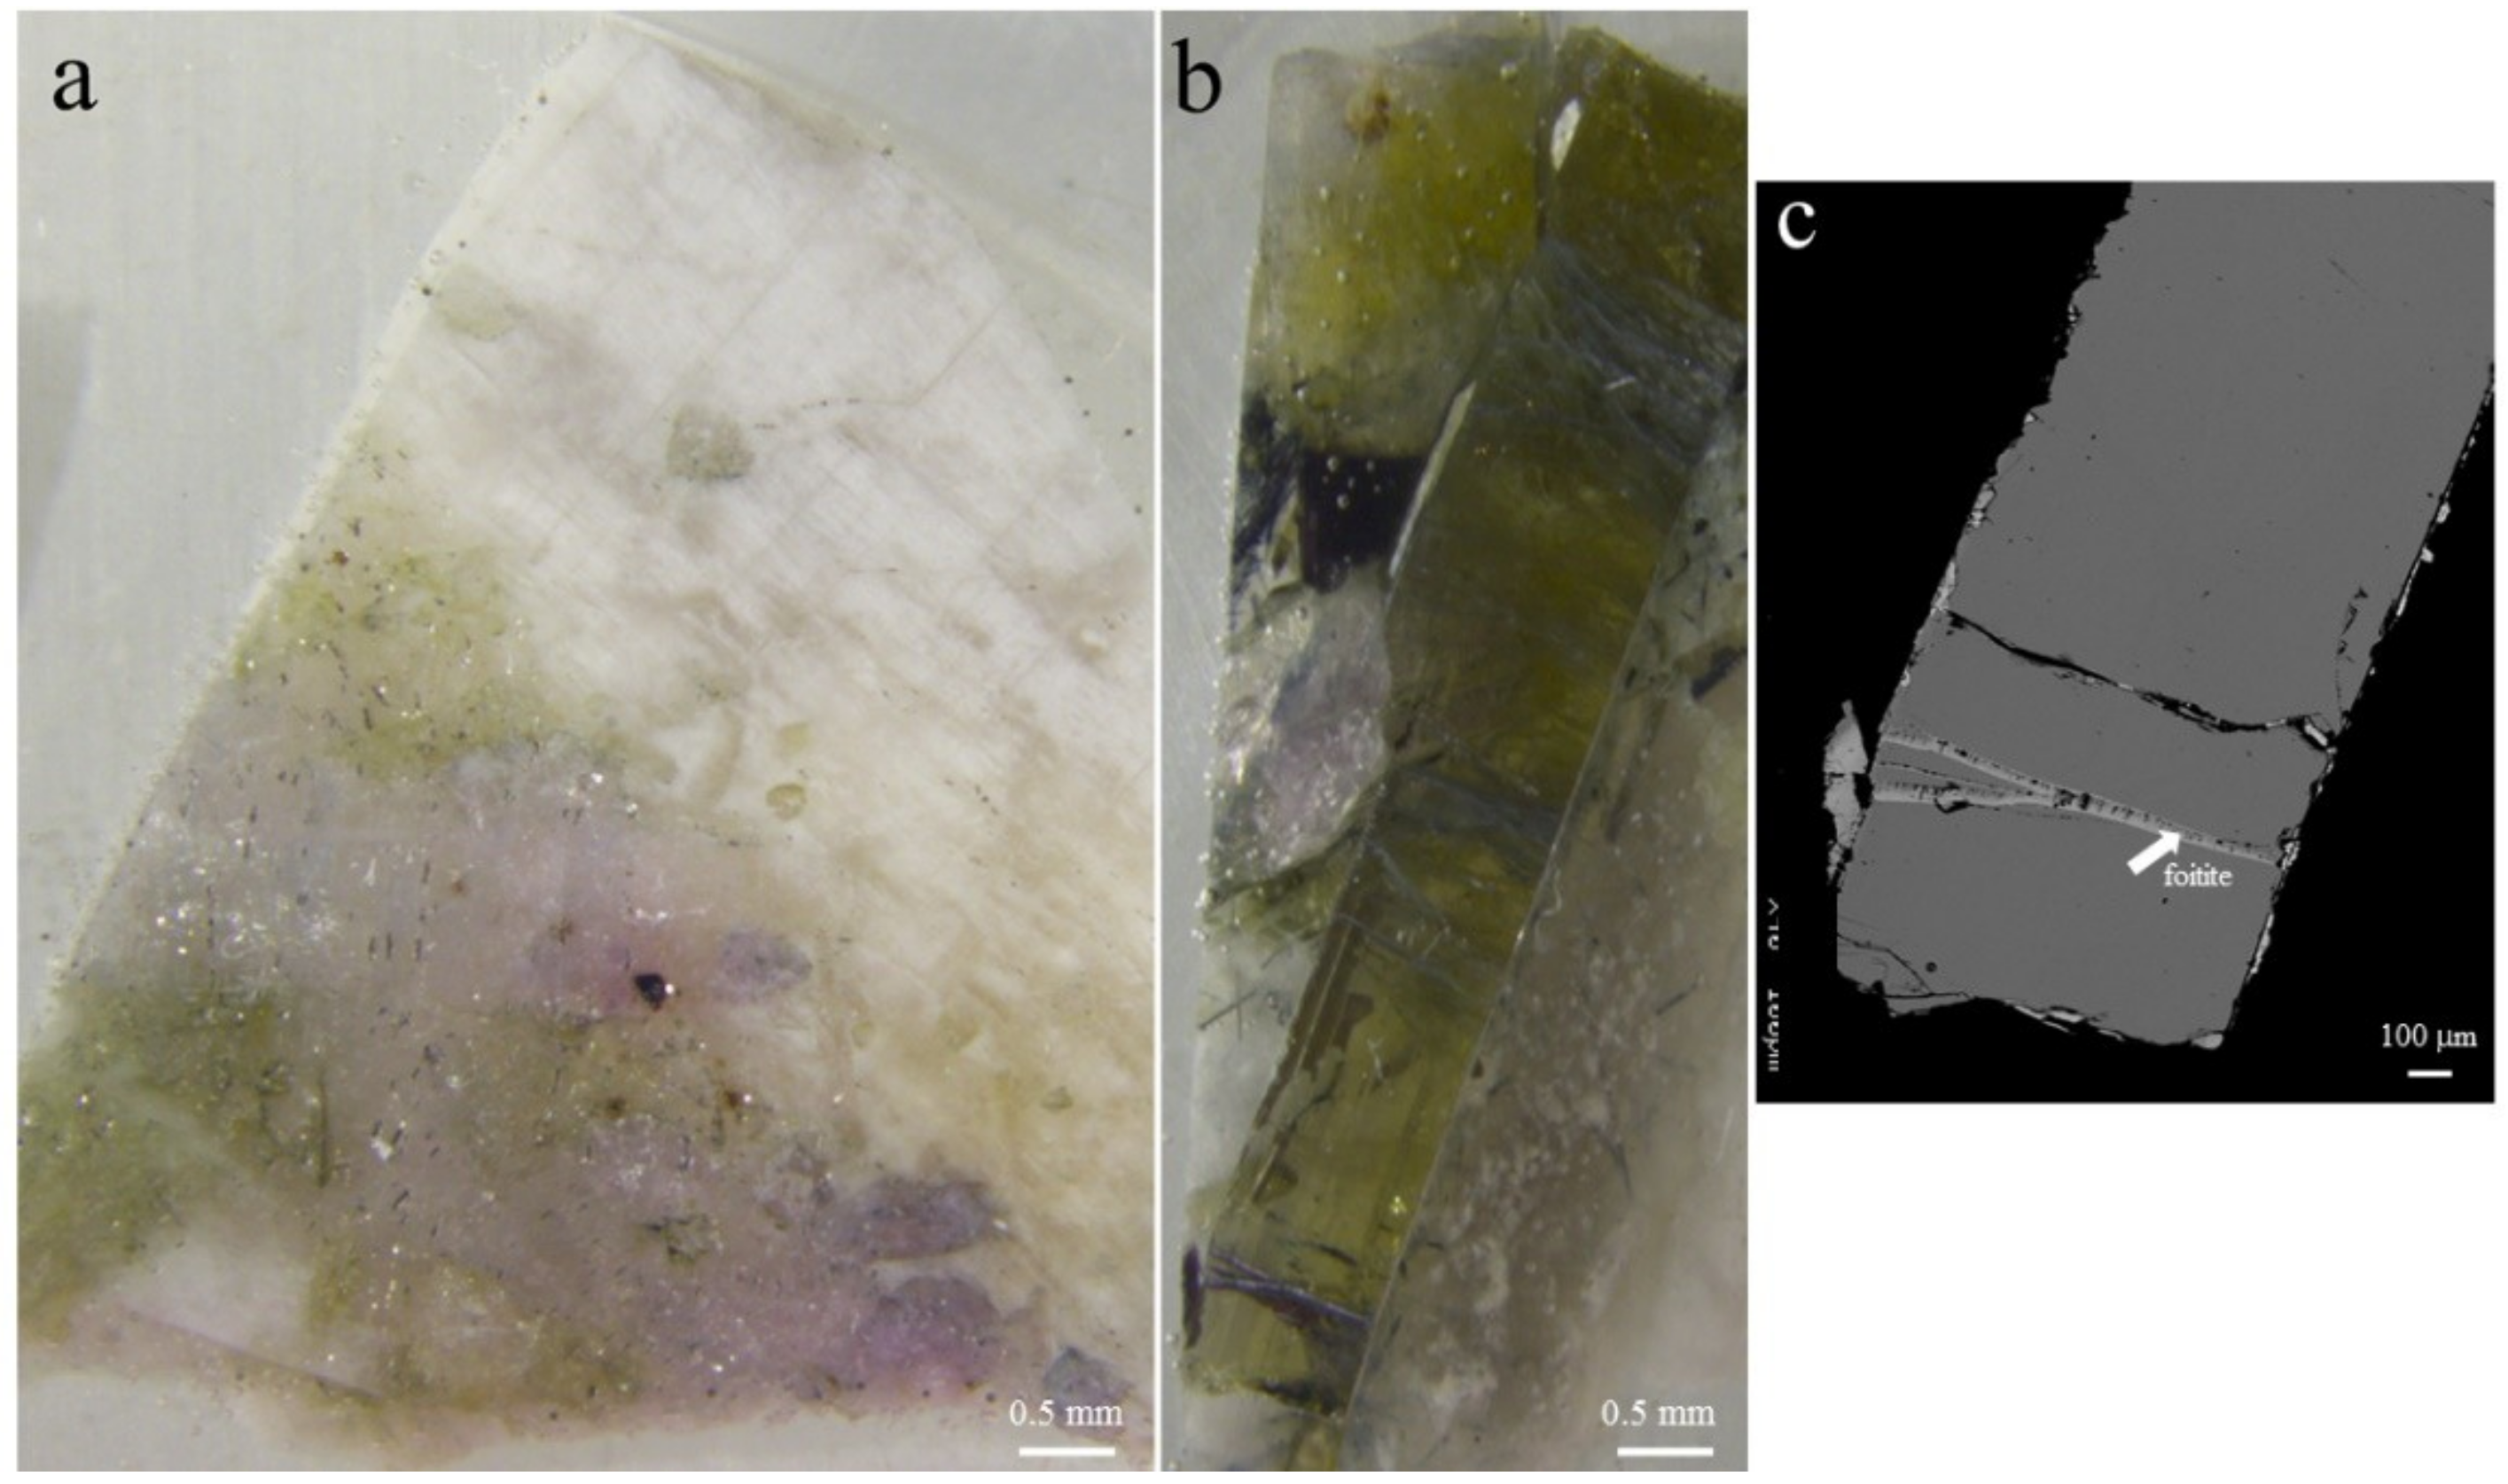
Sample 9 (
Figure 10a,b) comes from a geode containing black quartz, zircon and uraninite and displays a change from pink (sample 9a) to green colour (sample 9b) that seems to be due to manganese, iron and titanium enrichment. In sample 9b, a thin overgrowth with foitite composition (see
Figure 10c and
Table 2) is present.
The averaged LA-ICP-MS analyses of selected trace elements: Be, Sc, V, Cu, Ga, Ge, Sr, Y, Ta, Pb, Th, U and REE of the tourmalines are reported in
Table 3.
In general, the concentration of trace elements is variable and does not show any significant trend or correlation with the colour changes. The exceptions are represented by the higher values of Pb (up to 880 and 2880 ppm in sample 11 and 3b, respectively) corresponding to Mn (Fe)-enriched points and of Cu (up to 196 ppm) in samples 1, 4, 9a, determined in the pink part of the crystals. Variable concentration of Ga (41–182 ppm) and Sr (1–231 ppm) was observed. The Y content, generally correlated with HREE, is very low, less than 1 ppm in all samples.
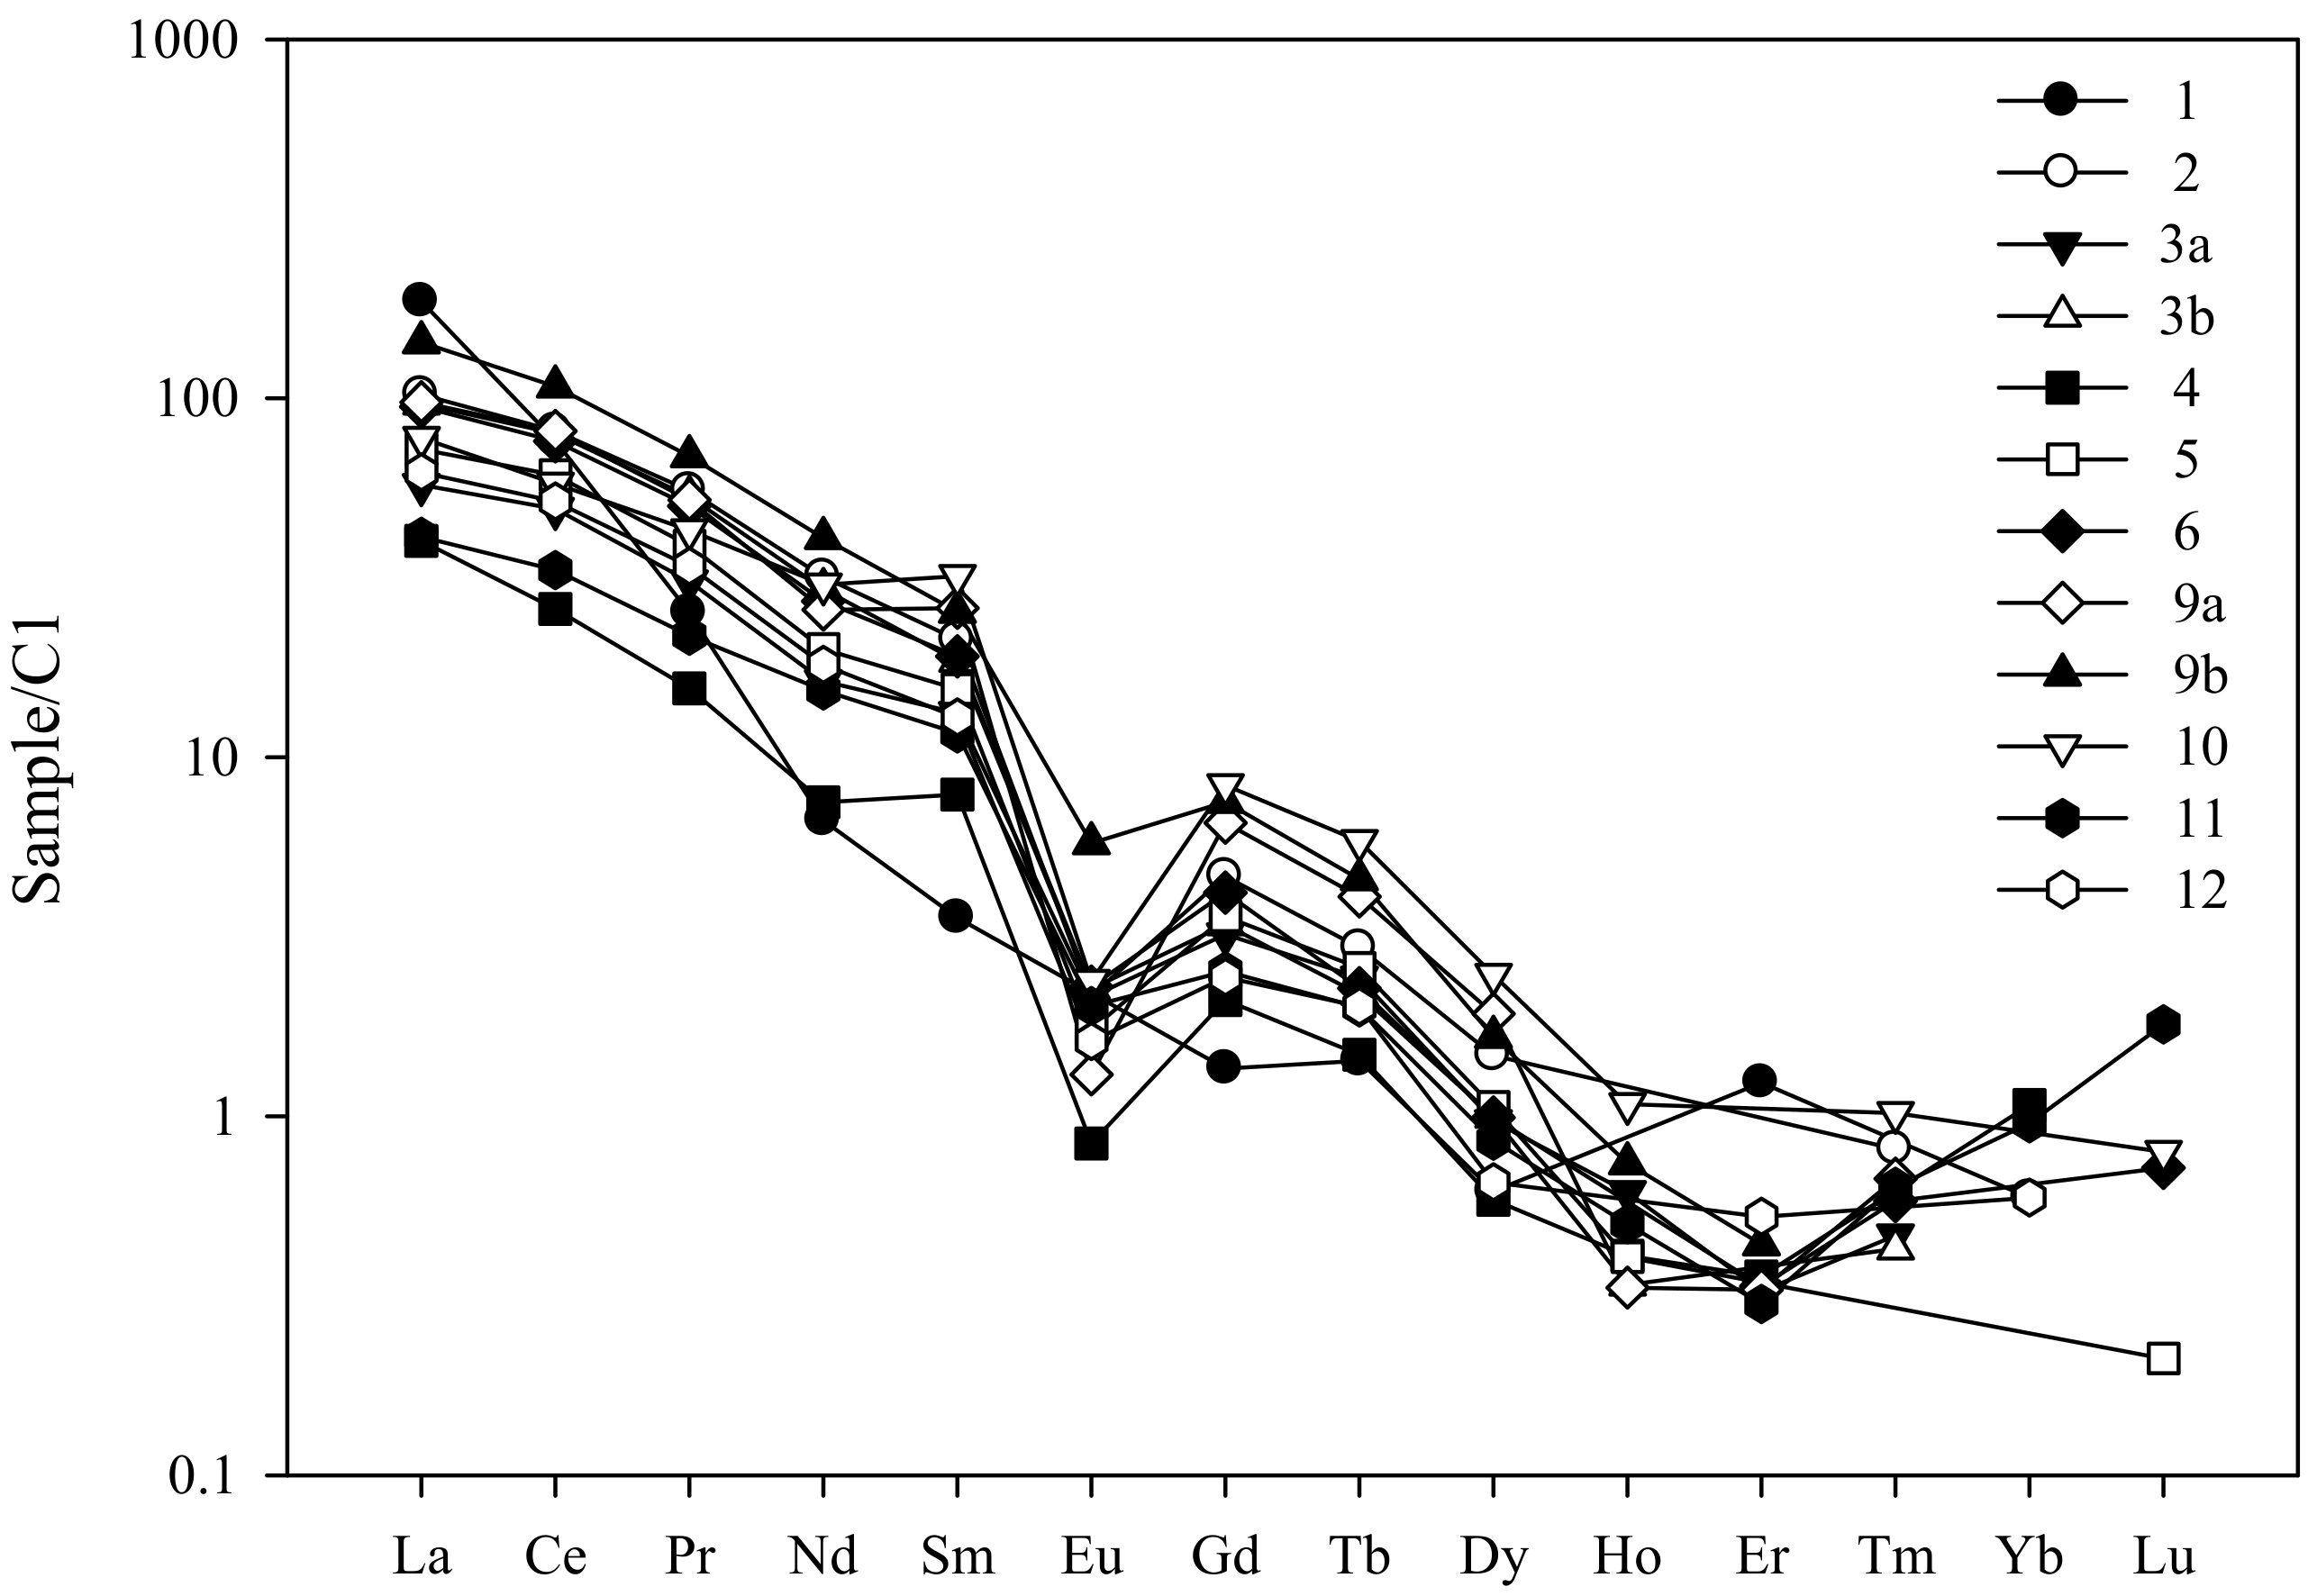
The REE content in tourmalines from granitic pegmatites is generally low (<30 ppm) while in the examined samples, the total REE content ranges from 30 to 130 ppm with light REE-enrichment and Ce being the most abundant element. Chondrite normalized REE patterns (plotted as mean values for each sample in
Figure 11) display a general depletion in the medium and heavy, with respect to the light, rare earths. The negative Eu anomaly is probably related to the local depletion of Eu
2+ content in the melt due to its consumption during the growth of K-feldspar, an important carrier of Eu
2+ in magmatic rocks.
5.3. X-Ray Crystal Structure Refinement
The crystallographic data obtained by single crystal refinement confirm that the examined tourmalines belong to the
R3m space group with the cell parameters in the range of elbaite species. Absolute structure parameter ranged from 0.01(11) to −0.10(10) and secondary extinction coefficient ranged from 0.0024(2) to 0.0049(3) (
Table 4).
The selected interatomic distances, geometrical parameters and refined and observed (from chemical analyses) site-scattering values are given in
Table 5 and
Table 6, respectively. The final atom coordinates and equivalent displacement parameters, as well as the complete set of crystallographic data (crystallographic information files and lists of observed and calculated structure factors), have been deposited in supplementary electronic material (
Tables S1 and S2a–c).
The structural data confirm elbaitic compositions: <Y–O> ranges from 1.989 to 2.030 Å compared to a calculated value of 2.015 Å for an ideal elbaite (using ionic radii of [
11]; <Z–O> ranges from 1.907 to 1.908 Å compared to a <
ZAl–O> grand mean value of 1.906 Å (Figure 3 of [
28]); site scattering at X sites (8.73–12.43 electrons per formula unit or a.p.f.u.,
Table 6) is compatible with a dominant Na occupancy. The high quality of the reported structure refinements makes it possible to discuss the site assignment of cations among the different sites of the studied crystals. Following [
11] and using his Equation (4) [
ZAl = −0.1155 + 1.1713·
[6]Al − 0.0522·
[6]Al
2; Al = Al −
TAl (a.p.f.u.)], it is possible to estimate the
ZAl occupancy just from chemical data. Applying this equation to the data reported in
Table 2 produces a slight
ZAl deficiency of 0.126–0.439 a.p.f.u.. However, this is in contrast with single crystal XRD data that provide refined scattering values of 12.85(5)–12.96(3) a.p.f.u. for the
Z site, implying a maximum of 0.12
ZLi atoms per formula unit or just pure Al
Z sites, considering 3σ. It is, therefore, highly improbable that any Mn
2+ (or Fe
2+) could have been disordered into the
Z-sites. The agreement between observed (SC-XRD) and calculated (EMPA-WDS) site scattering at
X-sites is poorer (9–10%,
Table 6), probably due to the high chemical variability of crystals, because the occupancy of
X site is the main chemical vector observed in the studied tourmalines.
It is worthwhile to note the high values of
U equivalent for the O(1) (from 0.0291(7) to 0.057(2) Å
2, compared to the mean value of 0.007–0.010 Å
2 for the other anion sites; see
Tables S1 and S2a–c). This is very probably due to static disorder at the O(1) anion site. All three studied crystals show large and flat [parallel to (0001)] thermal ellipsoids, making the estimation of the electron density at the O(1) site inaccurate (see
Figure 12). We tried a split model, but it was unsuccessful. A similar delocalization of electron density was reported by [
29] (compare their
Figure 1a with our
Figure 12b) for manganese-bearing elbaitic compositions. Burns and co-workers [
29] interpreted the large anisotropic displacements as positional disorder, rather than thermal vibration, due to the 6 possible local arrangements at the three
Y sites around the O(1) site; the three principal
Y cations (Al, Li and Mn
2+) have very different ionic radii (0.547(3), 0.751(9), 0.809(1) Å, respectively; values from [
11]). Considering the composition of the Y sites (close to AlLiMn) of our tourmalines, the ideal average trimer would promote a distorted environment for the O(1), confirming in a new set of samples the behaviour already reported by [
29].

 ,
, 


