A Chemical, Mechanical, and Tribological Analysis of DLC Coatings Deposited by Magnetron Sputtering

Abstract
:
1. Introduction
2. Materials and Methods
2.1. Materials
2.2. Methods
2.2.1. X-ray Photoelectron Spectroscopy
2.2.2. Raman Spectroscopy
2.2.3. Mechanical Tests
2.2.4. Tribological Tests
3. Results and Discussion
3.1. Chemical and Mechanical Characterization
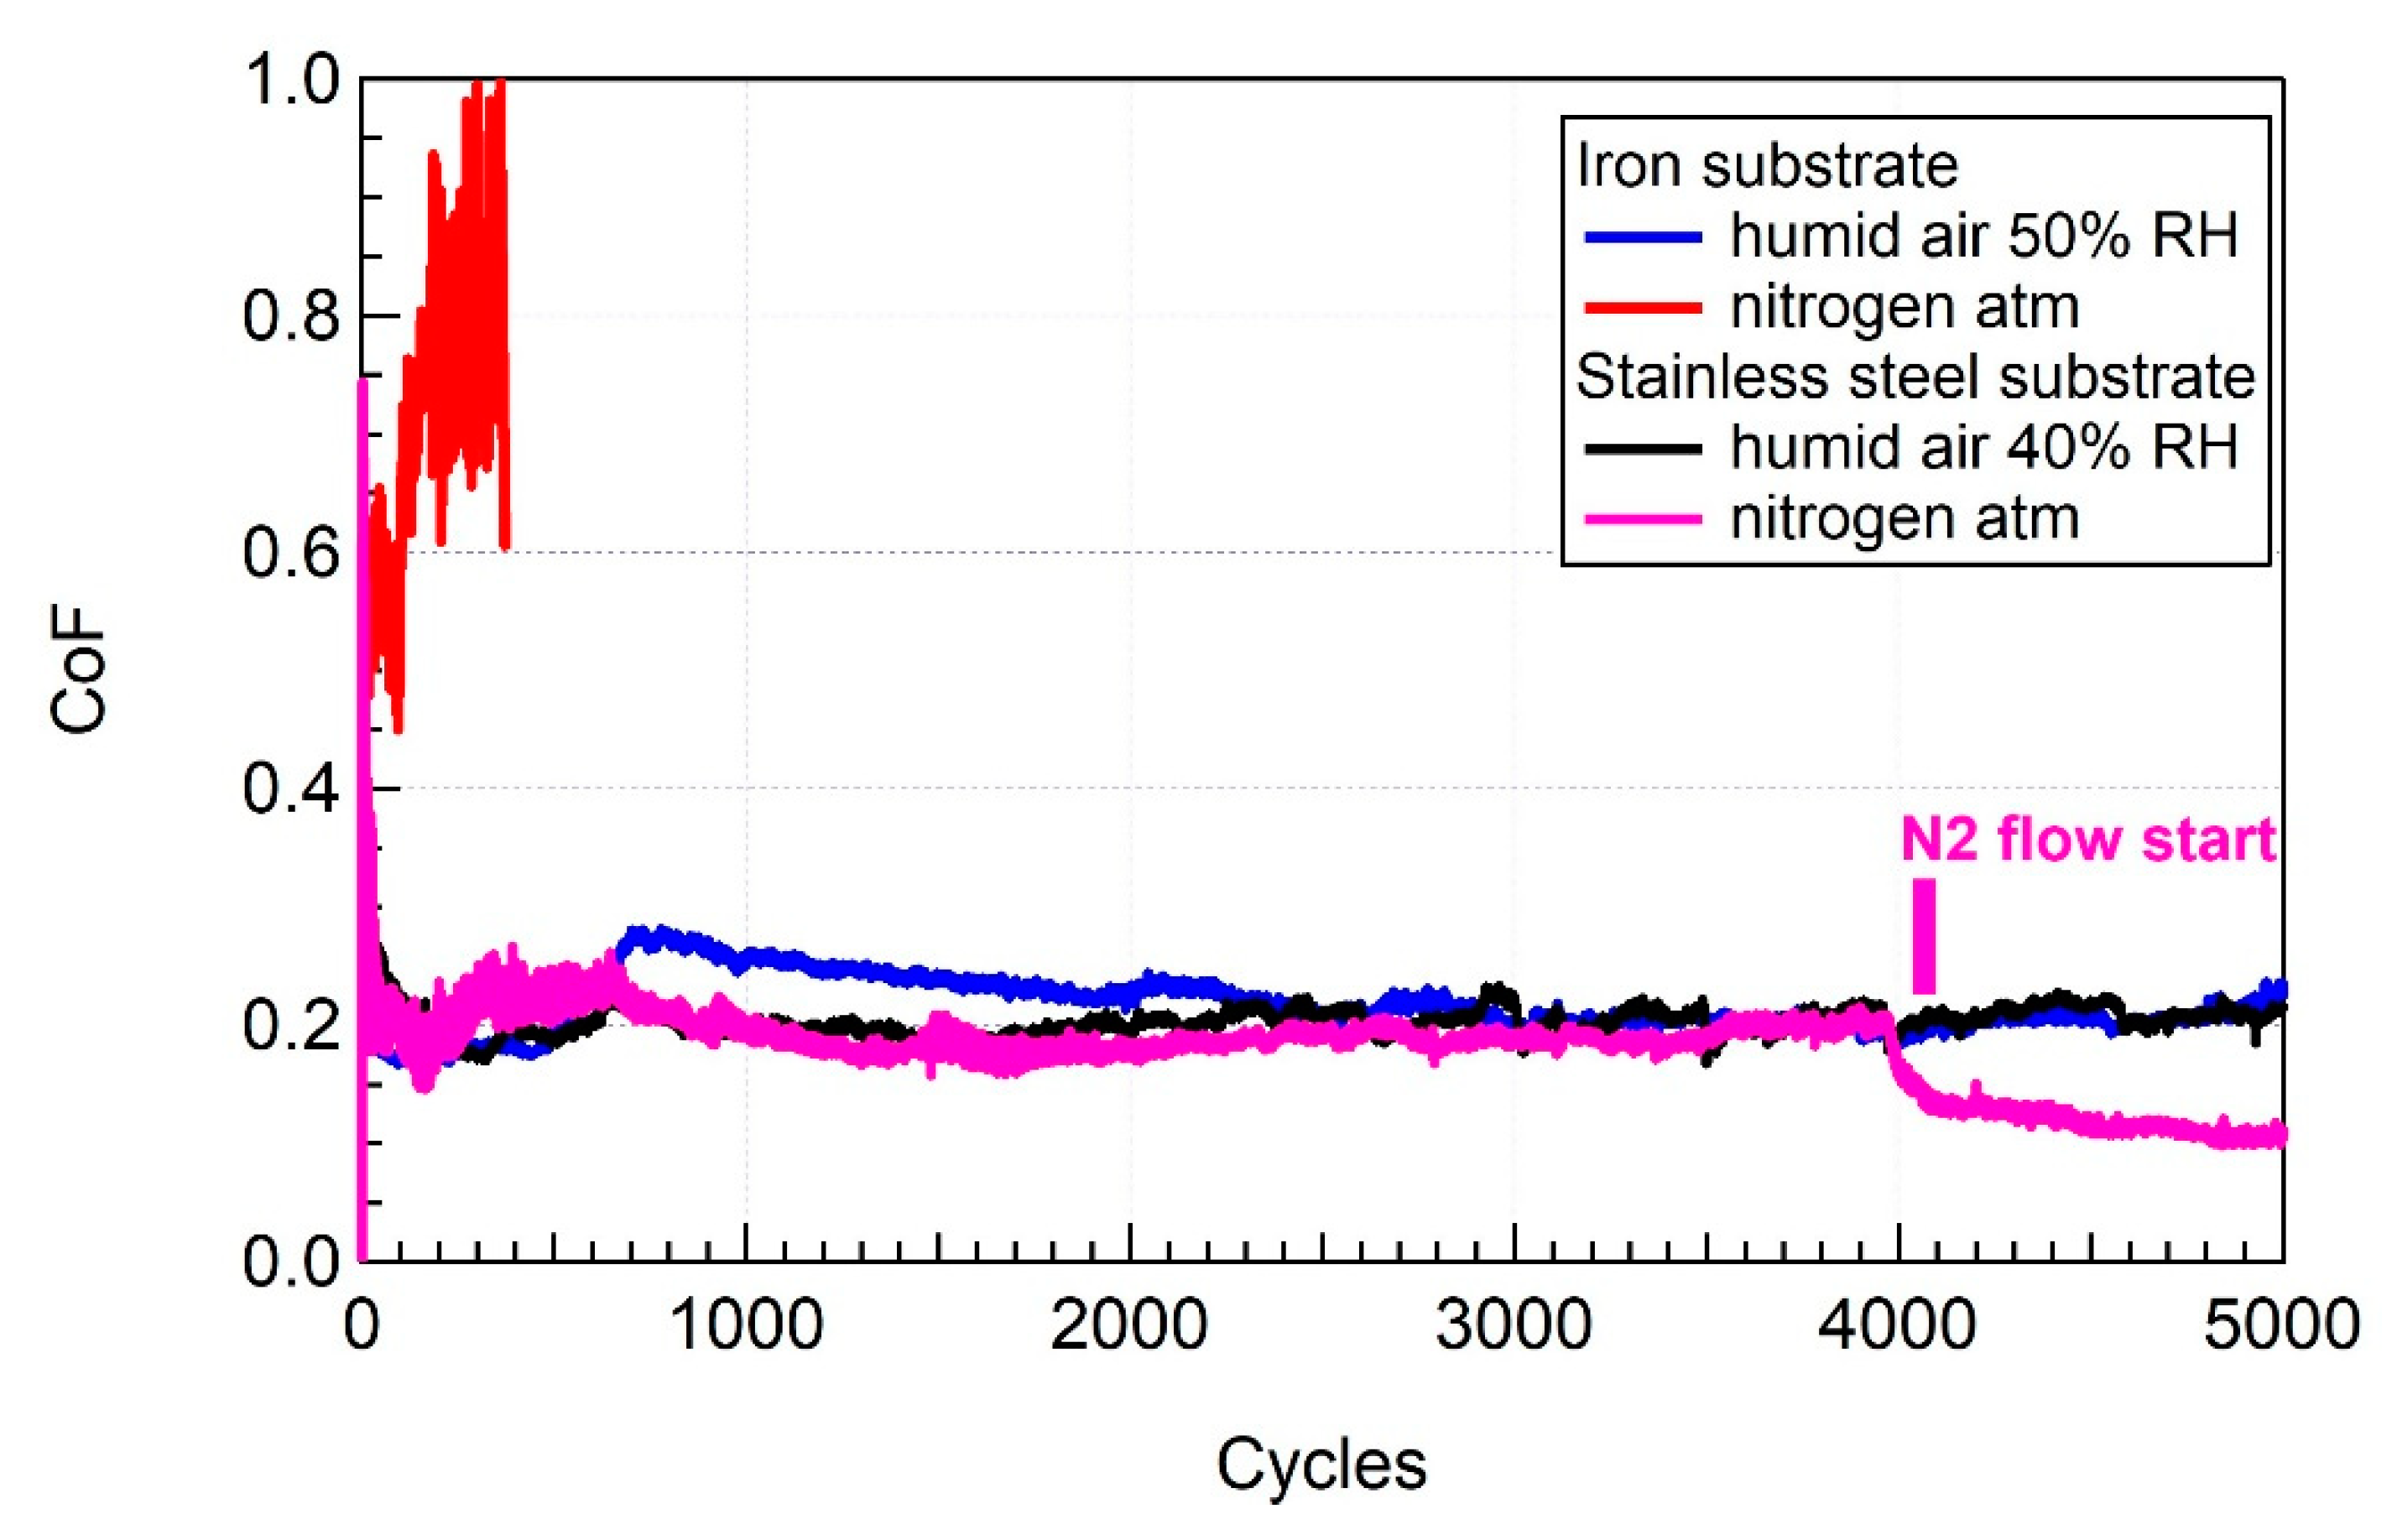
3.2. Tribological Tests
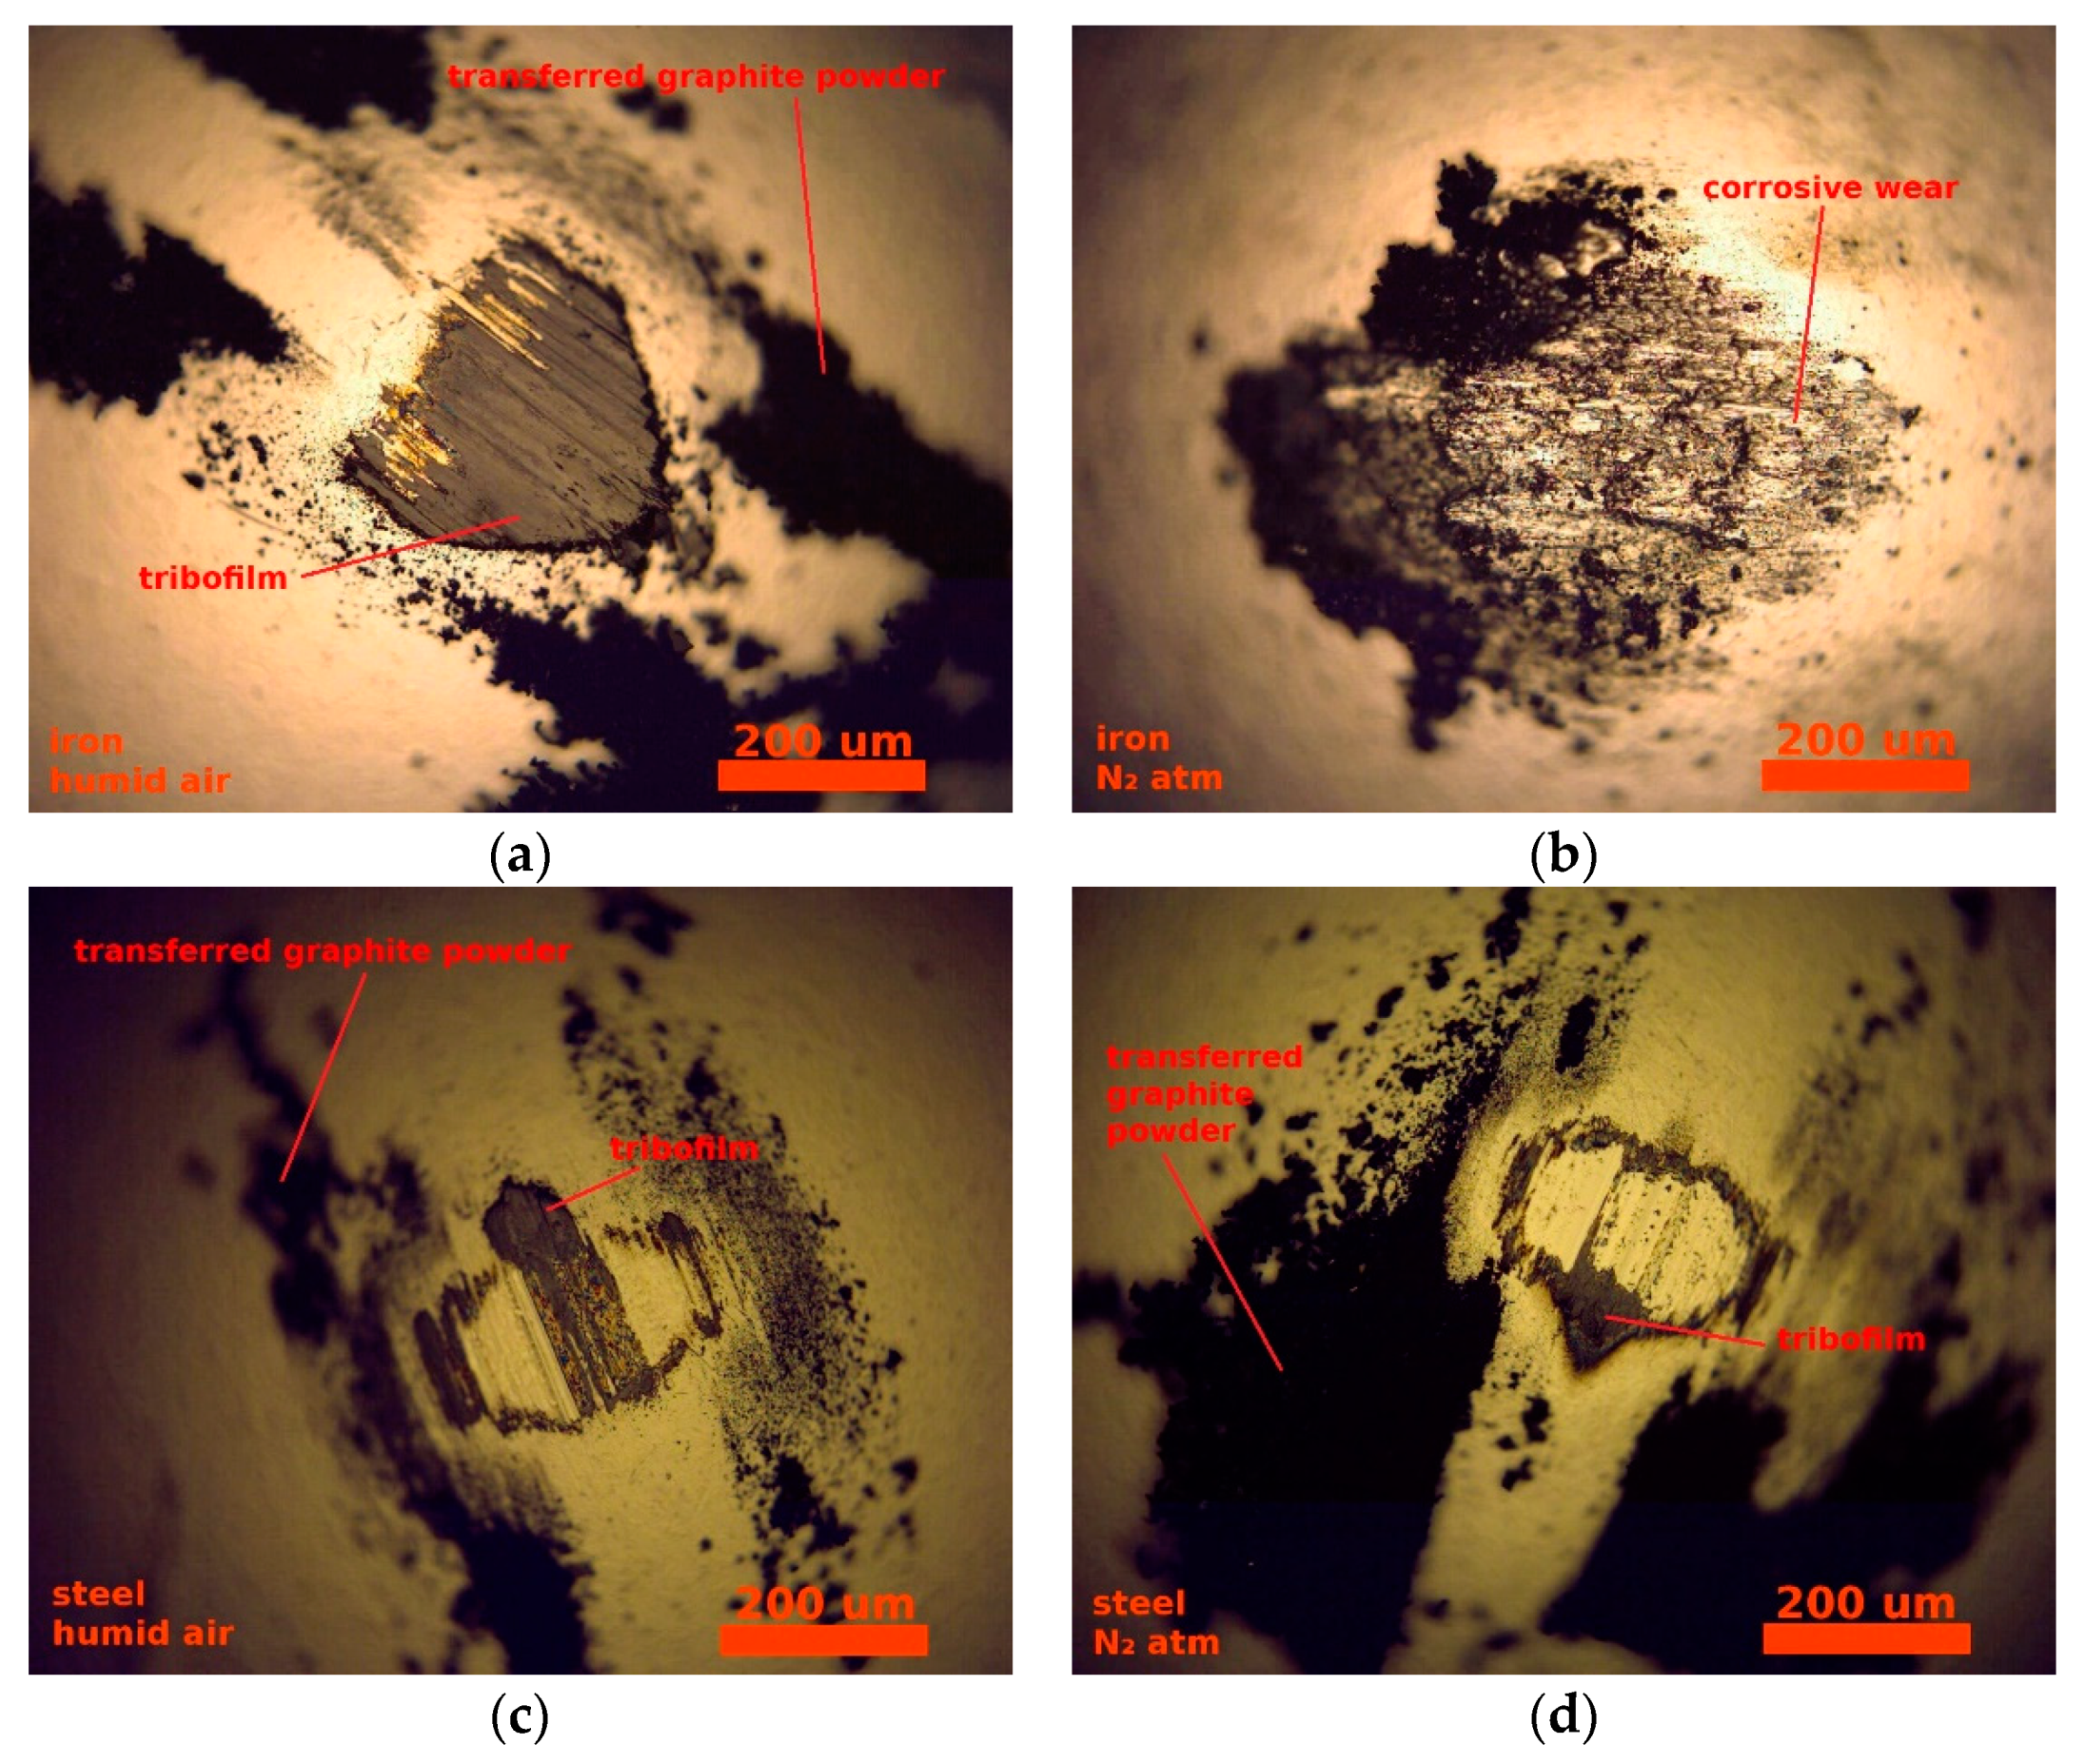
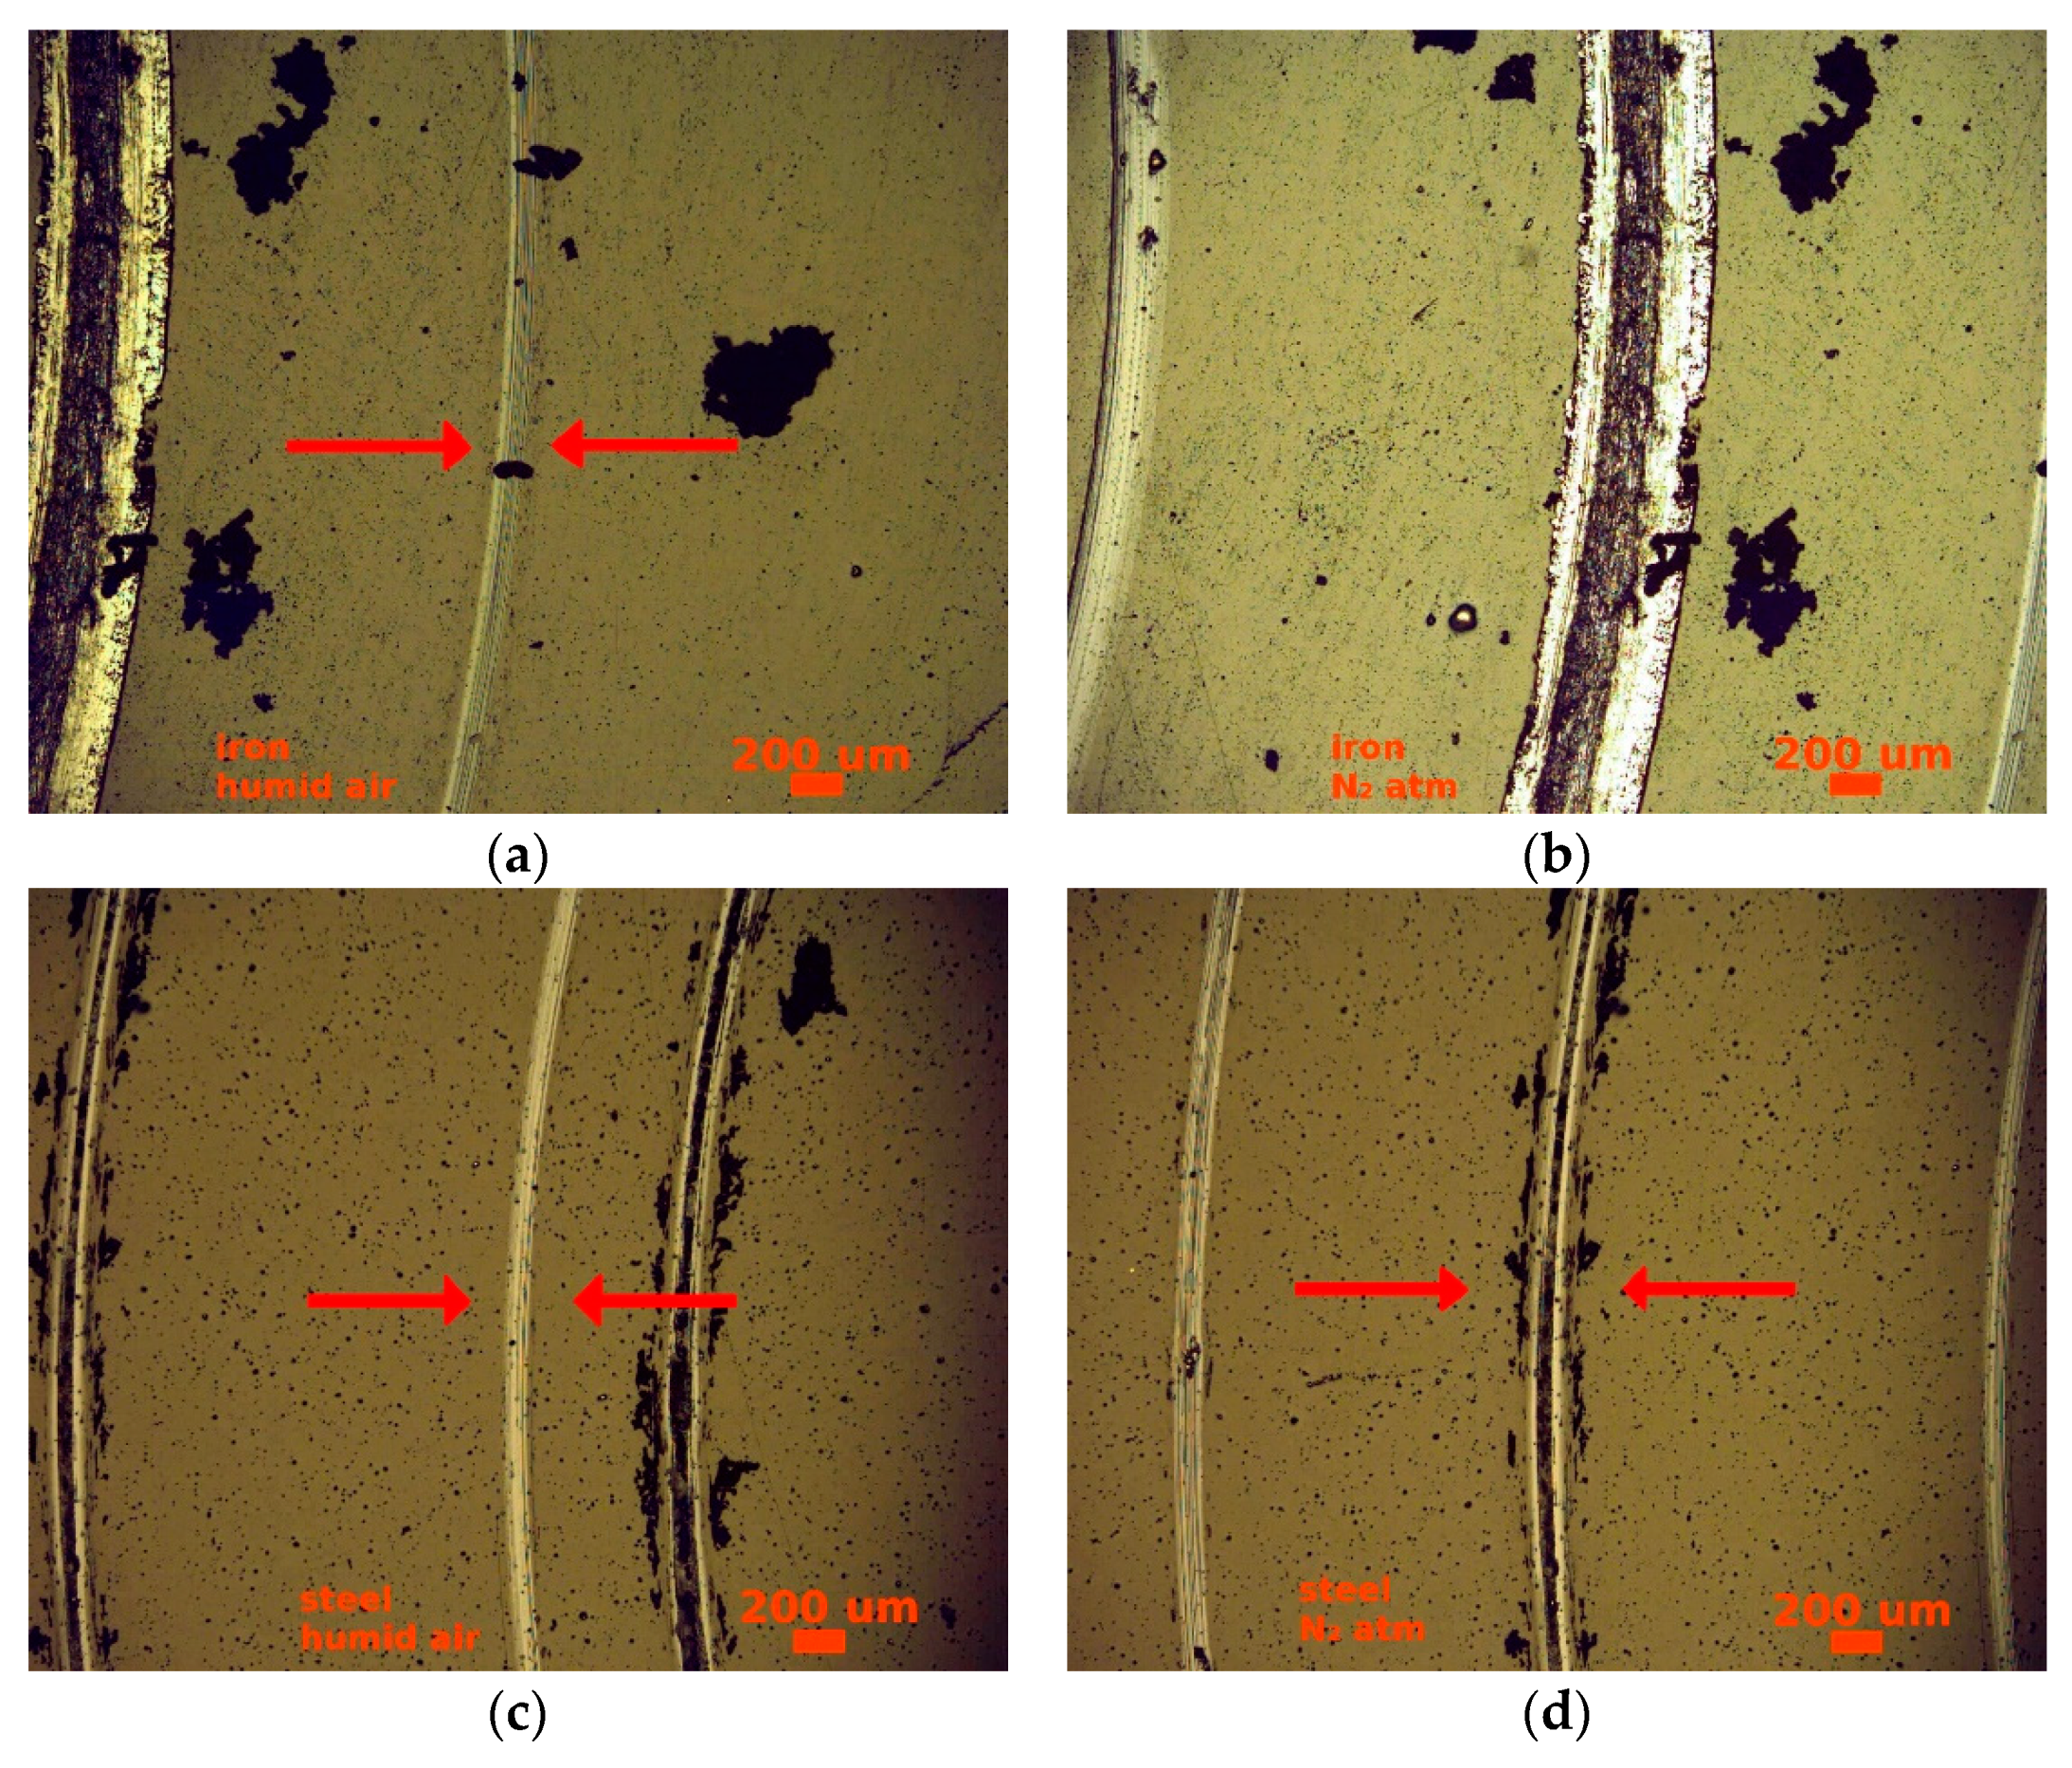
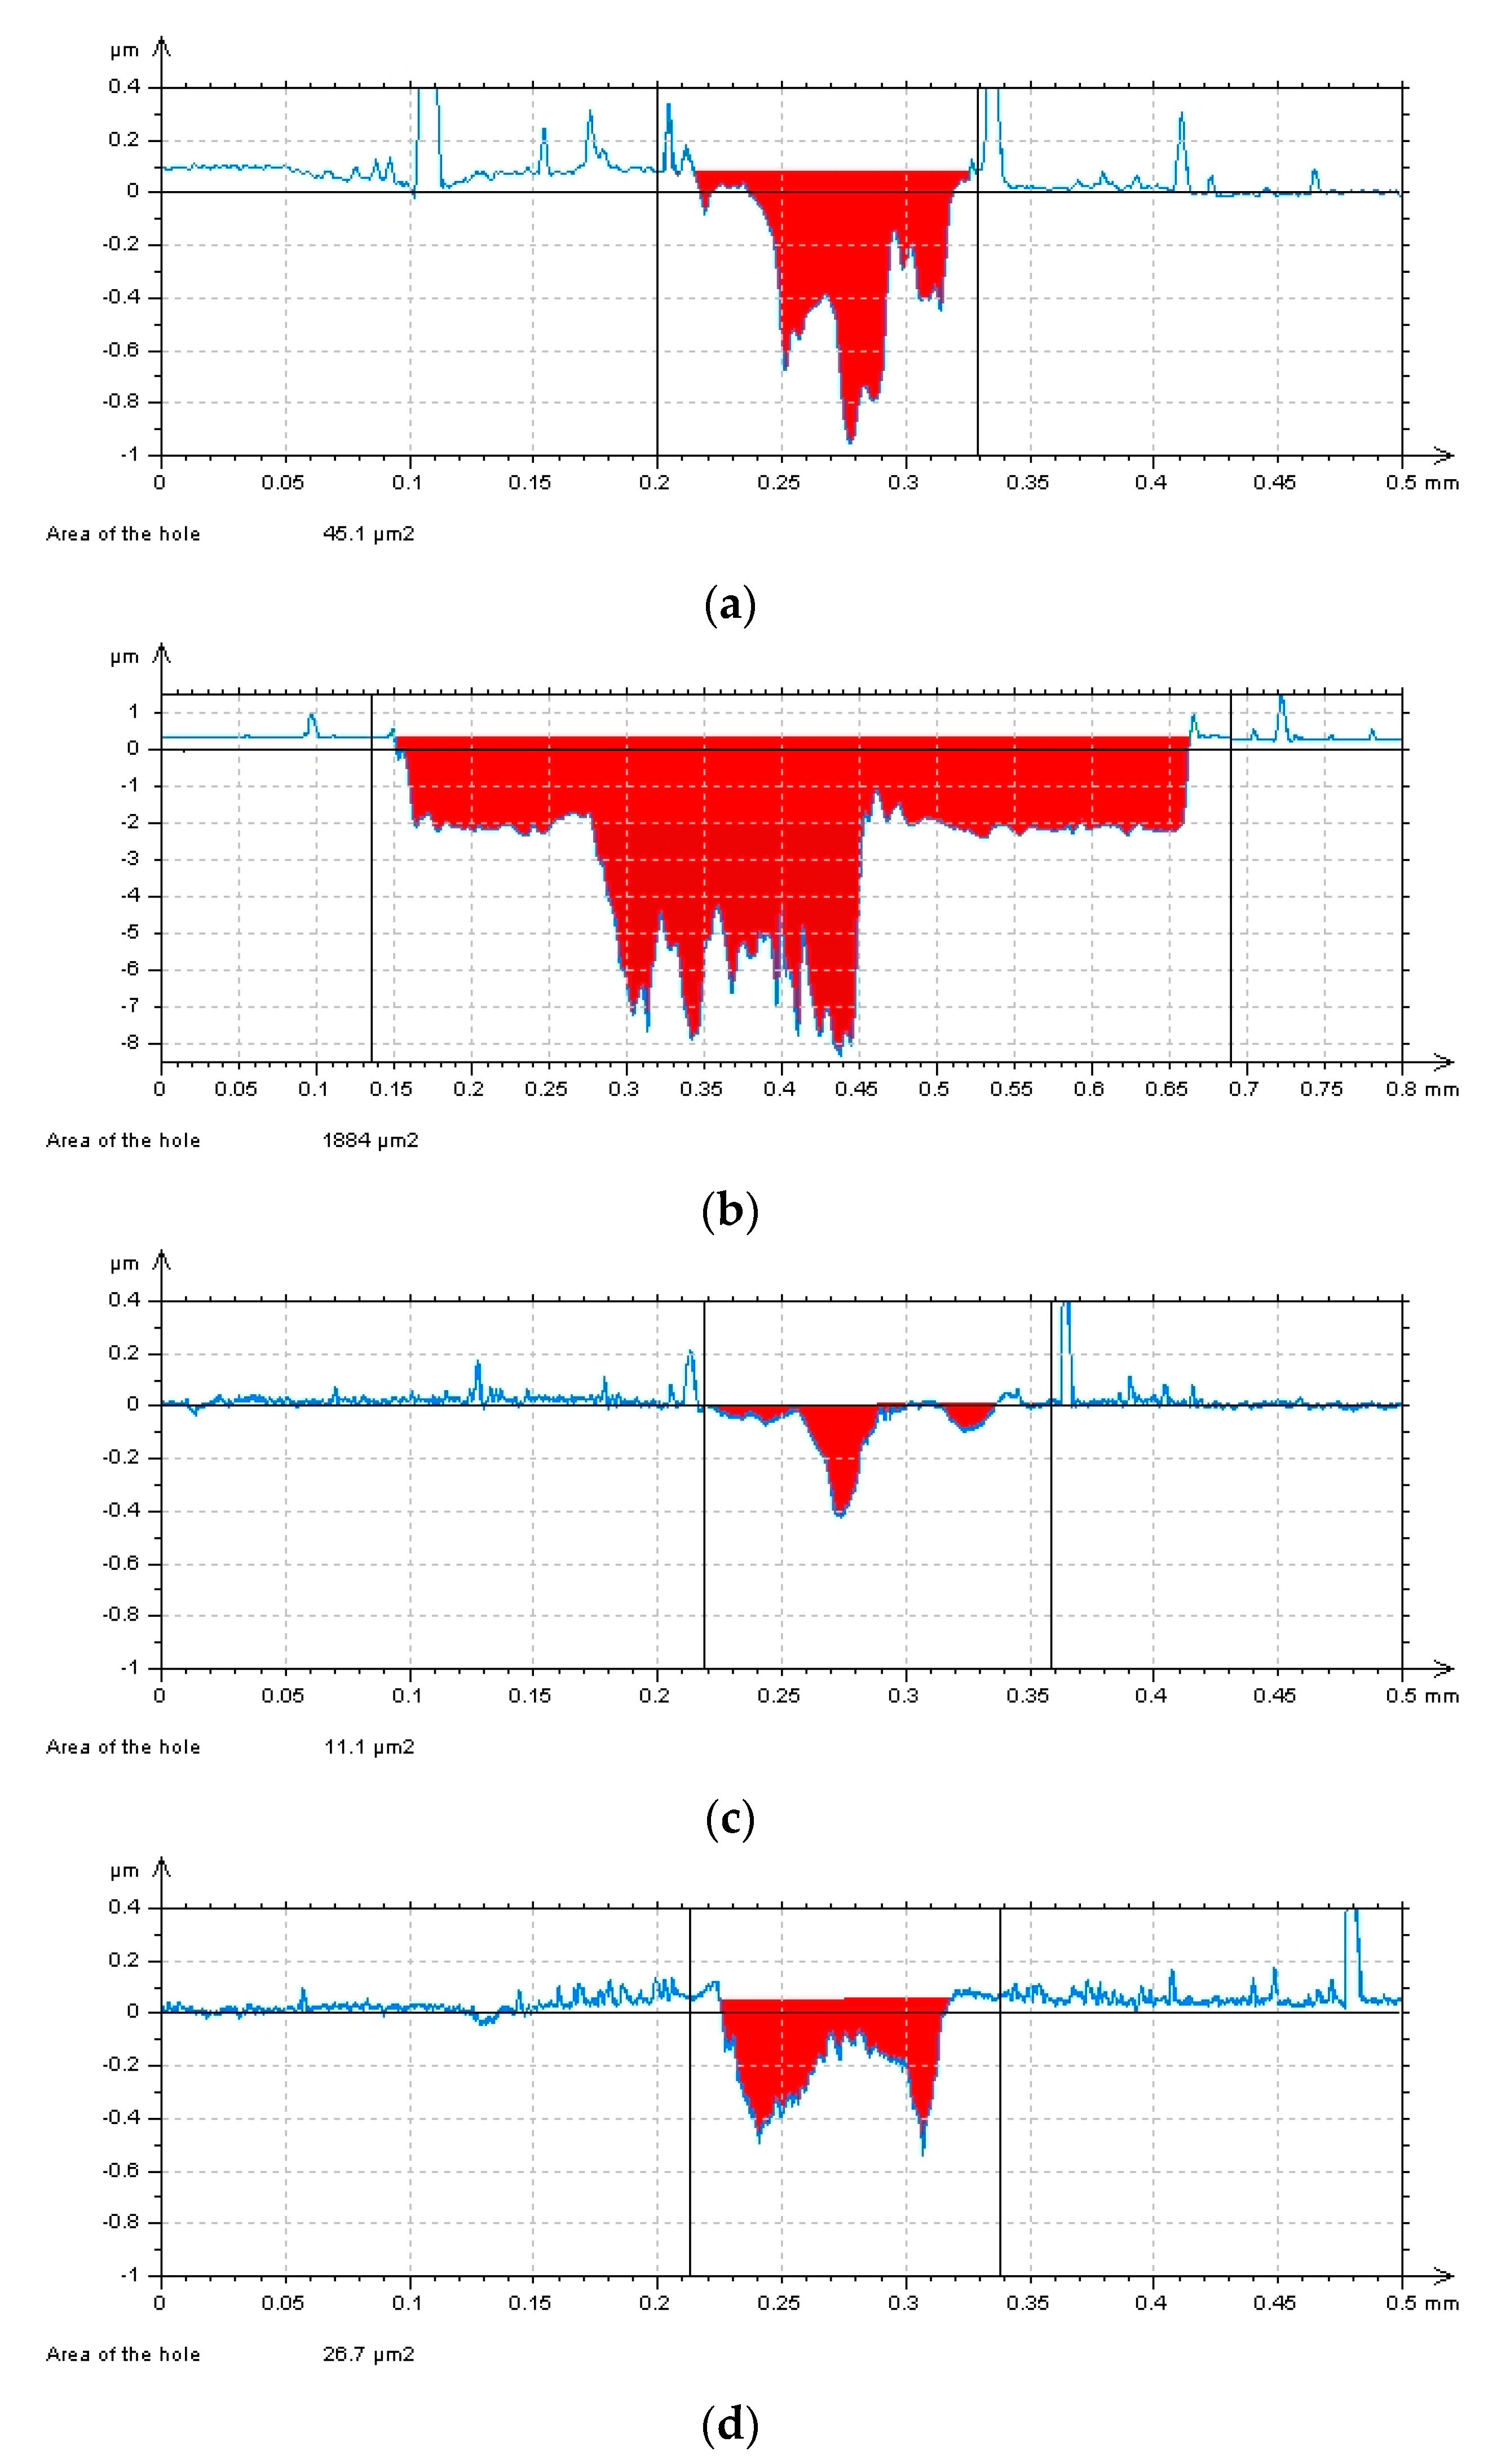
3.3. Wear Measurements
4. Conclusions
Author Contributions
Funding
Acknowledgments
Conflicts of Interest
Appendix A


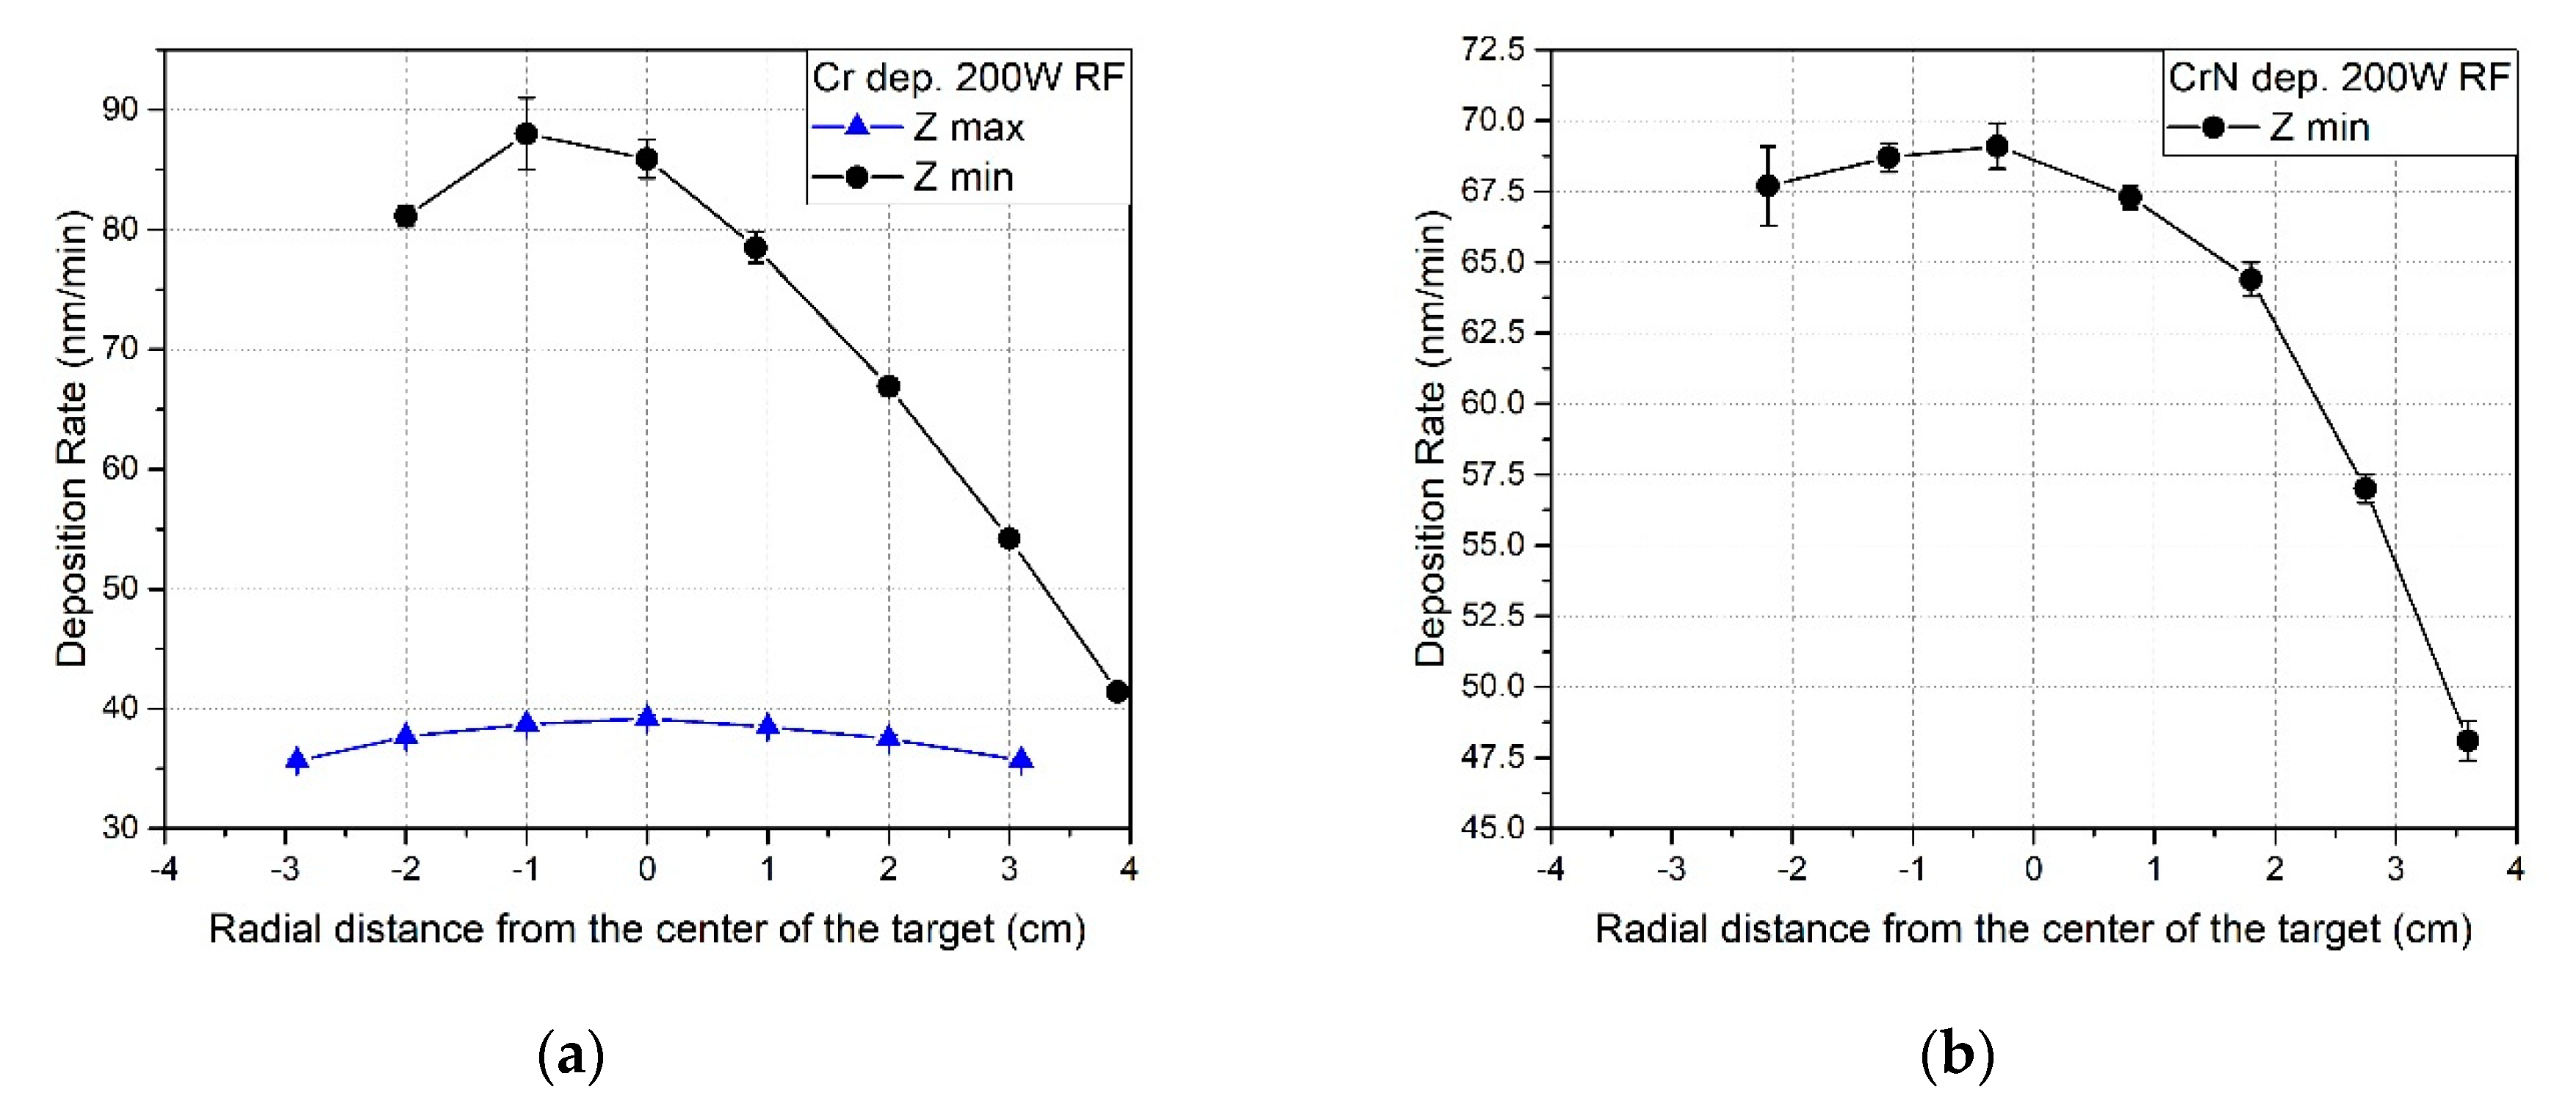
| Element–Compound | Deposition Rate (nm/min) |
|---|---|
| Cr (Zmax) | 39.2 ± 0.3 |
| Cr (Zmin) | 88 ± 3 |
| CrN (Zmax) | 7.0 ± 0.3 |
| CrN (Zmin) | 69.1 ± 0.8 |
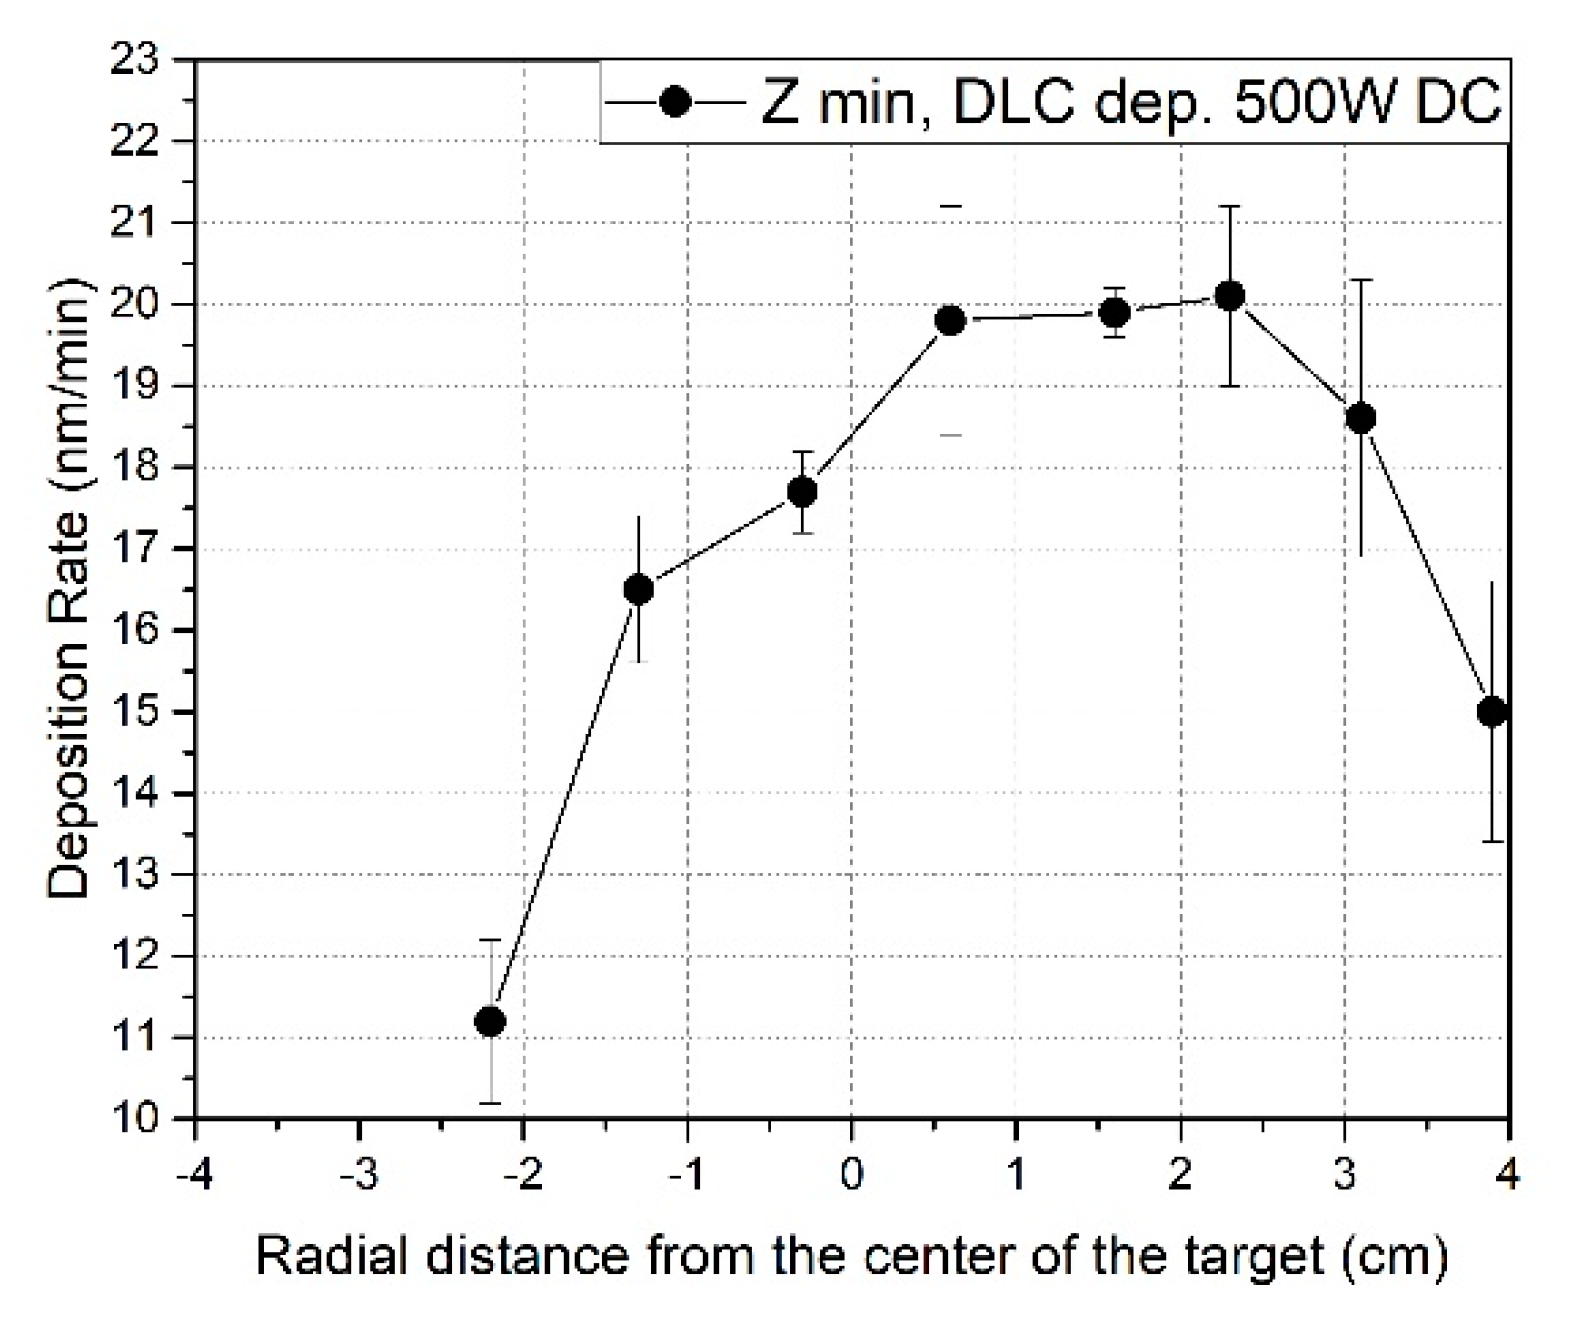
| DLC (Zmin, 500W DC) | 20.1 ± 1.1 |
| DLC (Zmin, 200W DC) | 5.3 ± 0.6 |
| DLC (Zmin, 100W DC) | 2.32 ± 0.2 |
Appendix B
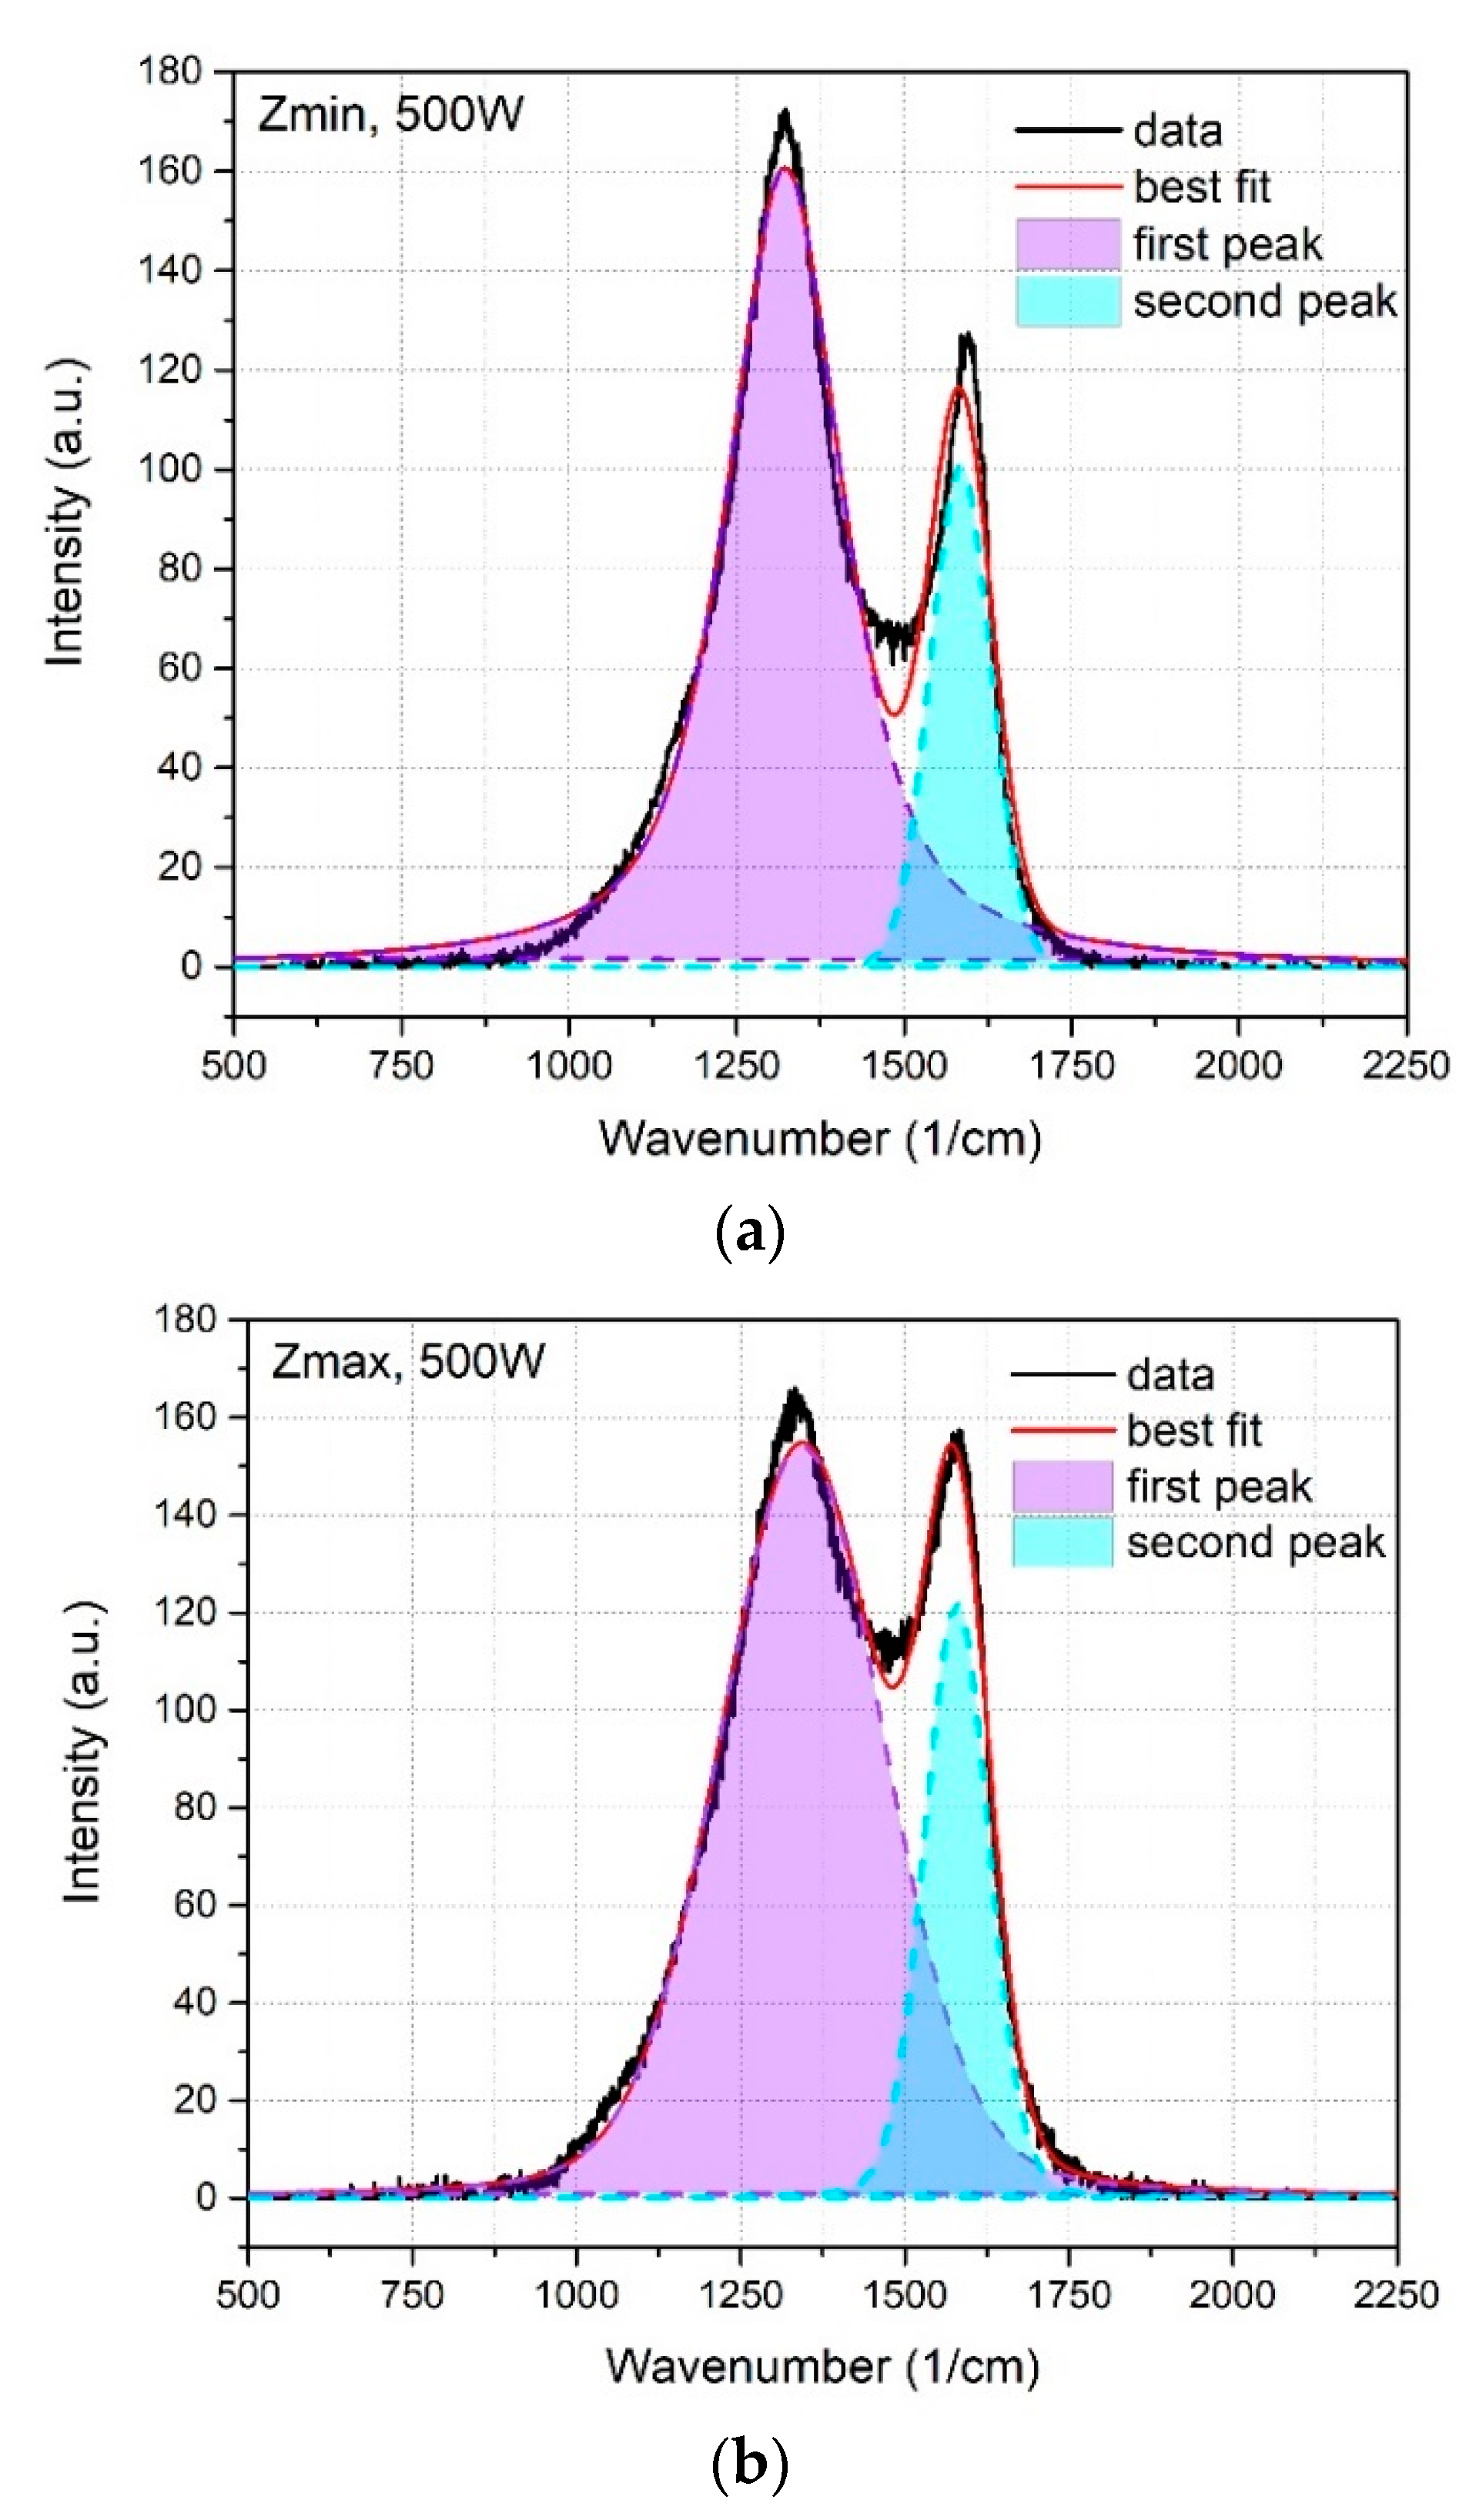
| Deposition Parameters | Pos(D) (cm−1) | FWHM(D) (cm−1) | Pos(G) (cm−1) | FWHM(D) (cm−1) |
|---|---|---|---|---|
| Zmin | ||||
| 100 W | 1325.4 ± 1.6 | 235.5 ± 0.1 | 1548.1 ± 1.0 | 179 ± 4 |
| 200 W | 1335.1 ± 0.4 | 276.2 ± 0.9 | 1582.2 ± 0.5 | 113.1 ± 0.8 |
| 500 W | 1323.3 ± 0.2 | 208 ± 2 | 1583.5 ± 0.14 | 110.0 ± 0.4 |
| Zmax | ||||
| 100 W | 1337.6 ± 1.3 | 281.5 ± 1.4 | 1580.8 ± 0.8 | 116.9 ± 0.2 |
| 200 W | 1330 ± 9 | 230 ± 12 | 1555 ± 5 | 177 ± 17 |
| 500 W | 1343 ± 2 | 298 ± 3 | 1579.2 ± 0.2 | 117.0 ± 0.9 |
References
- Kodali, P.; Walter, K.; Nastasi, M. Investigation of mechanical and tribological properties of amorphous diamond-like carbon coatings. Tribol. Int. 1997, 30, 591–598. [Google Scholar] [CrossRef]
- Ronkainen, H.; Varjus, S.; Holmberg, K. Friction and wear properties in dry, water-and oil-lubricated DLC against alumina and DLC against steel contacts. Wear 1998, 222, 120–128. [Google Scholar] [CrossRef]
- Matthews, A.; Eskildsen, S. Engineering applications for diamond-like carbon. Diam. Relat. Mater. 1994, 3, 902–911. [Google Scholar] [CrossRef]
- Mezzi, A.; Kaciulis, S. Surface investigation of carbon films: From diamond to graphite. Surf. Interface Anal. 2010, 42, 1082–1084. [Google Scholar] [CrossRef]
- Lifshitz, Y. Diamond-like carbon—Present status. Diam. Relat. Mater. 1999, 8, 1659–1676. [Google Scholar] [CrossRef]
- Bowden, F.; Young, J. Friction of diamond, graphite, and carbon and the influence of surface films. Proc. R. Soc. Lond. A Math. Phys. Eng. Sci. 1951, 208, 444–455. [Google Scholar]
- Bryant, P.; Gutshall, P.; Taylor, L. A study of mechanisms of graphite friction and wear. Wear 1964, 7, 118–126. [Google Scholar] [CrossRef]
- Cho, N.; Krishnan, K.; Veirs, D.; Rubin, M.; Hopper, C.; Bhushan, B.; Bogy, D. Chemical structure and physical properties of diamond-like amorphous carbon films prepared by magnetron sputtering. J. Mater. Res. 1990, 5, 2543–2554. [Google Scholar] [CrossRef] [Green Version]
- Brostow, W.; Lobland, H.E.H. Materials: Introduction and Applications; John Wiley & Sons: Hoboken, NJ, USA, 2016. [Google Scholar]
- Snyders, R.; Bousser, E.; Amireault, P.; Klemberg-Sapieha, J.E.; Park, E.; Taylor, K.; Casey, K.; Martinu, L. Tribo-Mechanical Properties of DLC Coatings Deposited on Nitrided Biomedical Stainless Steel. Plasma Process. Polym. 2007, 4, S640–S646. [Google Scholar] [CrossRef]
- Robertson, J. Properties of diamond-like carbon. Surf. Coat. Technol. 1992, 50, 185–203. [Google Scholar] [CrossRef]
- Diaz, J.; Paolicelli, G.; Ferrer, S.; Comin, F. Separation of the sp3 and sp2 components in the C1s photoemission spectra of amorphous carbon films. Phys. Rev. B 1996, 54, 8064. [Google Scholar] [CrossRef]
- Robertson, J. Structural models of aC and aC:H. Diam. Relat. Mater. 1995, 4, 297–301. [Google Scholar] [CrossRef]
- Liu, L.; Wang, T.; Huang, J.; He, Z.; Yi, Y.; Du, K. Diamond-like carbon thin films with high density and low internal stress deposited by coupling DC/RF magnetron sputtering. Diam. Relat. Mater. 2016, 70, 151–158. [Google Scholar] [CrossRef]
- Donnet, C.; Erdemir, A. Tribology of Diamond-like Carbon Films: Fundamentals and Applications; Springer Science & Business Media: Berlin, Gemany, 2007. [Google Scholar]
- Zhang, S.; Bui, X.L.; Fu, Y. Magnetron sputtered hard aC coatings of very high toughness. Surf. Coat. Technol. 2003, 167, 137–142. [Google Scholar] [CrossRef]
- Casiraghi, C.; Ferrari, A.; Robertson, J. Raman spectroscopy of hydrogenated amorphous carbons. Phys. Rev. B 2005, 72, 085401. [Google Scholar] [CrossRef]
- Siegal, M.; Barbour, J.; Provencio, P.; Tallant, D.; Friedmann, T. Amorphous-tetrahedral diamond like carbon layered structures resulting from film growth energetics. Appl. Phys. Lett. 1998, 73, 759–761. [Google Scholar] [CrossRef]
- Coşkun, Ö.D.; Zerrin, T. Optical, structural and bonding properties of diamond-like amorphous carbon films deposited by DC magnetron sputtering. Diam. Relat. Mater. 2015, 56, 29–35. [Google Scholar] [CrossRef]
- Gharam, A.A.; Lukitsch, M.; Qi, Y.; Alpas, A. Role of oxygen and humidity on the tribo-chemical behaviour of non-hydrogenated diamond-like carbon coatings. Wear 2011, 271, 2157–2163. [Google Scholar] [CrossRef]
- Erdemir, A.; Eryilmaz, O.; Kim, S. Effect of tribochemistry on lubricity of DLC films in hydrogen. Surf. Coat. Technol. 2014, 257, 241–246. [Google Scholar] [CrossRef]
- Ferrari, A.C.; Robertson, J. Raman spectroscopy of amorphous, nanostructured, diamond–like carbon, and nanodiamond. Philos. Trans. R. Soc. Lond. A Math. Phys. Eng. Sci. 2004, 362, 2477–2512. [Google Scholar] [CrossRef]
- Robertson, J. Deposition mechanisms for promoting sp3 bonding in diamond-like carbon. Diam. Relat. Mater. 1993, 2, 984–989. [Google Scholar] [CrossRef]
- Bhushan, B. Modern Tribology Handbook, Two Volume Set; CRC press: Boca Raton, FL, USA, 2000. [Google Scholar]
- Liu, Y.; Erdemir, A.; Meletis, E.I. A study of the wear mechanism of diamond-like carbon films. Surf. Coat. Technol. 1996, 82, 48–56. [Google Scholar] [CrossRef]
- Hirvonen, J.P.; Lappalainen, R.; Koskinen, J.; Anttila, A.; Jervis, T.R.; Trkula, M. Tribological characteristics of diamond-like films deposited with an arc-discharge method. J. Mater. Res. 1990, 5, 2524–2530. [Google Scholar] [CrossRef]
- Grill, A. Tribology of diamond-like carbon and related materials: An updated review. Surf. Coat. Technol. 1997, 94, 507–513. [Google Scholar] [CrossRef]
- Gangopadhyay, A. Mechanical and tribological properties of amorphous carbon films. Tribol. Lett. 1998, 5, 25–39. [Google Scholar] [CrossRef]
- Donnet, C.; Belin, M.; Auge, J.; Martin, J.; Grill, A.; Patel, V. Tribochemistry of diamond-like carbon coatings in various environments. Surf. Coat. Technol. 1994, 68, 626–631. [Google Scholar] [CrossRef]
- Cui, L.; Lu, Z.; Wang, L. Environmental effect on the load-dependent friction behavior of a diamond-like carbon film. Tribol. Int. 2015, 82, 195–199. [Google Scholar] [CrossRef]
- Erdemir, A. Genesis of superlow friction and wear in diamondlike carbon films. Tribol. Int. 2004, 37, 1005–1012. [Google Scholar] [CrossRef]
- Enke, K.; Dimigen, H.; Hübsch, H. Frictional properties of diamond-dlike carbon layers. Appl. Phys. Lett. 1980, 36, 291–292. [Google Scholar] [CrossRef]
- Voevodin, A.A.; Donley, M.S. Preparation of amorphous diamond-like carbon by pulsed laser deposition: A critical review. Surf. Coat. Technol. 1996, 82, 199–213. [Google Scholar] [CrossRef]
- Konca, E.; Cheng, Y.-T.; Alpas, A.T. Dry sliding behaviour of non-hydrogenated DLC coatings against Al, Cu and Ti in ambient air and argon. Diam. Relat. Mater. 2006, 15, 939–943. [Google Scholar] [CrossRef]
- Miyoshi, K. Studies of mechanochemical interactions in the tribological behavior of materials. Surf. Coat. Technol. 1990, 43, 799–812. [Google Scholar] [CrossRef] [Green Version]
- Godet, M. The third-body approach: A mechanical view of wear. Wear 1984, 100, 437–452. [Google Scholar] [CrossRef]
- Scharf, T.; Singer, I. Monitoring transfer films and friction instabilities with in situ Raman tribometry. Tribol. Lett. 2003, 14, 3–8. [Google Scholar] [CrossRef]
- Singer, I.; Dvorak, S.; Wahl, K.; Scharf, T. Role of third bodies in friction and wear of protective coatings. J. Vac. Sci. Technol. A 2003, 21, S232–S240. [Google Scholar] [CrossRef]
- Scharf, T.; Singer, I. Role of the transfer film on the friction and wear of metal carbide reinforced amorphous carbon coatings during run-in. Tribol. Lett. 2009, 36, 43–53. [Google Scholar] [CrossRef]
- Outka, D.; Hsu, W.L.; Phillips, K.; Boehme, D.; Yang, N.; Ottesen, D.; Johnsen, H.; Clift, W.; Headley, T. Compilation of Diamond-like Carbon Properties for Barriers and Hard Coatings; Technical Report; U.S. Department of Energy Office of Scientific and Technical Information: Oak Ridge, TN, USA, 1994. [Google Scholar]
- Ferrari, A.C.; Robertson, J. Interpretation of Raman spectra of disordered and amorphous carbon. Phys. Rev. B 2000, 61, 14095. [Google Scholar] [CrossRef]
- Sanchez-Lopez, J.; Donnet, C.; Loubet, J.; Belin, M.; Grill, A.; Patel, V.; Jahnes, C. Tribological and mechanical properties of diamond-like carbon prepared by high-density plasma. Diam. Relat. Mater. 2001, 10, 1063–1069. [Google Scholar] [CrossRef]
- Pharr, G.; Oliver, W. Measurement of thin film mechanical properties using nanoindentation. MRS Bull. 1992, 17, 28–33. [Google Scholar] [CrossRef]
- Xie, Z.H.; Singh, R.; Bendavid, A.; Martin, P.; Munroe, P.; Hoffman, M. Contact damage evolution in a diamond-like carbon (DLC) coating on a stainless steel substrate. Thin Solid Film 2007, 515, 3196–3201. [Google Scholar] [CrossRef]
- Chang, C.L.; Wang, D.Y. Microstructure and adhesion characteristics of diamond-like carbon films deposited on steel substrates. Diam. Relat. Mater. 2001, 10, 1528–1534. [Google Scholar] [CrossRef]
- Kuiry, S. Advanced Scratch Testing for Evaluation of Coatings. Available online: https://www.bruker.com/fileadmin/user_upload/8-PDF-Docs/SurfaceAnalysis/TMT/Webinars/Advanced-Scratch-Testing-for-Evaluation-of-Coatings-Slides.pdf (accessed on 23 April 2019).
- Pagnoux, G.; Fouvry, S.; Peigney, M.; Delattre, B.; Mermaz-Rollet, G. Mechanical behavior of DLC coatings under various scratch conditions. In Proceedings of the 3rd Internation Conference on Fracture Fatigue and Wear, Kitakyushu, Japan, 1–3 September 2014. [Google Scholar]
- Merel, P.; Tabbal, M.; Chaker, M.; Moisa, S.; Margot, J. Direct evaluation of the sp3 content in diamond-like-carbon films by XPS. Appl. Surf. Sci. 1998, 136, 105–110. [Google Scholar] [CrossRef]
- Yang, M.; Marino, M.J.; Bojan, V.J.; Eryilmaz, O.L.; Erdemir, A.; Kim, S.H. Quantification of oxygenated species on a diamond-like carbon (DLC) surface. Appl. Surf. Sci. 2011, 257, 7633–7638. [Google Scholar] [CrossRef]
- Popov, C.; Kulisch, W.; Bliznakov, S.; Mednikarov, B.; Spasov, G.; Pirov, J.; Jelinek, M.; Kocourek, T.; Zemek, J. Characterization of the bonding structure of nanocrystalline diamond and amorphous carbon films prepared by plasma assisted techniques. Appl. Phys. A 2007, 89, 209–212. [Google Scholar] [CrossRef]
- Robertson, J. The deposition mechanism of diamond-like aC and aC:H. Diam. Relat. Mater. 1994, 3, 361–368. [Google Scholar] [CrossRef]
- Owens, A.G.; Brühl, S.; Simison, S.; Forsich, C.; Heim, D. Comparison of tribological properties of stainless steel with hard and soft DLC coatings. Procedia Mater. Sci. 2015, 9, 246–253. [Google Scholar] [CrossRef]
- Donnet, C. Recent progress on the tribology of doped diamond-like and carbon alloy coatings: A review. Surf. Coat. Technol. 1998, 100, 180–186. [Google Scholar] [CrossRef]
- Kim, H.I.; Lince, J.R.; Eryilmaz, O.L.; Erdemir, A. Environmental effects on the friction of hydrogenated DLC films. Tribol. Lett. 2006, 21, 51–56. [Google Scholar] [CrossRef]
- Li, H.; Xu, T.; Wang, C.; Chen, J.; Zhou, H.; Liu, H. Annealing effect on the structure, mechanical and tribological properties of hydrogenated diamond-like carbon films. Thin Solid Film 2006, 515, 2153–2160. [Google Scholar] [CrossRef]
- Burnett, P.J.; Rickerby, D.S. The relationship between hardness and scratch adhession. Thin Solid Film 1987, 154, 403–416. [Google Scholar] [CrossRef]
- Perry, A.J. Scratch adhesion testing of hard coatings. Thin Solid Film 1983, 107, 167–180. [Google Scholar] [CrossRef]
- Kato, K. Wear in relation to friction—A review. Wear 2000, 241, 151–157. [Google Scholar] [CrossRef]
- Bandorf, R.; Lüthje, H.; Wortmann, A.; Staedler, T.; Wittorf, R. Influence of substrate material and topography on the tribological behaviour of submicron coatings. Surf. Coat. Technol. 2003, 174, 461–464. [Google Scholar] [CrossRef]
- Bhargava, G.; Gouzman, I.; Chun, C.M.; Ramanarayanan, T.A.; Bernasek, S.L. Characterization of the “native” surface thin film on pure polycrystalline iron: A high resolution XPS and TEM study. Appl. Surf. Sci. 2007, 253, 4322–4329. [Google Scholar] [CrossRef]
- Lin, T.C.; Seshadri, G.; Kelber, J.A. A consistent method for quantitative XPS peak analysis of thin oxide films on clean polycrystalline iron surfaces. Appl. Surf. Sci. 1997, 119, 83–92. [Google Scholar] [CrossRef]
- Papakonstantinou, P.; Zhao, J.F.; Richardot, A.; McAdams, E.T.; McLaughlin, J.A. Evaluation of corrosion performance of ultra-thin Si-DLC overcoats with electrochemical impedance spectroscopy. Diam. Relat. Mater. 2002, 11, 1124–1129. [Google Scholar] [CrossRef]
- Choi, J.; Nakao, S.; Kim, J.; Ikeyama, M.; Kato, T. Corrosion protection of DLC coatings on magnesium alloy. Diam. Relat. Mater. 2007, 16, 1361–1364. [Google Scholar] [CrossRef]
- Kim, H.G.; Ahn, S.H.; Kim, J.G.; Park, S.J.; Lee, K.R. Corrosion performance of diamond-like carbon (DLC)-coated Ti alloy in the simulated body fluid environment. Diam. Relat. Mater. 2005, 14, 35–41. [Google Scholar] [CrossRef]
- Robertson, J. Diamond-like amorphous carbon. Mater. Sci. Eng. 2002, 37, 129–281. [Google Scholar] [CrossRef] [Green Version]
- Ferrari, A.C. Determination of bonding in diamond-like carbon by Raman Spectroscopy. Diam. Relat. Mater. 2002, 11, 1053–1061. [Google Scholar] [CrossRef]
- Cui, W.G.; Lai, Q.B.; Zhang, L.; Wang, F.M. Quantitative measurements of sp3 content in DLC films with Raman spectroscopy. Surf. Coat. Technol. 2010, 205, 1995–1999. [Google Scholar] [CrossRef]


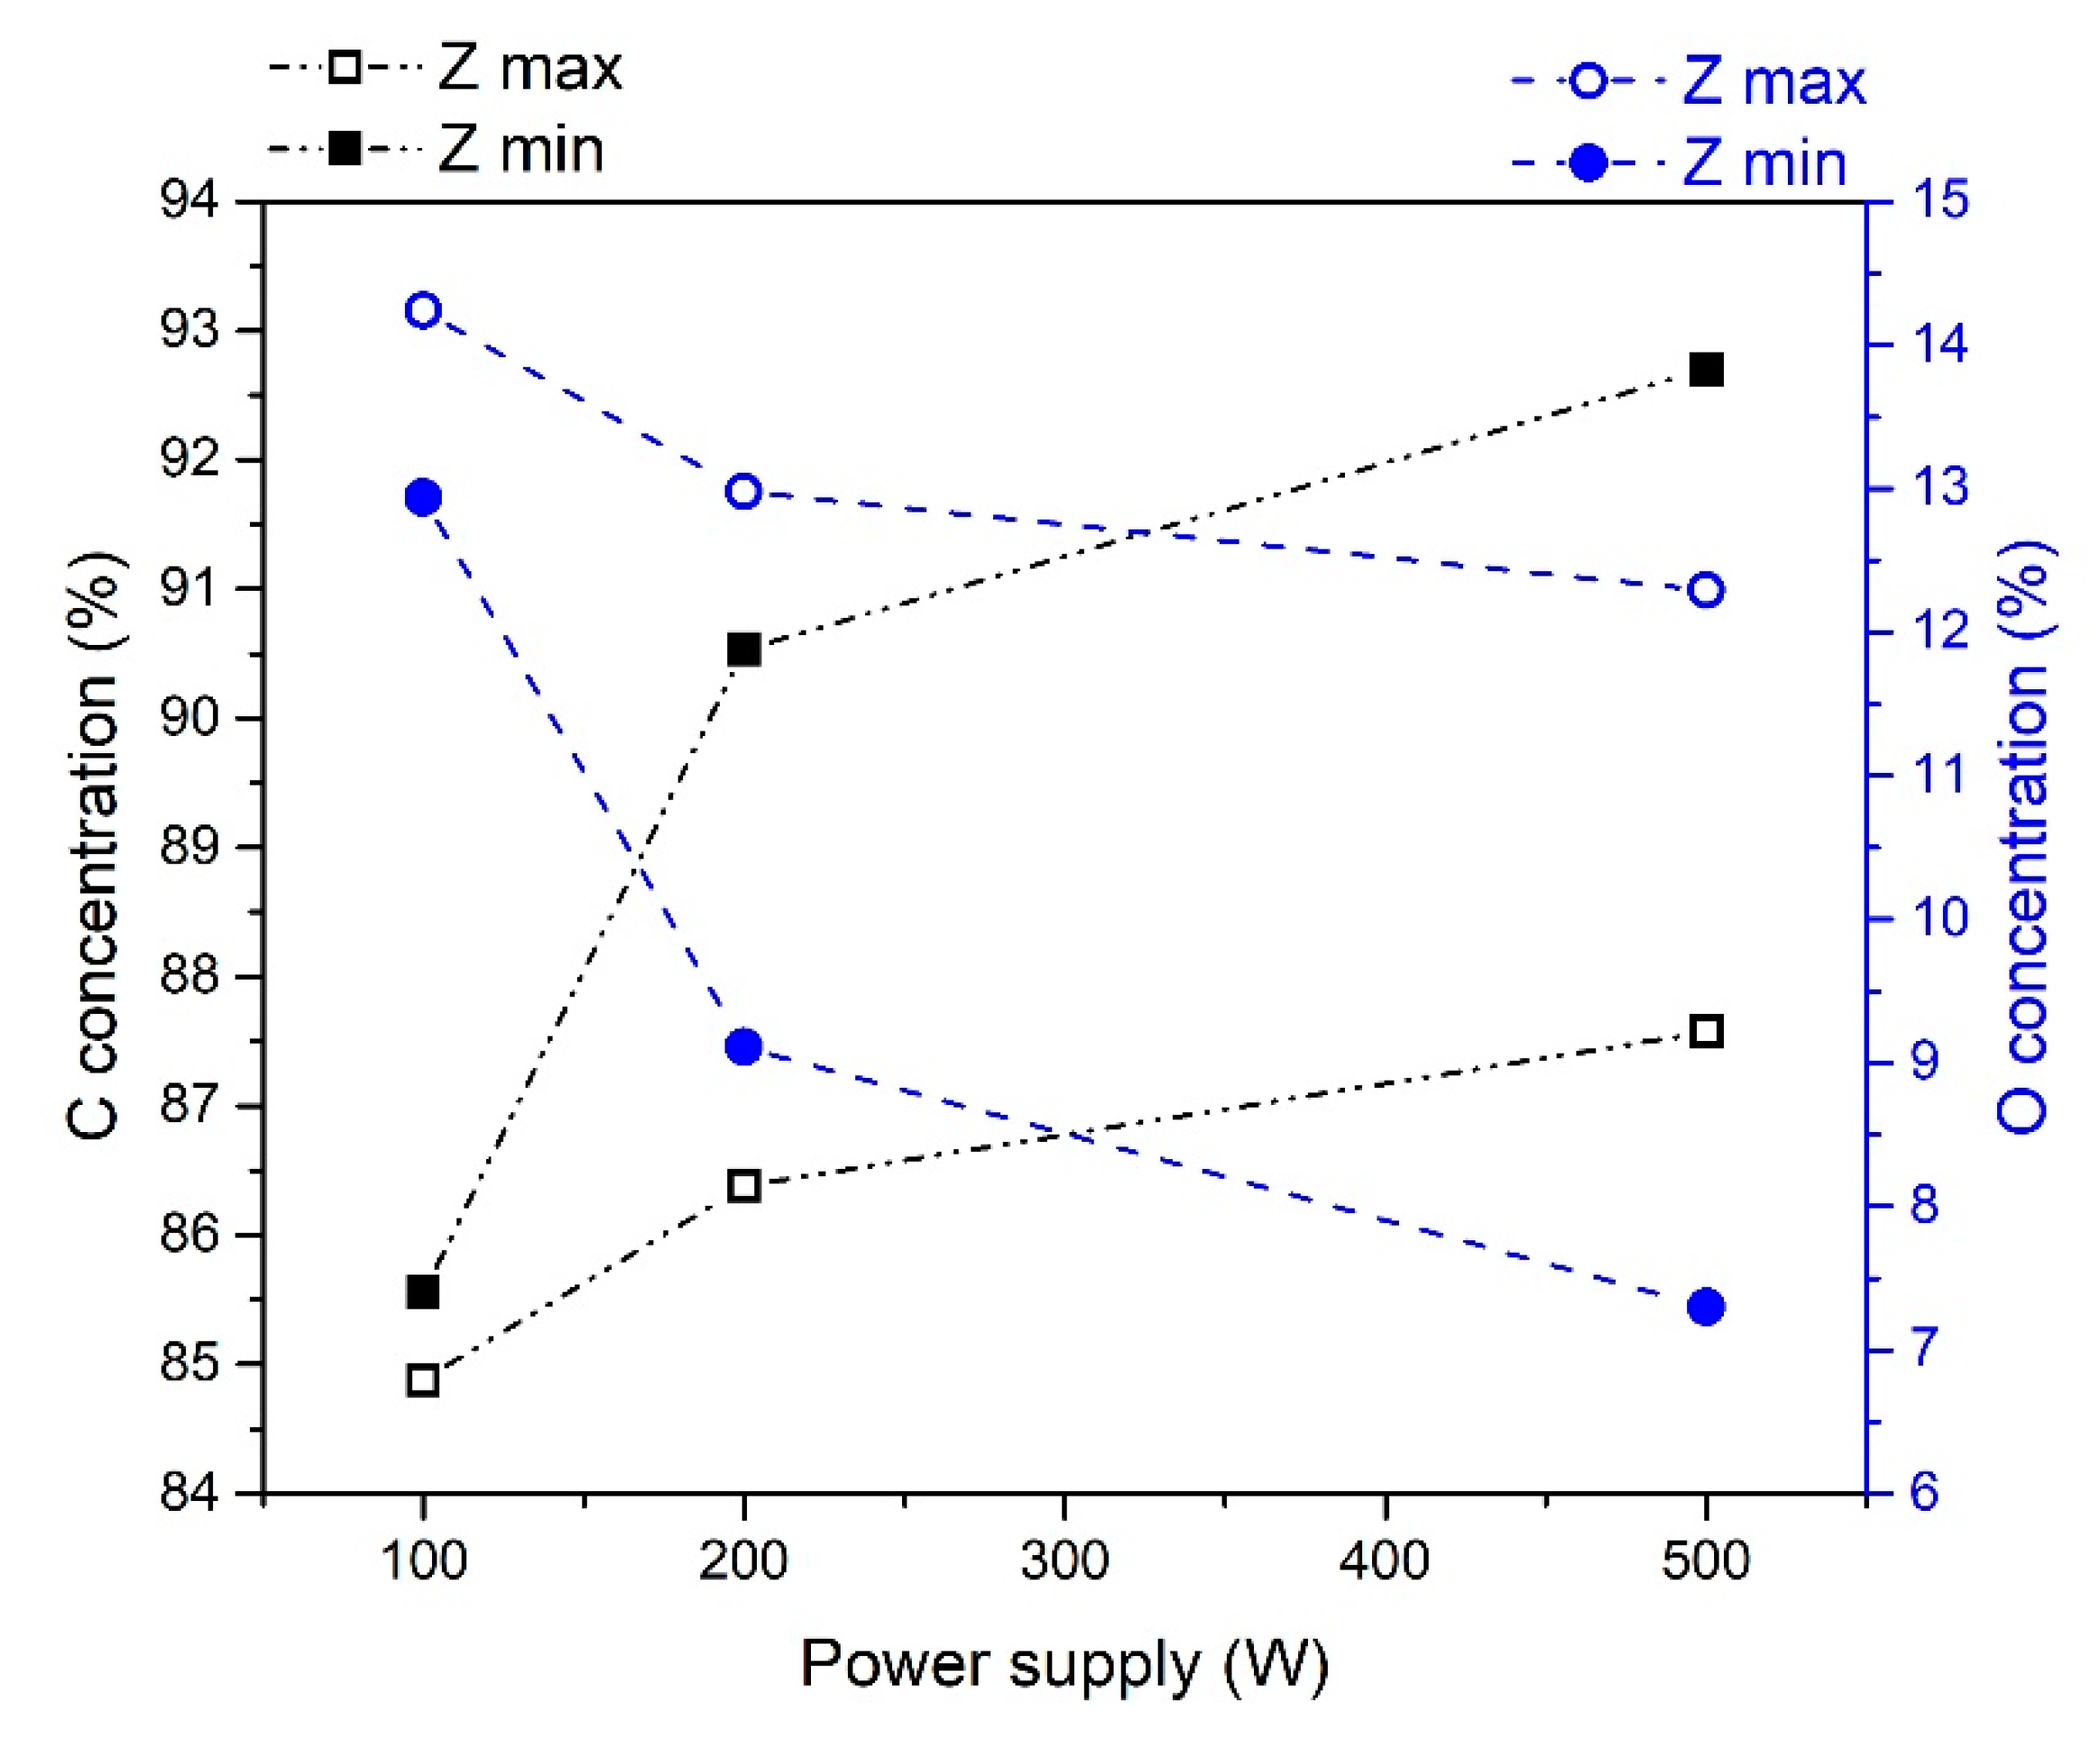
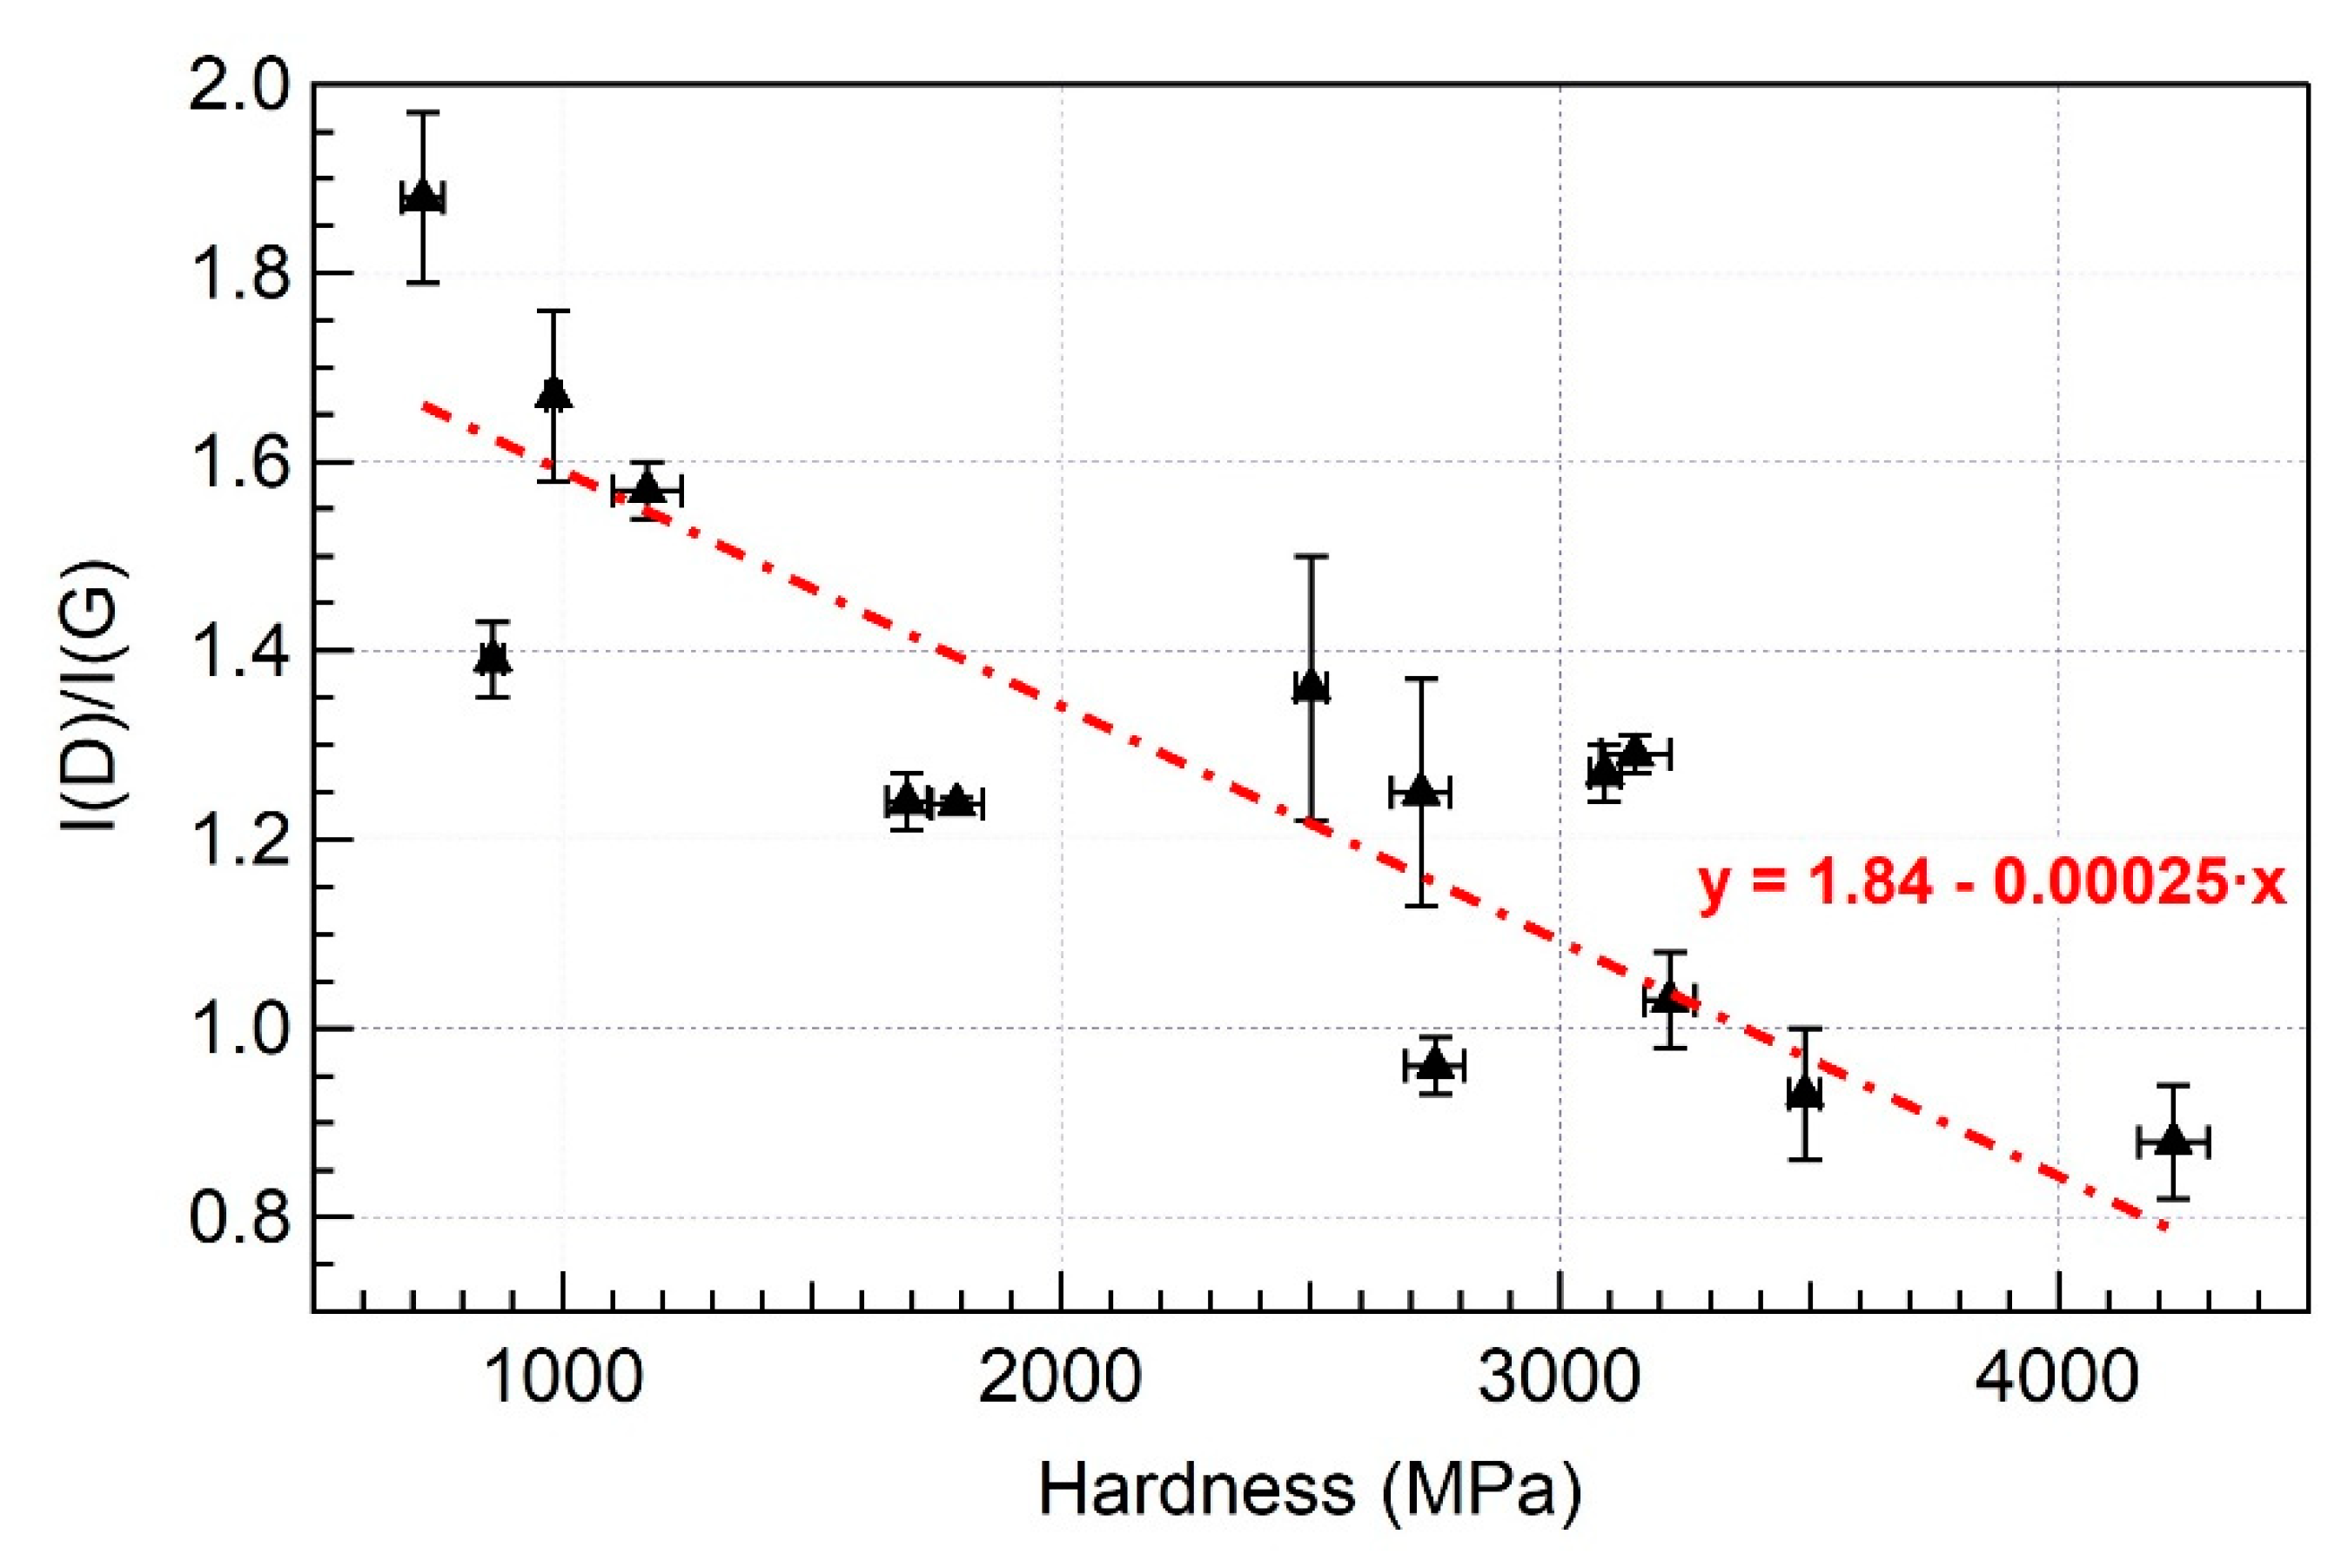
| Deposition Parameters | [C] (%) | [O] (%) | [sp3] 1 (%) | I(D)/I(G) | H (MPa) |
|---|---|---|---|---|---|
| Zmin | |||||
| 100 W | 85.6 | 12.9 | 43.3 | 0.90 ± 0.04 | 3490 ± 30 |
| 200 W | 90.5 | 9.2 | 53.8 | 1.30 ± 0.06 | 3150 ± 70 |
| 500 W | 92.7 | 7.3 | 51.5 | 1.63 ± 0.05 | 983 ± 14 |
| Zmax | |||||
| 100 W | 84.9 | 14.2 | 34.5 | 1.31 ± 0.04 | 2500 ± 30 |
| 200 W | 86.4 | 13.0 | 41.1 | 1.18 ± 0.13 | 2750 ± 60 |
| 500 W | 87.6 | 12.3 | 52.4 | 1.26 ± 0.07 | 3090 ± 30 |
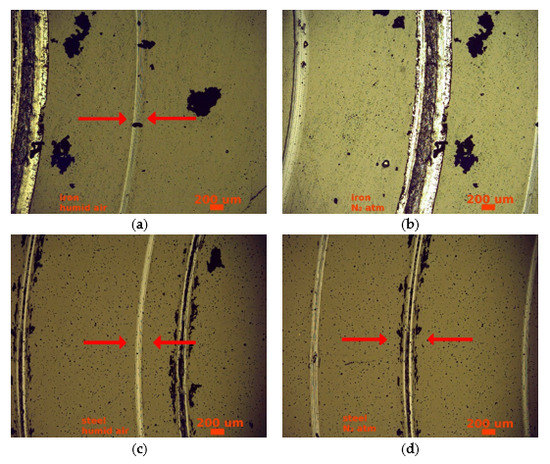
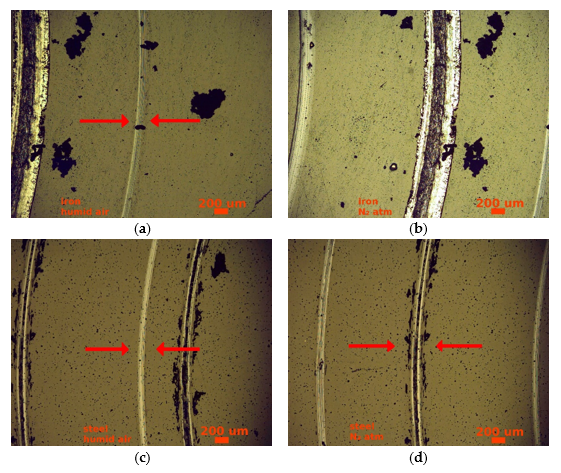
| Substrate Material | Test Atmosphere | Average Radius (μm) |
|---|---|---|
| iron substrate | humid air | ~230 |
| N2 atm | ~540 | |
| steel substrate | humid air | ~190 |
| N2 atm | ~320 |
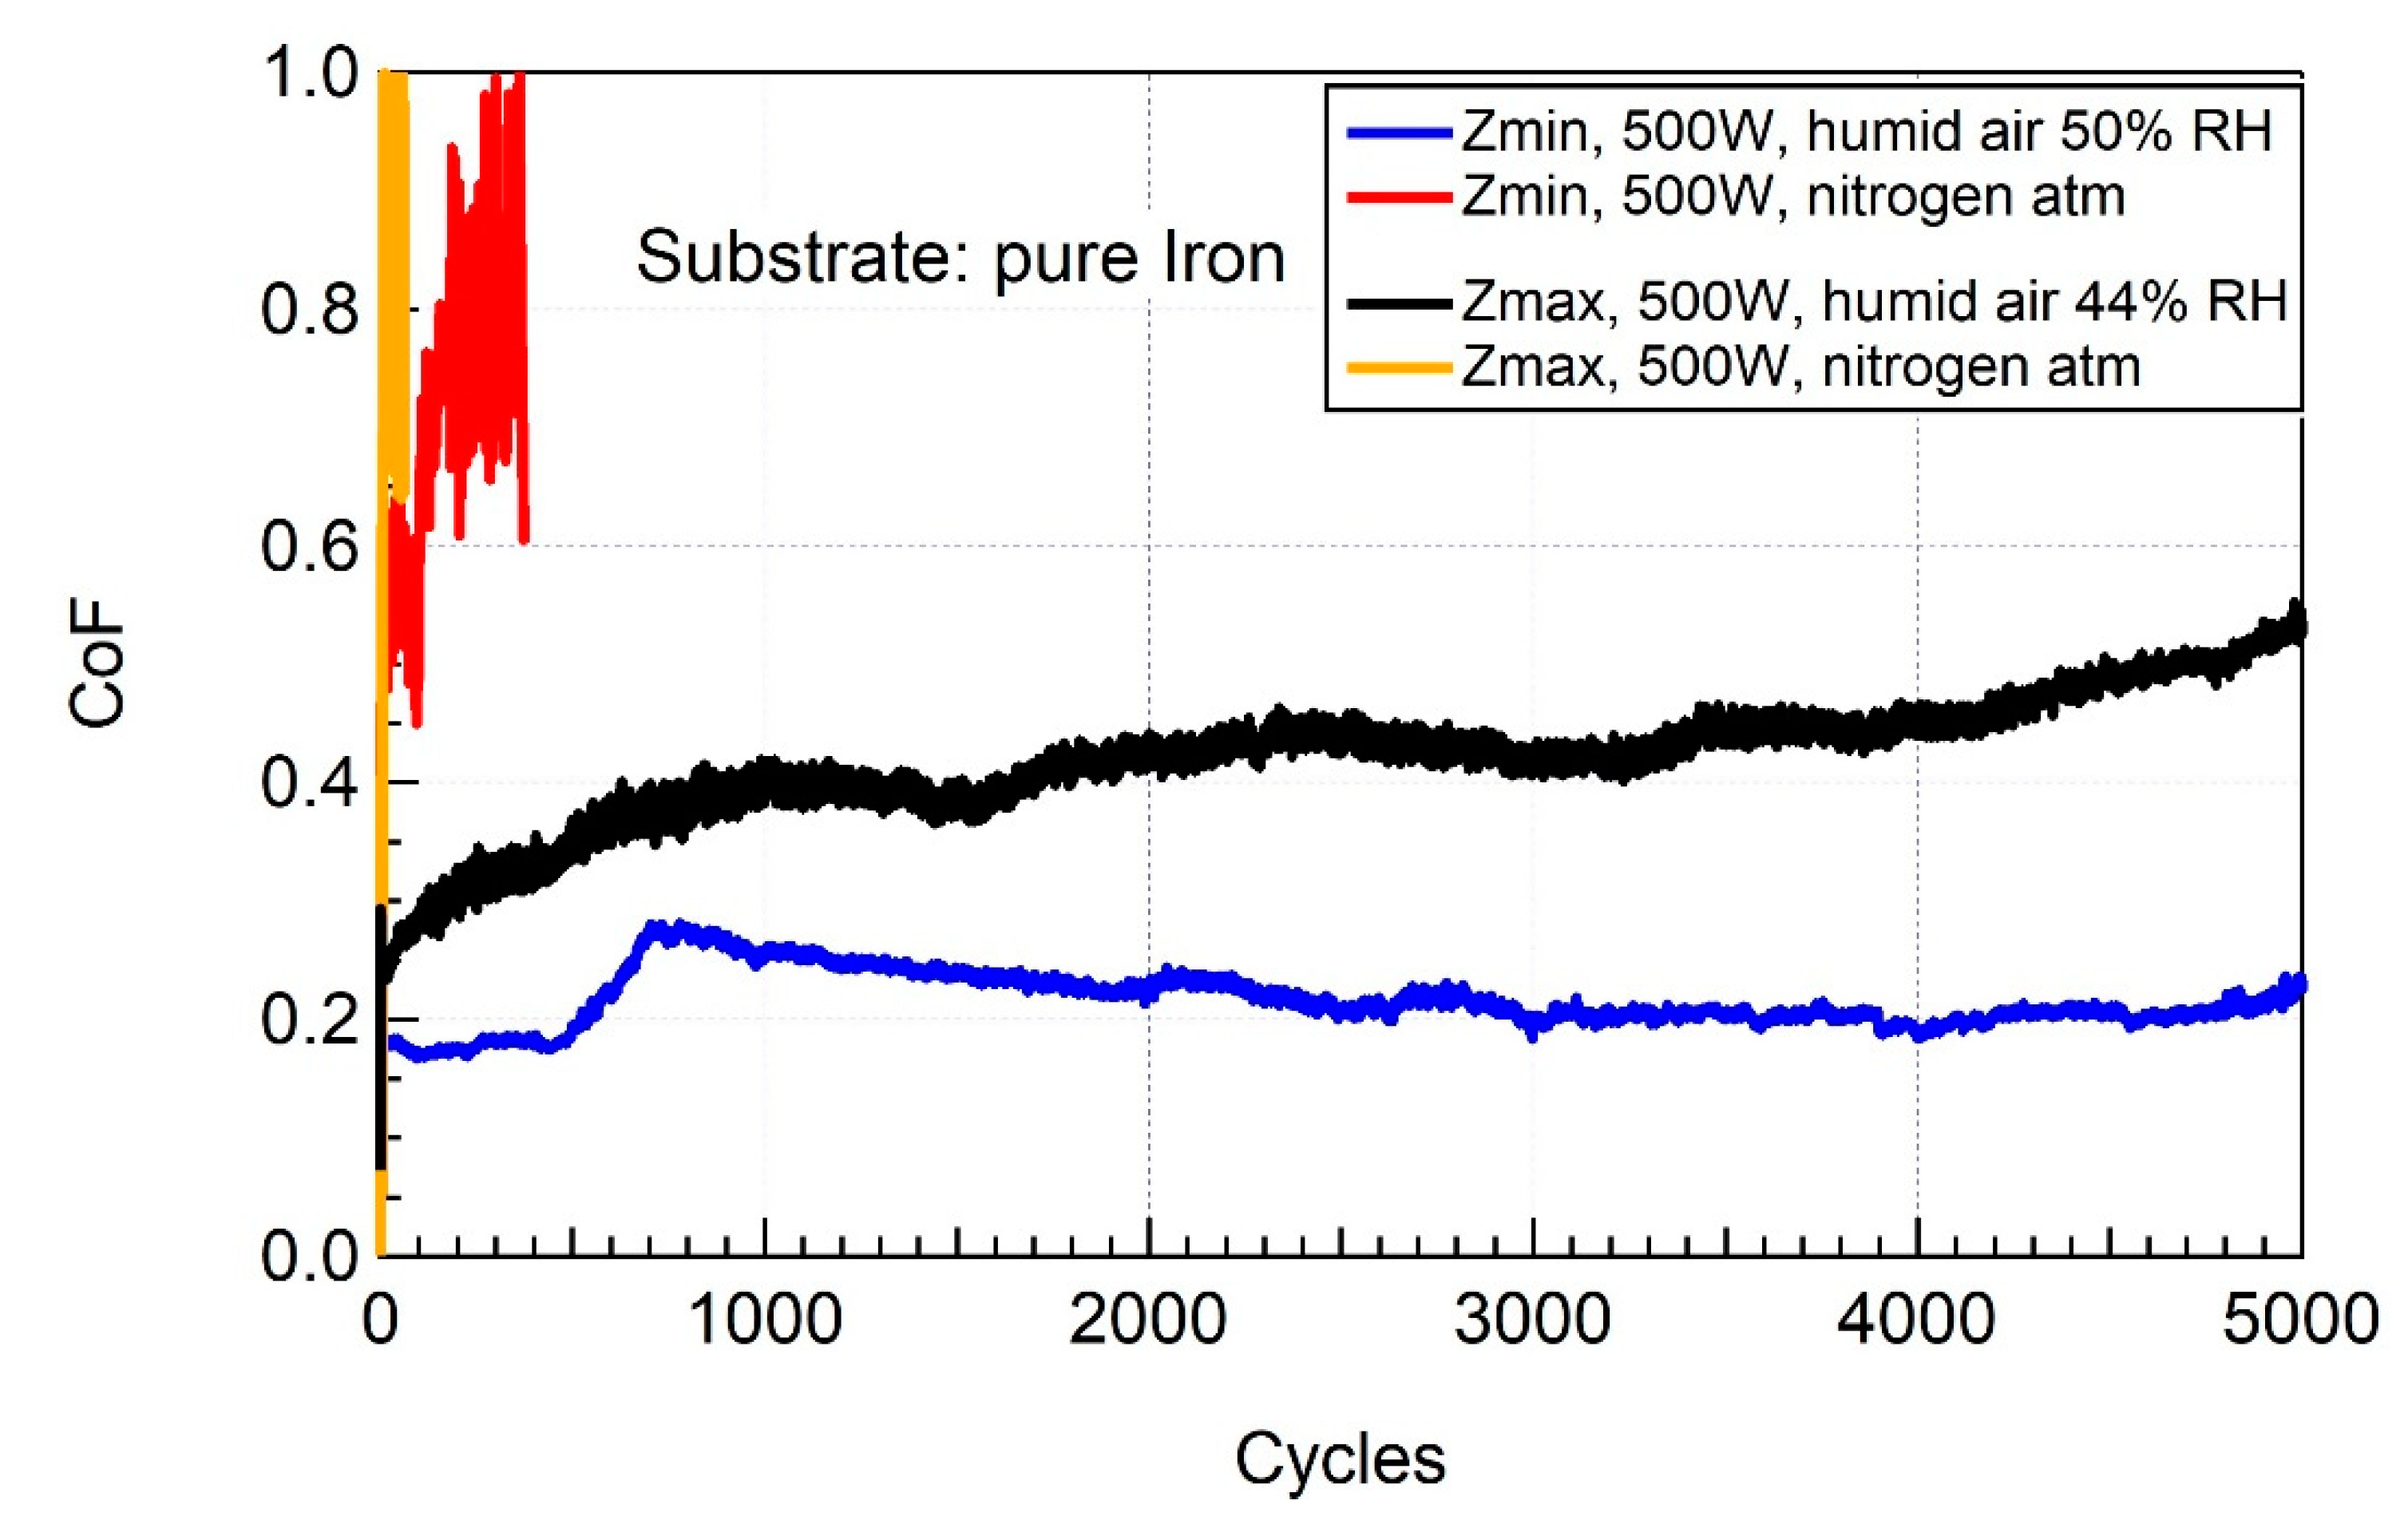
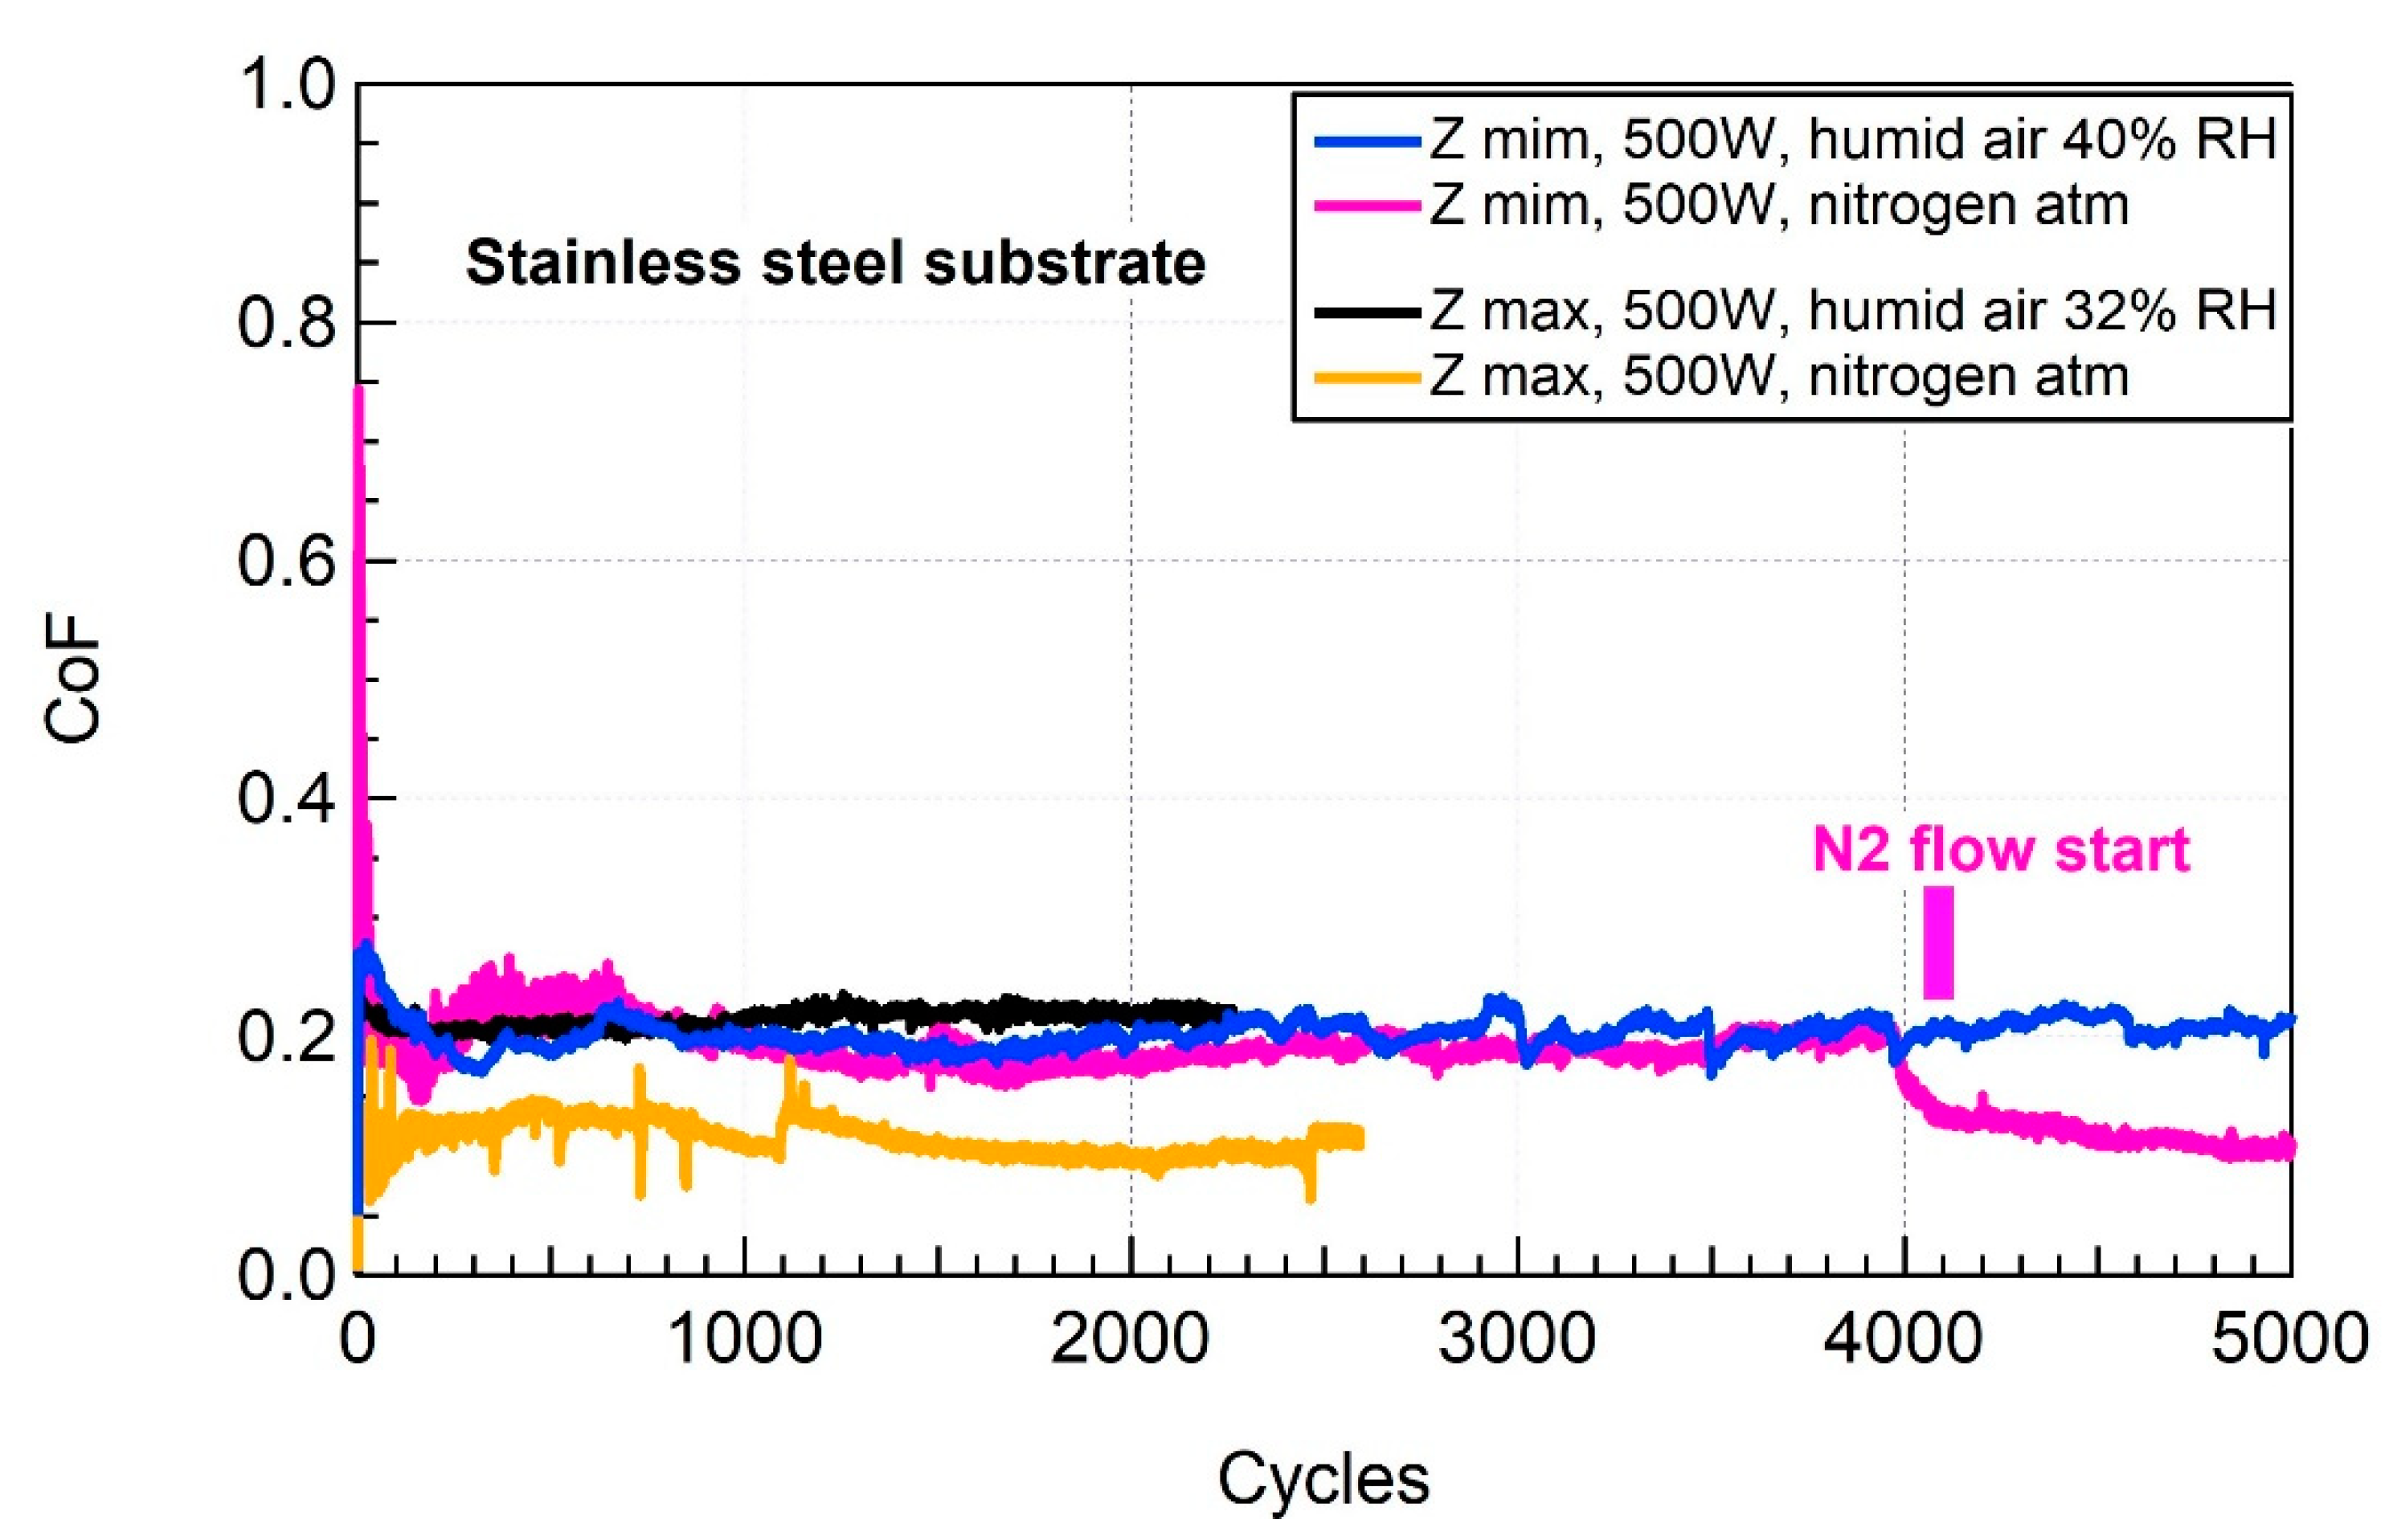
| Substrate Material | Test Atmosphere | CoF | Specific Wear Rate Disk (10−6 mm3/(N cycles)) | Specific Wear Rate Disk (10−6 mm3/(N cycles)) |
|---|---|---|---|---|
| iron substrate | humid air | ~0.2 | 0.37 ± 0.06 | 0.95 |
| N2 atm | ~0.8 | 320 1 ± 40 | 900 | |
| iron substrate | humid air | ~0.2 | 0.039 ± 0.007 | 0.43 |
| N2 atm | ~0.1 | 0.32 ± 0.06 | 8.1 |
© 2019 by the authors. Licensee MDPI, Basel, Switzerland. This article is an open access article distributed under the terms and conditions of the Creative Commons Attribution (CC BY) license (http://creativecommons.org/licenses/by/4.0/).
Share and Cite
Fiaschi, G.; Rota, A.; Ballestrazzi, A.; Marchetto, D.; Vezzalini, E.; Valeri, S. A Chemical, Mechanical, and Tribological Analysis of DLC Coatings Deposited by Magnetron Sputtering. Lubricants 2019, 7, 38. https://doi.org/10.3390/lubricants7040038
Fiaschi G, Rota A, Ballestrazzi A, Marchetto D, Vezzalini E, Valeri S. A Chemical, Mechanical, and Tribological Analysis of DLC Coatings Deposited by Magnetron Sputtering. Lubricants. 2019; 7(4):38. https://doi.org/10.3390/lubricants7040038
Chicago/Turabian StyleFiaschi, Giulia, Alberto Rota, Antonio Ballestrazzi, Diego Marchetto, Enrico Vezzalini, and Sergio Valeri. 2019. "A Chemical, Mechanical, and Tribological Analysis of DLC Coatings Deposited by Magnetron Sputtering" Lubricants 7, no. 4: 38. https://doi.org/10.3390/lubricants7040038