Assessment of Energy–Population–Urbanization Nexus with Changing Energy Industry Scenario in India


1
Faculty of Environmental Earth Science, Hokkaido University, Sapporo, Hokkaido 060-0810, Japan
2
Graduate School of Environmental Science, Hokkaido University, Sapporo, Hokkaido 060-0810, Japan
3
Electrical and Instrumentation Engineering department, Sant Longowal Institute of Engineering and Technology, Longowal-148106, Punjab, India
*
Author to whom correspondence should be addressed.
Land 2019, 8(8), 124; https://doi.org/10.3390/land8080124
Submission received: 22 June 2019
/
Revised: 24 July 2019
/
Accepted: 10 August 2019
/
Published: 13 August 2019
Abstract
:The demand for energy has been growing worldwide, especially in India partly due to the rapid population growth and urbanization of the country. To meet the ever-increasing energy requirement while maintaining an ecological balance is a challenging task. However, the energy industry-induced effect on population and urbanization has not been addressed before. Therefore, this study investigates the linkages between energy, population, and urbanization. The study also aims to find the quantifiable indicators for the population growth and rate of urbanization due to the expanding energy industry. The integrated framework uses a multi-temporal Landsat data to analyze the urbanization pattern, a census data for changes in population growth, night time light (NTL) data as an indicator for economic development and energy production and consumption data for energy index. Multi-attribute model is used to calculate a unified metric, termed as the energy–population–urbanization (EPU) nexus index. The proposed approach is demonstrated in the National Thermal Power Corporation (NTPC) Dadri power plant located in Uttar Pradesh, India. Landsat and NTL data clearly shows the urbanization pattern, economic development, and electrification in the study area. A comparative analysis based on various multi-attribute decision model assessment techniques suggests that the average value of EPU nexus index is 0.529, which significantly large compared to other studies and require special attention by policymakers because large EPU index indicates stronger correlation among energy, population, and urbanization. The authors believe that it would help the policymakers in planning and development of future energy projects, policies, and long-term strategies as India is expanding its energy industry.
1. Introduction
With the boom in the industrial revolution particularly after World War II, people started migrating from small villages to the big cities for their better prospects. This migration led to the development of societies and the expansion of infrastructure for transportation, communication, electricity, etc. This scenario is particularly true in developing countries such as India. All of these developments are made feasible with one key requirement which is energy. Since ancient times, energy has long been associated with the development of a nation when man started using fire for heating and cooking. Energy availability and utilization promoted the growth and development of the energy industry in a nation [1]. The growth in the energy industry has not only encouraged economies to grow but at the same time has also caused environmental pollution and health hazards. In an attempt to meet the increasing demand for energy, humans have altered terrestrial as well as aquatic systems which led to major changes in global land cover, greenhouse gas emissions, and the land’s decreased capacity to sequester carbon in future. The management of energy is one of the most challenging tasks in the modern era.
In the recent past, the awareness about energy sustainability has attracted a lot of attention of researchers, bureaucrats, and politicians to rethink their priorities and to revise the energy policies in order to minimize greenhouse gas emissions, health hazards, and other vulnerabilities. The three major intertwined factors of human-caused global change are land use, energy use, and climate change [2]. These three constituent factors influence one another in a way or another. With the new government policies and energy plans for expansion of the energy industry including solar, wind, nuclear, thermal energy production units, it needs meticulous attention of policymakers before the actual implementation is achieved [3]. The new energy projects being implemented at a rapid pace in India, an investigation about the location of power generation unit, type of power plant, the power capacity of the unit and geography of surrounding areas need to be made carefully [4]. This motivates the researchers the need of studying the energy industry induced population growth and urbanization. Its influence is even more prominent because the human presence and activity usually magnify in the region where the energy industry is set up, which otherwise would have not seen that level of urbanization for the foreseeable future. The projected power scenario in India is investigated in [5].
To understand nexus between energy, population, and urbanization, we need to take a close look into various aspects of the energy industry and then to analyze and to set parameters influencing population and urbanization in the region. To the best of knowledge of authors, a study on nexus between energy, population, and urbanization which is of prime importance for the development of a nation as well as for framing policies and energy plans is first of its kind which has not been studied so far. A review and analysis of water, energy, and food nexus (WEFN) have been carried out in [6]. The study areas for the WEFN are Asia, Europe, Oceania, North Americas, South Americas, Middle East, and Africa and critically analyzed importance of nexus framework. Another study by Dale et al., in 2011 has been carried out on land use, climate change, and energy nexus [2]. This study investigates the land use, climate change, and energy influence each other through a complex processes and decision should be based on short-term and long-term implications. A water, energy, and food nexus in Tanzania has been studied in [7]. The authors examine the policies for climate change based on the nexus study. Dynamics of land-use and land-cover change in tropical regions has been studied in [8]. The change in land cover causes a change in surface albedo and hence resulting in climate change. The establishment of the energy industry in a region has a notable impact on the population as well as the urbanization [9]. These studies give an idea to develop a research framework to study come up with the new nexus framework i.e., energy–population–urbanization nexus (EPU). To explore the linkages of the energy industry with population and urbanization, census data for population changes and remote sensing data to perceive the urbanization/economic development trends have been collected.
We believe that there is no study related to EPU nexus. This paper explores how the focus and attention on energy industry can offer significant insights into the complex dynamic processes and the interactions among energy, population, and urbanization trends. It first comprehensively studies the various influences by considering all the possible combinations of energy, population, and urbanization domains and thereafter discusses the difficulties and benefits of investigating all three factors at once. The paper concludes by determining and discussing the research needs for energy industry related to the interconnections among energy, population, and urbanization. This would help decision makers to consider an integrated approach towards the changes in energy, population, and urbanization. This research will also help to know driving factors of urbanization due to energy industry which will further help in planning and development of future energy projects and policies.
2. Study Area
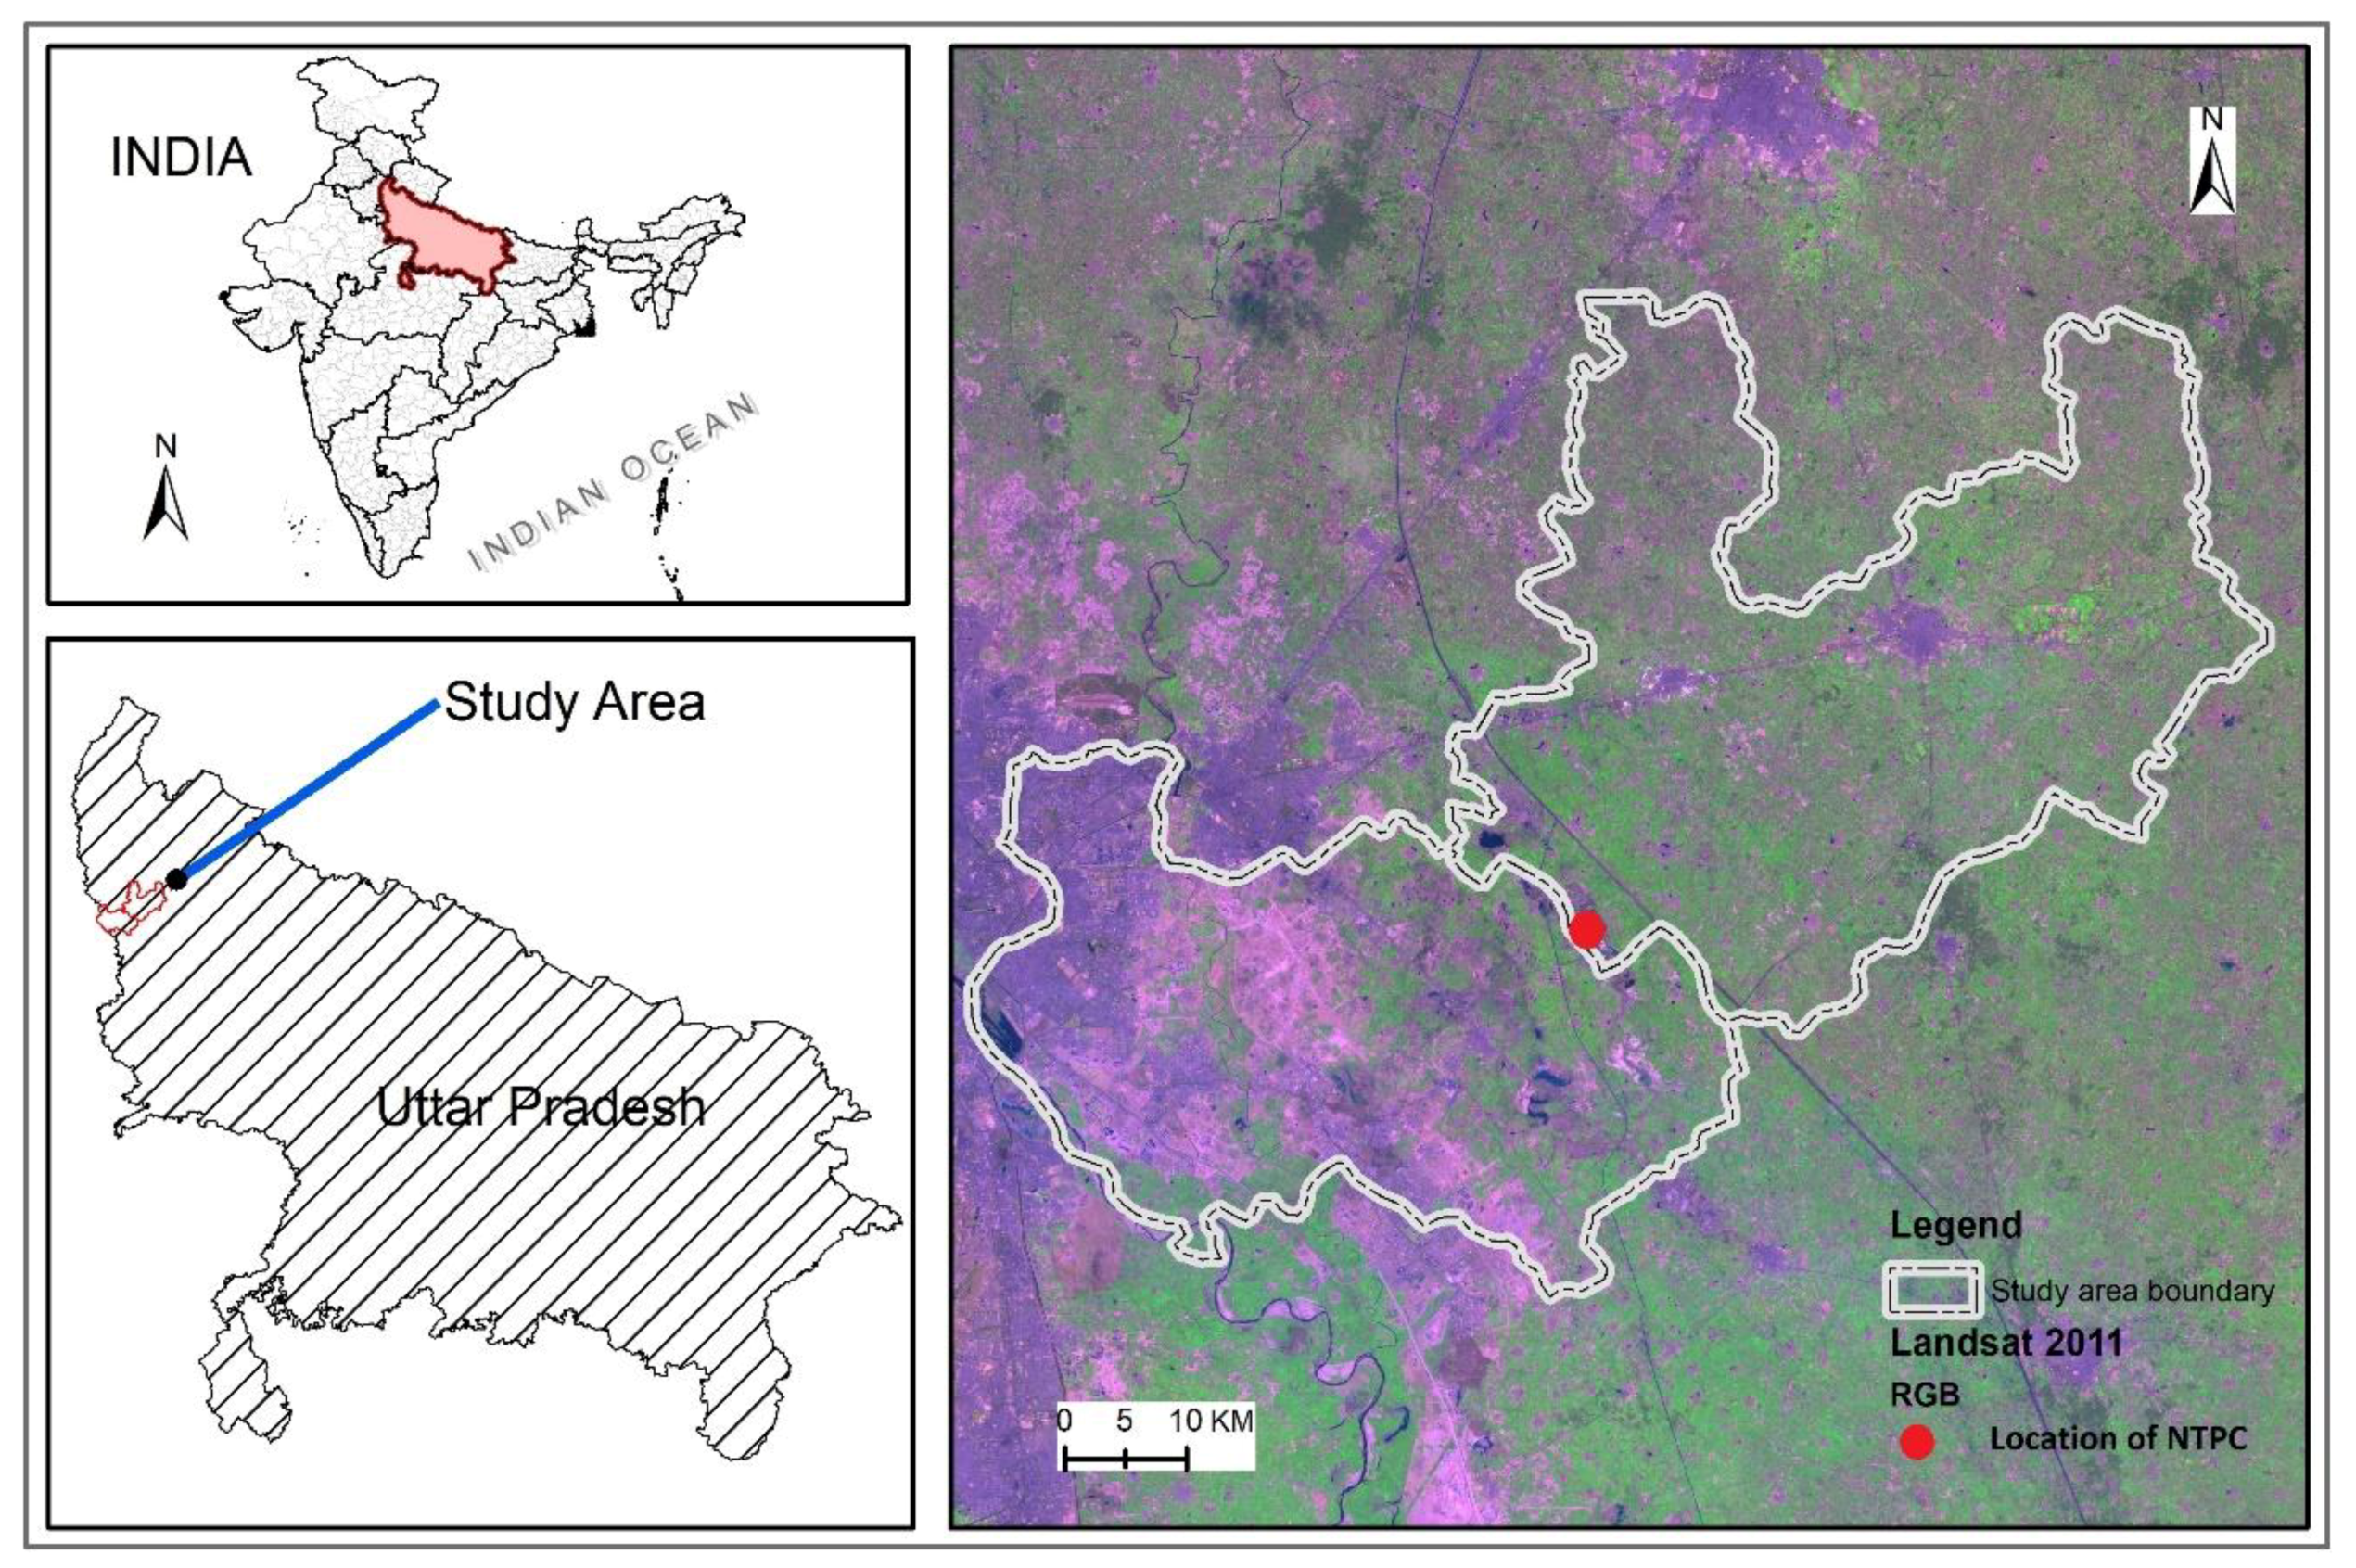
The study area for this research is NTPC Dadri, a combined cycle power plant in India. NTPC Dadri is a huge power plant which is operated by the public sector undertaking NTPC (National thermal power corporation Limited). The plant was commissioned in 1991 with an aim to fulfill the power demand of people of Delhi, the national capital of India and the surrounding areas. The plant is situated at Dadri town in Gautam Buddha Nagar district of Uttar Pradesh state in India with the latitude of 28.550°N and longitude of 77.553°E. NTPC Dadri is a coal-based thermal plant, gas-based thermal plant and a solar plant with capacity of 1820MW, 817MW, and 5MW respectively which amounts to a total capacity of 2642MW [10]. Figure 1 shows the location of the study area. Yellow marker shows the location of the NTPC Dadri thermal plant overlaid on Landsat data which is located in between Gautam Buddha Nagar and Hapur districts of Uttar Pradesh, India.
There are several reasons for choosing this particular power plant for the study. NTPC Dadri power plant is ranked as the sixth largest thermal power plant in India. The coal for this plant is sourced from Piparwar mines of Jharkhand, a state in eastern India which is as far as from the power plant. The gas is sourced from Gas Authority of India Limited (GAIL) Hazira–Bijapur–Jagdishpur. The water source is the Upper Ganga canal at the Bhimgoda Barrage at Haridwar in Uttarakhand state [11]. Due to the diverse geographic area covered for transportation, the power plant has made a substantial impact on the lifestyle of people and urbanization of various towns in different states of India. This is one of the foremost reasons for choosing this power plant as a study site.
The second reason for choosing NTPC Dadri as study site is that plant has undergone several expansions since its commissioning in 1991 and more expansion plans are expected because of the ever-growing demand for electricity in the region. The authors believe it worth to analyze energy–population–urbanization nexus for NTPC Dadri power plant so that based on the findings of the study, future policies, and long-term strategies for the expansion of the plant may be made judiciously.
The third reason for the choice of this particular study area is the high economic potential index of Gautam Buddha Nagar, the district which the power plant is located (Mark Roberts et. al. 2016). The economic potential index of a region is an integrated metric based on a multitude of key indicators that measure the extent to which that region possesses the ability to experience a high level of productivity. The high economic potential index of the Gautam Buddha Nagar district has accrued over several years after the establishment of NTPC Dadri power plant and the subsequent development in the region. This motivated the authors to investigate the nexus of energy, population, and urbanization domains in Dadri sub-district of Gautam Buddha Nagar.
3. Interaction among Energy, Population, and Urbanization
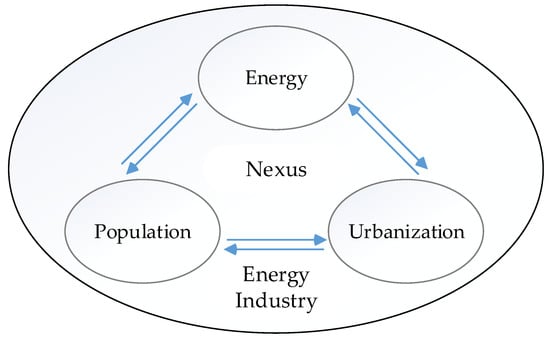
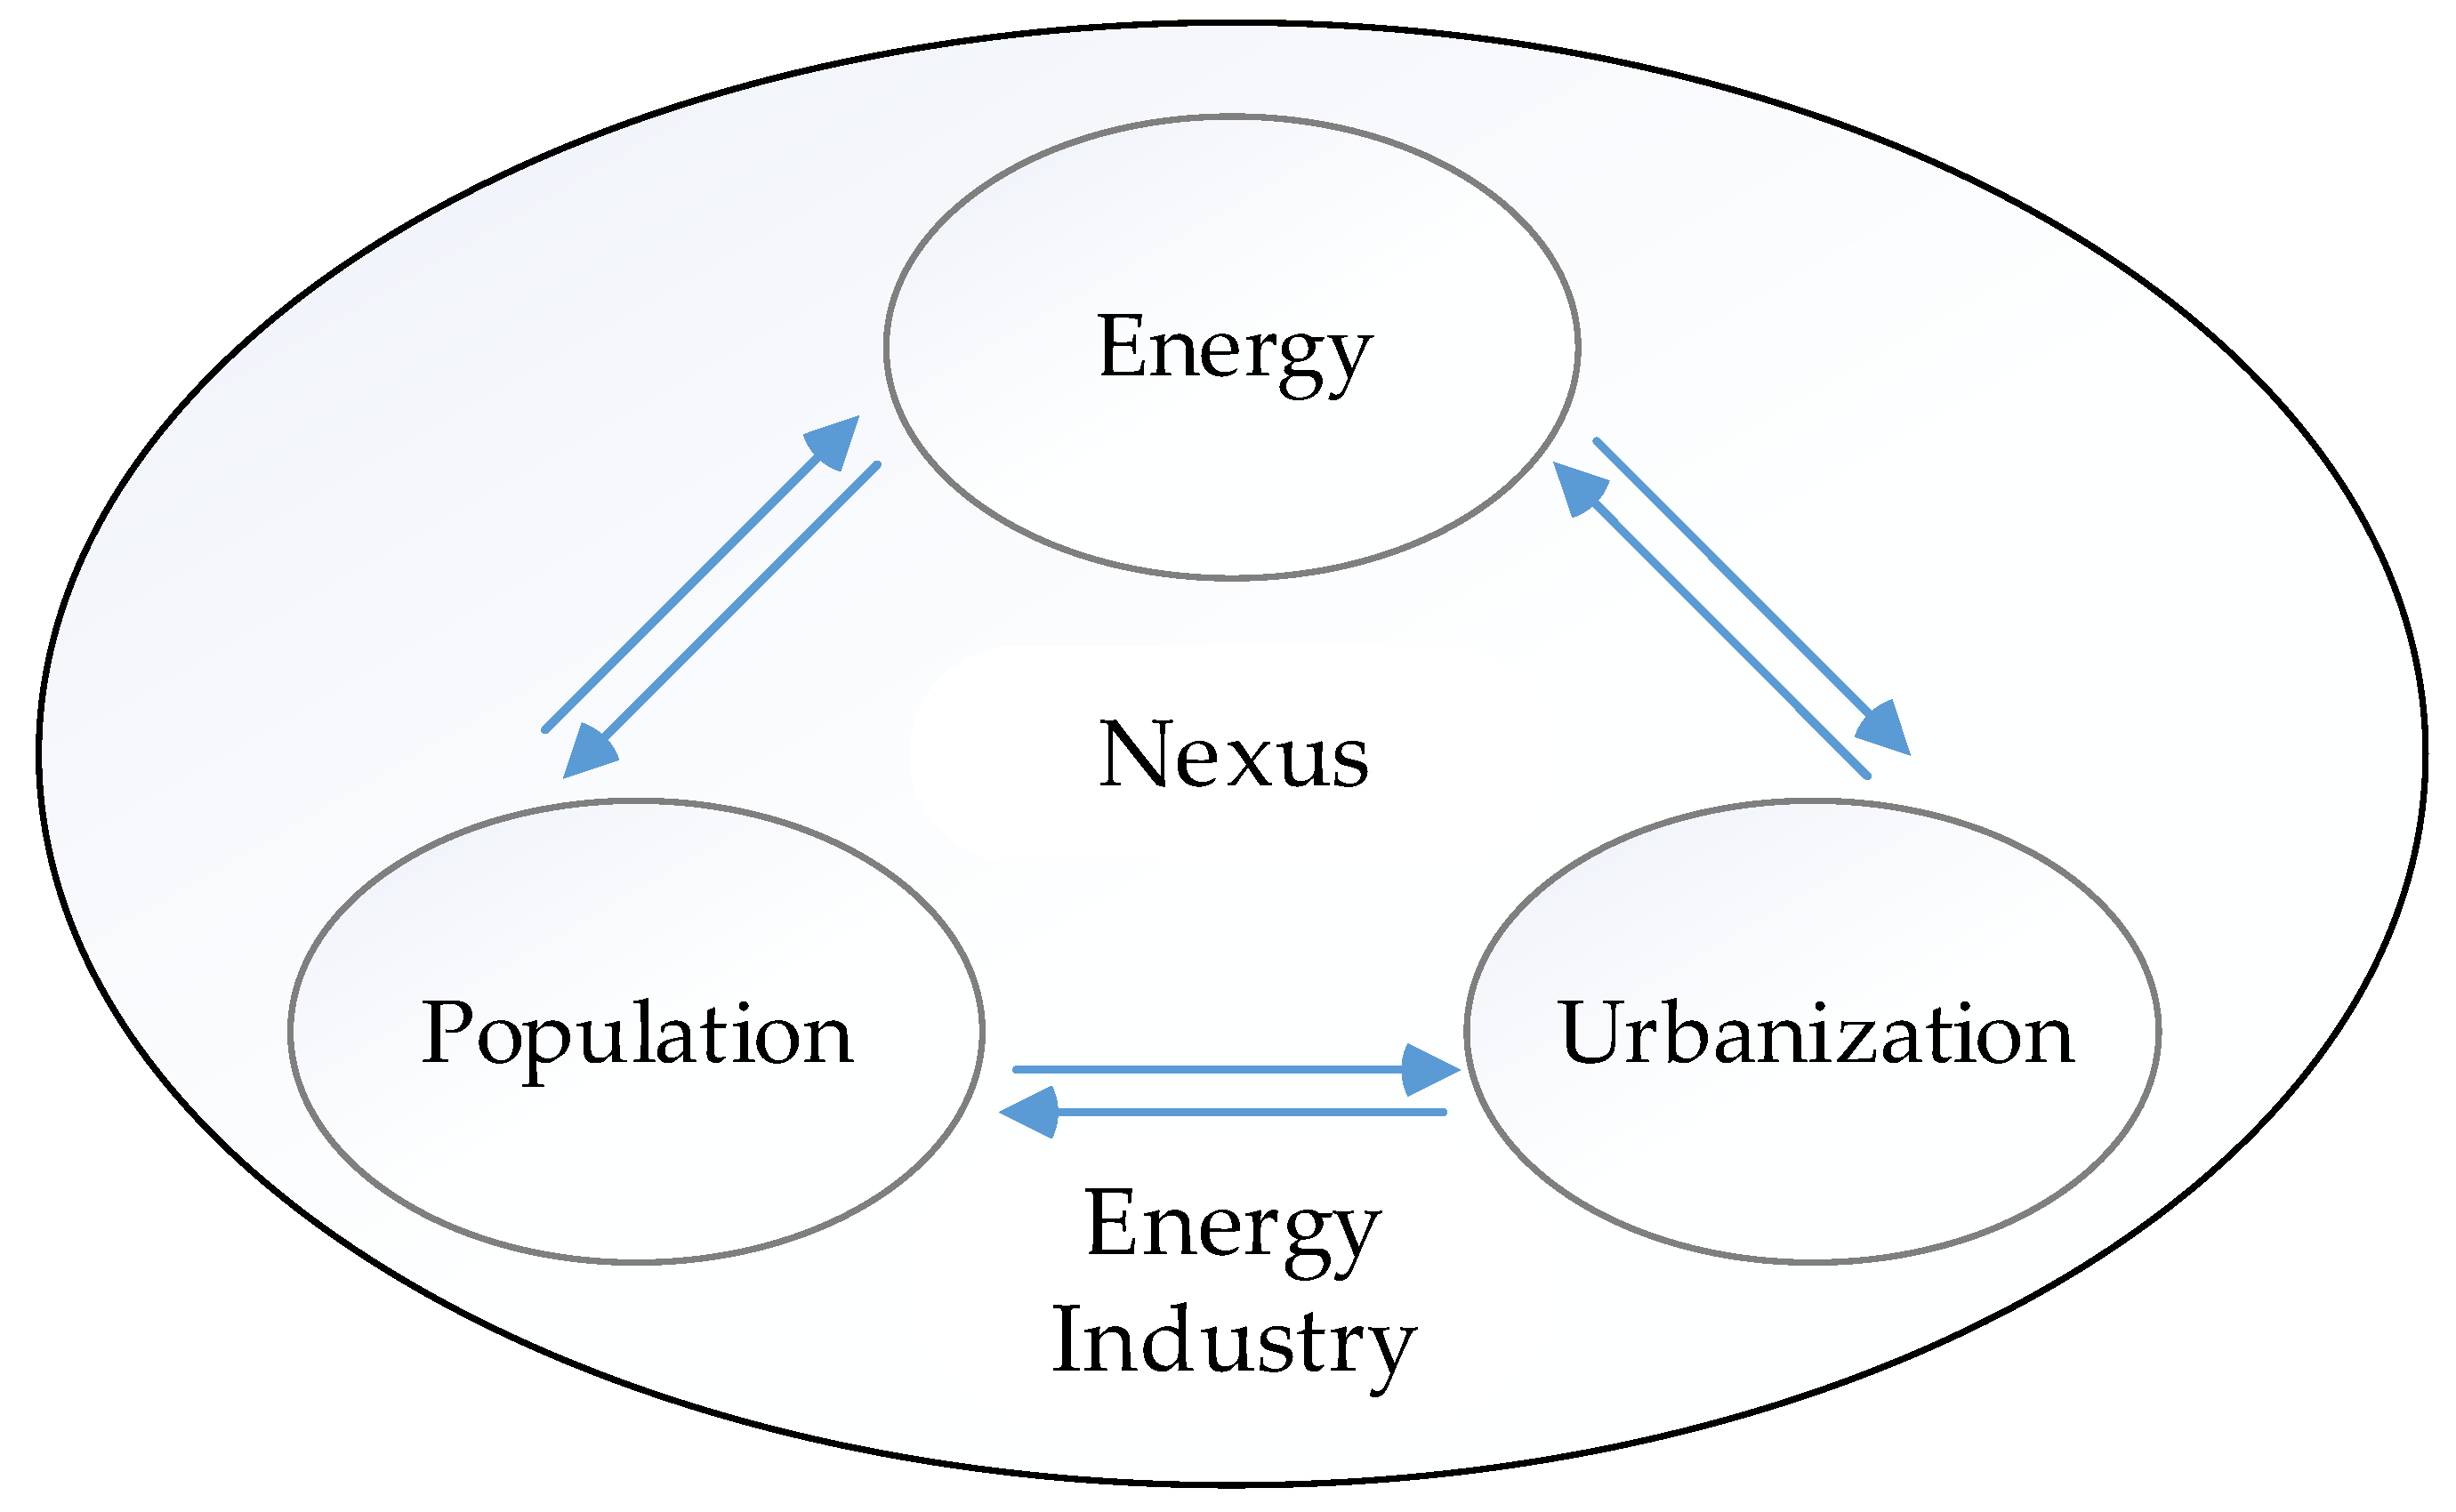
The term urbanization refers to the migration of people from rural areas to urban areas. The urbanization influences social and environmental changes providing more sustainable land use. In rural areas, the heat produced by energy units is consumed by evaporation of water from the leaves and the soil. In urban areas because of lack of vegetation and bare soil, heat is instead absorbed by skyscrapers and asphalt which lead to retention of heat, a phenomenon known as urban heat island. There are complementary impacts of the energy industry on the population [12]. First, people mainly move to regions near to energy industry because of employment and work-related reasons [13]. Apart from that, people move because of social reasons. Both the reasons lead to an increase in population in the vicinity of the energy industry. Figure 2 shows energy–population–urbanization nexus indicating the interconnection between energy, population, and urbanization. The interactions among energy, population, and urbanization which are influenced by several factors are discussed below.
3.1. Effects of Energy Industry Establishment on Population
Establishment of the energy industry has a significant influence on the population. People migrate to places where they have more employment opportunities, social networks, and living standards. It leads to the growth of population in the vicinity of the energy industry. At the same time, there are several reasons for the decline of the population as people tend to live away from areas from energy industry due to environmental pollution and its hazardous effect on health. Also, the higher cost of living near to the energy industry as compared to that in rural areas may also contribute to a reduction in population in the neighborhood of the energy industry [14].
3.2. Effects of Energy Industry Establishment on Urbanization
The establishment of the energy industry in a region makes growth in urbanization to meet the needs of people living near to energy industry. The establishment of energy-industry in a region results in economic growth, increased demand for quality education, the boom in road and transport infrastructure etc. This occurs due to the fact that in order to increase energy production, energy-industry not only uses the latest technology but also seeks educated manpower and quality lifestyle to attract experienced and skilled workers to work for the energy industry. After an energy-industry is commissioned in an area, urbanization is not one-time process rather it continues to grow for a longer period of time. This is because of the reason that the energy-industry expansion takes place in several phases [15].
3.3. Effects of the Population on Energy
With an increase in population, the consumption of energy also increases. The consumption of energy causes more demand of energy and that in turn causes the scarcity of energy resources. This leads to depletion of forests, coal mines, and oil reservoirs [16]. Both the population growth rate and its geographical distribution influence the demands for energy and the means to meet those demands. The total energy consumption in a locality is the multiplication of population and the energy consumption per capita. Given this multiplicative relationship, it is not a good idea to neglect any of the contributing factors because increase in each factor is amplified in proportion to the size and rate of growth of the other factors [17]. The increase in energy usage per person has a greater impact in a large population country than in a small population country and a greater impact in a growing population country than in a declining population country. If one wants to estimate quantitatively the contribution of population growth to the consumption of energy, it is necessary to proceed with some care because there is not a linear relationship between the two. Therefore, a rigorous analysis needs to be done to understand the influence of population on energy consumption [18].
3.4. Effects of the Population on Urbanization
Urbanization is influenced by many factors viz. population, literacy rate, infrastructure development, health system management, etc. An increase in population leads to the growth of urbanization. The requirement for community flats and residential apartments increases with increase in population. The urbanization has a positive correlation with the population. On a global scale, it is difficult to assess the effect of population on urbanization. However, in a local region, this effect can be well assessed using various indicators affecting the two domains separately as well as using indicators which have interconnected relationships with the two domains [19].
3.5. Effects of Urbanization on Energy
The requirement for energy increases with urbanization. This is due to the fact that urbanization causes the development of infrastructure for road transport, health systems, and an education system and all of this need energy. With urbanization, the appliances consuming energy are increased leading to more energy requirement. Urbanization causes industrialization and which needs energy, therefore, urbanization has a positive correlation with energy consumption [20].
3.6. Effects of Urbanization on Population
Urbanization brings more cost of living and that makes people have small families. On the contrary, urbanization, attracts more people from rural areas to have a positive impact on the population. While the world population is becoming two-folds, the urban population is becoming about three-folds which shows that the population has a positive correlation with urbanization. In the next few years, it is expected that nearly half of the total population will live in urban areas. In developing countries like India, the level of urban growth and its influence on population differs from that of in developed countries [21]. Therefore, there is not a straightforward relation of energy, population, and urbanization and it needs to be investigated based on some metrics. Some of the factors are so intertwining that the influence of one factor on the other is region specific and period specific. The effects of these factors have been investigated over a period of time so nullify the erroneous factors in the estimation of quantifiable parameters for such effects in different domains.
4. Methodology
In this paper, we propose a conceptual framework for the selection of indicators quantifying the changing energy, population, and urbanization scenario, an aggregation method to combine these indicators, and the algorithms with a comparative study for calculation of energy–population–urbanization nexus index. We formulate the problem in terms of a multi-attribute decision making assessment model. Multi-attribute decision making methods have a long history of their use in many disciplines of humanities and economics. These methods have recently been used for decision making in scientific studies including their use in sustainable energy planning [22]. The method deals with making the decision to choose an optimal alternative from a set of potential conflicting alternatives which are subjected to various attributes.
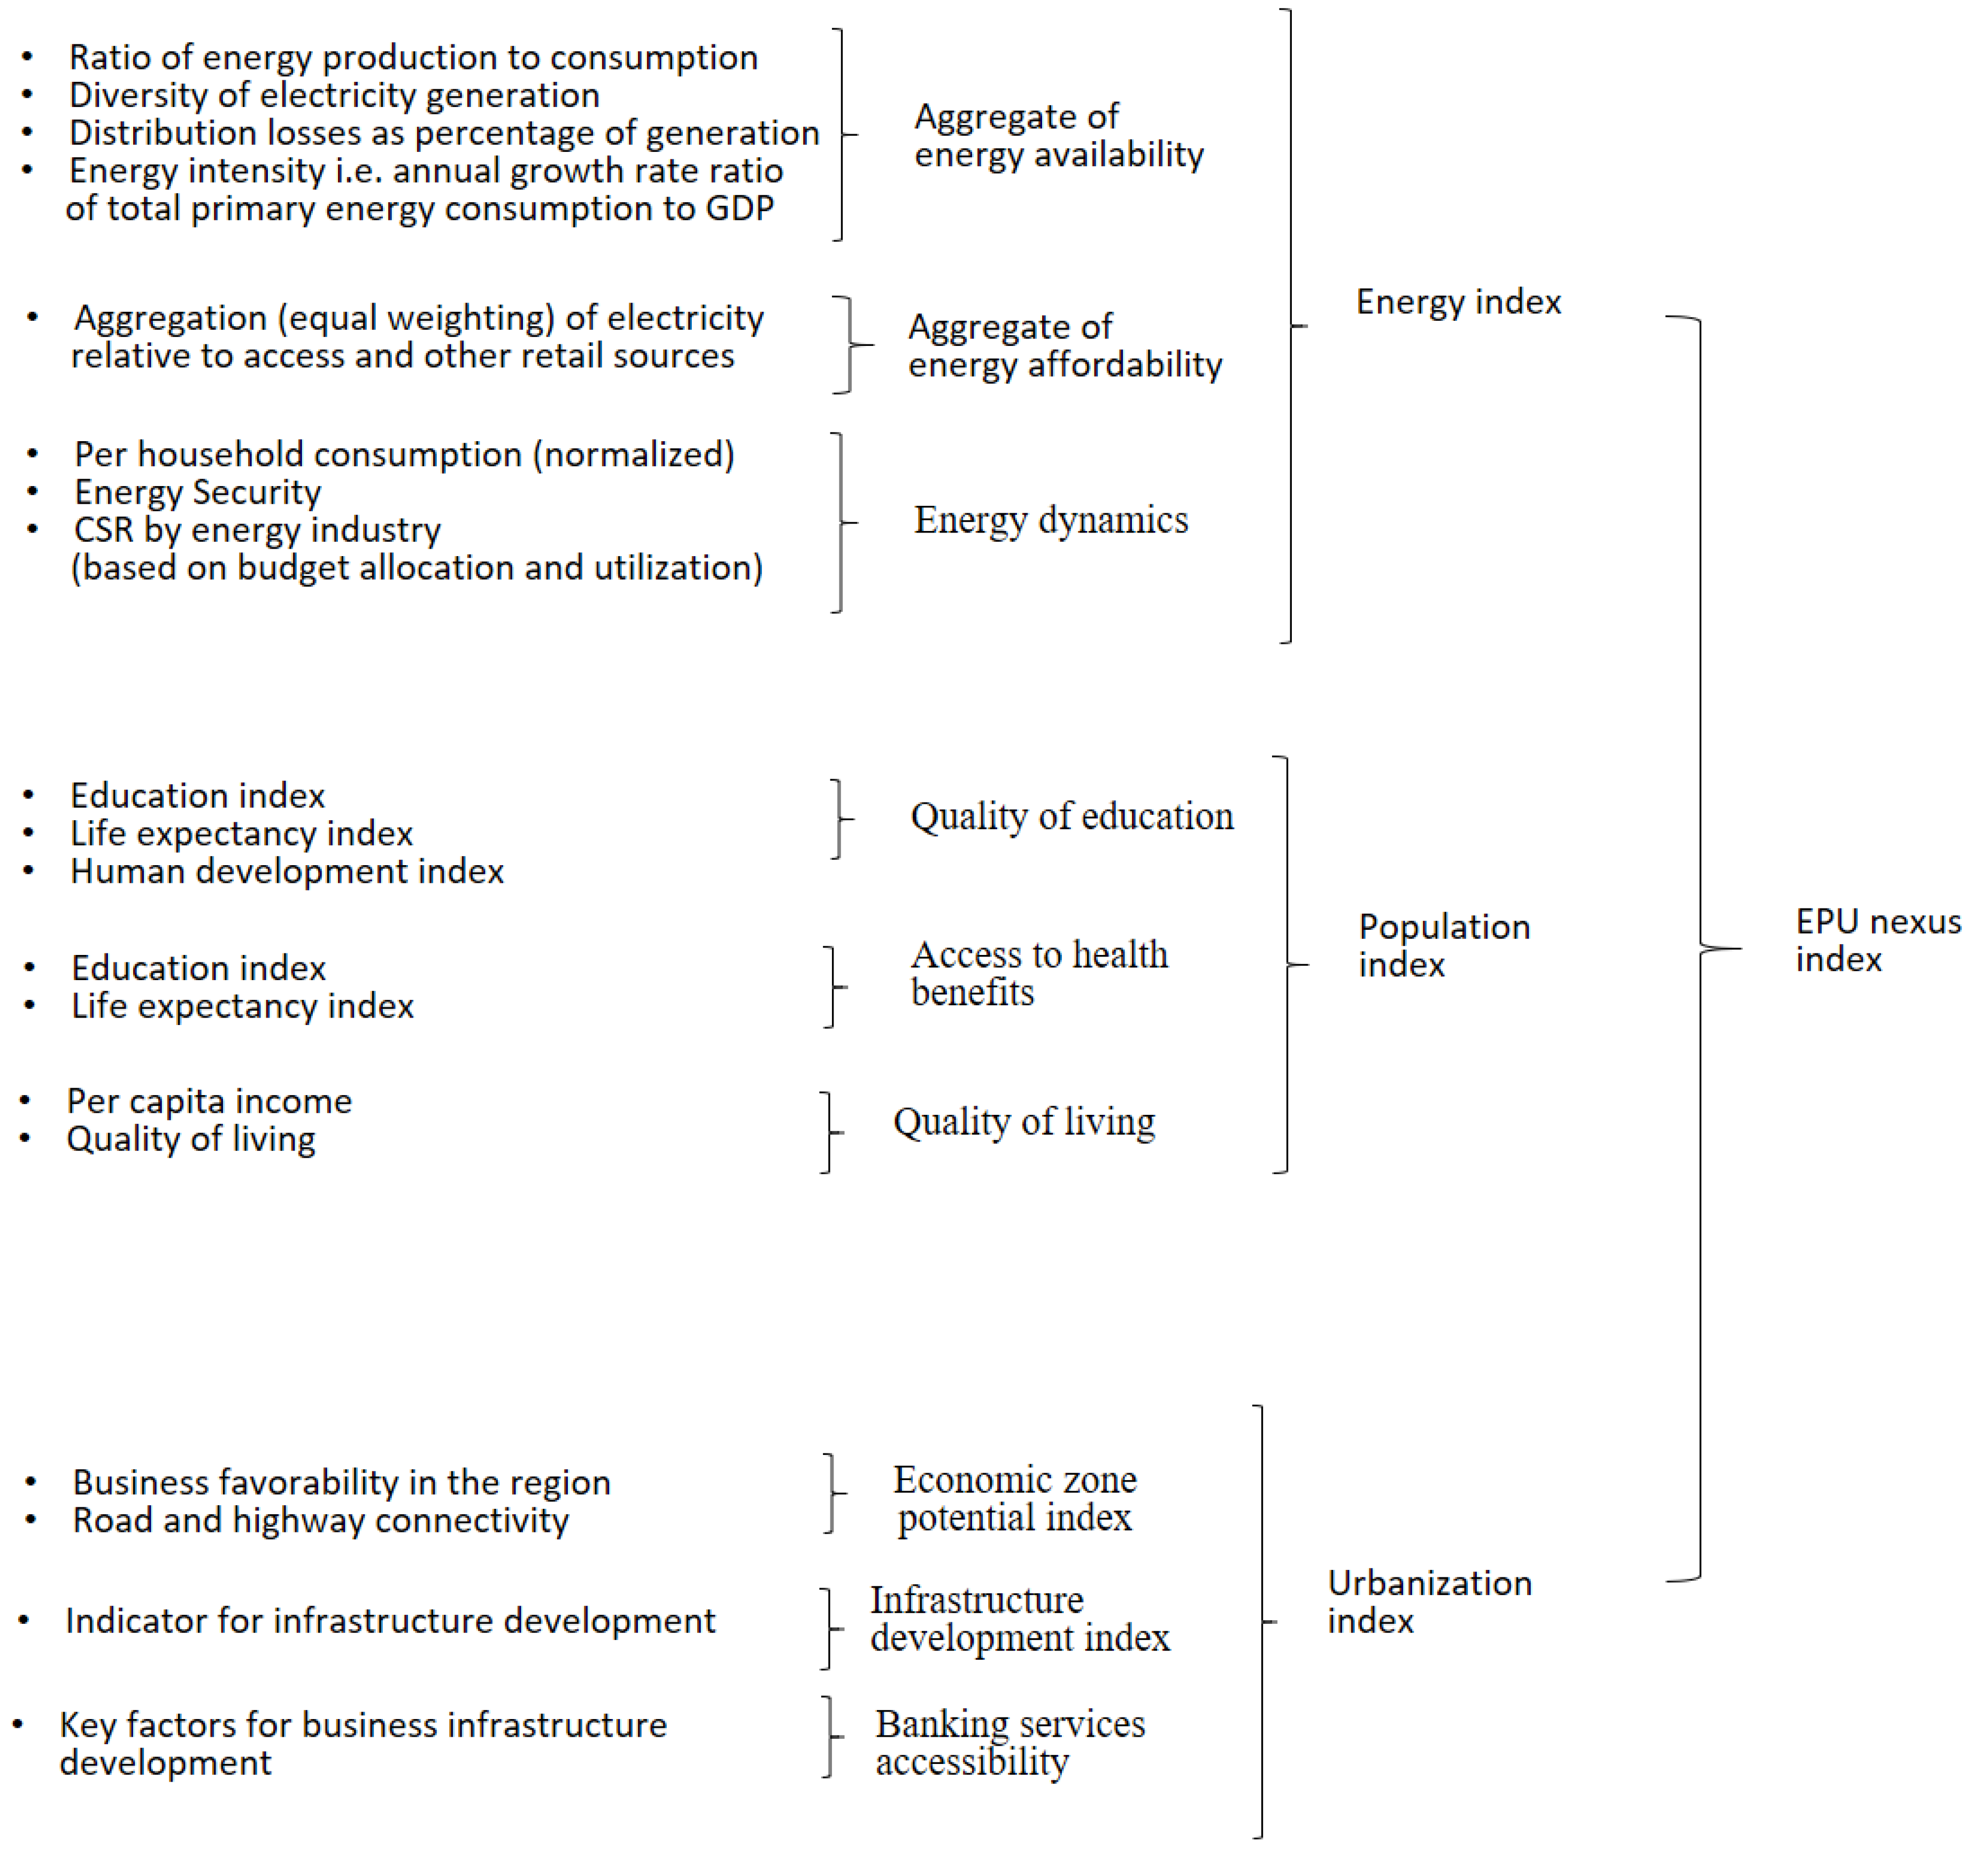
Several indicators quantifying the changes in energy, population, and urbanization are chosen to calculate a consolidated index. Figure 3 shows a hierarchical aggregation of various measurable indicators used in the calculation of the EPU nexus index. The aggregation of these indicators can be done using a number of methods. Simple additive weighting, weighted averages, analytical hierarchy process, fuzzy theory, and case-based reasoning are some of the multi-attribute decision-making methods among many others. The energy-population urbanization nexus for the present study is formulated as a multi-attribute decision-making problem. The problem is solved using a simple additive weighting method (SAW), weighted product method (WPM) and the Technique for Order of Preference by Similarity to Ideal Solution (TOPSIS). Each of the methods has been discussed below.
4.1. Simple Additive Weighting Method
Simple additive weighting method (SAW) is also known as weighted summing method, weighted linear combination method, and scoring method. The method is based on a simple addition of scores or performance indices of each criterion which are multiplied by respective weights [23]. The steps for a simple additive weighting method are outlined below.
- Step 1.
- Establish suitable criteria.
- Step 2.
- Find the score for each alternative of the criteria chosen in Step 1.
- Step 3.
- Construct a decision matrix based on the chosen criteria.
- Step 4.
- Normalize decision matrix.
- Step 5.
- Obtain the best alternative based on the values of the normalization matrix.
The advantage of SAW method is that it is computationally less expensive as compared to other multi-attribute decision making methods but at the same time it suffers from the drawback that if any of the criteria which need to be minimized in the multi-criterion problem must be converted into maximization criterion problem before applying the method [24].
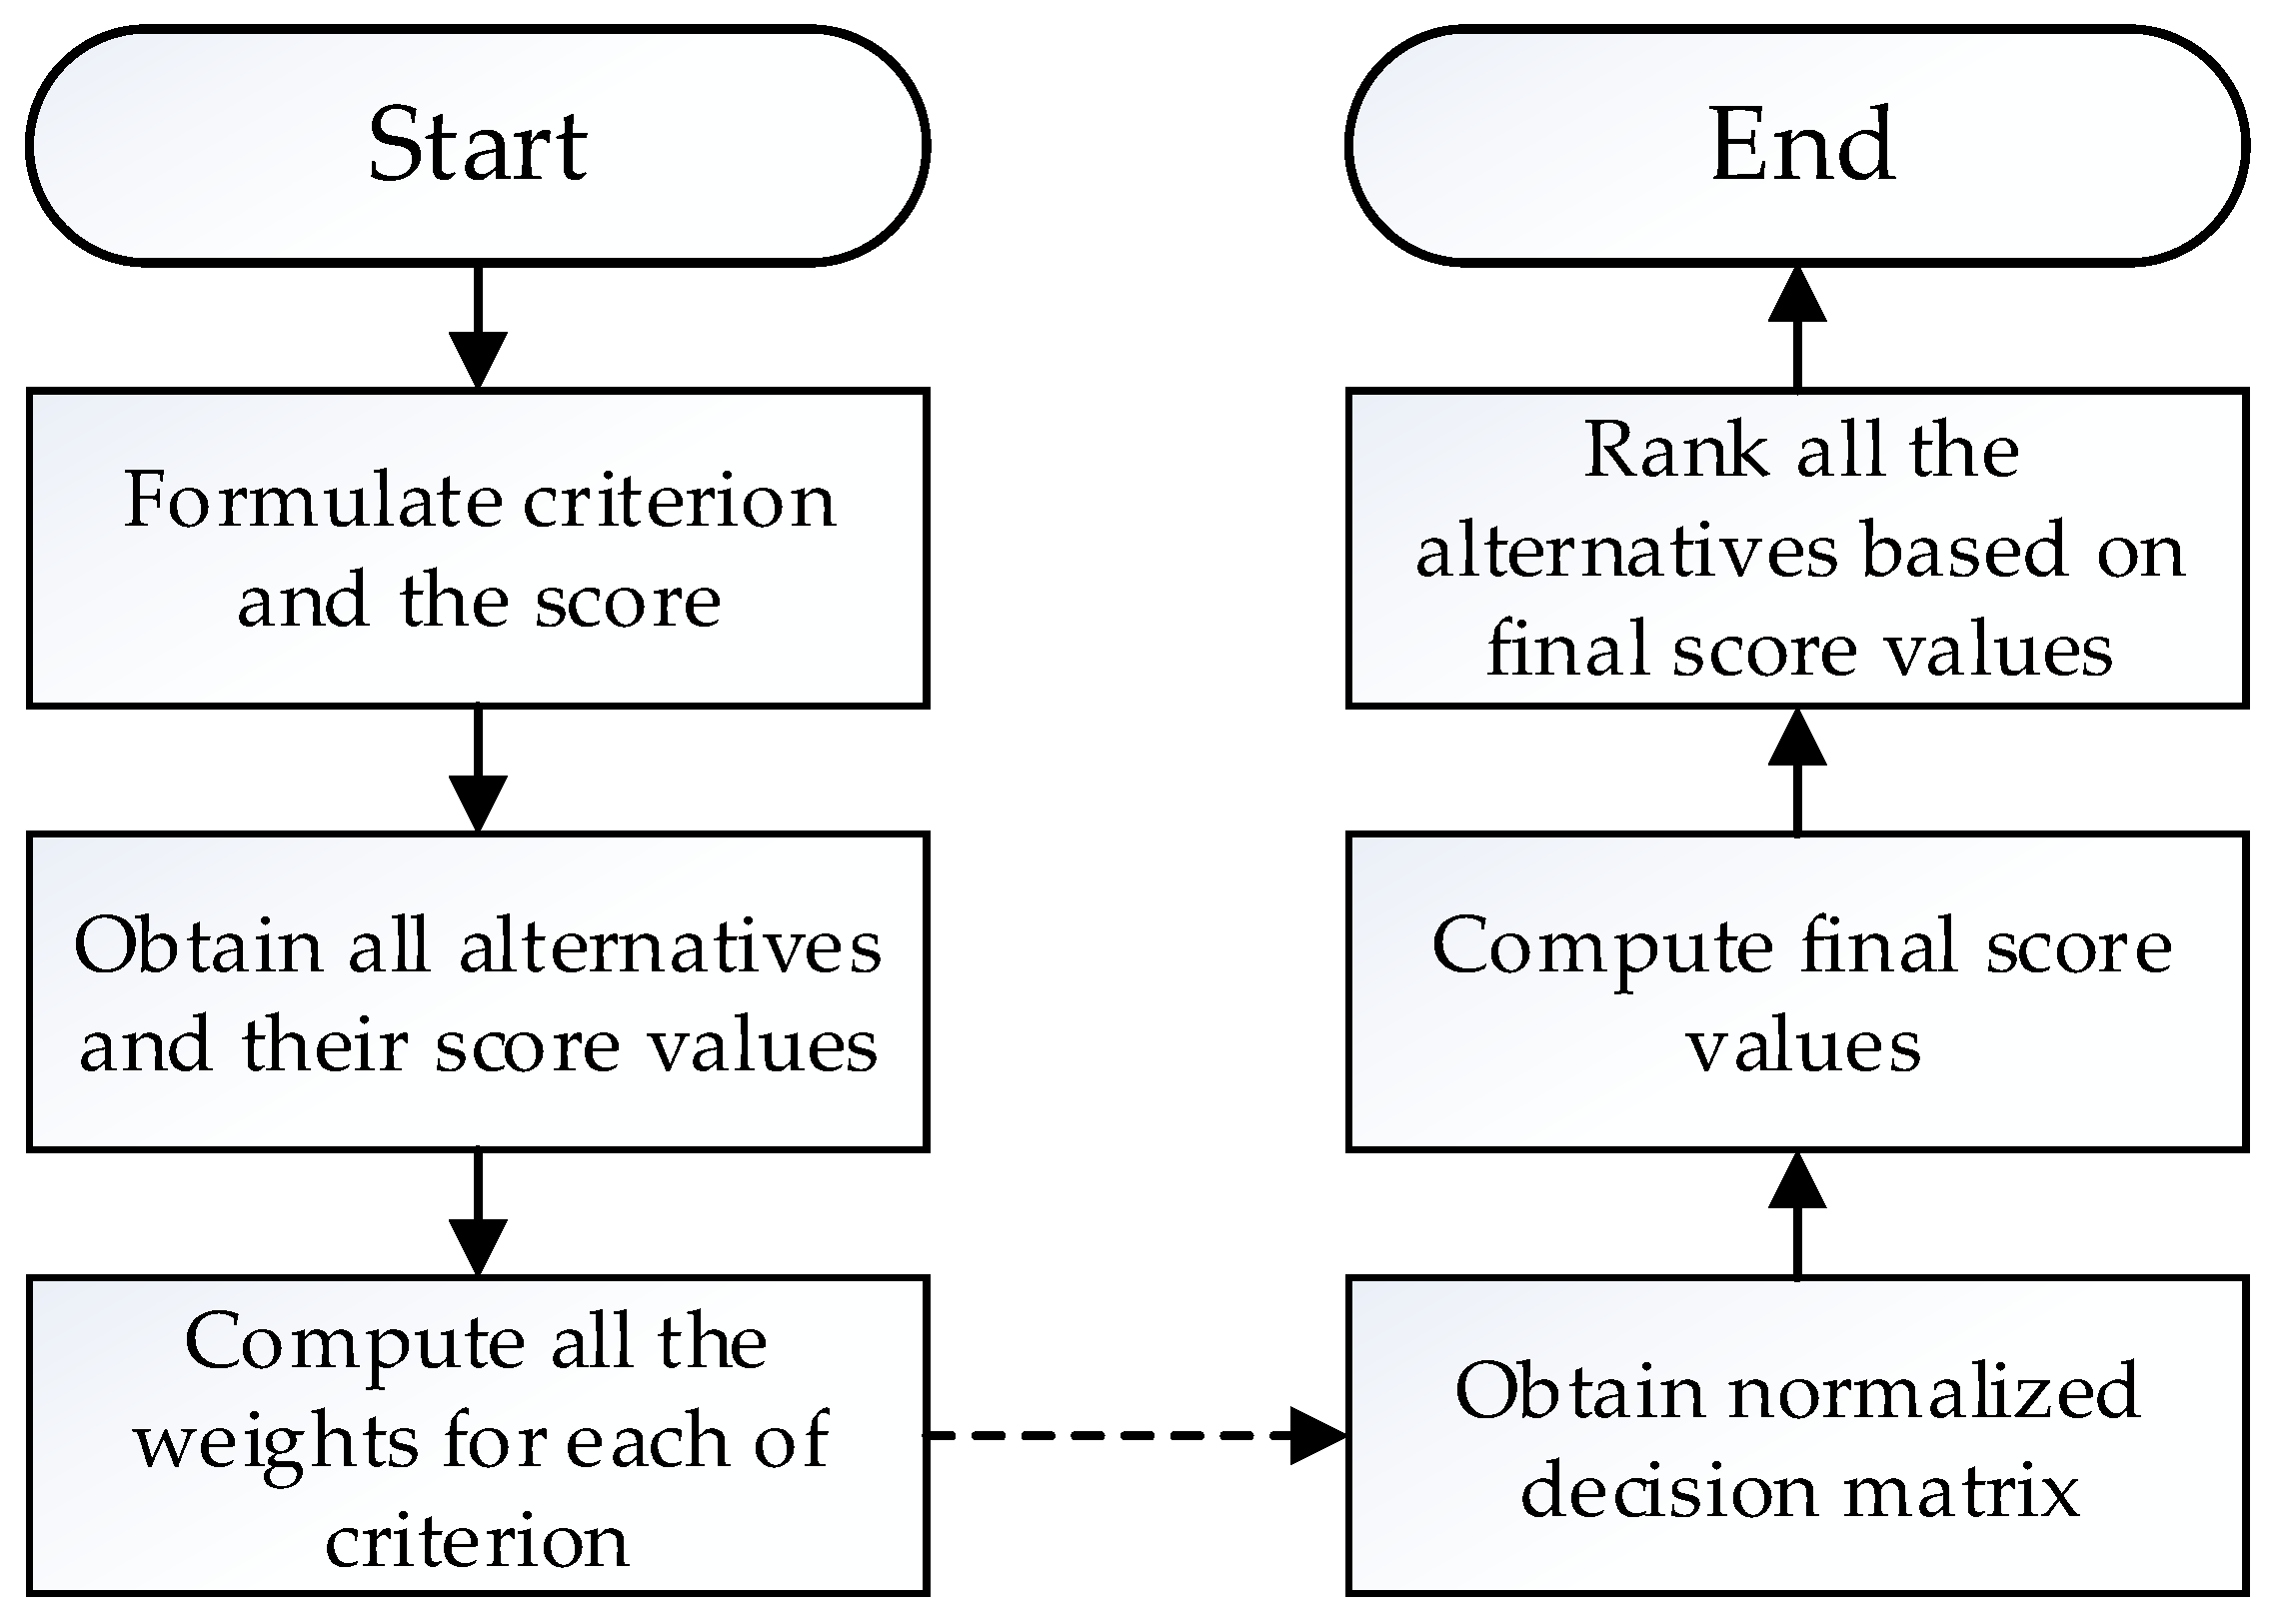
A flowchart for a simple additive weighting method is shown in Figure 4. The decision to choose an alternative is made on the basis of the maximum score value given in Equation (1).
where is score value for alternative. An alternative whose score value is largest is chosen as the best alternative.
4.2. Weighted Product Method
The weighted product method (WPM) is used for the decision-making process [25]. This method uses multiplication rule to connect all the attributes in which each attribute is exponent by its corresponding attribute weight. The decision matrix is normalized and then weighted using the weight vector. The weight selection can be done using an objective approach, subjective approach or a hybrid approach. The rank of an alternative is given by Equation (2).
where weight is given in such a way that . The best alternative is chosen whose score value is maximum in the score vector.
4.3. TOPSIS Method
The Technique for Order of Preference by Similarity to Ideal Solution (TOPSIS) is a multi-attribute decision-making method which calculates the geometric distance between the given alternatives and the optimal alternative [26]. The steps for the TOPSIS method are as follows.
- Step 1.
- Perform the ranking of alternatives according to Equation (3). The number of alternatives n and number of attributes m may be the same or different.
- Step 2.
- Construct weight normalized decision matrix as in Equation (4). Weight of each alternative is chosen using an objective approach or subjective approach.
- Step 3.
- Determine probable solution vector as in Equation (5).
- Step 4.
- Calculate distance to the solution of the best alternative and worst alternative as given in Equations (6) and (7) respectively.
- Step 5.
- Obtain rank for each alternative as in Equation (8) and put the ranks in descending order in order to choose the best alternative.
An alternative with the largest value is chosen as the solution. A comparison of the weighted product method and the Technique for Order Preference by Similarity to Ideal Solution (TOPSIS) method has been done in [26].
4.4. Remote Sensing Data
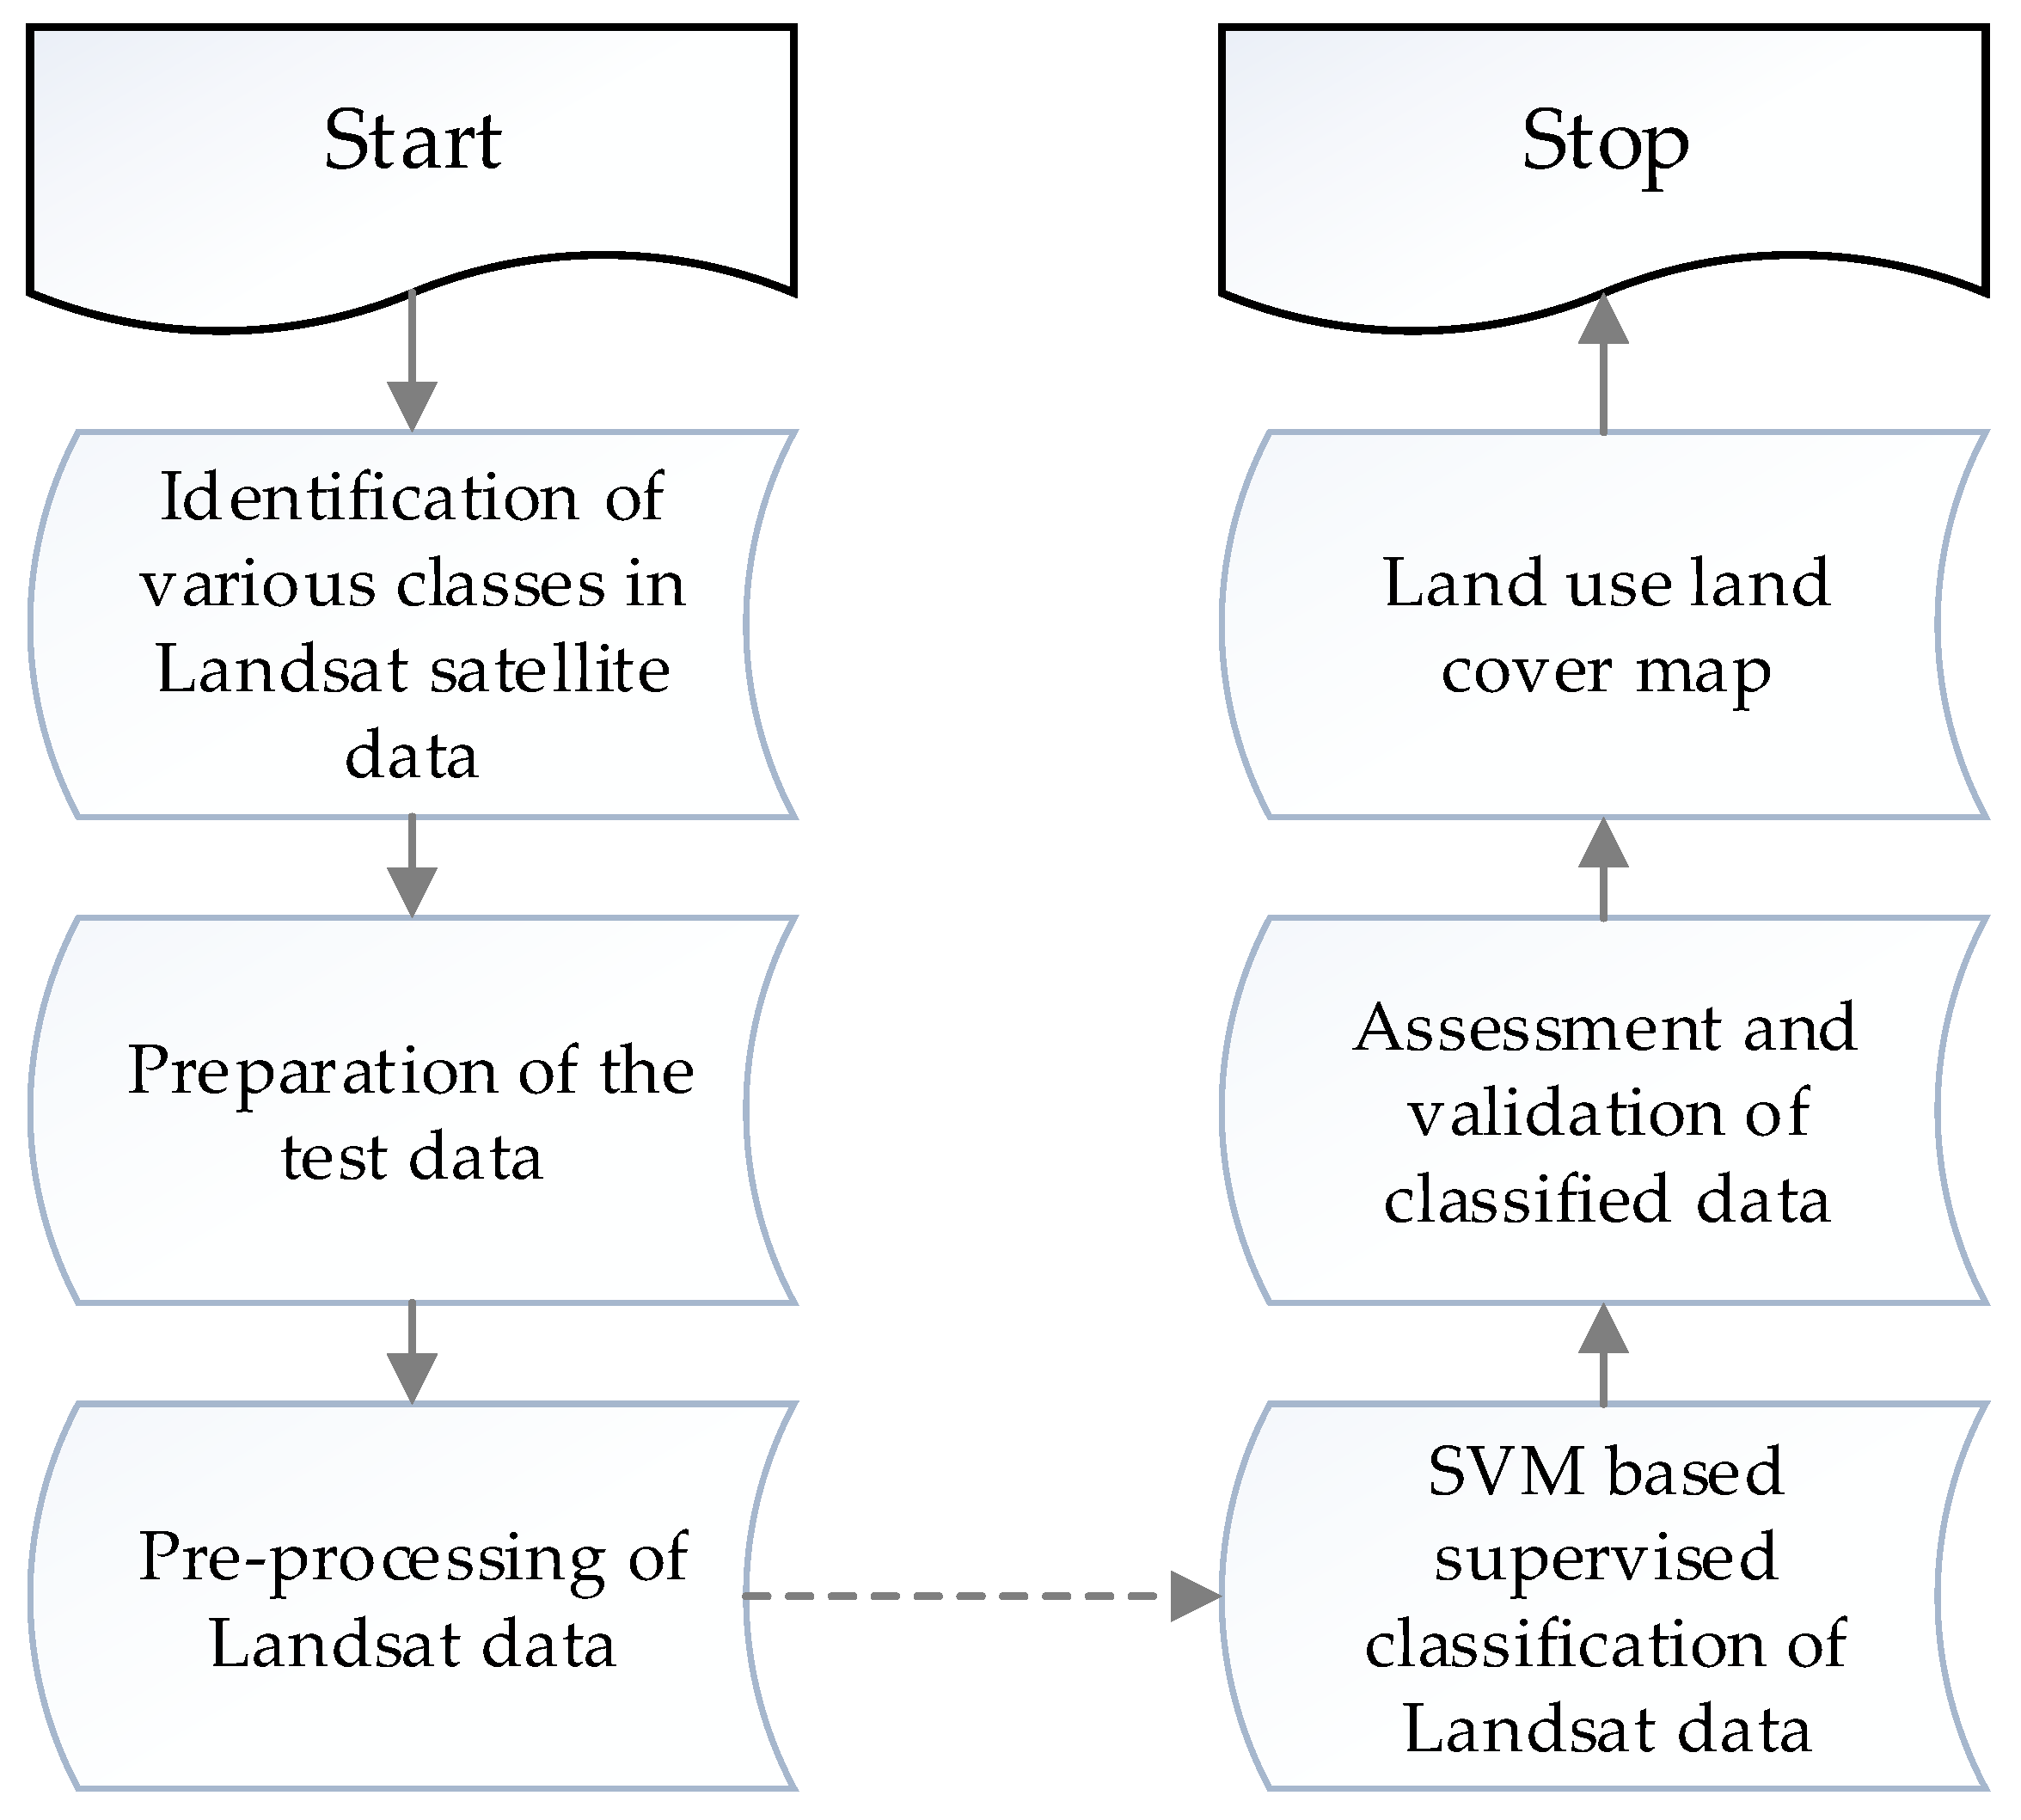
There are many sources for the remote sensing data with a varying resolution, geographical location and the sensors used for capturing the data. Among many others, USGS Earth Explorer [27] (https://earthexplorer.usgs.gov/) provides global satellite datasets such as Landsat, Advanced Very High Resolution Radiometer (AVHRR), Moderate Resolution Imaging Spectroradiometer (MODIS), Advanced Spaceborne Thermal Emission and Reflection Radiometer (ASTER), Shuttle Radar Topography Mission (SRTM), and Sentinel-2. The Copernicus Open Access Hub provides access to Sentinel-1, Sentinel-2, and Sentinel-3 data [28]. Out of these sources, in the study, Landsat satellite data for the study area has been used for the years 1989, 2000, and 2011 because of multi-temporal availability of Landsat archive data. Landsat data consists of various spectral bands, which shows the different spectral reflectance properties of various objects. The Landsat image used has a 30-m spatial resolution, 16-days temporal resolution and corrected at level 1T (the Standard Terrain Correction) [29,30,31]. The data were downloaded from earth explorer and processed using standard image processing techniques. The Landsat data processing techniques are shown in the flow chart (Figure 5).
There are various classification algorithms used for Landsat based Land Use Land Cover (LULC) classification viz. Support Vector Machines (SVM), Maximum Likelihood, Minimum Distance, Mahalanobis Distance, etc. [32] and [33]. Each of the classification methods suffers from their own advantages and disadvantages. Among these classification SVM is a non-parametric hard classifier [34]. The Support Vector Machines use a kernel function to nonlinearly project the training data in the input space into a high dimensional space where the classes are linearly separable [35] and [36]. SVM algorithm has been reported to give better classification results as compared to MLC [37]. The training samples have been used to classify Landsat data using SVM classification [38]. A flowchart for the classification using SVM is shown in Figure 5. We have conducted accuracy assessment of classified Landsat data of 2011 using a confusion matrix. The ground-based information and high resolution google earth images were used for accuracy assessment.
The National Oceanic and Atmospheric Association’s National Geophysical Data Center (NOAA-NGDC) has operated the Defense Meteorological Satellite Program (DMSP) for monitoring weather using the Operational Linescan System (OLS) to collect global cloud imagery. During the night time, the visible band is intensified using a photomultiplier tube (PMT) leads to detection of light emitted by human activities such as built-up area, fishing boats [39]. The DMSP-OLS sensor has a spatial resolution of 2.7 km with 1 day temporal resolution [40]. We have downloaded DMSP version 4 data for 1992, 2000 and 2011 from NOAA [41]. Multi-temporal DMSP data were further processed for the study area to see the temporal change in the night time light (NTL). This data has been used widely as a proxy for urbanization and economic development. NTL data has been widely used as an indicator for electricity consumptions in Australia etc. [42,43,44]. In this study we used LULC and NTL data as an indicator for the electrification, economic development and urbanization.
4.5. Census Data
The census data of Gautam Buddha Nagar, a district in Uttar Pradesh state of India and Dadri, a sub-district in Gautam Buddha Nagar district, obtained from Ministry of Statistics and Programme Implementation, Government of India, is given in Table 1. The census data is taken for 2001 and 2011 in the study. This is because of the reason that the census data is undertaken every 10 years by the Registrar General and Census Commissioner of India under the Ministry of Home Affairs, Government of India. The last census at the time of investigation of this study was held in 2011. According to 2001 census data, the population of Dadri town where the power plant is commissioned is 692,259. The population of Dadri town in 2011 grew up to 2,049,262 resulting in a change of 196% in 10 years.
Several indicators based on social, economic, and infrastructural changes are used to assist policy makers on future energy industry planning and framing new policies. The indicators that provide qualitative information are converted into measurable parameters. As the indicators are an amalgamation of various factors with varying units, these are normalized to unity before applying to the aggregation algorithm. Remote sensing data, census data, and energy-industry data are obtained from reliable sources to draw indicators and select those indicators which give measurable information for the calculation of the energy–population–urbanization index.
4.6. Selection of Indicators for EPU Nexus Index
The indicators selected for this study, reasons for the choice of such indicators, the significance of the indicator, and the sources of gathering these indicators are given in Table 2. The various indicators used for each of energy, population, and urbanization trends in the study area have been well understood and their influence on the respective domain is studied meticulously from the literature.
As for each of the indicators, the data has been gathered from a variety of sources. Normalization of indicators has been performed in order to make these indicators consistent. The aggregation of indicators is performed in some domains wherever the influence of aggregated indicator is better understood than that of constituent indicators. For example, human development index which is a measure of human development, combines indicators for three important human capabilities viz. health, education, and a decent standard of living. Health is characterized by life expectancy, education by literacy and school enrollment (the literacy and school enrollment indices are combined as education index), and standard of living by GDP per capita [52].
Each of the indicator values is weighted by weights which can be subjective, objective, or hybrid. The subjective weight approach is chosen in this study because each of the indicator weight is taken from the experts working in relevant departments for selection of indicator importance in the social and economic growth. After all the three indices, energy index, population index, and urbanization index are evaluated based on the indicators, the simple averaging technique is used to obtain energy–population–urbanization index. The normalization of the weights is done using Equation (9).
where is the normalized value of The SAW method which is also known as the weighted linear combination or the scoring method is simple and the most commonly used method for the multi-attribute decision-making model assessment. The method is based on a weighted average of attributes for each of the alternative in the model. An evaluation score is calculated for each alternative by multiplying the scaled value given to the alternative of a specific attribute with the weights of the attributes followed by the summing of the products for all the attributes. This sum is called the index and it can be used to evaluate each alternative. The composition is possible after the weights of the criteria are obtained, and the data are normalized. The composition gives us an index (EPU nexus index) and is calculated using SAW, WPM, and TOPSIS methods.
5. Results and Discussion
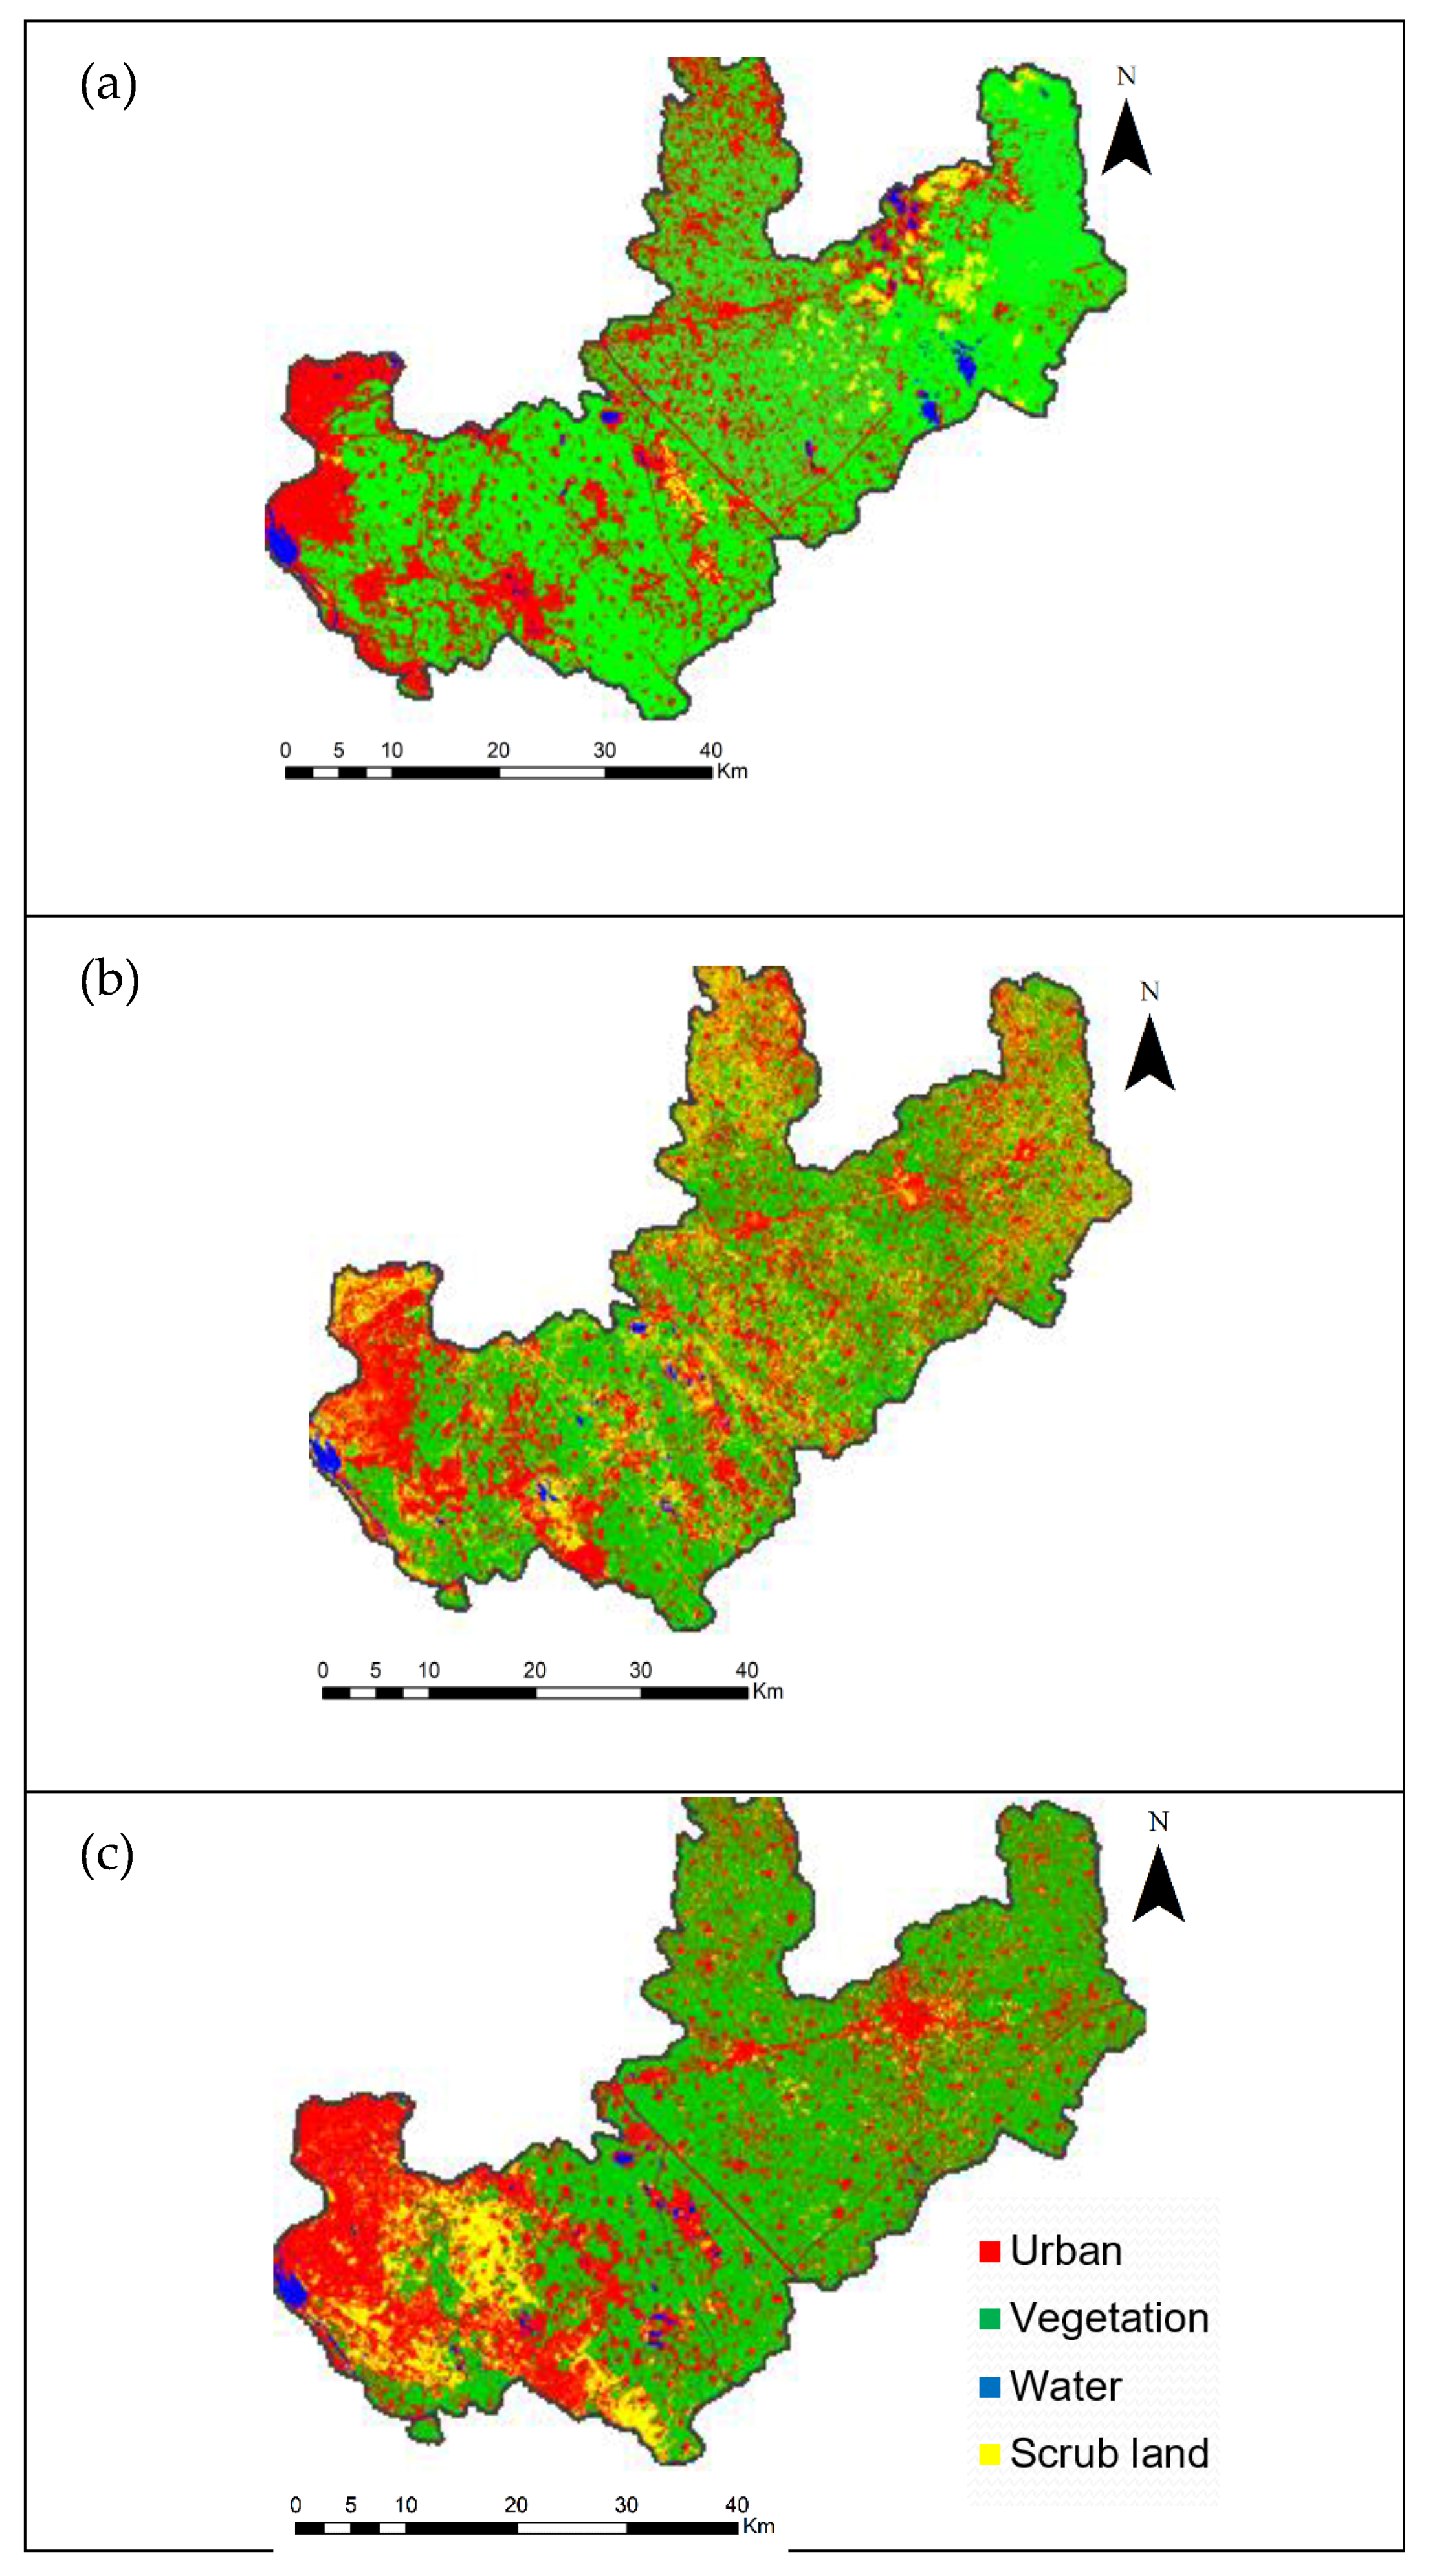
Figure 6a–c show Land Use Land Cover (LULC) maps with the spatial distribution of various classes for the year 1989, 2000 and 2011 respectively. The classes considered in the LULC maps are urban area, vegetation, water and scrubland because these are related to the energy–population–urbanization nexus index. The accuracy assessment result is shown in Table A1 in the Appendix A of LULC map of 2011. The overall accuracy of the LULC map is 85.7% and the Kappa coefficient is 0.804.
Table 3 gives the spatial distribution of various LULC classes and their temporal distribution. As observed from these distributions, the vegetation cover is dominant land cover type with an area of 865.5 km2 representing 60.7% of the total land cover in 1989. The urban area represents only 365.9 km2 in the same period. However, from 2000 to 2011, the urban area has sharply increased to reach to 584.8 km2, which represents 41.1% of the total area. The vegetation class decreased in the study area from 865.5 km2 in 1989 to 662.8 km2 in 2011. The water class shows minimum change in the study area. Figure 7 shows the LULC changes in the study area from 1989 to 2011. It clearly depicts that urban area has increased consistently in the study area over two decades. Scrubland class shows fluctuation means it has increased from 1989 to 2000 and then decreased from 2000 to 2011. The reason for increase in area of scrubland in 2000 is due to the presence of fallow land because of deposition of fly ash from the NTPC thermal power plant. The scrubland area has decreased from 344.1km2 to 158.8 km2 for a period of 2000 to 2011 because NTPC thermal power plant started utilizing and distributing the fly ash to surrounding area development such as fill material for road and rail embankment construction and is suitable for reclamation of both open cast and underground mines under the Corporate Social Responsibility (CSR) [53]. Ash is an excellent resource material for construction industry and its utilization helps to conserve natural resources like clay, limestone required for making cement and thus saving the environment. The advantages of utilization of fly ash is undertaken by the NTPC Dadri as CSR to the surrounding community in which ash is utilized to convert scrubland to vegetation land and also mixed with agricultural land on a 3–5 year cycle all free of cost. This has led to an increase in vegetation land despite an increase of urban land over the years [47].
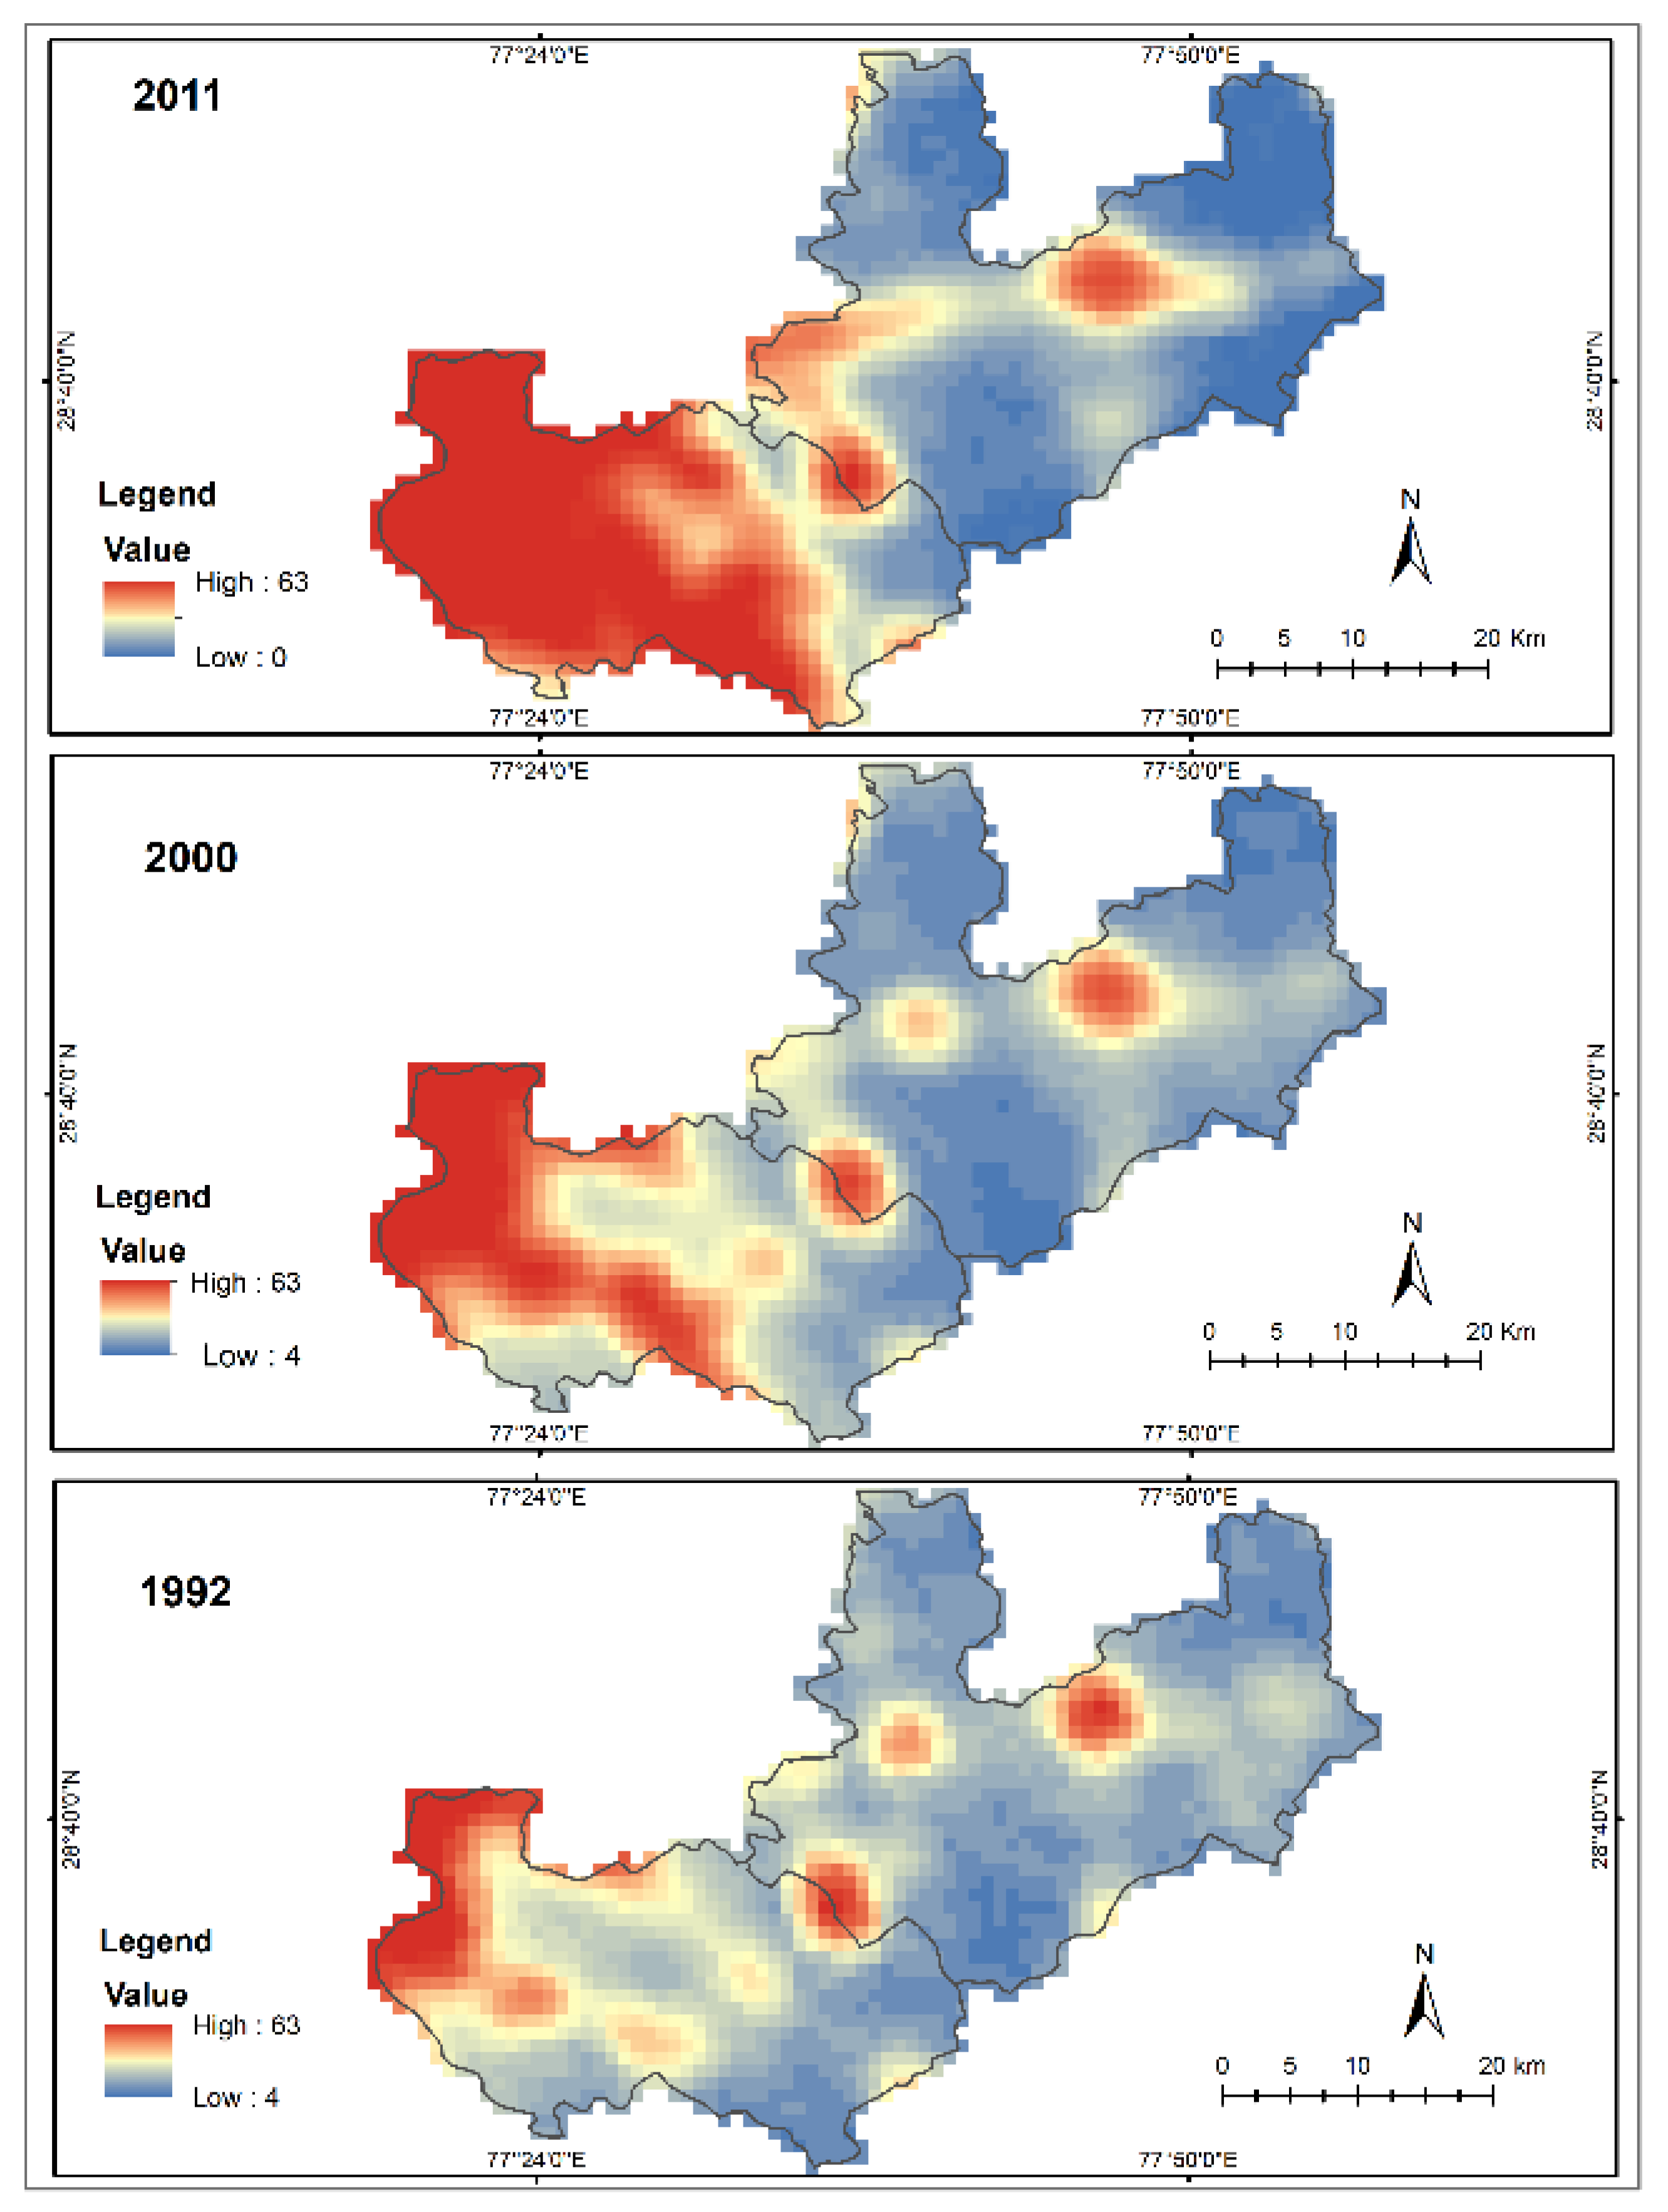
In this study we used yearly average data for the year 1992, 2000 and 2011. Night time light (NTL) intensity value varies from 0 to 63. Multi-temporal NTL data clearly shows an increasing trend in the NTL from 1992 to 2011 which is also evident from LULC maps (Figure 8). Western region of study area shows highest value of NTL as compared to other regions. This data can also be used as a proxy to see the urbanization and economic development in the study area as reported by previous studies [54,55,56]. Previous research confirms a strong relationship between nighttime light and economic development and Gross Domestic Product (GDP) [54,57]. Previous studies noticed the signal saturation in urban areas and overestimation of the actual size of lighting on the ground [58]. Figure 8 shows the rapid increase in the NTL from 2000 to 2011 as compared to NTL from 1992 to 2000. NTL also shows rapid urbanization in the study area.
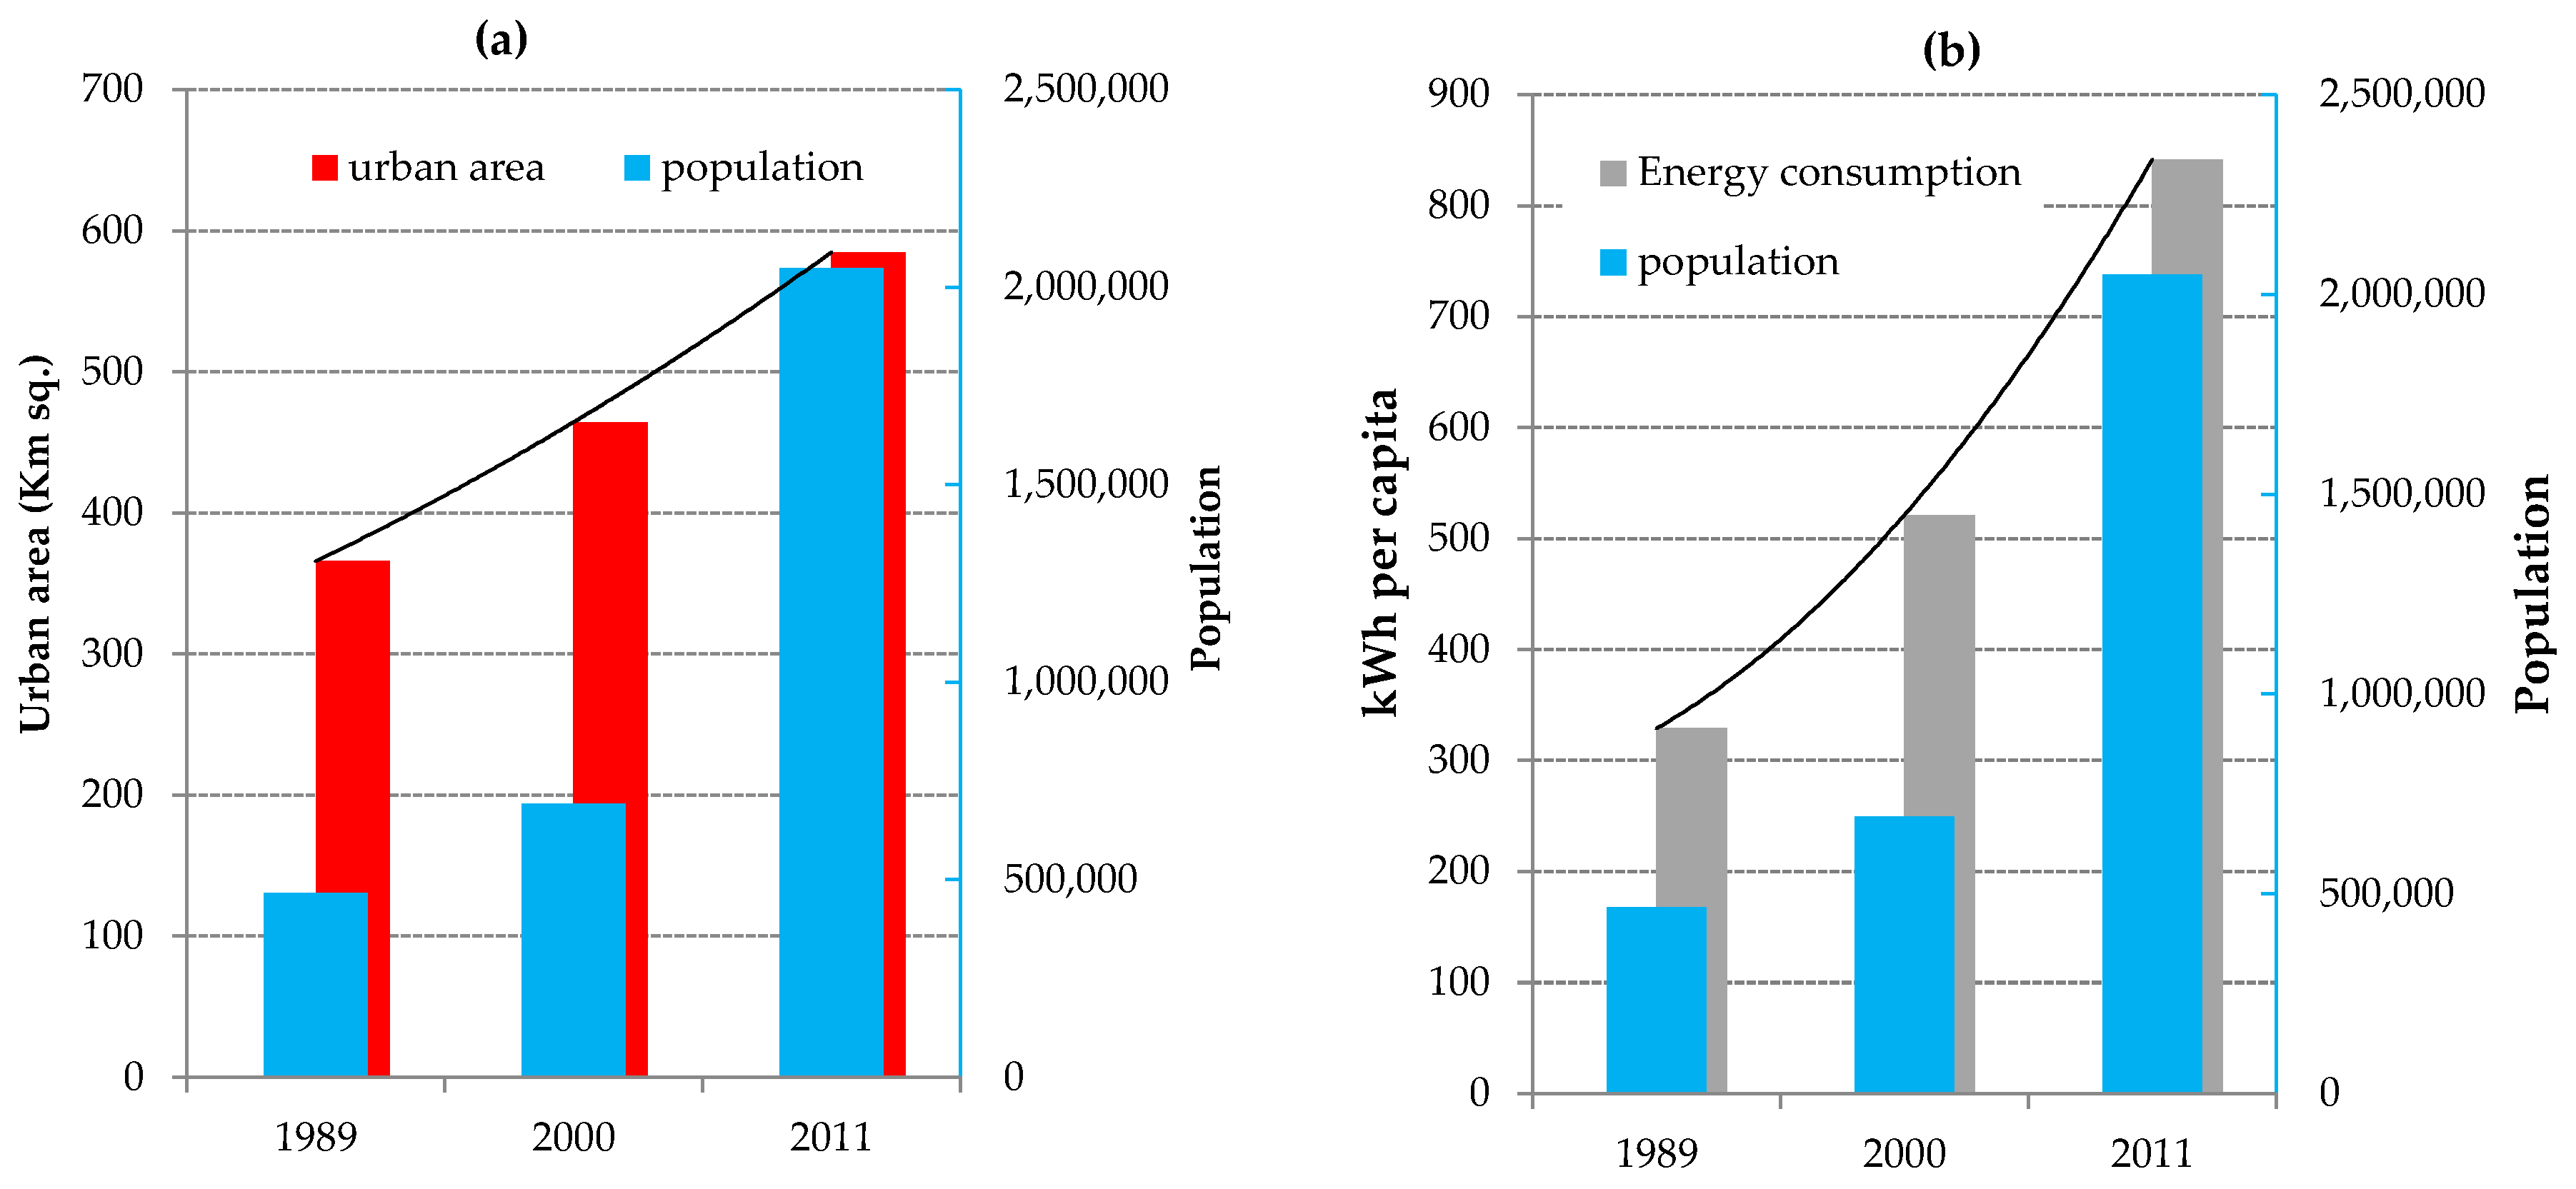
Figure 9a,b depict a comparison of urban area expansion and per capita energy consumption of Dadri region for the population increase over a period of time respectively. This illustration is done in order to understand how urban expansion and energy consumption is behaving in the same time period with the population growth. Although the parameters of energy consumption and urban expansion are of different units, but they are dependent on each other and feed each other. This figure shows exactly this relationship where both the curves follow similar growth pattern over a period of time. This enables us to strongly state that both urban expansion and energy consumption over same period of time and for same population growth are dependent and follow similar trend of growth. This further strengthens our EPU nexus approach and enables us dive deep in the relationship of the two for development of socio-economic situation of any given region. Dadri, where higher rates of urbanization would have not been seen for decades if the power plant is not established there. This shows influence of energy project induced urbanization in a given area.
The inferences drawn from the census data indicate that the study area has undergone a high population growth rate as well as high literacy rate. The employment opportunities are also significantly increased in the study area as demonstrated by data for increase in number of working professionals in the region. Although the neighborhood of Gautam Buddha Nagar district has a population decline, the study area of Dadri has shown an exceptionally high rate of population growth. This is because of the reason that people in the neighborhood migrated to Dadri region as more employment opportunities were created with the establishment of NTPC Dadri power plant.
In this study, Simple Additive Weighting (SAW), Weighted Product Method (WPM), and The Technique for Order of Preference by Similarity to Ideal Solution (TOPSIS) methods have been used for calculation of the energy–population–urbanization index (EPU nexus index). The calculated index values from these three methods are 0.5267, 0.5280, and 0.5339 respectively. The arithmetic mean (average), mode, and median are three valid measures for inferring the central tendency of the index values obtained using three different techniques (SAW, WPM, and TOPSIS). Among mean, mode, and median measures, some measures are more appropriate to use than others. We chose to quantify the strength of energy–population–urbanization nexus by calculating the average of the index values obtained using SAW, WPM, and TOPSIS techniques. This choice was made because of low range (difference of highest value and least value) and low standard deviation of three index values. The range and standard deviation values are 0.0072 and 0.0038 respectively. It shows a significant consistency of index values calculated using three different multi-attribute decision making models. The average EPU-index calculated from EPU-index values from SAW, WPM, and TOPSIS comes out to be 0.529 representing the linking between three domains viz. energy, population, and urbanization. The significance of average EPU index obtained in the study area can be acknowledged to understand the interactions among energy, population, and urbanization only if EPU indices for other regions are available. Unfortunately, global EPU nexus index is not available because such type of nexus has never been studied and mentioned in the literature before. The authors resort to use indices available in other fields such as water–energy–food (WEF) nexus and land use-climate change-energy nexus. For example, consider the Ganges–Brahmaputra–Meghna basin in India, the third largest water abundant region in the world and Po river basin, the longest river in Italy. The water security index is relatively low in Ganges–Brahmaputra–Meghna basin with an average value of 0.36 compared to the global average of 0.44. The water security index of Po basin is relatively higher with an average value of 0.48 as compared to global average of 0.44. The index values in both the cases have been calculated in [60] taking various physical, social and economic indicators and using simple average weighting method. Similarly, energy security in GBM region is 0.21 which is extremely low compared to the global average of 0.35 and average of European basin is 0.35. The aggregate WEF security index average is again lower coming to a value of 0.40 compared to global average of 0.45 and lower than that of Po Basin which is 0.55. These values indicate how the lower indices demonstrate a lack of security of the considered nexus in that region. For our case, the EPU nexus, the index value is 0.529 which is the average of index values obtained from three different multi-attribute decision making models, hence nullifying the effect of any outliers. Hence, the EPU-index value truly represents the interconnection of energy, population, and urbanization. To interpret the obtained EPU-index, there are three possible alternatives. First alternative is to apply a hard-limiting threshold to the index value and to categorize the interconnection among energy, population, and urbanization as binary. According to this alternative, EPU-index of less than 0.5 is mapped as 0, representing no linkage among three domains and EPU-index of equal to or greater than 0.5 is mapped as 1, representing a dependence of three domains among each other. Second alternative is to consider the normalized EPU-index on a linear scale and categorize it into discrete set of levels. According to this alternative, EPU-index in 0–0.25 range represents a statistically weak dependence, 0.25–0.5 as moderate, 0.5–0.75 as strong, and 0.75–1.0 representing a phenomenal linkage among the three domains. Third alternative is to consider the EPU-index on a nonlinear scale and to represent the strength of nexus depending on its place on that scale. After an exhaustive statistical study of nexus in other domains, this was settled to choose the third alternative for normalized EPU-index (from 0 to 1). Putting a hard-limiting threshold as in first alternative would not solve the actual purpose of this study because that would only tell whether or not the three domains are linked and would not measure the strength of bonding among three domains, hence refraining us from choosing the first alternative. As for the second alternative, because the energy, population, and urbanization are not linearly dependent, hence choosing the second alternative would not a good choice for this nexus. Therefore, third alternative fits best in this case and is an optimum choice for energy, population, and urbanization nexus. An index value of 0.529 for EPU-nexus on this nonlinear scale represents a high level of interaction between various indicators and elements of socio-economic structure considered in the given region. This translates to high security for EPU nexus but also represents us with a situation in which bad performance of one sector is considered the limiting factor of the overall security. In other words, if one aspect of the nexus is not performing at an optimum level, its adverse effects may get highly visible in other sector and affect other sectors performance due to high interaction and interdependence of these indicators on each other. Based on the above discussion, it can be put forward that indicator-based assessment of energy–population–urbanization nexus is more efficient than going through piles of statistical data.
6. Conclusions
In this study, we have used a multi-attribute decision making model for assessing the effect of energy industry on the energy–population–urbanization nexus. The use of Landsat based LULC maps and census data also show an increasing trend in urbanization and dynamics of infrastructure development. NTL data also shows increasing pattern of electrification and economic development in the study area due to increase in NTL. It was also highlighted how these dynamics vary with the location and existence of the dominant industry especially the energy industry. The EPU nexus index of 0.529 shows that the development of infrastructure, the standard of living and the socio-economic scenario in the study area has been elevated. At the same time, the study highlights that if mismanaged, this can lead to higher risks of failure in performance across several sectors due to interdependency of these sectors in their mutual interactions. With the understanding of EPU index dynamics and its working, it lays the roadmap for better management of future energy projects. The study will be useful for the policymakers in framing long-term strategies for development of energy industry.
Author Contributions
Conceptualization, R.A., S.T. and A.K.A.; methodology, R.A. and S.T.; formal analysis, S.T. and A.K.A.; investigation, R.A. and S.T.; writing—R.A., S.T. and A.K.A.; writing—review and editing, R.A., S.T. and A.K.A.
Funding
This research received no external funding.
Acknowledgments
Authors would like to thank United States Geological Survey (USGS) for providing Landsat data, National Centers for Environmental Information for DMSP data and Government of India for Census data. Saurabh Tripathi would like to thank Monbukagasho Japanese Government Scholarship to pursue his studies at Hokkaido University.
Conflicts of Interest
The authors declare no conflict of interest.
Appendix A
Table A1 shows the results of the accuracy assessment of LULC map of 2011.

Table A1.
Confusion Matrix of LULC map of 2011 using Support Vector Machines (SVM) classification.
| Urban Area | Vegetation | Water | Scrub Land | Total (Producer) | Producer’s Accuracy (%) | |
|---|---|---|---|---|---|---|
| Urban Area | 20 | 1 | 0 | 2 | 23 | 86.96% |
| Vegetation | 2 | 23 | 0 | 1 | 26 | 88.46% |
| Water | 0 | 0 | 10 | 1 | 11 | 90.91% |
| Scrub land | 2 | 1 | 1 | 13 | 17 | 76.47% |
| Total (User) | 24 | 25 | 11 | 17 | 77 | |
| User Accuracy (%) | 83.33% | 92.00% | 90.91% | 76.47% |
References
- Caetano, N.S.; Mata, T.M.; Martins, A.A.; Felgueiras, M.C. New Trends in Energy Production and Utilization. Energy Procedia 2017, 107, 7–14. [Google Scholar] [CrossRef]
- Dale, V.H.; Efroymson, R.A.; Kline, K.L. The land use-climate change-energy nexus. Landsc. Ecol. 2011, 26, 755–773. [Google Scholar] [CrossRef]
- Barthelmie, R.J.; Morris, S.D.; Schechter, P. Carbon neutral Biggar: Calculating the community carbon footprint and renewable energy options for footprint reduction. Sustain. Sci. 2008, 3, 267–282. [Google Scholar] [CrossRef]
- Avtar, R.; Tripathi, S.; Aggarwal, A.K.; Kumar, P. Population-Urbanization-Energy Nexus: A Review. Resources 2019, 8, 136. [Google Scholar] [CrossRef]
- Kumar, S.; Bhattacharyya, B.; Gupta, V.K. Present and Future Energy Scenario in India. J. Inst. Eng. Ser. B 2014, 95, 247–254. [Google Scholar] [CrossRef]
- Endo, A.; Tsurita, I.; Burnett, K.; Orencio, P.M. A review of the current state of research on the water, energy, and food nexus. J. Hydrol. Reg. Stud. 2017, 11, 20–30. [Google Scholar] [CrossRef] [Green Version]
- Pardoe, J.; Conway, D.; Namaganda, E.; Vincent, K.; Dougill, A.J.; Kashaigili, J.J. Climate change and the water–energy–food nexus: Insights from policy and practice in Tanzania. Clim. Policy 2018, 18, 863–877. [Google Scholar] [CrossRef]
- Lambin, E.F.; Geist, H.J.; Lepers, E. Dynamics of Land-Use and Land-Cover Change in Tropical Regions. Annu. Rev. Environ. Resour. 2003, 28, 205–241. [Google Scholar] [CrossRef] [Green Version]
- Pandey, Y.; Tare, V. Utilization of Coal Mixed Waste Aggregates Available at Thermal Power Plants for GSB and Asphalt Mixtures. Procedia Eng. 2016, 143, 170–177. [Google Scholar] [CrossRef] [Green Version]
- Coal Based Power Stations|NTPC. Available online: https://www.ntpc.co.in/power-generation/coal-based-power-stations/dadri (accessed on 21 June 2019).
- The Top 10 Biggest Thermal Power Plants in India. Available online: https://www.power-technology.com/features/feature-the-top-10-biggest-thermal-power-plants-in-india/ (accessed on 21 June 2019).
- Leck, H.; Conway, D.; Bradshaw, M.; Rees, J. Tracing the Water-Energy-Food Nexus: Description, Theory and Practice. Geogr. Compass 2015, 9, 445–460. [Google Scholar] [CrossRef]
- Momblanch, A.; Papadimitriou, L.; Jain, S.K.; Kulkarni, A.; Ojha, C.S.P.; Adeloye, A.J.; Holman, I.P. Untangling the water-food-energy-environment nexus for global change adaptation in a complex Himalayan water resource system. Sci. Total Environ. 2019, 655, 35–47. [Google Scholar] [CrossRef] [PubMed]
- Covarrubias, M. The nexus between water, energy and food in cities: Towards conceptualizing socio-material interconnections. Sustain. Sci. 2019, 14, 277–287. [Google Scholar] [CrossRef]
- Williams, J.; Bouzarovski, S.; Swyngedouw, E. The urban resource nexus: On the politics of relationality, water–energy infrastructure and the fallacy of integration. Environ. Plan. C Politics Space 2018, 37, 652–669. [Google Scholar] [CrossRef]
- Peak People: The Interrelationship between Population Growth and Energy Resources-Resilience. Available online: https://www.resilience.org/stories/2009-04-20/peak-people-interrelationship-between-population-growth-and-energy-resources/ (accessed on 21 June 2019).
- Holdren, J.P. Population and the energy problem. Popul. Environ. 1991, 12, 231–255. [Google Scholar] [CrossRef]
- Unfair and Unbalanced—How Will Population Growth Affect Energy?|HowStuffWorks. Available online: https://science.howstuffworks.com/environmental/energy/population-growth-affect-energy1.htm (accessed on 21 June 2019).
- De Sherbinin, A.; Carr, D.; Cassels, S.; Jiang, L. Population and enviornment. Annu. Rev. Environ. Resour. 2007, 32, 345–373. [Google Scholar] [CrossRef]
- Jones, D.W. How urbanization affects energy-use in developing countries. Energy Policy 1991, 19, 621–630. [Google Scholar] [CrossRef]
- Seto, K.C.; Güneralp, B.; Hutyra, L.R. Global forecasts of urban expansion to 2030 and direct impacts on biodiversity and carbon pools. Proc. Natl. Acad. Sci. USA 2012, 109, 16083–16088. [Google Scholar] [CrossRef] [Green Version]
- Pohekar, S.D.; Ramachandran, M. Application of multi-criteria decision making to sustainable energy planning—A review. Renew. Sustain. Energy Rev. 2004, 8, 365–381. [Google Scholar] [CrossRef]
- Qin, X.S.; Huang, G.H.; Chakma, A.; Nie, X.H.; Lin, Q.G. A MCDM-based expert system for climate-change impact assessment and adaptation planning—A case study for the Georgia Basin, Canada. Expert Syst. Appl. 2008, 34, 2164–2179. [Google Scholar] [CrossRef]
- Ciptayani, P.I.; Dewi, K.C. Decision support system of e-book provider selection for library using Simple Additive Weighting. J. Phys. Conf. Ser. 2018, 953. [Google Scholar] [CrossRef]
- Setyawan, A.; Arini, F.Y.; Akhlis, I. Comparative Analysis of Simple Additive Weighting Method and Weighted Product Method to New Employee Recruitment Decision Support System (DSS) at PT. Warta Media Nusantara. Sci. J. Inform. 2017, 4, 34–42. [Google Scholar] [CrossRef] [Green Version]
- Fitriasari, N.S.; Fitriani, S.A.; Sukamto, R.A. Comparison of weighted product method and technique for order preference by similarity to ideal solution method: Complexity and accuracy. In Proceedings of the 2017 3rd International Conference on Science in Information Technology: Theory and Application of IT for Education, Industry and Society in Big Data Era (ICSITech 2017), Bandung, Indonesia, 25–26 October 2017; pp. 453–458. [Google Scholar]
- USGS Earth Explorer. Available online: https://earthexplorer.usgs.gov/ (accessed on 1 May 2019).
- Chavare, S. Application of Remote Sensing and GIS in Landuse and Land Cover Mapping of Sub-Watershed of Wardha River Basin. In Proceedings of the National Conference on Development & Planning for Drought Prone Areas, India, 23–24 January 2015; pp. 221–224. [Google Scholar]
- Avtar, R.; Kumar, P.; Oono, A.; Saraswat, C.; Dorji, S.; Hlaing, Z. Potential application of remote sensing in monitoring ecosystem services of forests, mangroves and urban areas. Geocarto Int. 2016, 32, 1–12. [Google Scholar] [CrossRef]
- Avtar, R.; Sawada, H.; Kumar, P. Role of remote sensing and community forestry to manage forests for the effective implementation of REDD+ mechanism: A case study on Cambodia. Environ. Dev. Sustain. 2013, 15, 1593–1603. [Google Scholar] [CrossRef]
- Avtar, R.; Singh, C.K.; Shashtri, S.; Mukherjee, S. Identification of erosional and inundation hazard zones in Ken–Betwa river linking area, India, using remote sensing and GIS. Environ. Monit. Assess. 2011, 182, 341–360. [Google Scholar] [CrossRef]
- Arora, K.; Aggarwal, A.K. Approaches for Image Database Retrieval Based on Color, Texture, and Shape Features. In Handbook of Research on Advanced Concepts in Real-Time Image and Video Processing; IGI Global: Hershey, PA, USA, 2017; pp. 28–50. [Google Scholar]
- Avtar, R.; Herath, S.; Saito, O.; Gera, W.; Singh, G.; Mishra, B.; Takeuchi, K. Application of remote sensing techniques toward the role of traditional water bodies with respect to vegetation conditions. Environ. Dev. Sustain. 2014, 16, 995–1011. [Google Scholar] [CrossRef]
- Foody, G.M.; Mathur, A. Toward intelligent training of supervised image classifications: Directing training data acquisition for SVM classification. Remote Sens. Environ. 2004, 93, 107–117. [Google Scholar] [CrossRef]
- Cortes, C.; Vapnik, V. Support-Vector Networks. Mach. Learn. 1995, 20, 273–297. [Google Scholar] [CrossRef]
- Minh, H.V.T.; Avtar, R.; Mohan, G.; Misra, P.; Kurasaki, M. Monitoring and Mapping of Rice Cropping Pattern in Flooding Area in the Vietnamese Mekong Delta Using Sentinel-1A Data: A Case of An Giang Province. ISPRS Int. J. Geo-Inf. 2019, 8, 211. [Google Scholar] [CrossRef]
- Pai, M. Ensemble of support vector machines for land cover classification. Int. J. Remote Sens. 2008, 29, 3043–3049. [Google Scholar]
- Cavur, M.; Kemec, S.; Nabdel, L.; Sebnem Duzgun, H. An evaluation of land use land cover (LULC) classification for urban applications with Quickbird and WorldView2 data. In Proceedings of the 2015 Joint Urban Remote Sensing Event (JURSE), Lausanne, Switzerland, 30 May–1 April 2015; pp. 1–4. [Google Scholar]
- Elvidge, C.D.; Hsu, F.-C.; Baugh, K.E.; Ghosh, T. National trends in satellite-observed lighting. Glob. Urban Monit. Assess. Through Earth Obs. 2014, 23, 97–118. [Google Scholar]
- Elvidge, C.D.; Baugh, K.E.; Dietz, J.B.; Bland, T.; Sutton, P.C.; Kroehl, H.W. Radiance calibration of DMSP-OLS low-light imaging data of human settlements. Remote Sens. Environ. 1999, 68, 77–88. [Google Scholar] [CrossRef]
- NOAA Defense Meteorological Satellite Program. Available online: https://ngdc.noaa.gov/ngdc.html (accessed on 1 May 2019).
- Townsend, A.C.; Bruce, D.A. The use of night-time lights satellite imagery as a measure of Australia’s regional electricity consumption and population distribution. Int. J. Remote Sens. 2010, 31, 4459–4480. [Google Scholar] [CrossRef]
- Min, B.; Mensan Gaba, K. Tracking Electrification in Vietnam Using Nighttime Lights. Remote Sens. 2014, 6, 9511–9529. [Google Scholar] [CrossRef] [Green Version]
- Dugoua, E.; Kennedy, R.; Urpelainen, J. Satellite data for the social sciences: Measuring rural electrification with night-time lights. Int. J. Remote Sens. 2018, 39, 2690–2701. [Google Scholar] [CrossRef]
- Barton, J.O.E.; Weiner, A.D.; York, N.; Harper, G.; Lance, L. American Energy Security and Innovation: Generation Portfolio; CreateSpace Independent Publishing Platform: Scotts Valley, CA, USA, 2013; pp. 1–135. [Google Scholar]
- An Energy Security Index for India. 2016. Shakti Sustainable Energy Foundation report. Available online: https://shaktifoundation.in/report/india-energy-security-index/ (accessed on 26 August 2018).
- Dhaneshwar, A.; Pandey, P. Status of Corporate Social Responsibility among PSUs in India. India Environ. Portal 2015. [Google Scholar] [CrossRef]
- Maurya, N.K.; Singh, S.; Khare, S. Human Development in Uttar Pradesh: A District Level Analysis. Soc. Sci. Spectr. 2016, 1, 262–278. [Google Scholar]
- Roberts, M. Identifying the Economic Potential of Indian Districts; The World Bank: Washington, DC, USA, 2016. [Google Scholar]
- Kusharjanto, H.; Kim, D. Infrastructure and human development: The case of Java, Indonesia. J. Asia Pac. Econ. 2011, 16, 111–124. [Google Scholar] [CrossRef]
- Adeyemi, O.A.; Ola, O.S.; Oyewole, F.A. Internet Banking Functionality in Nigeria and Outcomes of Customer Satisfaction: An Empirical Investigation. Int. J. Acad. Res. Bus. Soc. Sci. 2014, 4, 50–65. [Google Scholar]
- Stanton, E.A. The Human Development Index: A History. Political Econ. Res. Inst. Work. Pap. Ser. 127 2007, 85, 37. [Google Scholar]
- Monti, A.; Di Virgilio, N.; Venturi, G. Mineral composition and ash content of six major energy crops. Biomass Bioenergy 2008, 32, 216–223. [Google Scholar] [CrossRef] [Green Version]
- Sutton, P.; Roberts, D.; Elvidge, C.; Baugh, K. Census from Heaven: An estimate of the global human population using night-time satellite imagery. Int. J. Remote Sens. 2001, 22, 3061–3076. [Google Scholar] [CrossRef]
- Small, C.; Pozzi, F.; Elvidge, C.D. Spatial analysis of global urban extent from DMSP-OLS night lights. Remote Sens. Environ. 2005, 96, 277–291. [Google Scholar] [CrossRef]
- Imhoff, M.L.; Lawrence, W.T.; Stutzer, D.C.; Elvidge, C.D. A technique for using composite DMSP/OLS “city lights” satellite data to map urban area. Remote Sens. Environ. 1997, 61, 361–370. [Google Scholar] [CrossRef]
- Doll, C.H.; Muller, J.-P.; Elvidge, C.D. Night-time imagery as a tool for global mapping of socioeconomic parameters and greenhouse gas emissions. AMBIO J. Hum. Environ. 2000, 29, 157–163. [Google Scholar] [CrossRef]
- Doll, C.N. Population detection profiles of DMSP-OLS night-time imagery by regions of the world. Proc. Asia-Pac. Adv. Netw. 2010, 30, 190–206. [Google Scholar] [CrossRef]
- Government of India Ministry of Power Center Electricity Authority. Available online: http://cea.nic.in/ (accessed on 1 May 2019).
- Giupponi, C.; Gain, A.K. Integrated spatial assessment of the water, energy and food dimensions of the Sustainable Development Goals. Reg. Environ. Chang. 2017, 17, 1881–1893. [Google Scholar] [CrossRef]
Figure 1.
Location of the study area (yellow pointer shows location of National Thermal Power Corporation (NTPC) Dadri).
Figure 1.
Location of the study area (yellow pointer shows location of National Thermal Power Corporation (NTPC) Dadri).

Figure 2.
Energy–population–urbanization (EPU) nexus.

Figure 3.
Hierarchical aggregation of quantifiable indicators of calculation of energy, population, and urbanization indices and for calculation of EPU index.
Figure 3.
Hierarchical aggregation of quantifiable indicators of calculation of energy, population, and urbanization indices and for calculation of EPU index.

Figure 4.
Simple additive weighting method.

Figure 5.
Flowchart for construction of Land Use Land Cover (LULC) map from Landsat data.

Figure 6.
Land Use Land Cover (LULC) maps with the spatial distribution of various classes for the year (a) 1989, (b) 2000, and (c) 2011.
Figure 6.
Land Use Land Cover (LULC) maps with the spatial distribution of various classes for the year (a) 1989, (b) 2000, and (c) 2011.

Figure 7.
Changing pattern of LULC classes in the study area from 1989 to 2011.

Figure 8.
Defense Meteorological Satellite Program-Operational Linescan System (DMSP-OLS) nighttime lights data for 1992, 2000, and 2011.
Figure 8.
Defense Meteorological Satellite Program-Operational Linescan System (DMSP-OLS) nighttime lights data for 1992, 2000, and 2011.

Figure 9.
Comparison of urban area expansion and per capita energy consumption for the population increase over a period of time for Dadri, India [59] (a) Time-population-urban expansion and (b) time–population–energy consumption.
Figure 9.
Comparison of urban area expansion and per capita energy consumption for the population increase over a period of time for Dadri, India [59] (a) Time-population-urban expansion and (b) time–population–energy consumption.

Table 1.
Census data of Gautam Buddha Nagar and Dadri sub-district.
(Courtesy: Ministry of Statistics and Programme Implementation, Government of India)
Table 1.
Census data of Gautam Buddha Nagar and Dadri sub-district.
(Courtesy: Ministry of Statistics and Programme Implementation, Government of India)
| Region and Population | Gautam Buddha Nagar (District) | Dadri (Sub-District) | ||||
|---|---|---|---|---|---|---|
| 2001 | 2011 | Change | 2001 | 2011 | Change | |
| Total | 202,030 | 4,223,633 | +251.40% | 692,259 | 2,049,262 | +196% |
| Literate | 675,669 | 2,930,045 | +333.65% | 423,431 | 1,469,288 | +346.9% |
| Working | 363,814 | 1,207,404 | +231.90% | 215,524 | 735,666 | +241.3% |
Table 2.
Indicators for energy, population, urban development indices.
| Indicators | Definition/Notion | Data Source | Value | Weight |
|---|---|---|---|---|
| Aggregate of energy availability | The ratio of energy production to consumption | Central Electricity Authority (CEA) Govt. of India report, average energy deficit | 0.60 | 2 |
| Diversity of electricity generation | Based on power generation capacity i.e., coal 1820 MW, gas 829.78 MW Solar 5 MW, other sources [45] | 0.29 | 1 | |
| Distribution losses as percentage of generation | Uttar Pradesh electricity regulatory commission report | 0.08 | 3 | |
| Energy intensity i.e., annual growth rate ratio of total primary energy consumption to GDP | Central statistics office ministry of statistics and program implementation government of India | 0.45 | 1 | |
| Aggregate of energy affordability | Aggregation (equal weighting) of electricity relative to access and other retail sources | Calculated based on data from district census handbook 2011, Govt. of India UP | 0.54 | 5 |
| Energy dynamics | Per household consumption (normalized) | Calculated based on CEA report | 0.35 | 2 |
| Energy Security | Calculated from McKinsey and Co. Report—An energy security index for India [46] | 0.67 | 4 | |
| CSR by energy industry (based on budget allocation and utilization) | Status of Corporate Social Responsibility among PSUs in India [47] | 0.72 | 3 | |
| Quality of education | Education Index | Human Development in Uttar Pradesh: A District Level Analysis, [48] | 0.76 | 5 |
| Access to health benefits | Life expectancy index | |||
| Quality of living | Human Development Index | |||
| Per capita income | GDP index | Calculated based on GDP of ROI and normalized by DEP deflator process with 2004-05 as base GDP | 0.52 | 2 |
| Business favorability in the region | Economic zone potential index | Identifying the Economic Potential of Indian Districts [49] | 0.60 | 3 |
| Road and highway connectivity | ||||
| Infrastructure development index | Indicator for infrastructure development | Infrastructure and human development [50] | 0.61 | 3 |
| Banking services accessibility | A key factor for business infrastructure development | Census of India 2011 and [51] | 0.75 | 3 |
Table 3.
Spatial distribution of LULC classified data.
| Year | Urban area | Vegetation | Water | Scrubland | ||||
|---|---|---|---|---|---|---|---|---|
| Area (km2) | % | Area (km2) | % | Area (km2) | % | Area (km2) | % | |
| 1989 | 365.9 | 25.7 | 865.5 | 60.7 | 20.5 | 1.4 | 172.9 | 12.1 |
| 2000 | 464.4 | 32.6 | 596.7 | 41.9 | 18.8 | 1.3 | 344.1 | 24.2 |
| 2011 | 584.8 | 41.1 | 662.8 | 46.5 | 17.6 | 1.2 | 158.8 | 11.2 |
© 2019 by the authors. Licensee MDPI, Basel, Switzerland. This article is an open access article distributed under the terms and conditions of the Creative Commons Attribution (CC BY) license (http://creativecommons.org/licenses/by/4.0/).
Share and Cite
MDPI and ACS Style
Avtar, R.; Tripathi, S.; Aggarwal, A.K. Assessment of Energy–Population–Urbanization Nexus with Changing Energy Industry Scenario in India. Land 2019, 8, 124. https://doi.org/10.3390/land8080124
AMA Style
Avtar R, Tripathi S, Aggarwal AK. Assessment of Energy–Population–Urbanization Nexus with Changing Energy Industry Scenario in India. Land. 2019; 8(8):124. https://doi.org/10.3390/land8080124
Chicago/Turabian StyleAvtar, Ram, Saurabh Tripathi, and Ashwani Kumar Aggarwal. 2019. "Assessment of Energy–Population–Urbanization Nexus with Changing Energy Industry Scenario in India" Land 8, no. 8: 124. https://doi.org/10.3390/land8080124
Note that from the first issue of 2016, this journal uses article numbers instead of page numbers. See further details here.