Analysis of Data Persistence in Collaborative Content Creation Systems: The Wikipedia Case


Department of Electronic Engineering, University of Rome “Tor Vergata”, Via Cracovia, 00133 Rome, Italy
*
Author to whom correspondence should be addressed.
Information 2019, 10(11), 330; https://doi.org/10.3390/info10110330
Submission received: 9 September 2019
/
Revised: 16 October 2019
/
Accepted: 23 October 2019
/
Published: 25 October 2019
(This article belongs to the Special Issue Knowledge Discovery on the Web)
Abstract
:A very common problem in designing caching/prefetching systems, distribution networks, search engines, and web-crawlers is determining how long a given content lasts before being updated, i.e., its update frequency. Indeed, while some content is not frequently updated (e.g., videos), in other cases revisions periodically invalidate contents. In this work, we present an analysis of Wikipedia, currently the 5th most visited website in the world, evaluating the statistics of updates of its pages and their relationship with page view statistics. We discovered that the number of updates of a page follows a lognormal distribution. We provide fitting parameters as well as a goodness of fit analysis, showing the statistical significance of the model to describe the empirical data. We perform an analysis of the views–updates relationship, showing that in a time period of a month, there is a lack of evident correlation between the most updated pages and the most viewed pages. However, observing specific pages, we show that there is a strong correlation between the peaks of views and updates, and we find that in more than 50% of cases, the time difference between the two peaks is less than a week. This reflects the underlying process whereby an event causes both an update and a visit peak that occurs with different time delays. This behavior can pave the way for predictive traffic analysis applications based on content update statistics. Finally, we show how the model can be used to evaluate the performance of an in-network caching scenario.
Keywords:
Wikipedia; real-data statistics; update statistics; popularity; caching; content revisions1. Introduction
Statistical data of web content, such as content popularity, have always received great attention by researchers, as they allow the proper assessment of the performance of distribution networks, of the many systems relying on caching and prefetching and of web crawlers and search engines.
It is not a surprise then, that early studies on content statistics date back to 1999, when Breslau et al. [1] demonstrated that web requests follow a heavy tailed distribution: the ranking of the access frequency decays as a power law: . Since then, other studies have been conducted to explore the statistics of webpage changes, showing that content updates could be described quite accurately by a Poisson process and, consequently, the duration between subsequent update events follow an exponential distribution [2]. Today, almost 20 years later, content statistics is still receiving attention. The massive introduction of user-generated content in the web 2.0 revolution changed the content statistics pattern with respect to Breslau’s times, when Internet users were 1/10 of the current total (304 vs. 3732 million).
Content update statistics evolved to become a fundamental component in the design and study of any communication network where caching and prefetching play a central role, such as content delivery networks (CDNs) and Information-centric networks (ICNs) [3,4,5], 5G networks [6,7,8,9], and wireless networks [10]. Indeed, accurate estimation of inter-update distribution is an important issue. The solution not only improves caching, replication, and allocation of download budgets, but also allows a more accurate characterization of complex Internet systems [11], affecting, for instance, freshness of content information [12].
Studies of content prediction are also of interest for web content analysis and design as they improve the understanding of user behavior and habits, enable sophisticated recommending systems, help online social information system engineering, and foster appropriate document-replication strategies [13]. The application domains interested span almost all sectors, from food delivery [14] to academic research [15].
Although there is an abundance of data, the derivation of analytic and statistical insights from real data is a process that requires care and appropriate techniques to avoid incurring common interpretation errors [16] and to accurately fit empirical data with the “right” distribution; this process is indeed a balanced trade-off between mathematical simplicity, good and meaningful data description, and high statistical significance. In this work, we focus on the statistics of page views, updates, and their relationship with regards to the Wikipedia site, currently the 5th most visited website worldwide according to Alexa Rank. Wikipedia data have been extensively used in literature, e.g., [17,18], since they provide a large amount of open-source data and statistics, including actual content update times [19].
In what follows, we use the term “update” when content is changed, i.e., when we have a revision on a page, without considering how much is changed; and the term “view” when a user requests a given content. A power law distribution that has been widely used to model the frequency of views (popularity) is Zipf’s law, which was proposed in [1] to fit Breslau’s empirical data on web requests. Zipf’s law is also used to model other data such as rank versus frequency of the first 10 million words in 30 Wikipedias (en, fr, it, etc.), the rank of the number of people watching the same TV channel, group sizes of social networks [20], media popularity on Youtube [21], and many others. To understand why so much data follow Zipf’s law, one should analyze how they are generated, as Mitzenmacher did, for instance, in 2004 [22]. Some years later, in 2009, Clauset et al. published an article [16] showing how the computation of the slope of a power law distribution can be tricky. Indeed, computing such a slope by performing a simple least-squares linear regression on the logarithm of the histogram of data (as Pareto did in his original work in the 19th century and as repeated in many works of literature) could lead to “significant and systematic errors” since distribution fitting is a necessary but not sufficient condition. In the same work, the authors also provide a methodology to perform such an analysis and evaluate the goodness-of-fit, and also show how there is no statistical significance in the fitting of much real-world data that are supposed to follow the power law.
In the case of Wikipedia data, an accurate analysis of this kind has yet to be performed, to the best of our knowledge, even if, as stated in Wikipedia itself (https://en.wikipedia.org/wiki/Wikipedia:Does_Wikipedia_traffic_obey_Zipf’s_law%3F), the popularity of Wikipedia pages apparently follows a Zipf law. In addition, no studies have been performed on page update statistics or on the correlation between views and updates of the pages.
Contribution and Main Results
The goal of this work is to answer to the following questions:
- How accurately does the popularity of Wikipedia pages fit a power law distribution?
- How are update statistics distributed?
- Are update events related to the popularity distribution? (Are the most updated contents also the most requested?)
To this aim, we analyzed all the traffic related to the 1000 most popular pages of the English Wikipedia, month by month for a year, considering a total of 6613 M page views and 804 K page updates.
The main outcomes of our statistical analysis are summarized as follows:
- The amount of views received by a page is well described by the Pareto distribution with shape parameter ; consequently, the rank-frequency behavior can be approximated by a Zipf distribution with parameter .
- The number of page updates is distributed according to a lognormal distribution with parameters and .
- The correlation coefficient between the ranking of page views and the ranking of page updates in a relatively long time period is negligible. In other words, in general, not only is the most viewed page not the most updated, but there is a lack of similarity in the ordering of the pages when ranked by views and updates (Kendall’s Tau∼0). However, in many cases the peaks of views-per-day can be directly associated with corresponding peaks of updates-per-day.
Although understanding user behavior has great importance per se (e.g., for information seeking), we focused more on its impact on content delivery systems as content update statistics play an important role in the performance evaluation of content diffusion/networking and caching systems. Indeed, these findings can be used to provide realistic traffic models and distribution parameters for properly dimensioning and assessing systems that need to cope with data invalidation, such as caching systems (e.g., [23,24,25]). Moreover, the correlation between views and updates can be used for predictive traffic analysis needed for prefetching activities (e.g., [6]) or opportunistic data offloading (e.g., [26]). Some of the addressed research topics have been partially addressed over time by other studies, which sometimes provide contrasting results, as detailed in Section 2.2. We present a new analysis, conducted with a rigorous methodology to evaluate the goodness of fit, on a recent dataset referring to a previously unconsidered time span. Indeed, as demonstrated in several works such as [27], these statistics may change over time.
The paper is organized as follows. Section 2 presents the related work, Section 3 presents the description of the dataset together with a background and methodology description. Empirical models of views, updates, and their relationship are presented in Section 4. The applicability of the proposed models to in-network caching scenarios is reported in Section 5. Finally, conclusions are drawn in Section 6.
2. Related Work
2.1. Content Update Statistics
The first important studies on web content dynamics date back to 1999 [1] and 2003 [2]. In these studies, the authors investigated the frequency of change of a relatively large set of pages (half a million) and devised page update frequency estimators that can be applied in the field of web crawler algorithms to improve the freshness of their results. From these studies, it appears that changes in web pages seem to be well described by a Poisson process. However, since that time, the web has changed considerably, becoming the universal interface of many different types of content whose statistics significantly change according to the application context: social networks, newspapers, sensor data, blogs, live or on-demand videos, etc. [28]. Therefore, as the web expanded, researchers started to analyze the statistics of specific content types such as video, static page, dynamic page, home page, news, etc.
Since a large amount of Internet traffic consists of videos, many research works focus on it, analyzing websites such as Youtube. For example, in [21] authors studied the Youtube video service in order to characterize its traffic. Being a social media, Youtube also presents social network data associated with videos; such data have been used to understand and sometimes predict video traffic patterns and to improve the effectiveness of caching strategies. Other works such as [29] and [30] analyzed Youtube data in order to understand users’ engagement dynamics. Social dynamics and video metadata (title, tag, thumbnail, and description) have been shown to influence, and thus be correlated with, the number of views [29], the number of likes per view, and sentiment feedback in the comments [30].
Videos are usually added and not updated, and thus update statistics are not considered. In contrast, other types of content are periodically invalidated, including news pages, user-generated pages, etc. Wikipedia, the largest knowledge base ever created, includes both cases. Therefore, Wikipedia has been extensively studied under several perspectives. For instance, The authors of [31,32,33] focus on content semantics; in [31], the authors use Wikipedia taxonomy to compute semantic relatedness among words, whereas in [32] and [33], the authors calculate semantic relatedness using hyperlinks among pages. Other studies address page revision processes and have been conducted with different goals in mind. For example, in [34] the authors study page revisions to identify patterns of conflict in Wikipedia articles. The model relies on users’ editing history and the relationships between user edits and content reverts. In [35], the authors analyze editing patterns using a dynamic social network analysis and provide a tool that converts the edit flow into a temporal social network to identify the most creative editors among the few thousand contributors who perform most edits among the many Wikipedia editors. In [36], the authors study how to improve the transparency and accountability of Wikipedia articles with WikiDashboard, a social dynamic analysis tool.
In this work, we analyze page views and updates to infer their model and statistics in order to provide insights and allow the proper dimensioning of caching, prefetching, indexing systems, etc., as well as to build realistic traffic generators. To the best of our knowledge, an accurate analysis of such data does not yet exist in the literature. In particular, view statistics have only been superficially analyzed, while update statistics have not been analyzed yet. However, the number of available studies on empirical data fitting and analysis is impressive, as the topic has received a lot of interest. In Section 3.1 we present a brief technical summary of state-of-the-art models and methodologies that can be applied in our case.
2.2. Wikipedia-Related Studies
Wikipedia has attracted many researchers because of its popularity and the vast amount and availability of data. Studies span from its semantic space structure [37] to user motivation behind its usage [38], to the creation/deletion of articles [27] and to the ability to predict market trends from Wikipedia statistics [39]. In [40], the authors studied reader preferences by analyzing data from biography pages of Wikipedia and reader access data taken, with the user’s consent, with a browser toolbar. They generated a taxonomy of pages (not statistical inference, as this work does) and correlated it with the sum of the number of edits each page received, partially missing time-based correlation. The authors, however, recognized the correlation in what they refer to as “trending pages”, where the attention of both authors/editors and readers focuses on the same items.
The authors of [41] focus on the misalignment between the quality of Wikipedia articles and reader demand. The quality of an article is obtained by the Wikipedia article quality classification (Stub, Start, C, B, Good Article, A, Featured Article). In [42], the authors focus on Wikipedia categories, studying whether they exhibit the same patterns of contributors, edits, and views over time. Despite the fact that they recognize that “categories have different trends with respect to consumers’ points of view”, they recognize two evolutionary phases of production and consumption. In this work, we found a similar pattern but considering a totally different time-scale: in our case “days”, in theirs, years.
The authors of [43] analyze promoted articles for page-view dynamics and develop a model thereof. Then they test popularity predictions. They model time-variant page views, unlike us, because we analyze the top 1000 articles (not promoted articles) and model overall popularity during a time slot (day/month), while instead, they studied hours.
An analysis of traffic bursts due to content popularity is performed in [44]. Its authors confirm a scale-free distribution of popularity and fit both the inbound and outbound traffic with a power law with exponential cutoff. Using the maximum likelihood method, they fit popularity with a power law with parameter from 1.9 to 2.6 (which confirms our findings) and use Kolmogorov–Smirnov statistics to rule out the lognormal model. They left the predictability of the number of revisions to future work. In that study, however, the focus is more on improving, through the adoption of a generalization of the ranking model, the conventional preferential attachment model to explain the observed burst dynamics.
The authors of [45] focus on the dynamics of editing, showing a lognormal behavior motivated by the trend of re-editing the same articles, which is a generative model for the lognormal distribution. Interestingly, they also show how mean and variance increase with article age, together with a correlation between updates and article quality, but unlike us, they use a Chi-square test. Moreover, using a per-month analysis, we provide an easier way (a couple of parameters) to get a first model of editing activities, while they provide a model to capture the evolution of the editing process with page age. Although their considered dataset is more than 10 years older than ours, we confirm the overall lognormal trend of editing as well as the parameters, which are in line with their findings. This is, however, in contrast to results from [46], who propose a Zipf distribution to model editing events.
2.3. In-Network Caching
Caches are memories used to store the results of previous access requests and to serve subsequent requests quicker and more efficiently. Caching is widely used in various application fields, and caching techniques have been investigated in the literature for several decades [47]. In the world of telecommunication networks, caching consists of storing the required content (such as web pages or videos) at strategic points in the network to reduce traffic and serve requests faster. Typical examples in this sense are web caching systems that store web content in user browsers or in dedicated http proxies. Today, caching is proposed to improve the efficiency of novel mobile edge computing solutions [9] or to optimize content dissemination in opportunistic networks where device-to-device connection is time limited and unpredictable [48,49]. In information-centric networking, a recent paradigm that moves the focus of networking from host-to-host communication to content-oriented delivery, caching is an essential element of the network since all nodes can store content objects in an internal memory. A new set of techniques has been devised in order to optimize the throughput of the network, subject to specific traffic models and to caching technology constraints (size, time to retrieval) [3].
To cope with limited memory size, several replacement policies have been proposed in the literature, from simple First Input First Output (FIFO), Least Recently Used (LRU), and Least Frequently Used (LFU) schemes to the recent hyperbolic caching [50], Score-Gated LRU (SG-LRU) cache [51], probabilistic caching [3], and many others [52]. Performance evaluation of caching strategies and replacement policies are deeply tied to the traffic model. Indeed, temporal locality of the requests as well as the duration of the content update dramatically affect the performance of caches and networks of caches [4].
A typical problem of a caching system is how to prevent caching from providing stale data to the user when the original source is updated. A conventional solution is to introduce a content expiry time, after which the cache discards the stored content and can be forced to fetch a new copy of the data [53]. Expiry timeout can be set considering a trade-off between caching efficiency, the specific data/application time sensitivity, and the content update statistics. Intuitively, the more the data is subject to changes over time, the lower the utility of a cache memory. In this work, we model the content view/update statistics of Wikipedia pages in order to derive insight that can also be used to model user content updating processes and perform more accurate performance evaluations of caching systems and replacement policies.
3. Methodology and Background
3.1. Background
Mathematically, a given quantity x is said to obey a power law if it comes from the observation of a random variable X whose complementary cumulative distribution function (CCDF) is
where is the scaling parameter, c is a normalization constant, and both are greater than 0.
A very common continuous power law distribution is the Pareto distribution, whose CCDF(x) is
The Pareto distribution is simple and often used to describe many phenomena, such as page views, and it is not exclusive to the field of computer science. The underlying phenomena that lead to Pareto behaviors, known as Pareto’s generative processes, are described in [22].
A simple (albeit not unique) generative process that leads to a Pareto behavior is the so-called “preferential attachment”: a site exhibits a Pareto-distributed number of views if a new view occurs with probability on a page chosen uniformly at random among all available pages, and with probability on a page chosen proportionally to the number of visits the page received up to that point in time [22].
Another common discrete power law distribution is Zipf’s law, which is often used to model the rank-frequency behavior of a random process, i.e., to model the number of occurrences of events in a sample, aka frequency, while ranking them with respect to that frequency. Zipf’s law is
where r is the rank of a given event out of N possible events, is its number of occurrences in the sample, and C is a normalization constant equal to the total number of events that took place during the considered sample.
Actually, the Complementary Cumulative Distribution Function (CCDF) and rank-frequency ordering are strictly correlated. Let us assume that is the average frequency of an event of rank r; the average number of events with a frequency greater than is , but this value is also equal to r since no more than r events have greater frequency, owing to the definition of rank. It follows that a rank-frequency plot can be obtained by simply flipping the axis (, ) of the CCDF plot into () [54]. As a consequence, it is easy to demonstrate that if the CCDF follows a Pareto law, then the related rank-frequency plot follows a Zipf law, and the relationship between the Pareto shape parameters and the Zipf s parameter is simply [55]. Pareto and Zipf models have often been used to model real datasets. Another very common distribution is lognormal, which does not follow a power law: a random variable X is lognormal distributed if , where Y is a normally distributed random variable. The Probability Density Function (PDF) of X is:
A common generative model to obtain lognormally distributed data is the so-called “multiplicative process”, in which the evolution of a quantity X in a discrete interval of times is such that = , where M are random variables not necessarily lognormally distributed. Indeed, given that , if satisfies the conditions of the central limit theorem, we have that converges to a normal distribution, and is, therefore, lognormally distributed [22]. In many fields such as biology, hydrology, and the social sciences [56], empirical data have been represented with a lognormal distribution, and the question of whether the related data are better described by a lognormal or a power law distribution dates back to at least 1950 [22].
One issue arose because a lognormal distribution with sufficiently large tends to have a linear log-density like a power law Pareto distribution, hence it is easy to confuse the two distributions, especially with small datasets. Moreover, it has been shown that multiplicative processes, under slightly different conditions (depending on whether the multiplication is or is not minimum bounded), can lead to either lognormal or power law distributions [22]. Other models such as the “double pareto” distribution have been proposed to better describe behaviors that lie in between lognormal and Pareto distributions [57]. It is also observed that many real-world phenomena obey a power law or lognormal behavior only for values above a threshold, namely , so that only the tail of the empirical distribution properly fits these analytic distributions.
Accordingly, during a fitting process, special attention should be devoted to the estimation of . Indeed, in our case, choosing the best that fits an empirical distribution could lead to a wrong description of the real system. High values of can cut out too many samples of the empirical distribution and thus are not representative of the whole dataset. At the same time, smaller values of can result in a poor fit with scarce statistic significance. Thus, the consequence of the choice of a given should be explicitly assessed and discussed when proposing a fitting model.
3.2. Contribution and Methodology
In this work, we study and statistically explore the content-update statistics of Wikipedia data. More specifically, we provide fitting and related goodness of fit of the above-mentioned distributions when used to model Wikipedia access and update processes. By using the methodology proposed by Clauset et al. [16], we estimate the distribution parameters using specific maximum likelihood estimators. We estimate by minimizing the Kolmogorov–Smirnov statistics and evaluate the goodness of fit between the real data and the fitting function with a semi-parametric approach, and reject the fitting hypothesis if the p-value is less than 0.1; otherwise, we consider other distributions using likelihood ratios to have a more accurate model selection. Part of the analysis has been conducted using a software library described in [58]. Finally, we conduct an analysis of the view–update events relationship, showing correlation levels of both their average values and of their time-series.
3.3. Approach
We analyzed month-per-month page view and update statistics of the 1000 most popular pages of the English Wikipedia for all of 2016. The dataset consists of 6613M page views and 804k page updates. View data were obtained using the Wikimedia REST API (https://www.mediawiki.org/wiki/REST_API), while update data were collected using the MediaWiki Action API (https://www.mediawiki.org/wiki/API:Main_page).
4. Empirical Models
4.1. Wikipedia Views
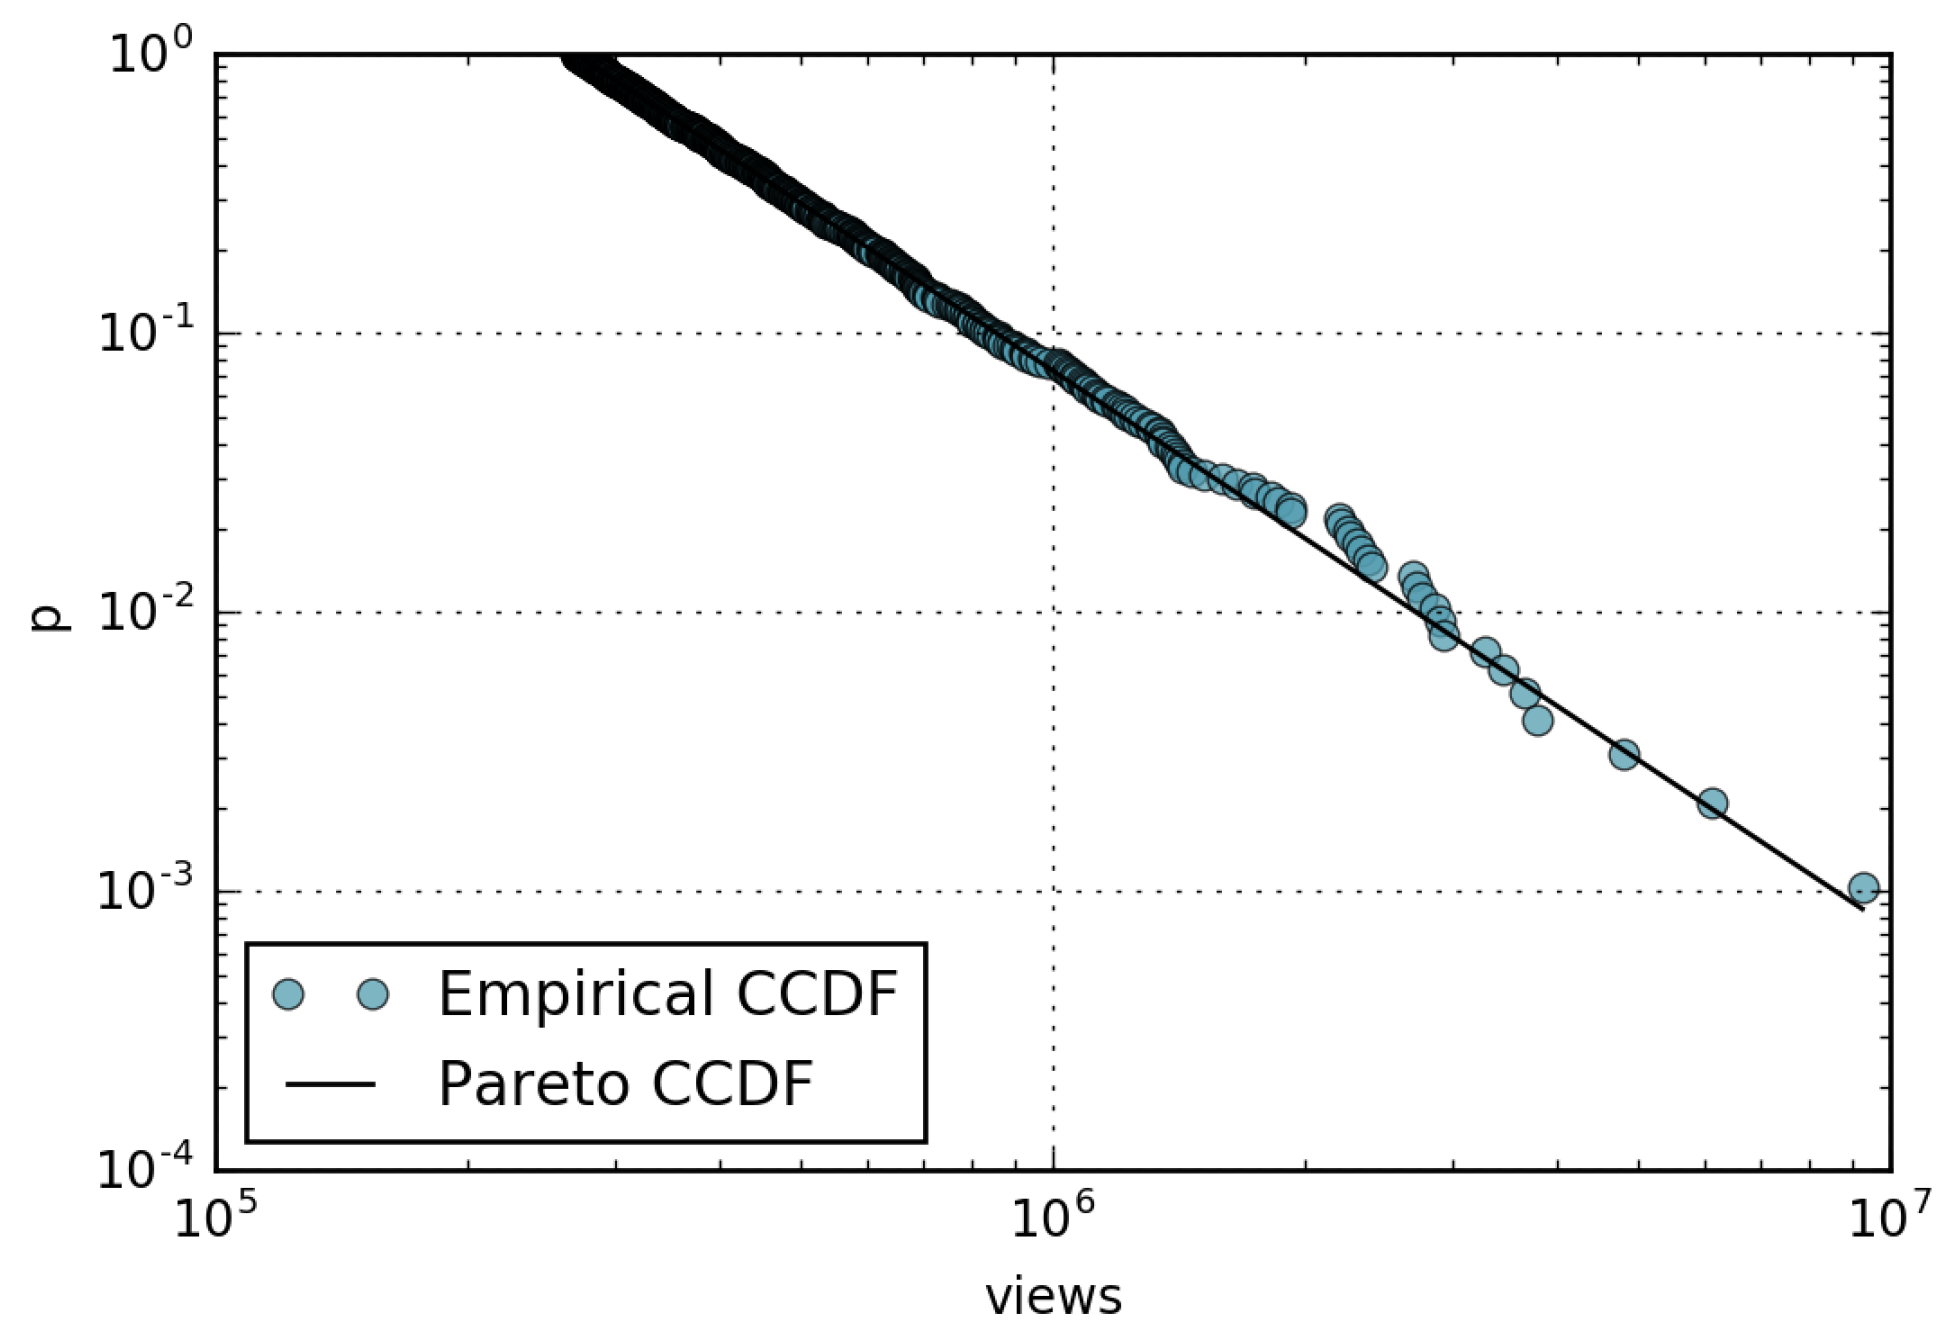
Figure 1 shows the empirical CCDF of the 1000 most visited pages of Wikipedia in the month of July 2016 plotted on a log–log scale, corresponding to a total of 516M views. Following the methodology presented before, we verified the goodness of fit with a Pareto distribution.
For the considered month, we obtain and = 269,624. In this case, is such that we fitted the whole dataset, comprising the 1000 pages. We calculated the p-value of such a fitting with an accuracy of 2 decimal digits, adopting a Kolmogorov–Smirnov (KS) test and a semi-parametric approach for the values of X below . The result is , which, being substantially greater than , confirms that the Pareto distribution (and Zipf) is currently a plausible hypothesis for page views modeling. Then we extended our analysis to all of 2016 to see how the Pareto fitting varies month by month. Clearly, the 1000 most popular pages change each month.
Figure 2 shows the estimation of the and the related p-value for all months. The fitting has a statistical significance for most of the considered months, with . We remark that by varying , we could fit only a small part of the data that could not represent the whole phenomenon and which only accounts for the tail of the distribution (i.e., the most popular pages). For this reason, in Table 1 we report the percentage of all traffic successfully included in the fitting. The chosen values of are such that the model represents most of the traffic. Nevertheless, in some cases, such as March 2016, a truncated power law distribution seems more suited to represent the entire dataset. We also tried the fitting with other common distributions (exponential, Weibull, lognormal), but the Pareto model provides the best fitting (p-value).
4.2. Wikipedia Updates
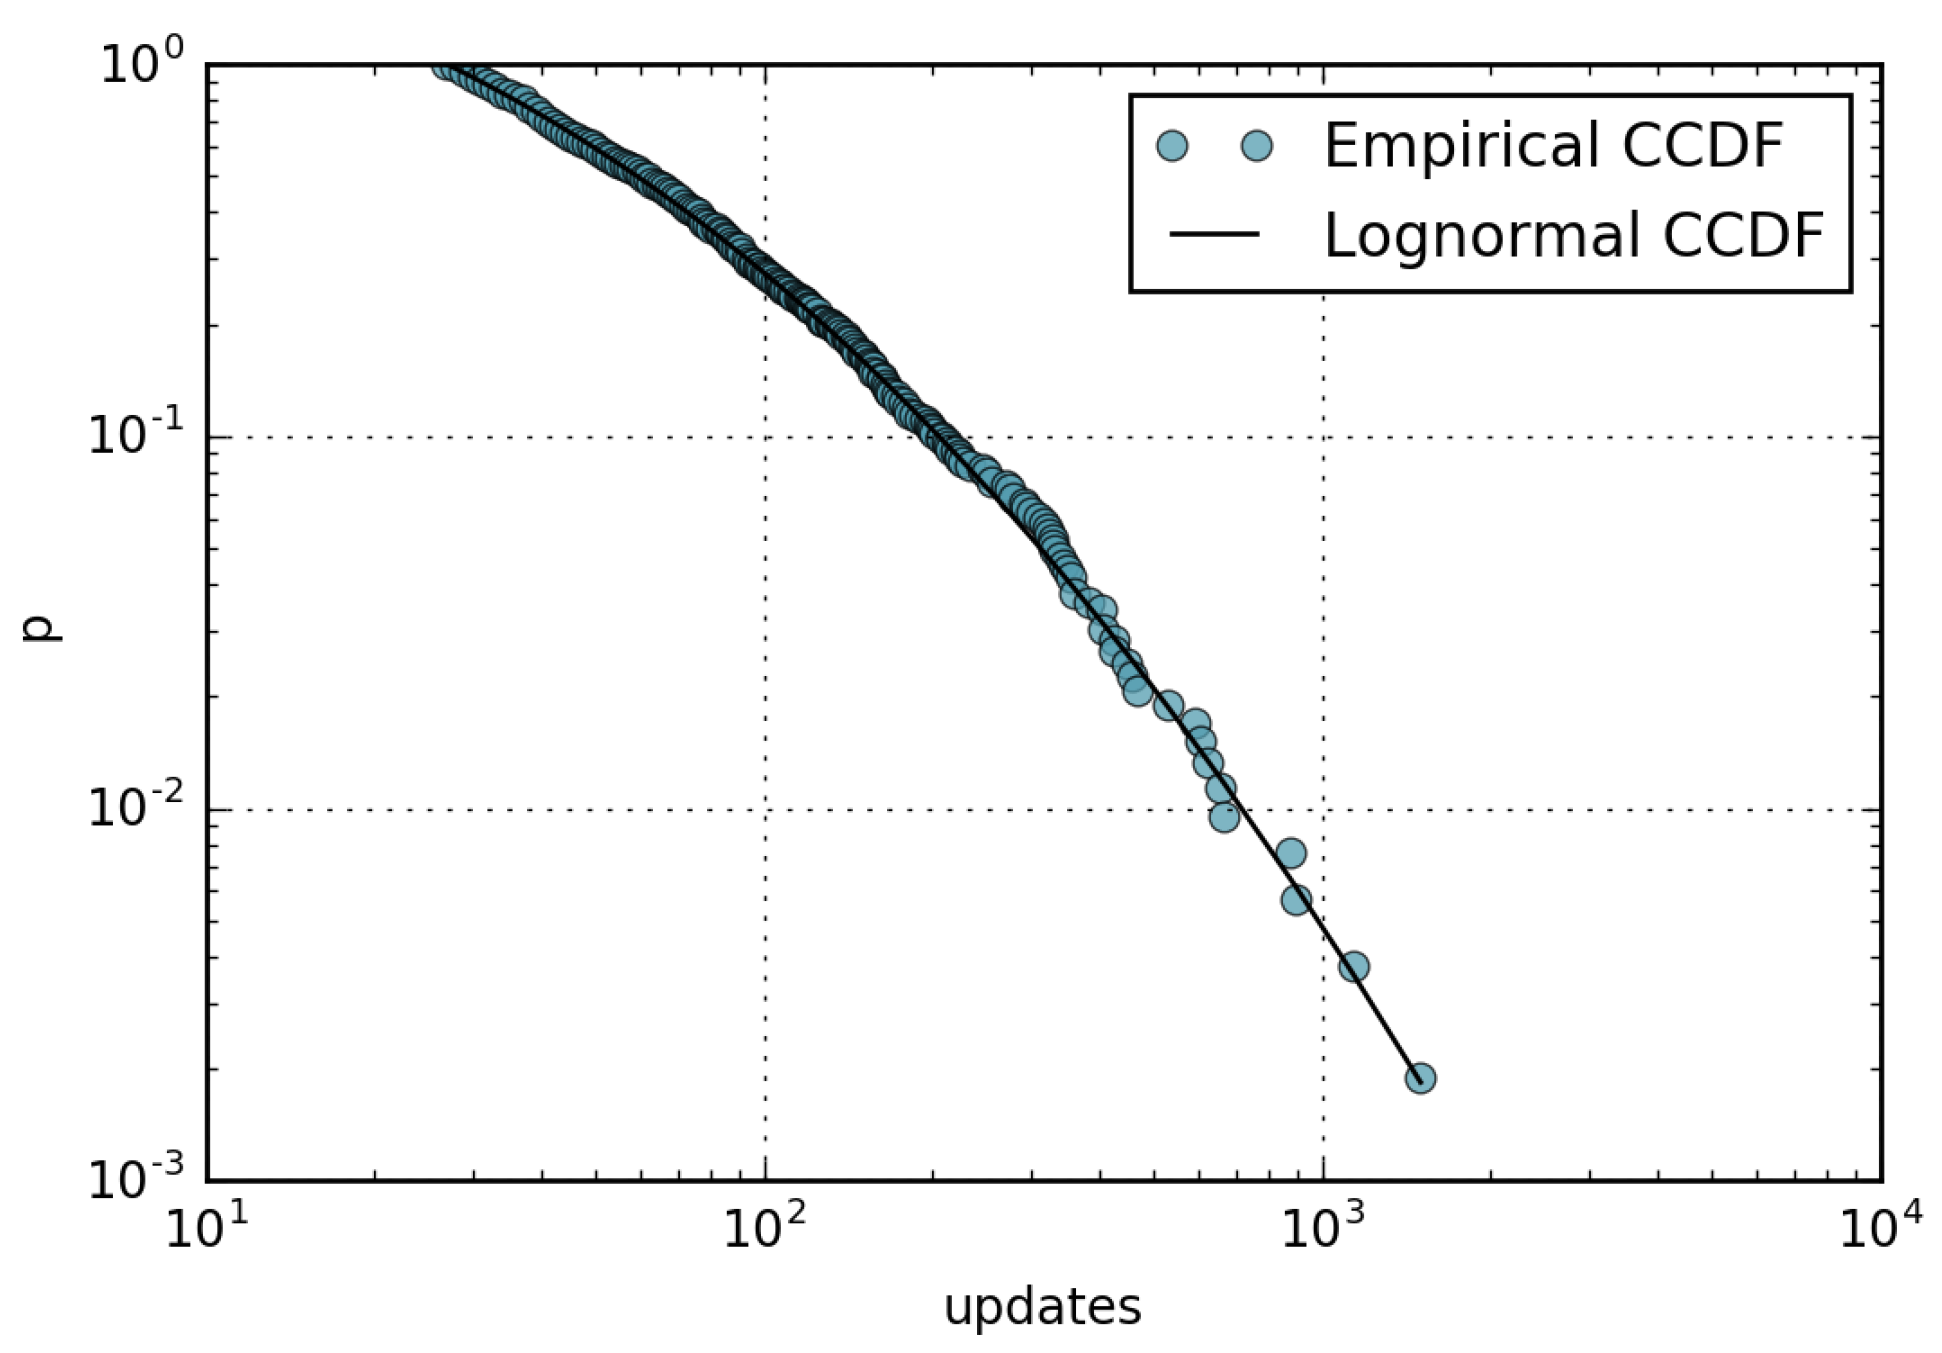
Following the same methodology used above, we analyzed the update statistics of the 1000 most popular pages already considered in the view statistics analysis. Looking at the month of February 2016, with revisions, we find evidence that the update frequency follows a lognormal distribution, as represented in Figure 4. The maximum likelihood is obtained with parameters and . The cuts the data so that 54,032 revisions are considered, from a total of 59,241 (91%). The p-value calculated with KS statistics to the second decimal digit is .
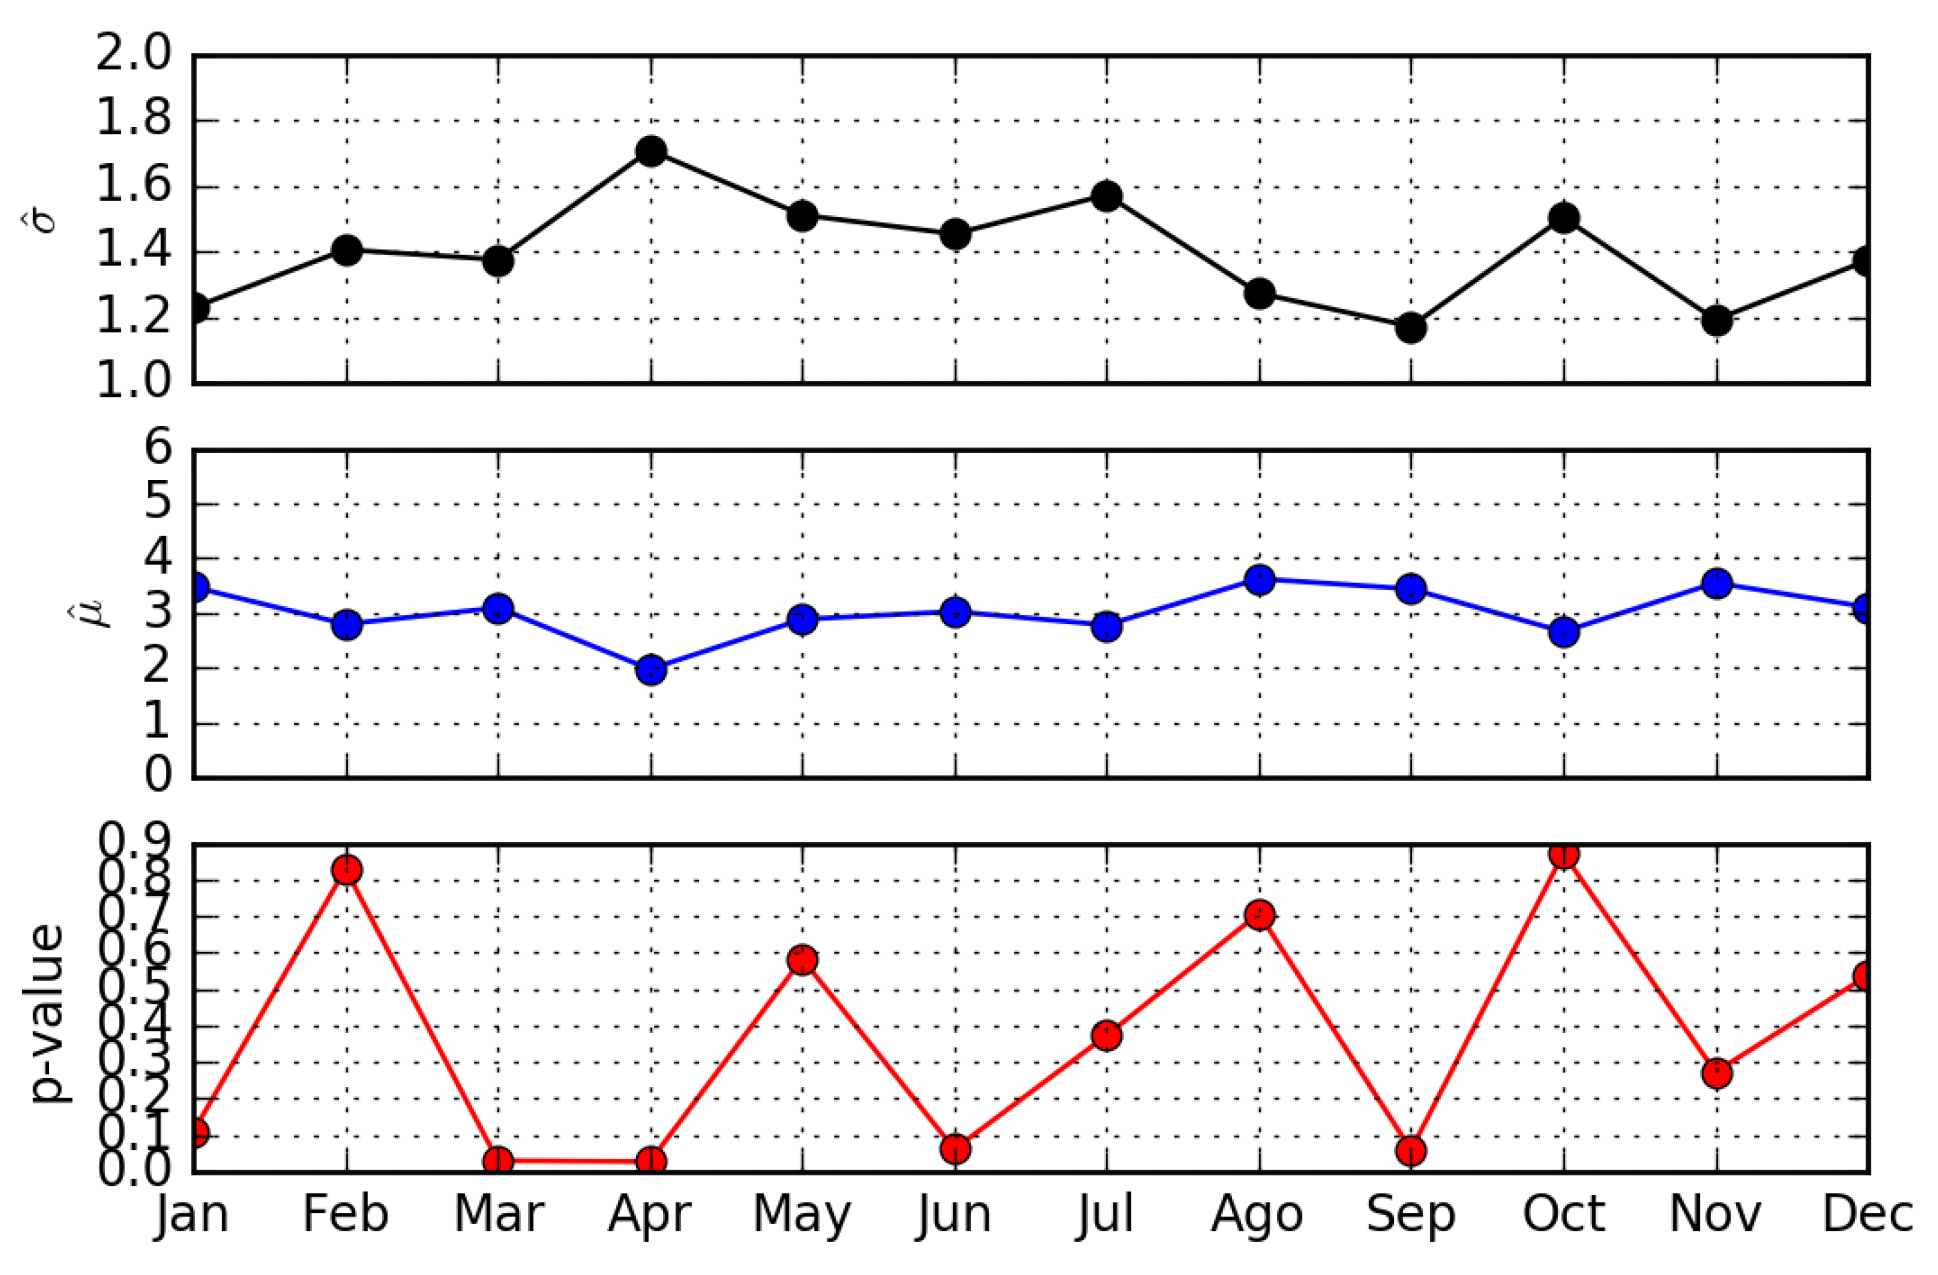
In Figure 5, we show the results of the same analysis for all months of the year, while in Table 2, we show the percentage of revisions captured by the analysis. As for the choice of , we only considered values that allow us to model at least 90% of the data. Even though the chosen is not the one that minimizes the KS distance in the entire dataset, this constraint allows us to avoid fitting only the tail of the distribution, hence representing only a small portion of all empirical data. This choice impacts the p-value, decreasing its absolute value. Nonetheless, the statistical significance of the fitting presented in Figure 5 shows that the lognormal distribution is a plausible hypothesis to describe the update statistics for most of the considered months.
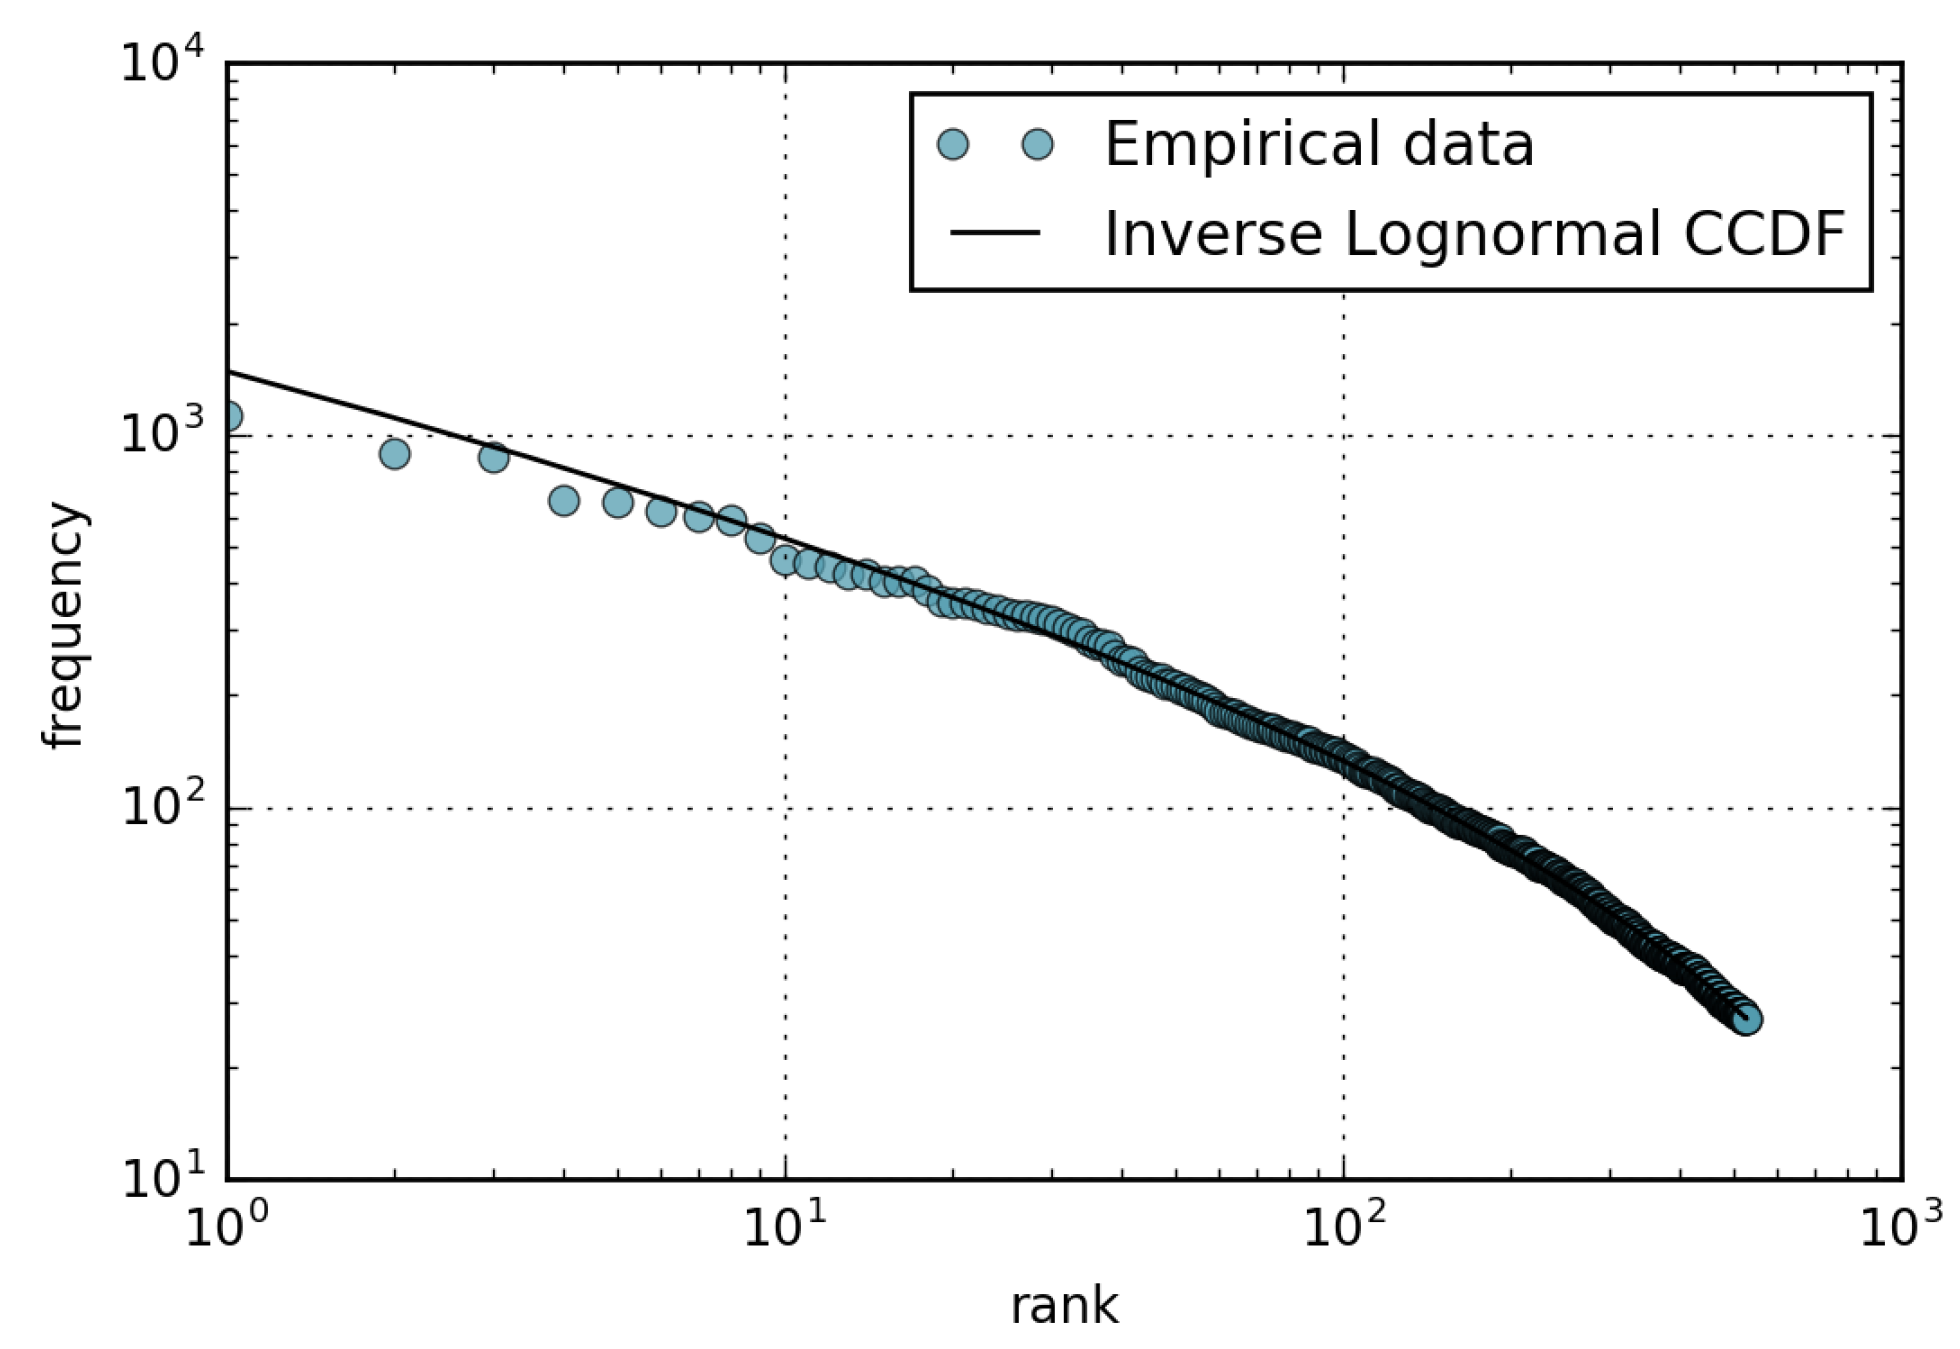
Figure 6 reports the rank-frequency plot of the updates. For the analytic curve, we inverted the CCDF axis as explained in Section 3.1. We observe that the tail of the plot decreases in a sub-linear fashion, showing that the values of page-update frequencies are not as spread out (long tail) as those of page views.
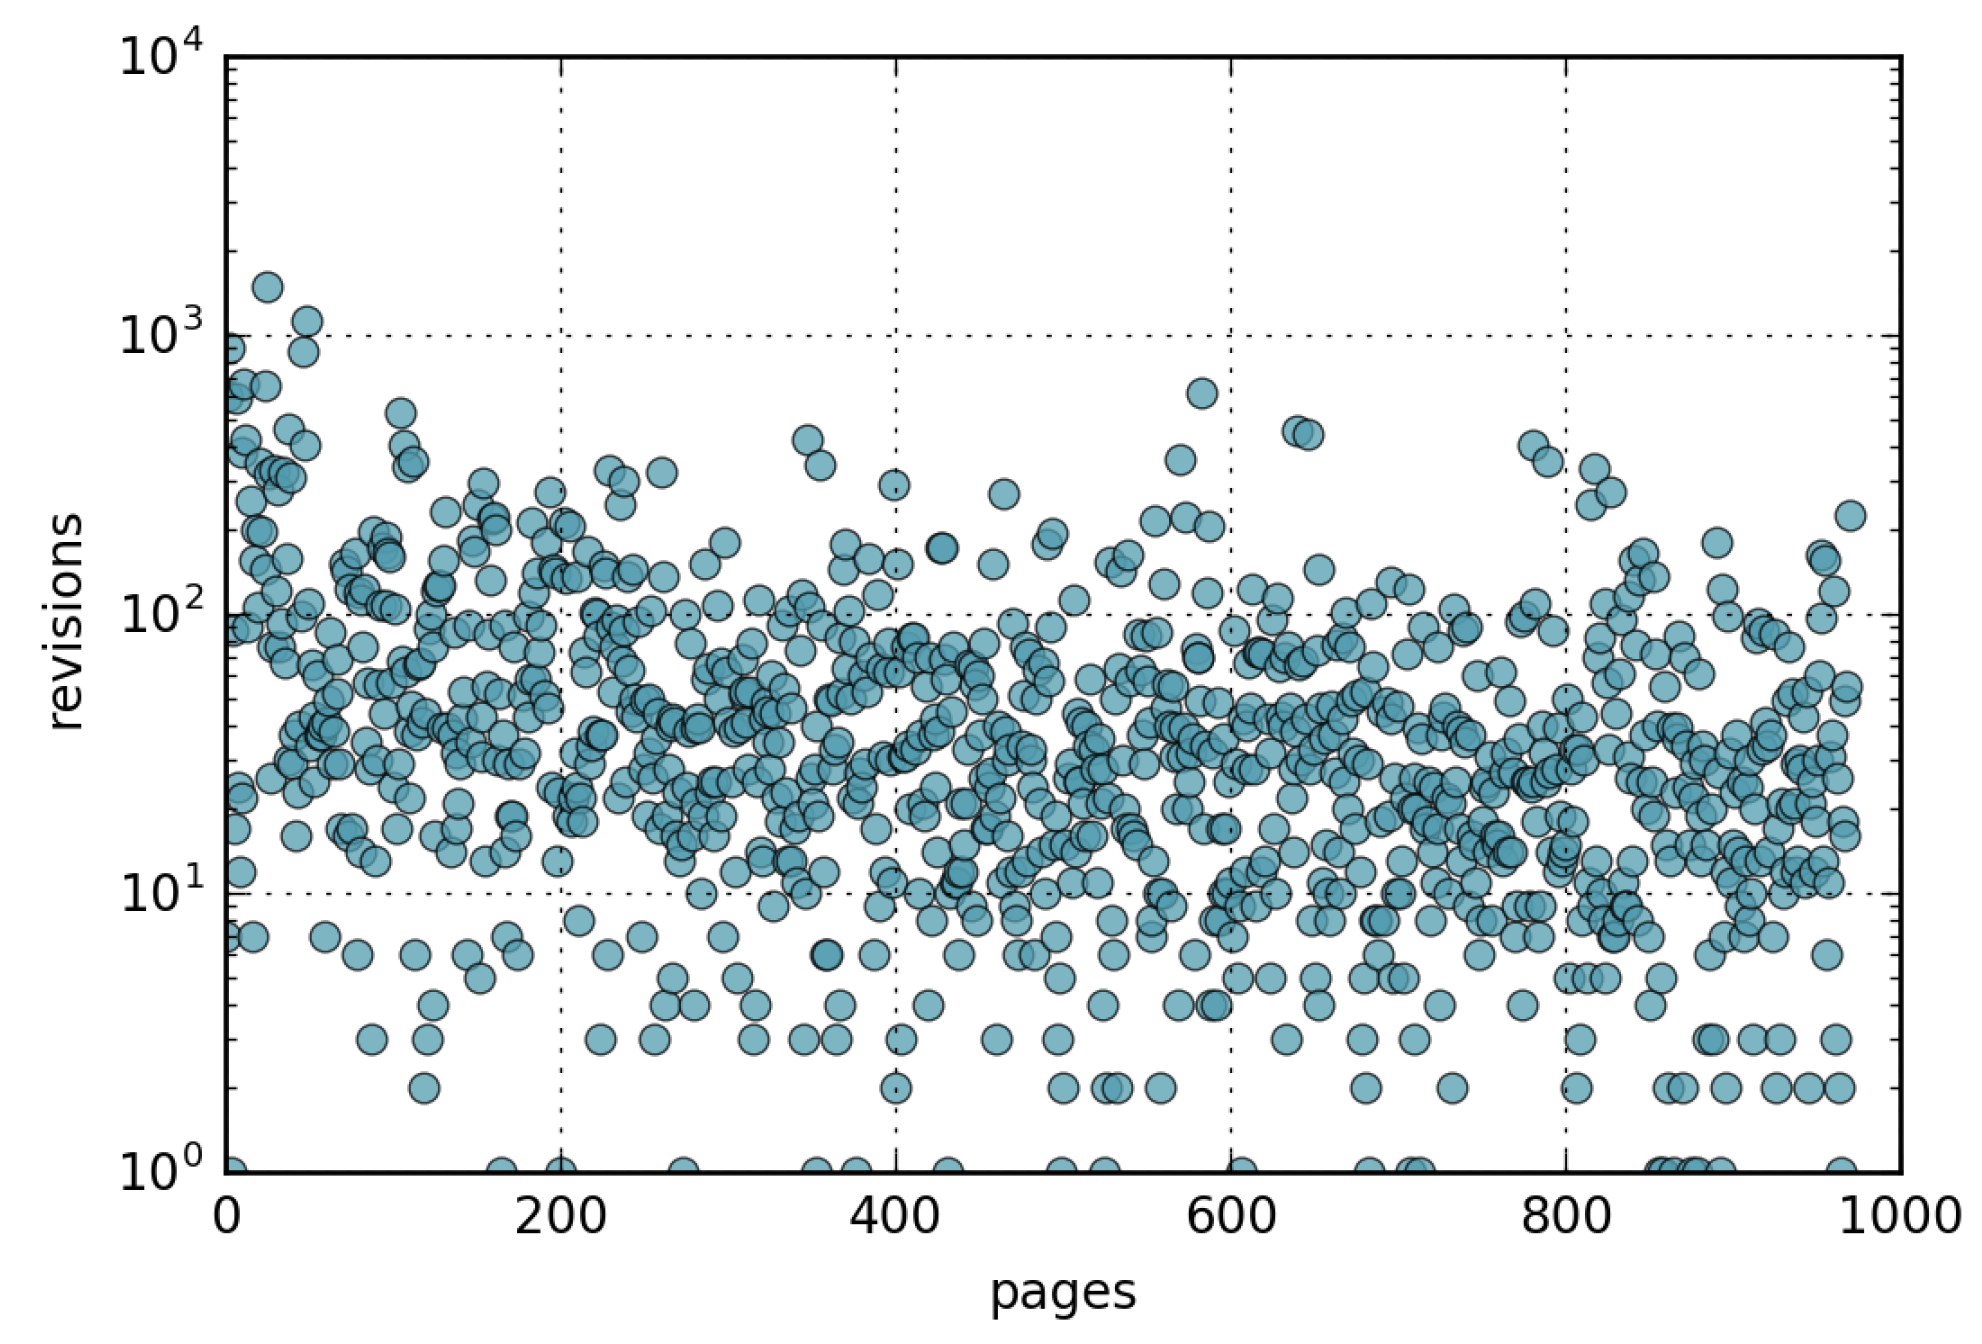
One of the aims of this paper, mentioned in the introduction, is to check whether there is a correlation between the popularity of a given page and the number of updates (revisions) the same page receives. Figure 7 shows the number of updates for each page in the month of February 2016, sorting the pages by view rank so that the page with most views has the lowest ID. By looking at the Figure, a correlation between views and updates is not apparent.
4.3. Relationship Between Views and Updates
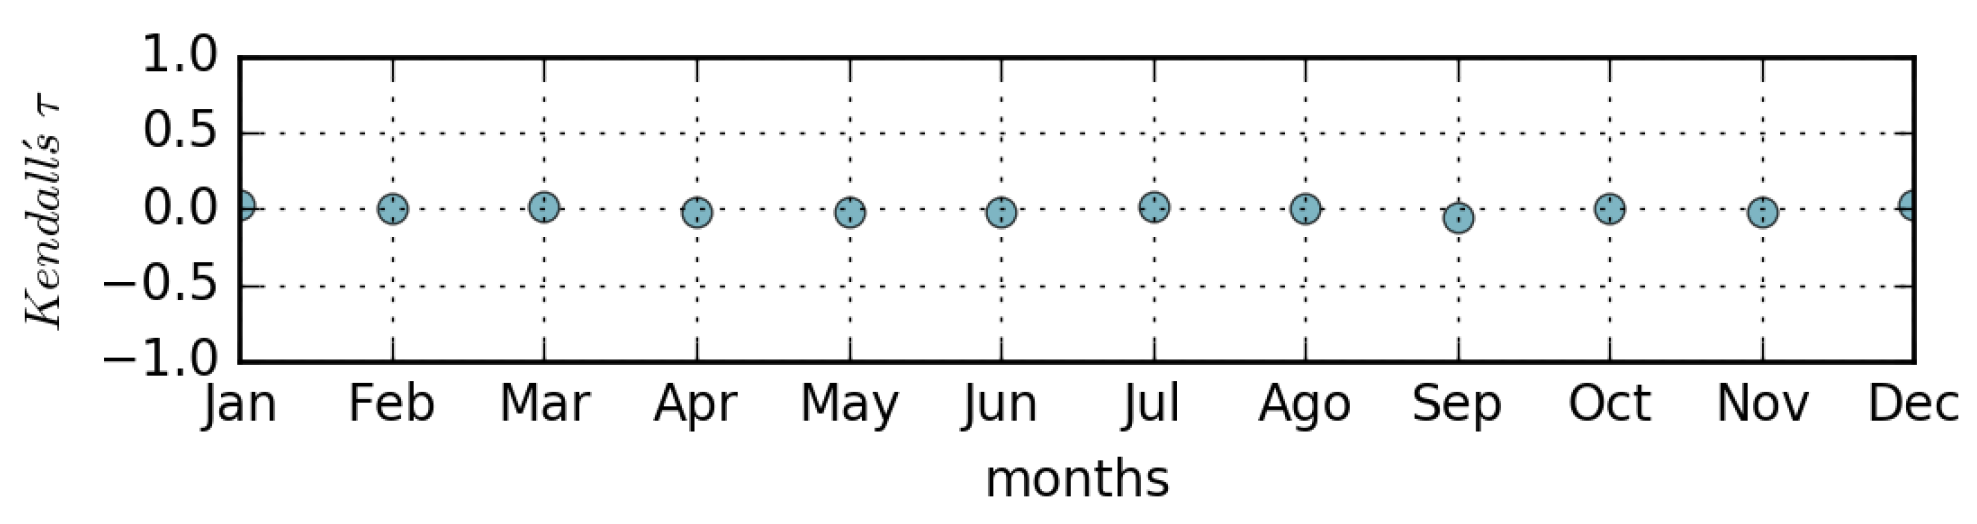
To go further, using a more formal method, we measured the Kendal Tau correlation to quantify the ordinal association, and we report the result in Figure 8. Being very close to 0 for all months of the year, the shows an evident lack of direct correlation between the ranks of page views and page updates. In other words, not only is the most viewed page not the most updated, in general, but there is a lack of similarity in the orderings of the pages when ranked by views and updates (Kendall’s Tau∼0).
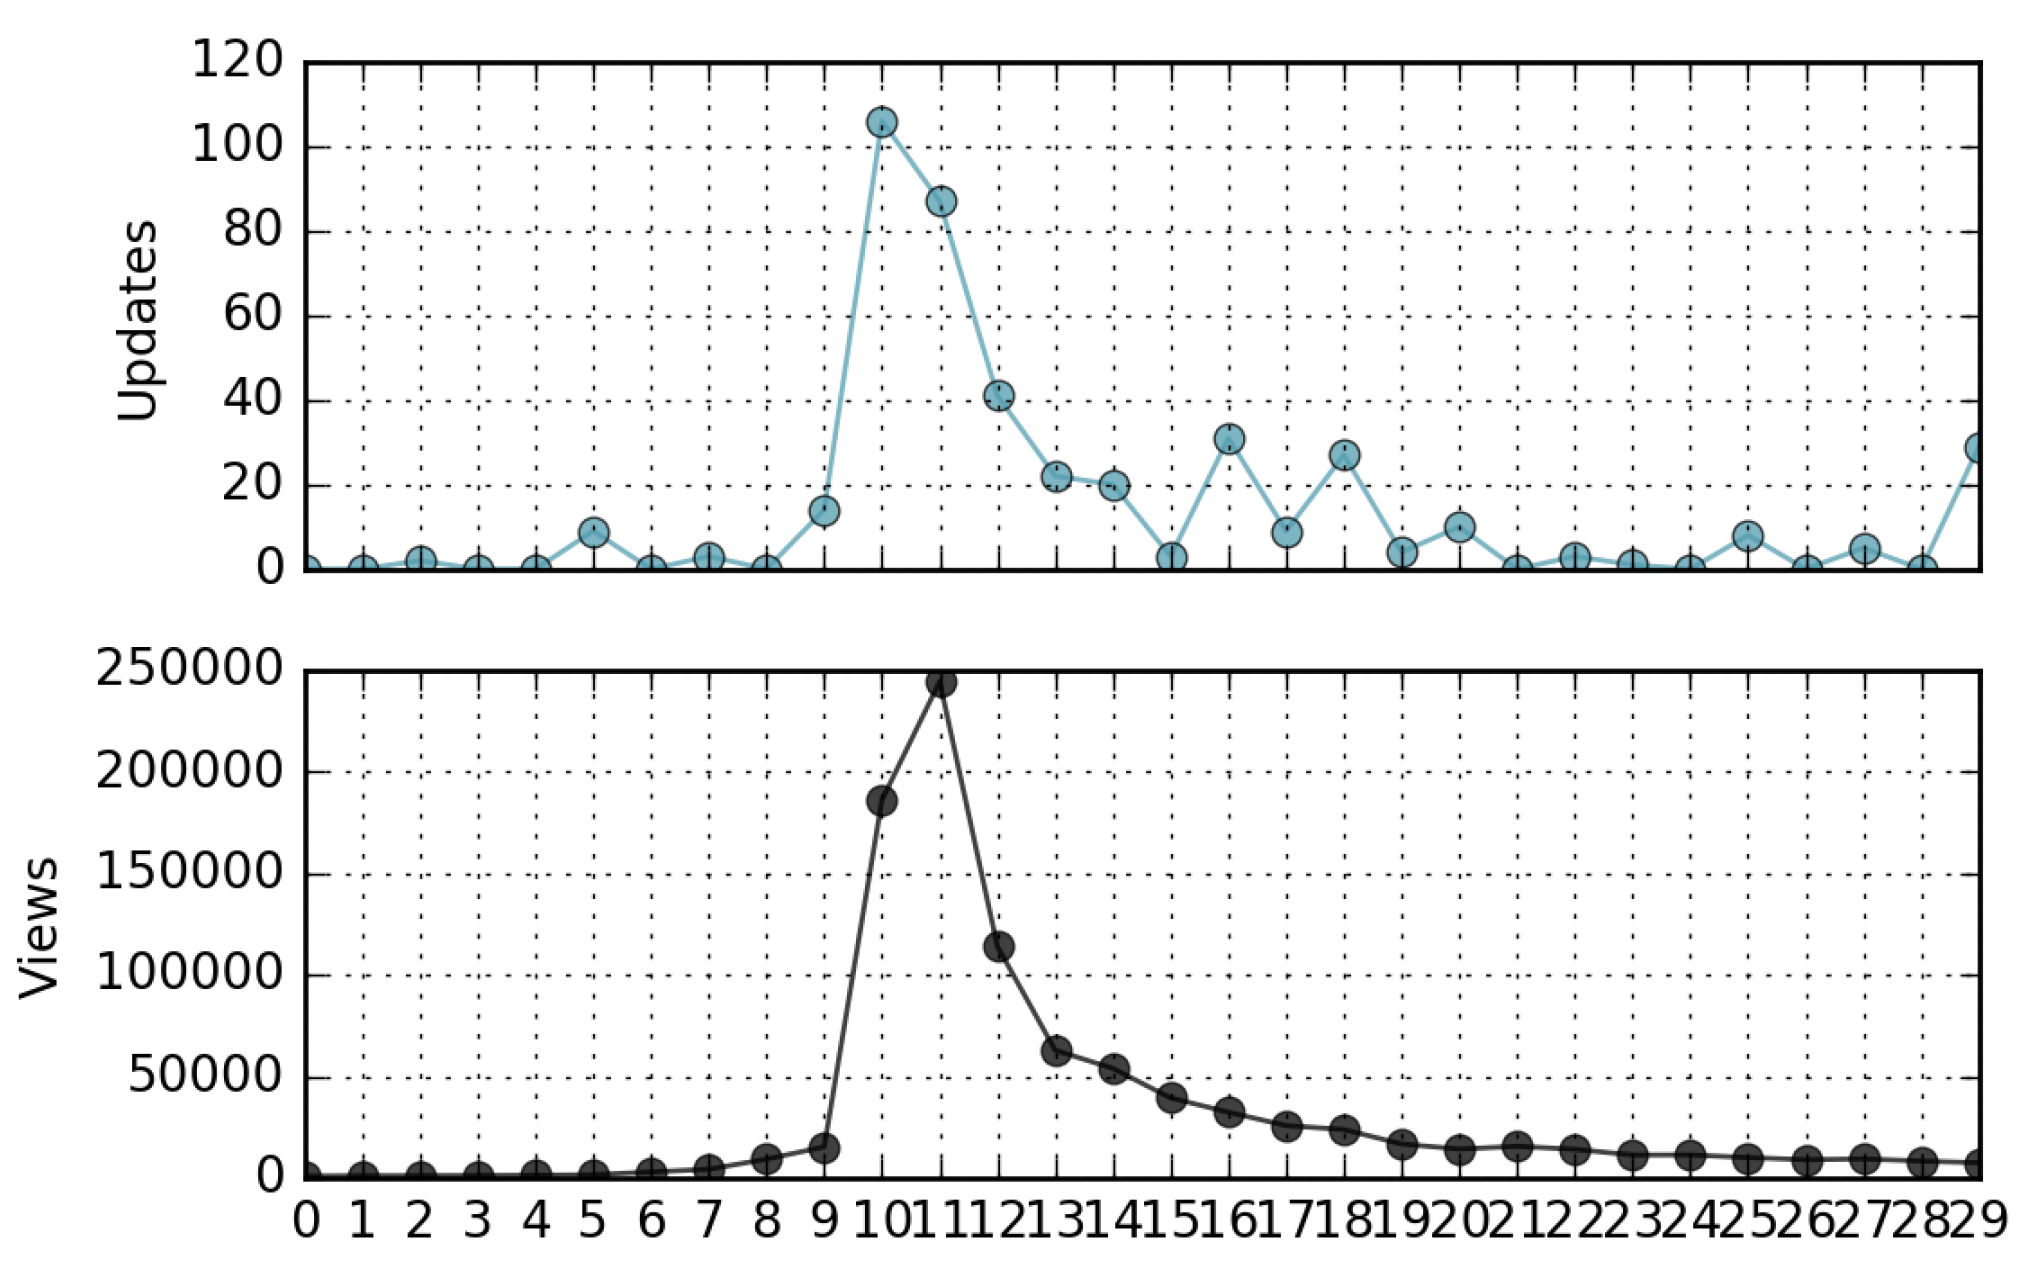
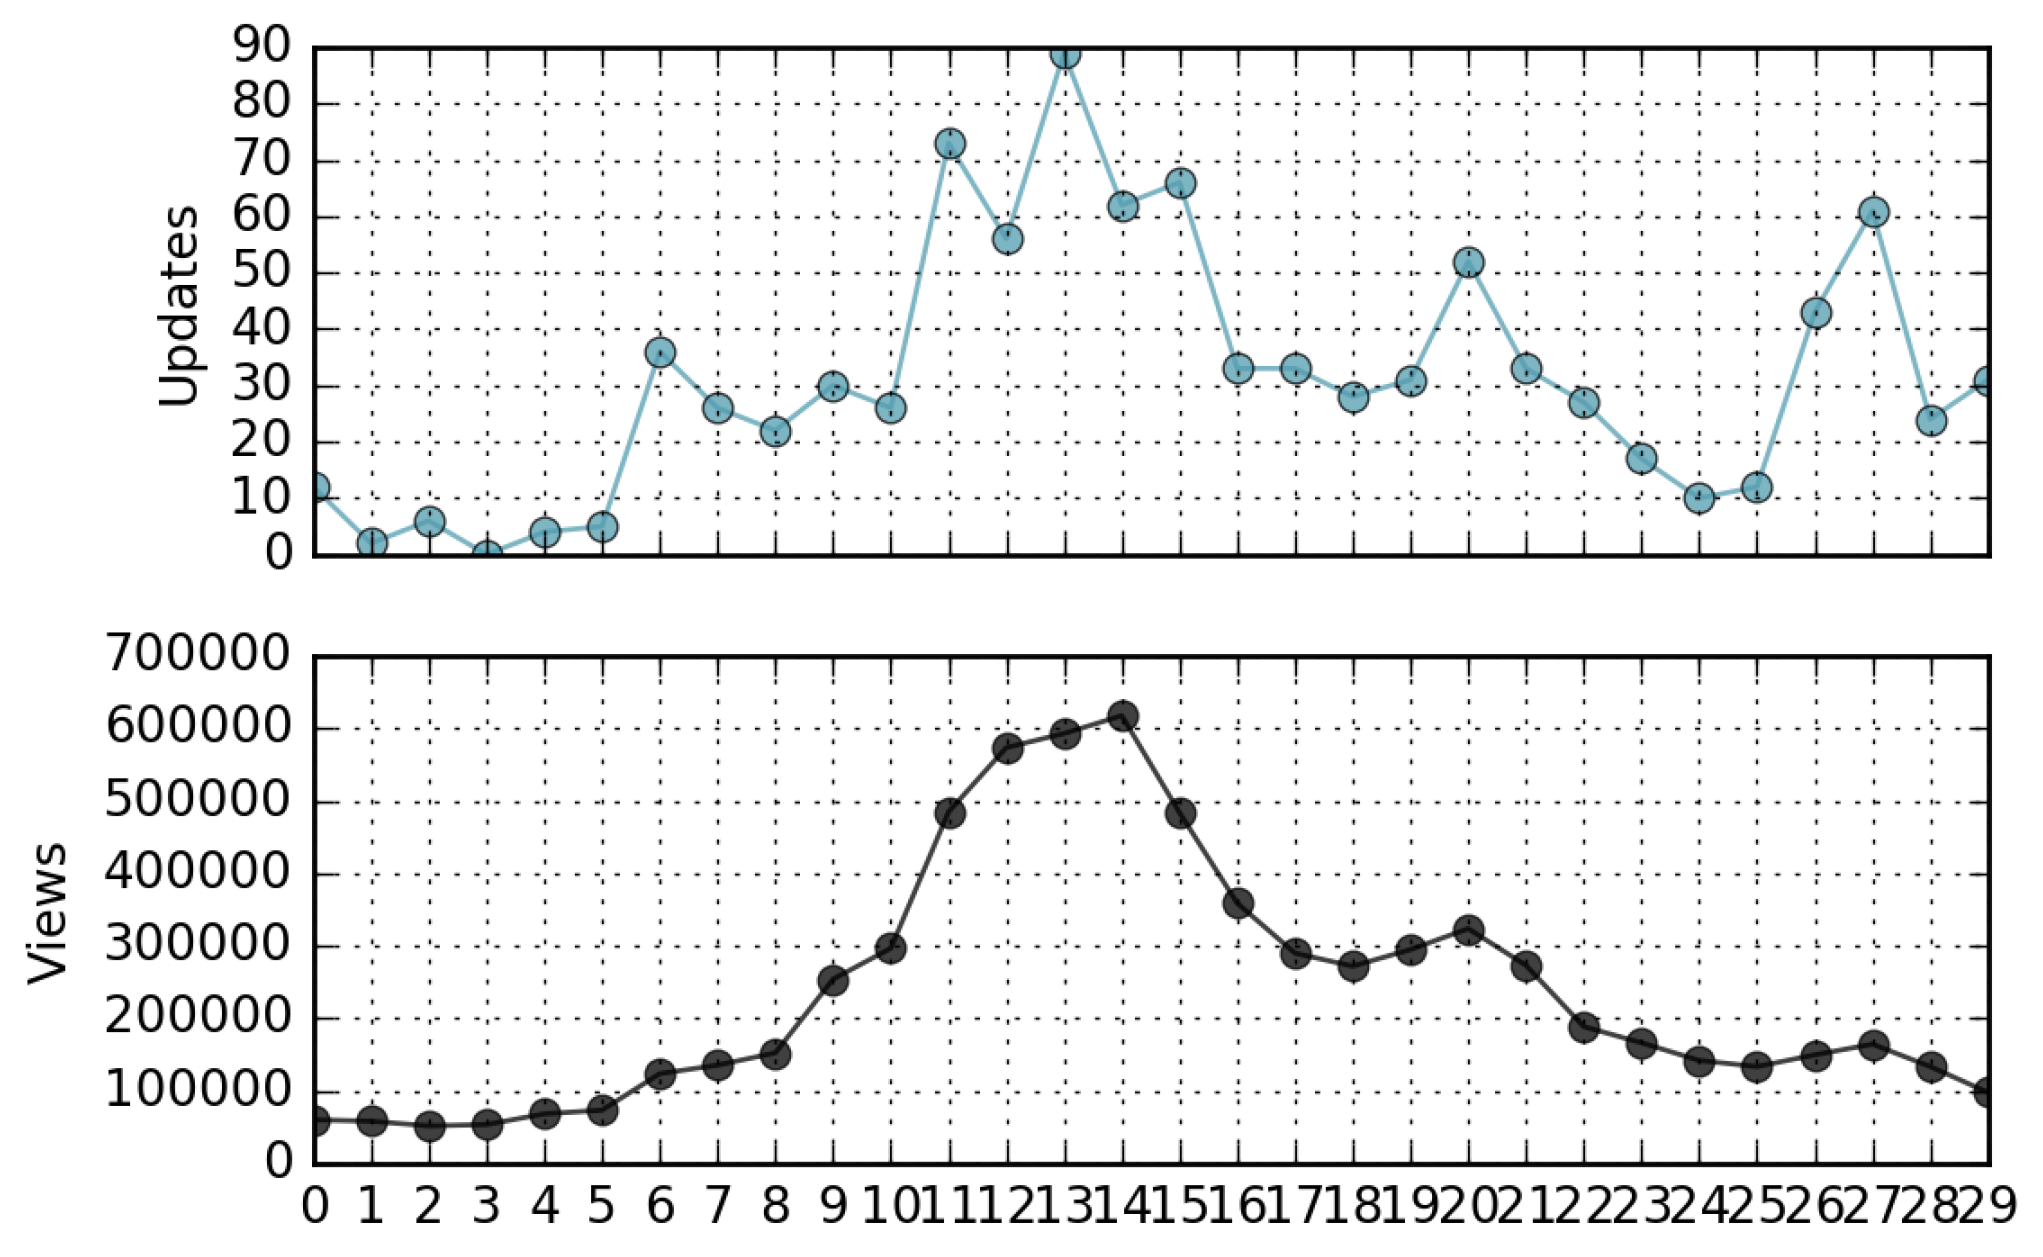
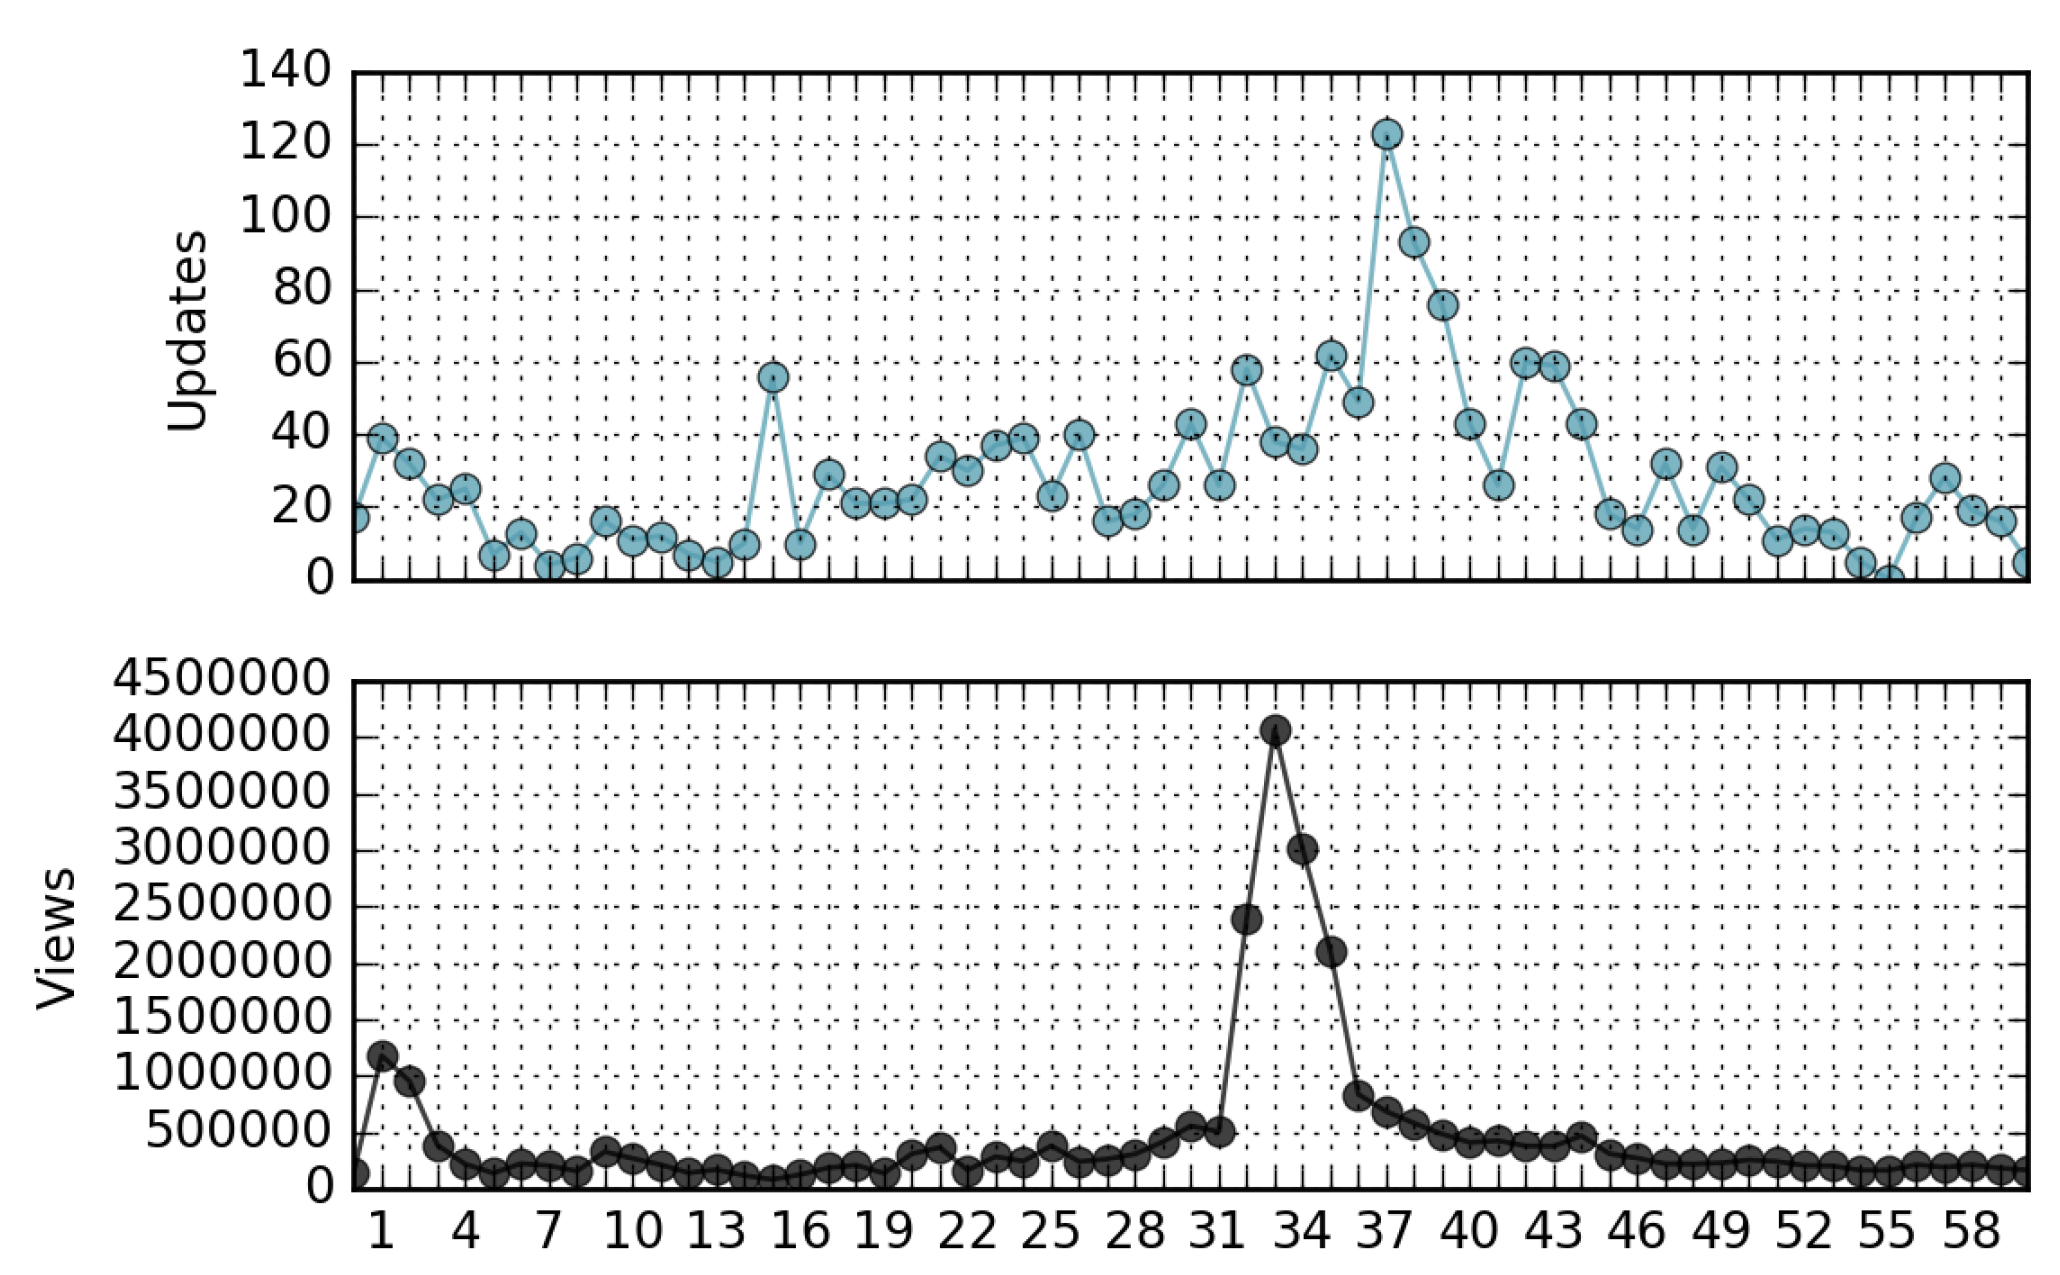
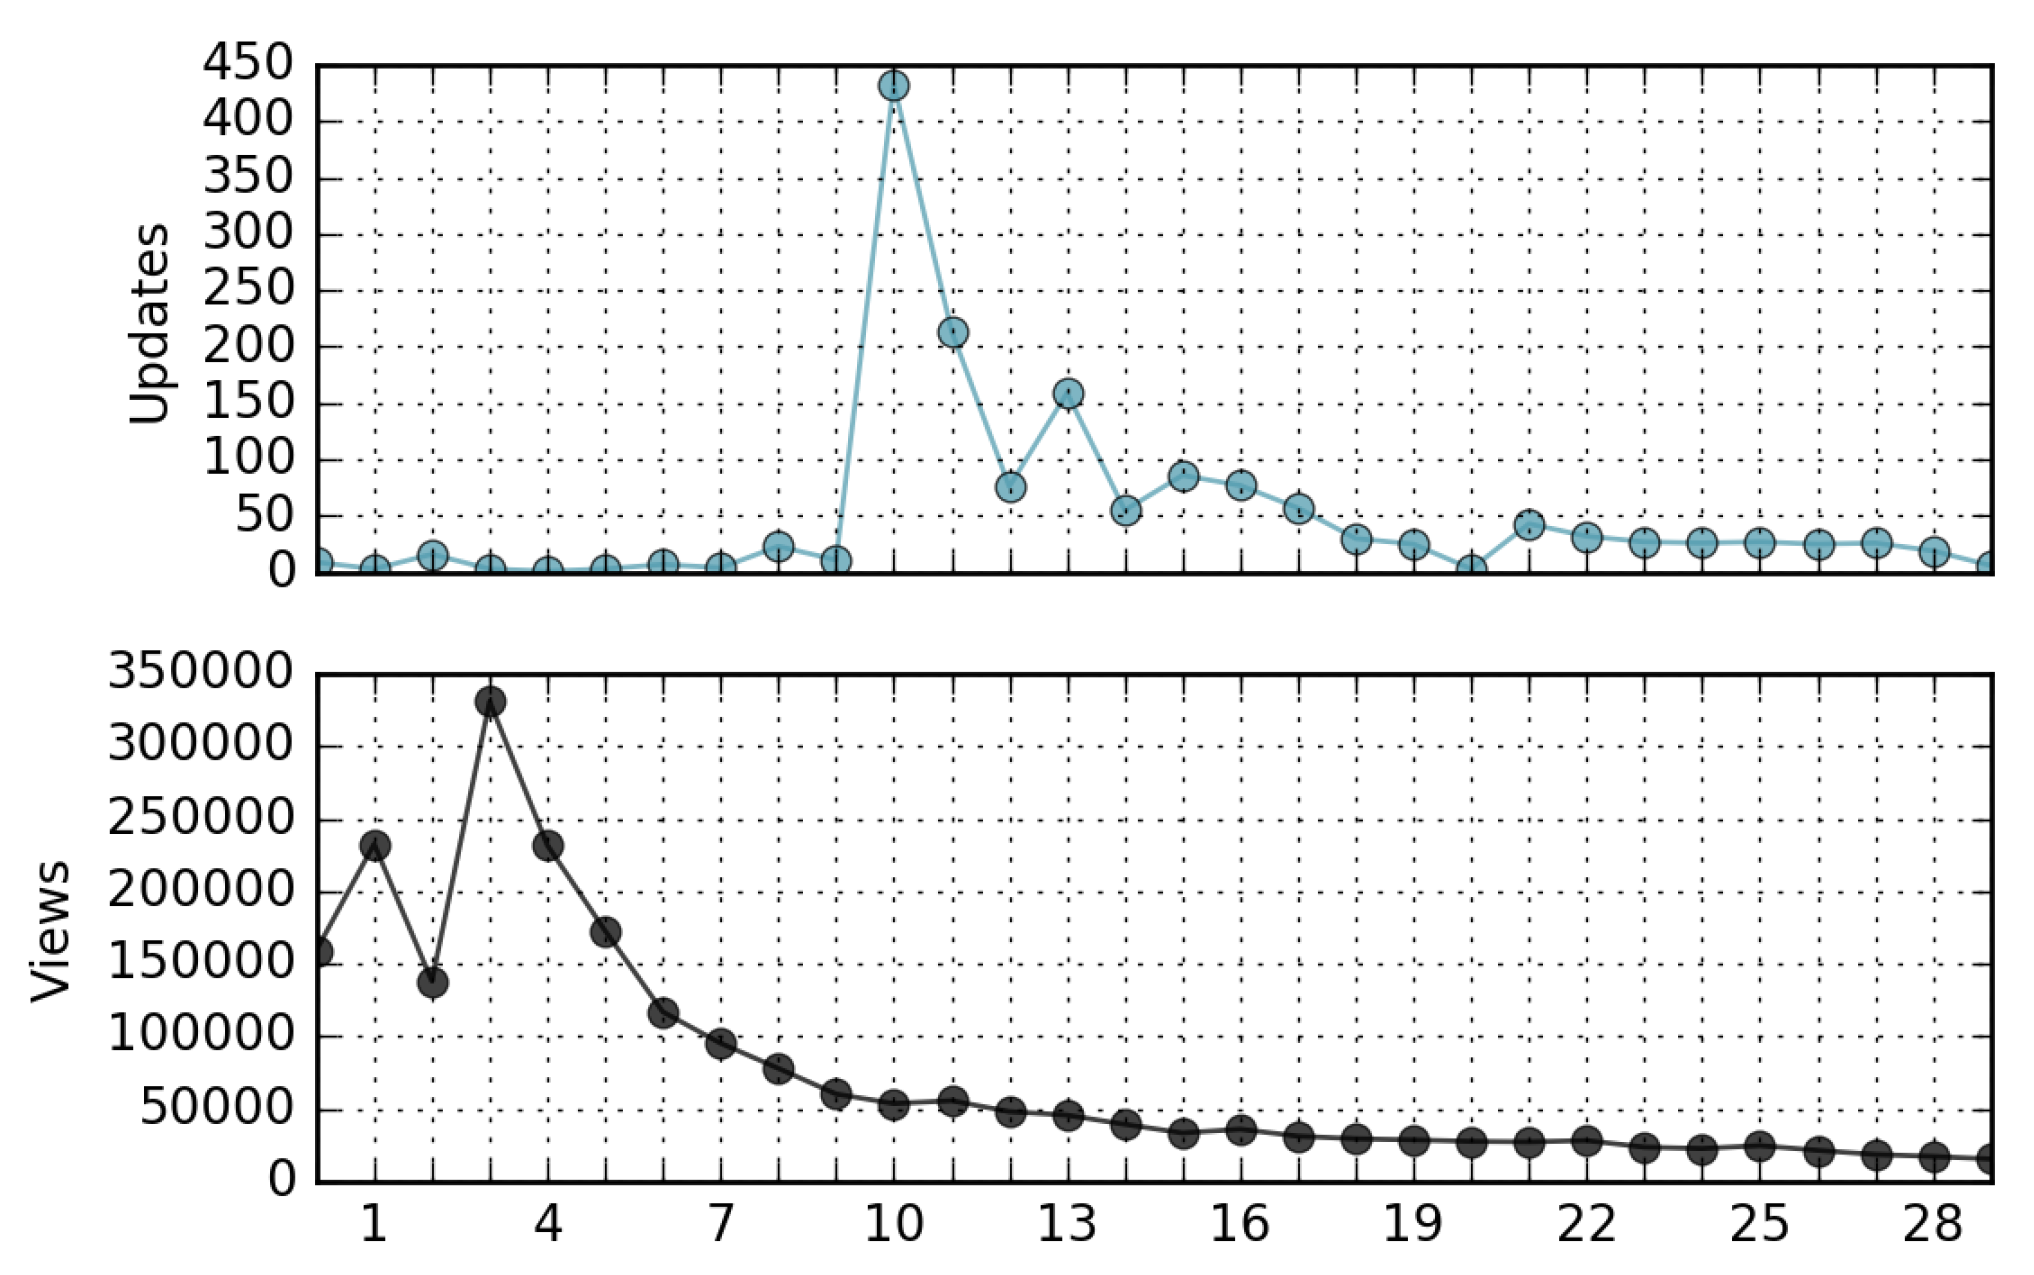
Even though a view/update rank correlation is not manifest, we observed a time correlation between views and updates of the same page, as they are the effect of the same cause. For example, Figure 9 shows the views and updates of the “Gravitational Waves” page versus time. The page received a peak of attention after scientists made the first observation of gravitational waves on 11 February 2016. Observing other pages for the same month, a similar behavior can be found. Figure 10 shows the views and updates of the page corresponding to a movie released in North America on February 12; Figure 11 is relevant to the page of the future president during the US presidential election; Figure 12 refers to a famous music album released in the same month. Analyzing these time series, we find evidence that in many cases, a peak of views is followed or preceded by a peak of updates. This information can be useful to make predictive traffic analysis, for instance, to dimension network caches [24] or to implement proactive/opportunistic data offloading [26] or prefetching activities [6].
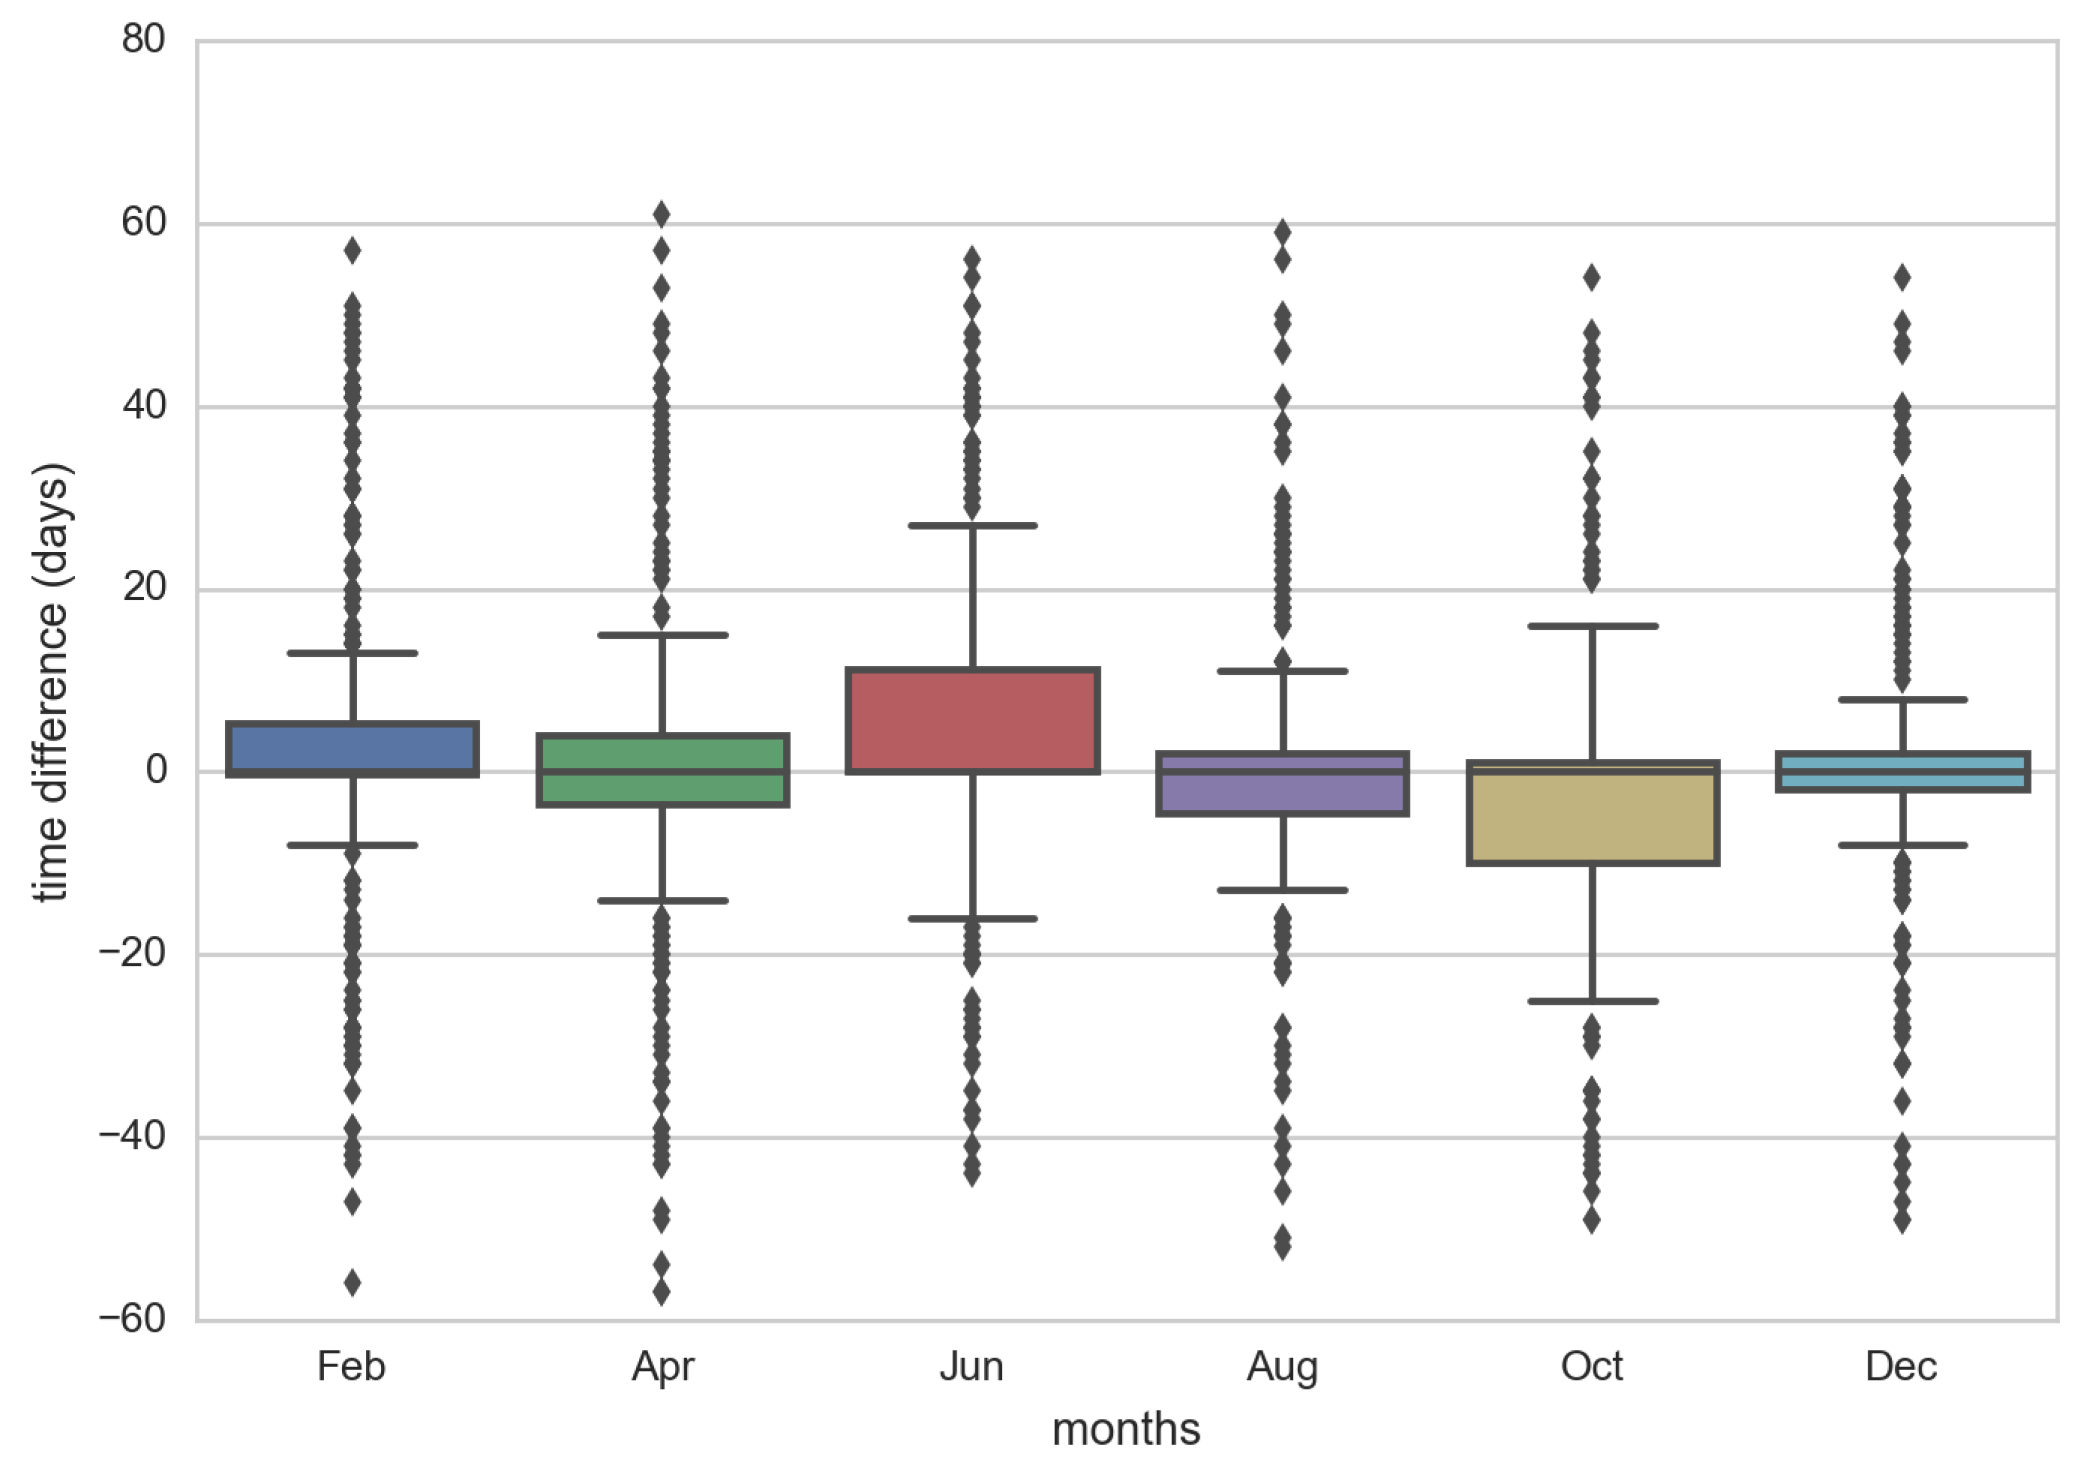
To measure the view/update–time correlation, we performed a peak analysis of views and updates, showing the result in Figure 13. To that end, we analyzed 6 months of data, considering, for each month, all of the 1000 most popular pages. For each page, we determined the day with the highest number of views of the considered month (e.g., February 2016) and the day with the highest number of updates in a period of 3 months centered on that month (e.g., from January 2016 to March 2016). Then we considered the difference between these two days and plotted the resulting distributions in Figure 13. To mitigate the effects of statistic fluctuations, we only selected the pages that received at least 10 revisions/day. As we can see in the boxplot, the median of the measurements is very close to 0, showing that peaks of views and revisions are very close to each other, on average. The boxes in the Figure represent 50% of the closest peak–peak occurrences, showing that 50% of times, a revision peak occurs within one week of the related view peak. It is worth noting that, in all of these cases, we can clearly see how the inter-times between subsequent updates is not stationary, as also observed in [2] for generic web pages.
A final analysis is aimed at ascertaining who is responsible for page views and updates. Given that nowadays, a non-negligible part of traffic comes from bots, as pointed out in [59], we measured the quantity of artificial traffic in our dataset. As for the views, Wikipedia differentiates human from spider traffic; the result is that in our dataset, 86% of views are human. As for editing bots, the problem is more complex. Currently, bots represent around 0.1% of Wikipedia editors, but the amount of editing could be a high percentage of total revisions. This varies a lot as a function of language and time [60]. Recent studies show that bots can also interact with each other, generating chain effects [59]. According to statistics presented in these papers, edits performed by bots in the English Wikipedia are around 8% of the total. Thanks to the naming convention (https://en.wikipedia.org/wiki/Wikipedia:Bot_policy), we were able to identify and count artificial revisions in our dataset, which resulted in about 1.41% of all edits. We deliberately kept the bot activity in the considered traces since, from the networking point of view, for instance, they have the same effects as human editing.
5. In-Network Caching Simulation
Content view and update statistics play an important role in performance evaluations of networking infrastructures, including caching system or prefetching strategies, and distribution networks. Indeed, when content is updated, stored copies have to be deleted or updated. In general, view statistics allow the evaluating of the benefit obtained from these systems, while update statistics permit the estimating of the loss of system efficiency and the possible cost of updating. In this section, we show how the models presented in the previous sections can be used to evaluate the performance of in-network caching, which is a key enabling technology for future networks, including 5G [61] and information-centric networking [62].
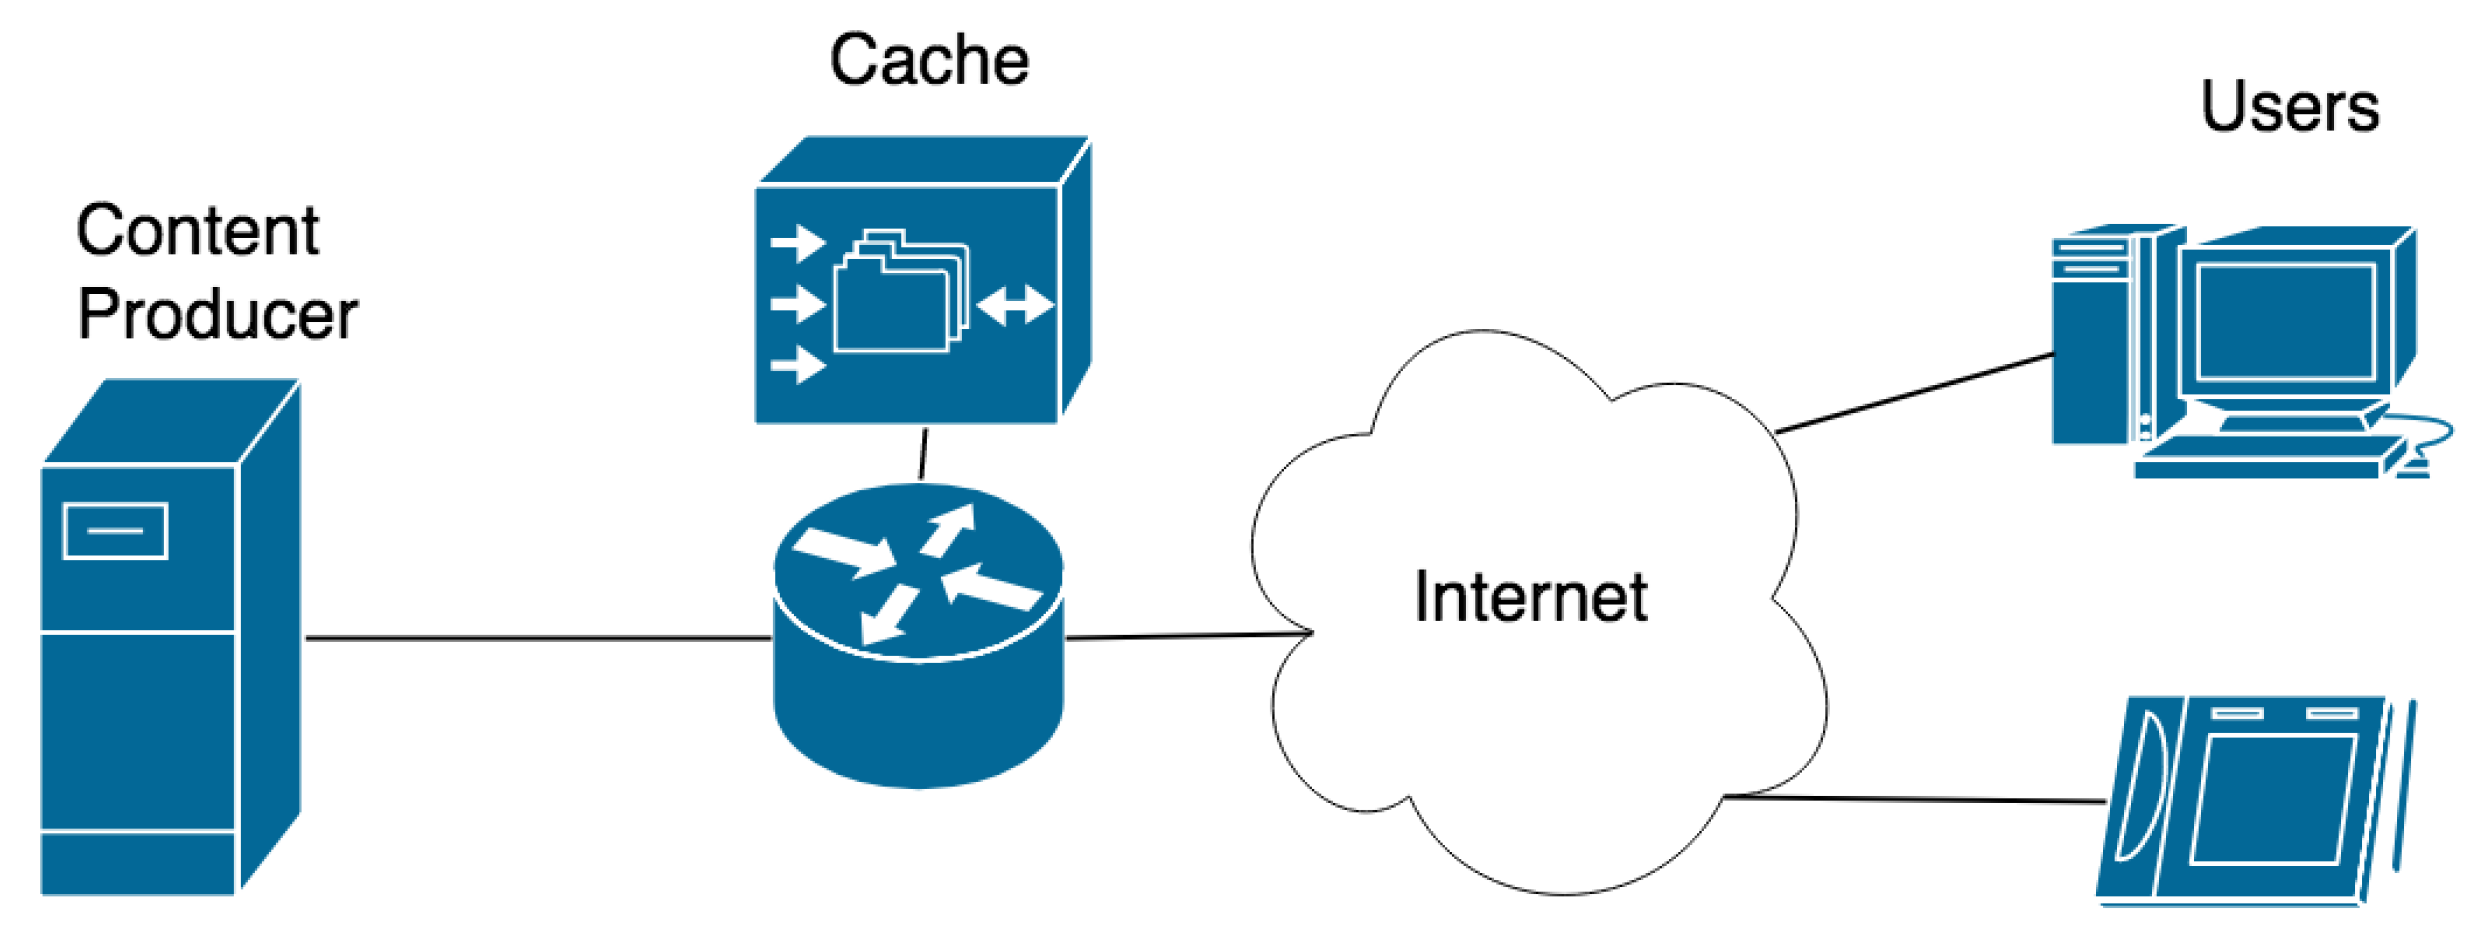
5.1. Simulation Scenario
The simulated network scenario is depicted in Figure 14. It includes a content producer that generates content requested by users through the Internet. In our case, the producer is Wikipedia and the contents are the different pages that users want to see. As shown in the figure, it can sometimes be convenient to insert a network element that stores the requested content to serve future requests in order to improve access speed and to reduce the load on the central server. However, when stored content is updated, the system must handle this event. The staleness of cached content can be managed in a proactive or reactive manner [4]. In the case of proactive invalidation, the stale item is immediately removed from the cache. Whereas in the case of reactive invalidation, the stale item will be removed only at the next request, and not immediately. Proactive invalidation usually achieves better caching performance but can be more complex from the system point of view.
In the following, we simulate a proactive invalidation scenario. We use view statistics to generate a sequence of content requests according to their popularity. We also use update statistics to generate a sequence of modification events of the contents.
5.2. Caching Replacement Policies
In this work, we consider the following tree caching replacement policies:
- The least recently used (LRU) replacement strategy uses the time of access to replace items. In a typical implementation, items are stored in a memory stack. When requested, an item is added or moved to the top of the stack, and if necessary, the last item of the stack is removed to comply with the storage limit.
- The least frequently used (LFU) replacement strategy keeps the most popular items in the cache, i.e., the items that receive most views. A simple implementation of the policy records the number of hits for each item in the cache and replaces the item with the lowest value. This strategy suffers from problems: (i) a bad estimation of the popularity of newly inserted items and (ii) the persistence of popular items in a dynamic environment, i.e., when the request’s ranking changes over time.
- Hyperbolic caching (HYP) has been recently proposed to solve some LFU issues [50]. The HYP strategy replaces the item with the lowest ratio between the number of hits and the amount of time in the cache memory : .
A cache hit occurs if, when a request arrives, the desired object is contained in the cache, otherwise a cache miss takes place. In the next section, we evaluate the cache hit probability for LRU, LFU, and hyperbolic caching strategies, taking into account the invalidation process.
5.3. Performance Results
In the simulations, we consider a cache size of items and a universe of contents composed of 10,000 ordered items; without loss of generality, we assume that objects with lower IDs are more popular than objects with higher IDs. The item’s request and invalidation frequencies are modeled according to the results of Section 4.1 and Section 4.2, respectively. To remove the correlation between popularity and invalidation frequencies, we scramble the items when calculating the invalidation rate.
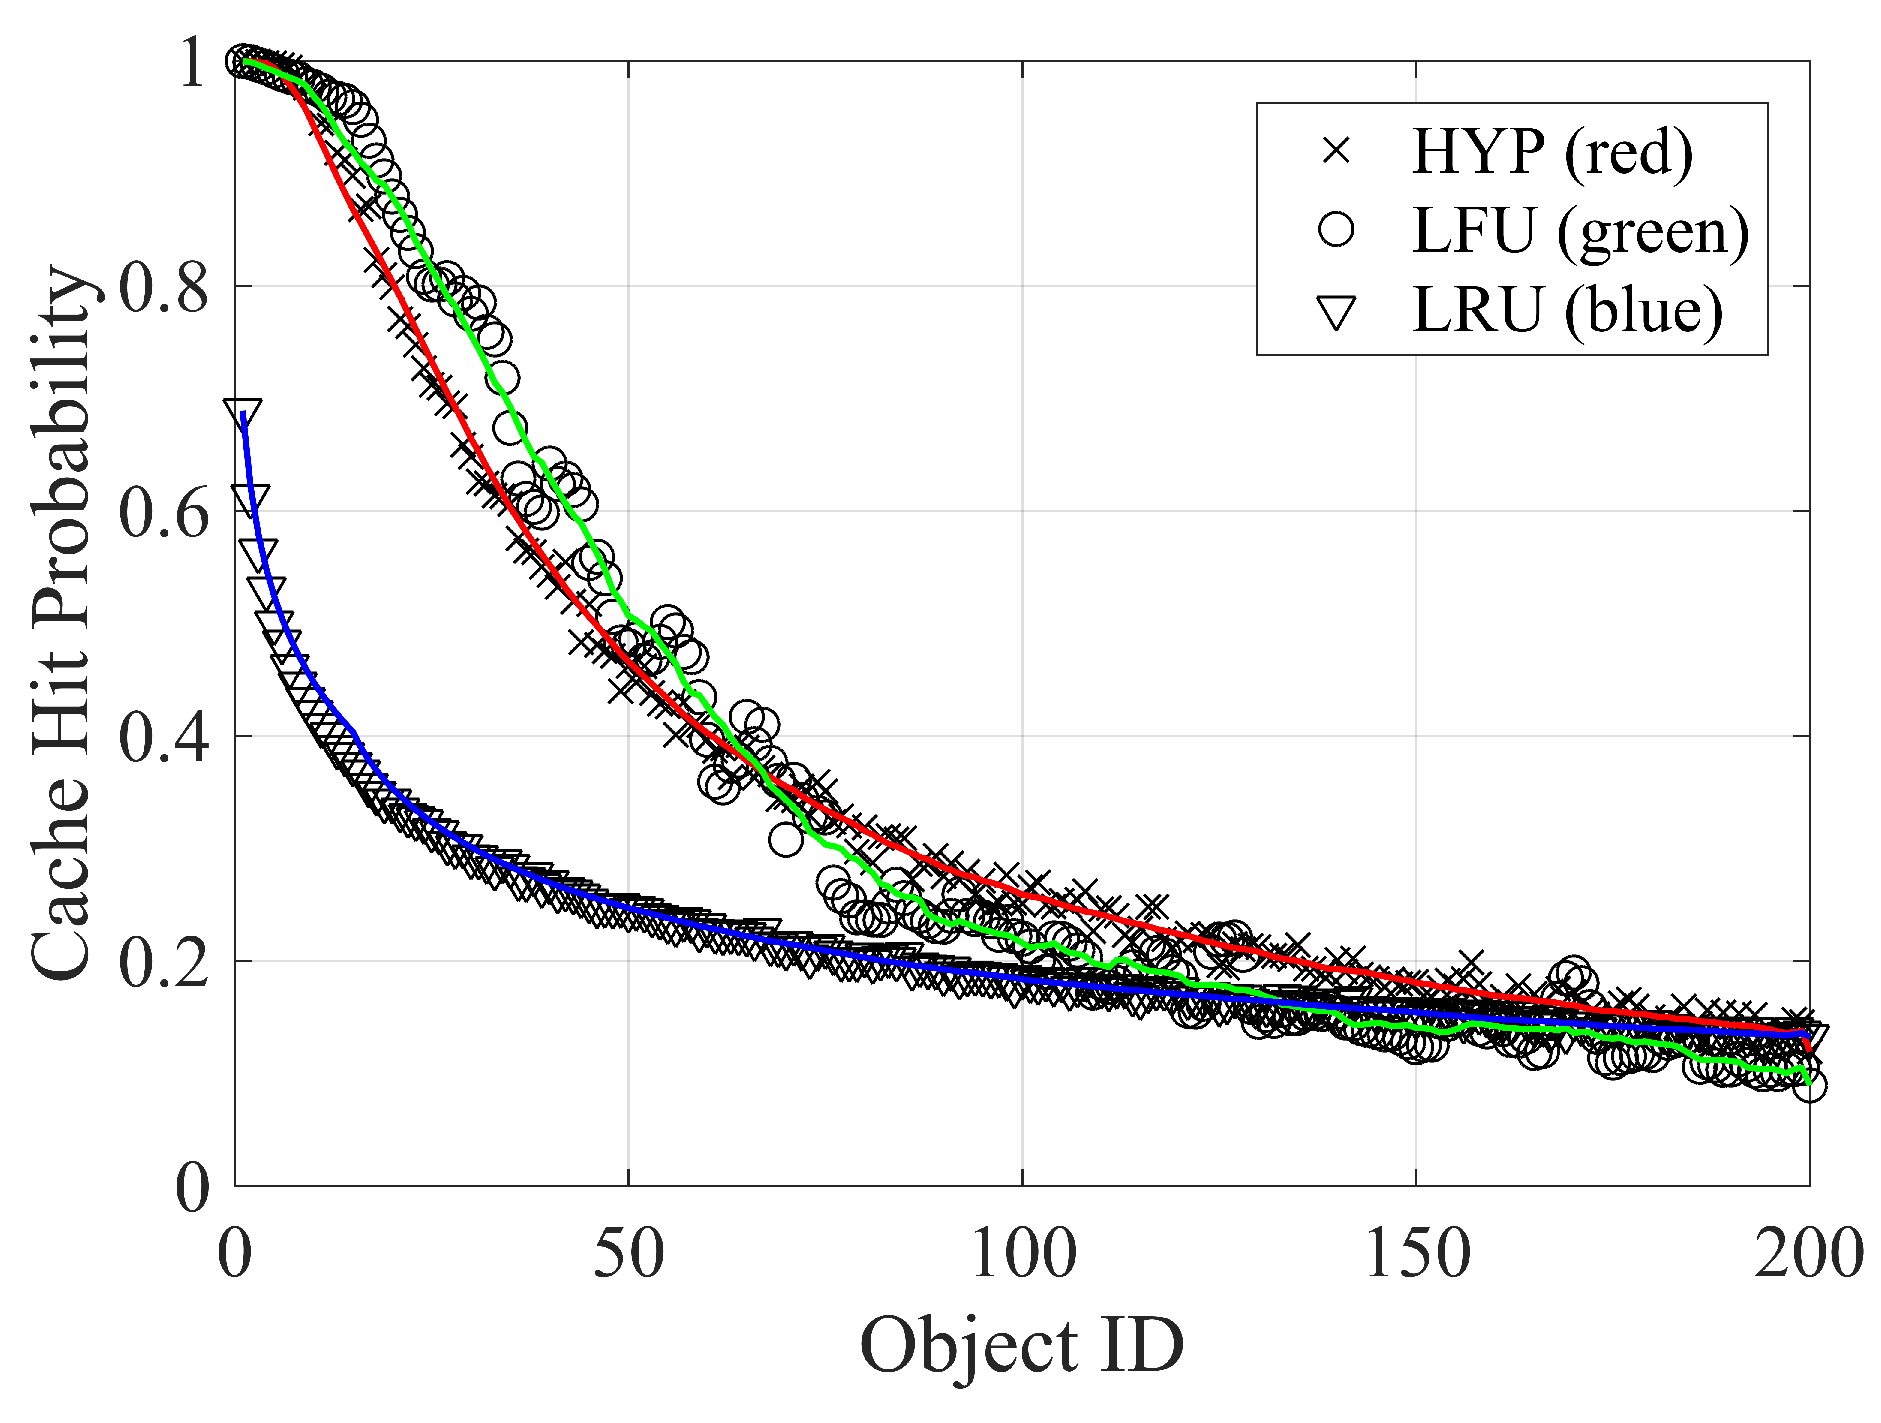
An event-based simulation is performed considering the time series of requests and invalidations. The inter-arrival request statistic is generated according to a lognormal distribution with coefficient of variation (CV) , modeling request streams with a temporal locality [63]. For each item, the average of the inter-arrival distribution is chosen according to the zipf frequency model. The inter-arrival invalidation statistic is assumed to follow an exponential distribution to simulate time-independent events. In this case, the average of such a distribution is chosen according to the lognormal model. We simulated a month of requests ( s); in Figure 15, we plot the results: the cache hit probability of the 200 most popular items for the LRU, LFU, and hyperbolic replacement policies. Continuous lines show the performance metrics trend by a moving average over the simulated results. In this case, LFU and hyperbolic have very similar performances, and invalidation does not play a significant role.
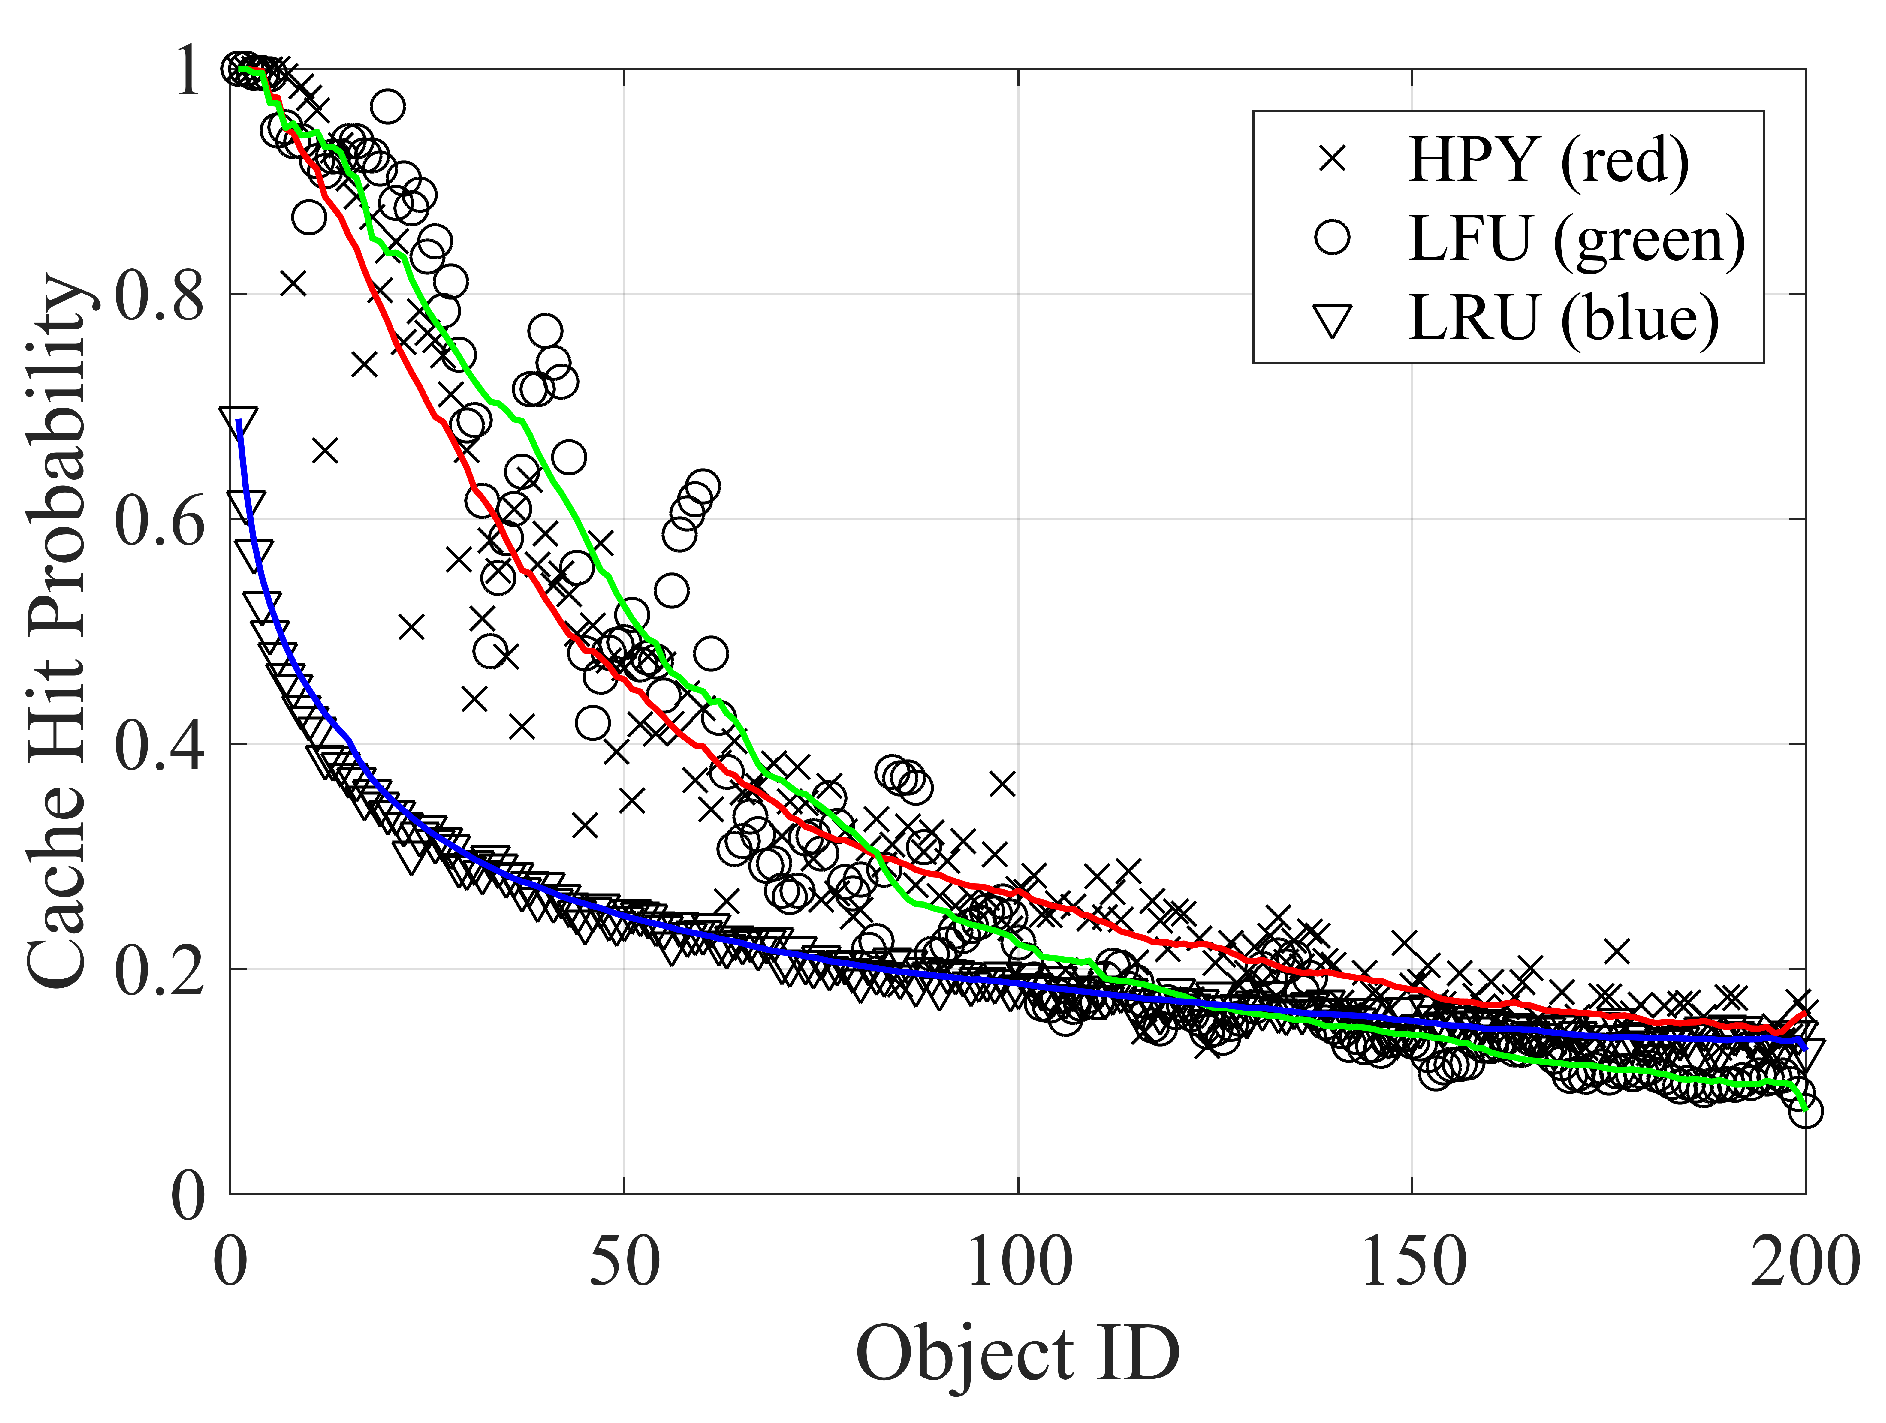
To better highlight the effect of invalidation on caching performance, in Figure 16 we plot the cache hit probability for all replacement policies, reducing the number of requests by a factor of but preserving ranking distribution. As described in [4], this scaling can be used to model a cache that is moved closer to the user. As can be noted, invalidation only affects specific items that experience a lower cache hit probability. This is due to a lack of correlation between request and invalidation statistics.
The simulations show that invalidation has a limited negative impact affecting both simulated caching scenarios, even if a slightly worse impairment is caused by the hyperbolic caching policy. The reason is that the invalidation process reduces the time that an item remains in memory (), which is one of the underlying metrics on which the HYP and LFU polices are based. This effect is put in evidence thanks to the analysis of the invalidation effect and because the latter is not correlated with the demand process. To sum up, simulations show that at least in the Wikipedia case, many network caching techniques can be used effectively since their performance is not significantly spoiled by content update events, even when caches are placed very close to requesting users.
6. Conclusions
In this work, we presented an analysis of content-update statistics of Wikipedia data. We found that update frequencies can be quite accurately described by a lognormal distribution, while we confirmed the power law (Pareto) behavior of view frequencies. We provided fitting parameters and statistical significance tests related to the chosen distributions for all of the months of 2016, analyzing a dataset of the 1000 most popular pages for each month. This result is useful for modeling and simulating content updates, deletion, and expiration. Finally, we searched for correlations between views and updates: while rankings appear to be uncorrelated, we found a time correlation between view and update peaks, with their time difference being less than a week in more than 50% of cases. This correlation can be used for predictive traffic analysis applications, which use information about peaks of updates to estimate view traffic peaks or vice versa, and for optimizing prefetching and caching functions. The derived models have been used to simulate an in-network caching scenario, showing that invalidation does not severely impair caching performance.
Author Contributions
Methodology, L.B. and P.L.; software, P.L. and L.B.; Formal analysis: A.D. and L.B.; writing—original draft preparation, P.L. and L.B.; Supervision: N.B.M. and A.D.; Writing—review and editing: N.B.M.
Funding
This work was partly funded by the EU-JP H2020 ICN2020 project.
Conflicts of Interest
The authors declare no conflict of interest. The funders had no role in the design of the study; in the collection, analyses, or interpretation of data; in the writing of the manuscript, or in the decision to publish the results.
References
- Breslau, L.; Cao, P.; Fan, L.; Phillips, G.; Shenker, S. Web caching and Zipf-like distributions: Evidence and implications. In Proceedings of the IEEE International Conference on Computer Communications 1999 (INFOCOM’99), New York, NY, USA, 21–25 March 1999; pp. 126–134. [Google Scholar]
- Cho, J.; Garcia Molina, H. Estimating frequency of change. ACM Trans. Internet Technol. 2003, 3, 256–290. [Google Scholar] [CrossRef]
- Wu, H.; Li, J.; Zhi, J.; Ren, Y.; Li, L. Design and evaluation of probabilistic caching in information-centric networking. IEEE Access 2018, 6, 32754–32768. [Google Scholar] [CrossRef]
- Detti, A.; Bracciale, L.; Loreti, P.; Melazzi, N.B. Modeling LRU cache with invalidation. Comput. Netw. 2018, 134, 55–65. [Google Scholar] [CrossRef]
- Bracciale, L.; Loreti, P.; Detti, A.; Paolillo, R.; Melazzi, N.B. Lightweight Named Object: An ICN-based Abstraction for IoT Device Programming and Management. IEEE Internet Things J. 2019, 6, 5029–5039. [Google Scholar] [CrossRef]
- Bastug, E.; Bennis, M.; Debbah, M. Living on the edge: The role of proactive caching in 5G wireless networks. IEEE Commun. Mag. 2014, 52, 82–89. [Google Scholar] [CrossRef] [Green Version]
- Chen, M.; Qian, Y.; Hao, Y.; Li, Y.; Song, J. Data-driven computing and caching in 5G networks: Architecture and delay analysis. IEEE Wirel. Commun. 2018, 25, 70–75. [Google Scholar] [CrossRef]
- Ibrahimi, K.; Serbouti, Y. Prediction of the content popularity in the 5G network: Auto-regressive, moving-average and exponential smoothing approaches. In Proceedings of the 2017 International Conference on Wireless Networks and Mobile Communications, Rabat, Morocco, 1–4 November 2017; pp. 1–7. [Google Scholar]
- Jiang, W.; Feng, G.; Qin, S.; Liu, Y. Multi-Agent Reinforcement Learning Based Cooperative Content Caching for Mobile Edge Networks. IEEE Access 2019, 7, 61856–61867. [Google Scholar] [CrossRef]
- Garg, N.; Bhatia, V.; Bharath, B.; Sellathurai, M.; Ratnarajah, T. Online Learning Models for Content Popularity Prediction In Wireless Edge Caching. arXiv 2019, arXiv:1901.06476. [Google Scholar]
- Li, X.; Cline, D.B.; Loguinov, D. Temporal update dynamics under blind sampling. IEEE/ACM Trans. Netw. 2017, 25, 363–376. [Google Scholar] [CrossRef]
- Sun, Y.; Uysal-Biyikoglu, E.; Yates, R.D.; Koksal, C.E.; Shroff, N.B. Update or wait: How to keep your data fresh. IEEE Trans. Inf. Theory 2017, 63, 7492–7508. [Google Scholar] [CrossRef]
- Kayaaslan, E.; Cambazoglu, B.B.; Aykanat, C. Document replication strategies for geographically distributed web search engines. Inf. Process. Manag. 2013, 49, 51–66. [Google Scholar] [CrossRef] [Green Version]
- Trattner, C.; Kusmierczyk, T.; Nørvåg, K. Investigating and predicting online food recipe upload behavior. Inf. Process. Manag. 2019, 56, 654–673. [Google Scholar] [CrossRef]
- Li, X.; de Rijke, M. Characterizing and predicting downloads in academic search. Inf. Process. Manag. 2019, 56, 394–407. [Google Scholar] [CrossRef]
- Clauset, A.; Shalizi, C.R.; Newman, M.E. Power-law distributions in empirical data. SIAM Rev. 2009, 51, 661–703. [Google Scholar] [CrossRef]
- Goslin, K.; Hofmann, M. A Wikipedia powered state-based approach to automatic search query enhancement. Inf. Process. Manag. 2018, 54, 726–739. [Google Scholar] [CrossRef]
- Ryu, P.M.; Jang, M.G.; Kim, H.K. Open domain question answering using Wikipedia-based knowledge model. Inf. Process. Manag. 2014, 50, 683–692. [Google Scholar] [CrossRef]
- Hasslinger, G.; Kunbaz, M.; Hasslinger, F.; Bauschert, T. Web caching evaluation from wikipedia request statistics. In Proceedings of the 15th International Symposium on Modeling and Optimization in Mobile, Ad Hoc, and Wireless Networks (WiOpt), Paris, France, 15–19 May 2017; pp. 1–6. [Google Scholar]
- Cheng, X.; Dale, C.; Liu, J. Statistics and Social Network of YouTube Videos. In Proceedings of the 16th Interntional Workshop on Quality of Service, Enschede, The Netherlands, 2–4 June 2008; pp. 229–238. [Google Scholar]
- Gill, P.; Arlitt, M.; Li, Z.; Mahanti, A. Youtube Traffic Characterization: A View from the Edge. In Proceedings of the 7th ACM SIGCOMM Conference on Internet Measurement, San Diego, CA, USA, 24–26 October 2007; pp. 15–28. [Google Scholar]
- Mitzenmacher, M. A brief history of generative models for power law and lognormal distributions. Internet Math. 2004, 1, 226–251. [Google Scholar] [CrossRef]
- Cao, G. Proactive power-aware cache management for mobile computing systems. IEEE Trans. Comput. 2002, 51, 608–621. [Google Scholar]
- Detti, A.; Bracciale, L.; Loreti, P.; Rossi, G.; Melazzi, N.B. A cluster-based scalable router for information centric networks. Comput. Netw. 2018, 142, 24–32. [Google Scholar] [CrossRef]
- Detti, A.; Orru, M.; Paolillo, R.; Rossi, G.; Loreti, P.; Bracciale, L.; Melazzi, N.B. Application of information centric networking to nosql databases: The spatio-temporal use case. In Proceedings of the 2017 IEEE International Symposium on Local and Metropolitan Area Networks (LANMAN), Osaka, Japan, 12–14 June 2017; pp. 1–6. [Google Scholar]
- Bracciale, L.; Loreti, P.; Bianchi, G. Human time-scale duty cycle for opportunistic wifi based mobile networks. In Proceedings of the 24th Tyrrhenian International Workshop on Digital Communications-Green ICT (TIWDC), Genoa, Italy, 23–25 September 2013; pp. 1–6. [Google Scholar]
- Lam, S.T.K.; Riedl, J. Is Wikipedia growing a longer tail? In Proceedings of the ACM 2009 International Conference on Supporting Group Work, Sanibel Island, FL, USA, 10–13 May 2009; pp. 105–114. [Google Scholar]
- Ihm, S.; Pai, V.S. Towards understanding modern web traffic. In Proceedings of the 2011 ACM SIGCOMM Internet Measurement Conference, Berlin, Germany, 2–4 November 2011; pp. 295–312. [Google Scholar]
- Hoiles, W.; Aprem, A.; Krishnamurthy, V. Engagement and Popularity Dynamics of YouTube Videos and Sensitivity to Meta-Data. IEEE Trans. Knowl. Data Eng. 2017, 29, 1426–1437. [Google Scholar] [CrossRef]
- Park, M.; Naaman, M.; Berger, J. A data-driven study of view duration on youtube. In Proceedings of the Tenth International AAAI Conference on Web and Social Media, Cologne, Germany, 17–20 May 2016. [Google Scholar]
- Ponzetto, S.; Strube, M. Wikirelate! computing semantic relatedness using wikipedia. In Proceedings of the Twenty-First National Conference on Artificial Intelligence and the Eighteenth Innovative Applications Artificial Intelligence Conference, Boston, MA, USA, 16–20 July 2006. [Google Scholar]
- Witten, I.; Milne, D. An effective, low-cost measure of semantic relatedness obtained from Wikipedia links. In Proceedings of the AAAI Workshop on Wikipedia and Artificial Intelligence: An Evolving Synergy, Chicago, IL, USA, 13–17 July 2008; pp. 25–30. [Google Scholar]
- Gabrilovich, E.; Markovitch, S. Computing semantic relatedness using wikipedia-based explicit semantic analysis. In Proceedings of the Twentieth International Joint Conference on Artificial Intelligence (IJcAI), Hyderabad, India, 6–12 January 2007; pp. 1606–1611. [Google Scholar]
- Suh, B.; Chi, E.H.; Pendleton, B.A.; Kittur, A. Us vs. Them: Understanding Social Dynamics in Wikipedia with Revert Graph Visualizations. In Proceedings of the 2007 IEEE Symposium on Visual Analytics Science and Technology, Sacramento, CA, USA, 30 October–1 November 2007; pp. 163–170. [Google Scholar]
- Iba, T.; Nemoto, K.; Peters, B.; Gloor, P.A. Analyzing the Creative Editing Behavior of Wikipedia Editors: Through Dynamic Social Network Analysis. Procedia-Soc. Behav. Sci. 2010, 2, 6441–6456. [Google Scholar] [Green Version]
- Suh, B.; Chi, E.H.; Kittur, A.; Pendleton, B.A. Lifting the Veil: Improving Accountability and Social Transparency in Wikipedia with Wikidashboard. In Proceedings of the SIGCHI Conference on Human Factors in Computing Systems, Florence, Italy, 5–10 April 2008; pp. 1037–1040. [Google Scholar]
- Masucci, A.P.; Kalampokis, A.; Eguíluz, V.M.; Hernández-García, E. Wikipedia information flow analysis reveals the scale-free architecture of the semantic space. PLoS ONE 2011, 6, e17333. [Google Scholar] [CrossRef] [PubMed]
- Singer, P.; Lemmerich, F.; West, R.; Zia, L.; Wulczyn, E.; Strohmaier, M.; Leskovec, J. Why we read wikipedia. In Proceedings of the 26th International Conference on World Wide Web. International World Wide Web Conferences Steering Committee, Perth, Australia, 3–7 April 2017; pp. 1591–1600. [Google Scholar]
- Kämpf, M.; Tessenow, E.; Kenett, D.Y.; Kantelhardt, J.W. The detection of emerging trends using Wikipedia traffic data and context networks. PLoS ONE 2015, 10, e0141892. [Google Scholar] [CrossRef] [PubMed]
- Lehmann, J.; Müller-Birn, C.; Laniado, D.; Lalmas, M.; Kaltenbrunner, A. Reader preferences and behavior on Wikipedia. In Proceedings of the 25th ACM Conference on Hypertext and Social Media, Santiago, Chile, 1–4 September 2014; pp. 88–97. [Google Scholar]
- Warncke-Wang, M.; Ranjan, V.; Terveen, L.; Hecht, B. Misalignment between supply and demand of quality content in peer production communities. In Proceedings of the Ninth International AAAI Conference on Web and Social Media, Palo Alto, CL, USA, 26–29 May 2015. [Google Scholar]
- Capiluppi, A.; Pimentel, A.C.D.; Boldyreff, C. Patterns of creation and usage of Wikipedia content. In Proceedings of the 2012 14th IEEE International Symposium on Web Systems Evolution (WSE), Trento, Italy, 28 September 2012; pp. 85–89. [Google Scholar]
- ten Thij, M.; Volkovich, Y.; Laniado, D.; Kaltenbrunner, A. Modeling page-view dynamics on Wikipedia. arXiv 2012, arXiv:1212.5943. [Google Scholar]
- Ratkiewicz, J.; Menczer, F.; Fortunato, S.; Flammini, A.; Vespignani, A. Traffic in social media ii: Modeling bursty popularity. In Proceedings of the 2010 IEEE Second International Conference on Social Computing, Minneapolis, MN, USA, 20–22 August 2010; pp. 393–400. [Google Scholar]
- Wilkinson, D.M.; Huberman, B.A. Cooperation and quality in wikipedia. In Proceedings of the 2007 International Symposium on Wikis, Montreal, QC, Canada, 21–23 October 2007; pp. 157–164. [Google Scholar]
- Urdaneta, G.; Pierre, G.; Van Steen, M. Wikipedia workload analysis for decentralized hosting. Comput. Netw. 2009, 53, 1830–1845. [Google Scholar] [CrossRef] [Green Version]
- Ali, W.; Shamsuddin, S.M.; Ismail, A.S. A survey of web caching and prefetching. Int. J. Adv. Soft Comput. Appl. 2011, 3, 18–44. [Google Scholar]
- Giatsoglou, N.; Ntontin, K.; Kartsakli, E.; Antonopoulos, A.; Verikoukis, C. D2D-aware device caching in mmWave-cellular networks. IEEE J. Sel. Areas Commun. 2017, 35, 2025–2037. [Google Scholar] [CrossRef]
- Loreti, P.; Bracciale, L. Optimized Neighbor Discovery for Opportunistic Networks of Energy Constrained IoT Devices. IEEE Trans. Wirel. Commun. 2019. [Google Scholar] [CrossRef]
- Blankstein, A.; Sen, S.; Freedman, M.J. Hyperbolic caching: Flexible caching for web applications. In Proceedings of the 2017 USENIX Annual Technical Conference, Santa Clara, CA, USA, 12–14 July 2017; pp. 499–511. [Google Scholar]
- Hasslinger, G.; Ntougias, K.; Hasslinger, F.; Hohlfeld, O. Performance evaluation for new web caching strategies combining LRU with score based object selection. Comput. Netw. 2017, 125, 172–186. [Google Scholar] [CrossRef]
- Balamash, A.; Krunz, M. An overview of web caching replacement algorithms. IEEE Commun. Surv. Tutor. 2004, 6, 44–56. [Google Scholar] [CrossRef]
- Fofack, N.C.; Nain, P.; Neglia, G.; Towsley, D. Analysis of TTL-based cache networks. In Proceedings of the 6th International ICST Conference on Performance Evaluation Methodologies and Tools, Cargese, France, 9–12 October 2012; pp. 1–10. [Google Scholar]
- Sornette, D. Critical Phenomena In Natural Sciences: Chaos, Fractals, Selforganization and Disorder: Concepts and Tools; Springer Science Business Media: New York, NY, USA, 2006. [Google Scholar]
- Newman, M.E. Power laws, Pareto distributions and Zipf’s law. Contemp. Phys. 2005, 46, 323–351. [Google Scholar] [CrossRef]
- Sobkowicz, P.; Thelwall, M.; Buckley, K.; Paltoglou, G.; Sobkowicz, A. Lognormal distributions of user post lengths in Internet discussions-a consequence of the Weber-Fechner law? EPJ Data Sci. 2013, 2, 2. [Google Scholar] [CrossRef]
- Reed, W.J.; Jorgensen, M. The double Pareto-lognormal distribution-a new parametric model for size distributions. Commun. Stat.-Theory Methods 2004, 33, 1733–1753. [Google Scholar] [CrossRef]
- Alstott, J.; Bullmore, E.; Plenz, D. Powerlaw: A Python package for analysis of heavy-tailed distributions. PLoS ONE 2014, 9, e85777. [Google Scholar] [CrossRef] [PubMed]
- Tsvetkova, M.; García-Gavilanes, R.; Floridi, L.; Yasseri, T. Even good bots fight: The case of Wikipedia. PLoS ONE 2017, 12, e0171774. [Google Scholar] [CrossRef] [PubMed]
- Steiner, T. Bots vs. wikipedians, anons vs. logged-ins. In Proceedings of the 23rd International Conference on World Wide Web, Seoul, Korea, 7–11 April 2014; pp. 547–548. [Google Scholar]
- Poularakis, K.; Iosifidis, G.; Sourlas, V.; Tassiulas, L. Exploiting Caching and Multicast for 5G Wireless Networks. IEEE Trans. Wirel. Commun. 2016, 15, 2995–3007. [Google Scholar] [CrossRef]
- Wang, W.; Sun, Y.; Guo, Y.; Kaafar, D.; Jin, J.; Li, J.; Li, Z. CRCache: Exploiting the correlation between content popularity and network topology information for ICN caching. In Proceedings of the 2014 IEEE International Conference on Communications (ICC), Sydney, Australia, 10–14 June 2014; pp. 3191–3196. [Google Scholar]
- Almeida, V.; Bestavros, A.; Crovella, M.; De Oliveira, A. Characterizing reference locality in the WWW. In Proceedings of the Fourth International Conference on Parallel and Distributed Information Systems, Miami Beach, FL, USA, 18–20 December 1996; pp. 92–103. [Google Scholar]
Figure 1.
Complementary cumulative distribution function (CCDF) of page views computed for the 1000 most popular Wikipedia pages in July 2016.
Figure 1.
Complementary cumulative distribution function (CCDF) of page views computed for the 1000 most popular Wikipedia pages in July 2016.

Figure 2.
Estimation of the Pareto-shaped parameter and the related p-value of the 1000 most popular Wikipedia pages in 2016.
Figure 2.
Estimation of the Pareto-shaped parameter and the related p-value of the 1000 most popular Wikipedia pages in 2016.

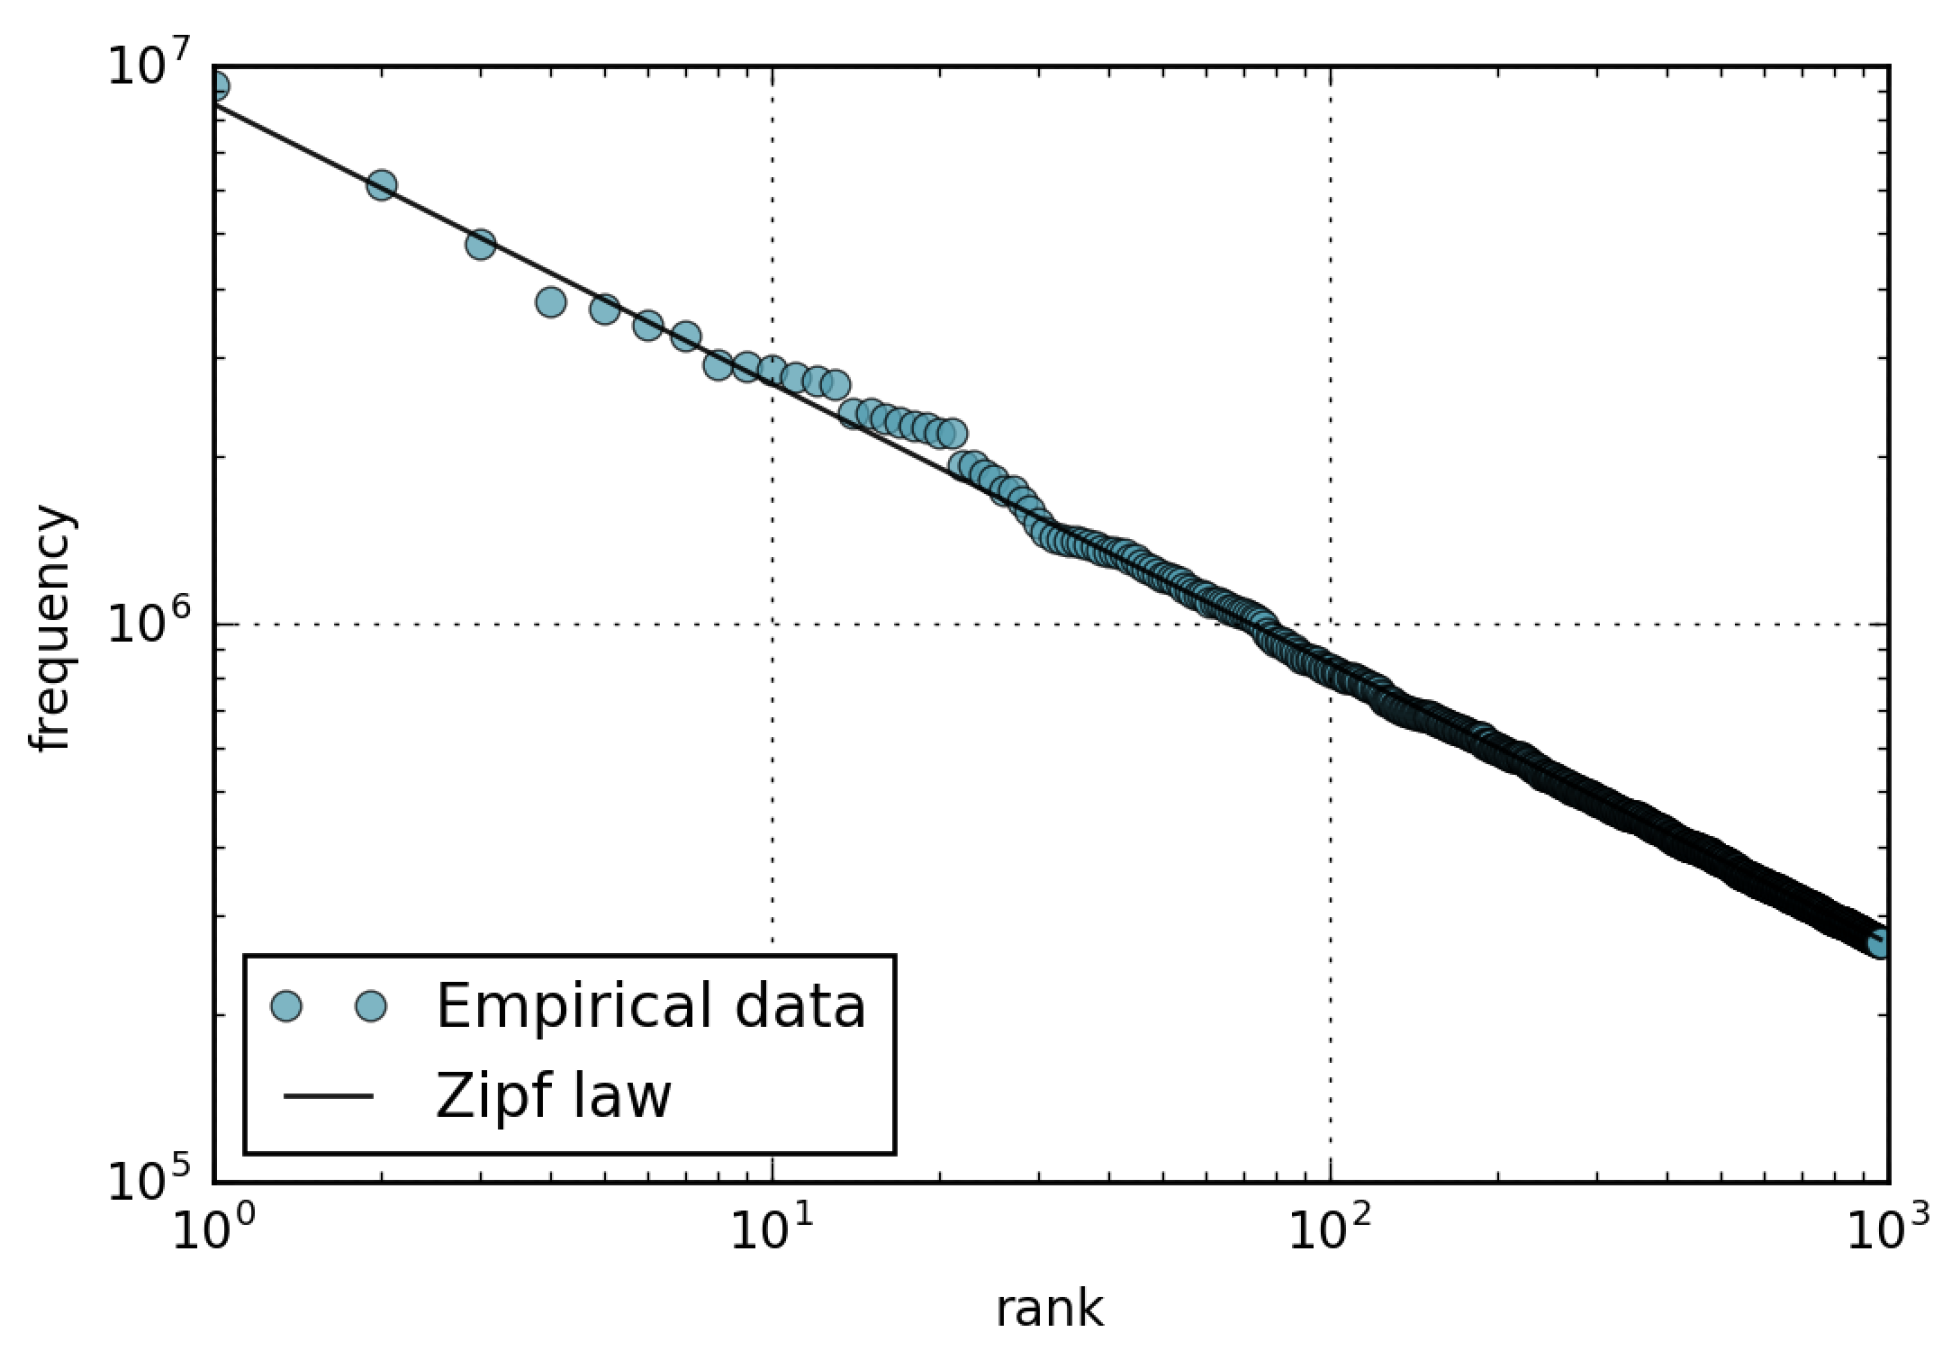
Figure 3.
Rank-frequency distribution for views of the 1000 most popular Wikipedia pages in July 2016.
Figure 3.
Rank-frequency distribution for views of the 1000 most popular Wikipedia pages in July 2016.

Figure 4.
Revisions of the 1000 most popular Wikipedia pages in February 2016.

Figure 5.
Estimation of lognormal parameters , , and the related p-value for the update frequency of the 1000 most popular Wikipedia pages in 2016.
Figure 5.
Estimation of lognormal parameters , , and the related p-value for the update frequency of the 1000 most popular Wikipedia pages in 2016.

Figure 6.
Rank-frequency plot of the 1000 most popular Wikipedia pages in February 2016.

Figure 7.
Revisions of the 1000 most popular Wikipedia pages in February 2016, sorted by view rank.

Figure 8.
Correlation between updates and views of the 1000 most popular Wikipedia (2016) pages.

Figure 9.
Views and updates of a popular science page (“Gravitational wave”) in February 2016, from 1 February to 1 March.
Figure 9.
Views and updates of a popular science page (“Gravitational wave”) in February 2016, from 1 February to 1 March.

Figure 10.
Views and updates of a popular movie page (“Deadpool”) in February 2016, from 1 February to 1 March.
Figure 10.
Views and updates of a popular movie page (“Deadpool”) in February 2016, from 1 February to 1 March.

Figure 11.
Views and updates of a popular public person page (“Donald Trump”) in February 2016, from 1 February to 1 March.
Figure 11.
Views and updates of a popular public person page (“Donald Trump”) in February 2016, from 1 February to 1 March.

Figure 12.
Views and updates of a popular music album page (“The Life of Pablo”) in February 2016, from 1 February to 1 March.
Figure 12.
Views and updates of a popular music album page (“The Life of Pablo”) in February 2016, from 1 February to 1 March.

Figure 13.
Boxplot for the time difference between revision and view peaks.

Figure 14.
Network reference scenario for caching simulations.

Figure 15.
Cache hit probability for the 200 most popular items for a cache close to the server.

Figure 16.
Cache hit probability for the 200 most popular items for a cache on the network edge.


Table 1.
Total and considered views for the top 1000 Wikipedia pages in 2016.
| Considered | Total | |
|---|---|---|
| Jan | 97.20% | 627M |
| Feb | 100.00% | 596M |
| Mar | 43.31% | 545M |
| Apr | 91.94% | 499M |
| May | 100.00% | 488M |
| Jun | 99.12% | 508M |
| Jul | 100.00% | 516M |
| Aug | 100.00% | 549M |
| Sep | 100.00% | 486M |
| Oct | 98.14% | 538M |
| Nov | 100.00% | 658M |
| Dec | 68.30% | 597M |
Table 2.
Total and considered updates for the top 1000 Wikipedia pages in 2016.
| Considered | Total | |
|---|---|---|
| Jan | 93.59% | 69K |
| Feb | 91.21% | 59K |
| Mar | 90.73% | 66K |
| Apr | 91.25% | 66K |
| May | 91.40% | 71K |
| Jun | 91.45% | 70K |
| Jul | 91.23% | 72K |
| Aug | 92.13% | 73K |
| Sep | 91.26% | 53K |
| Oct | 90.87% | 62K |
| Nov | 91.18% | 70K |
| Dec | 90.90% | 69K |
© 2019 by the authors. Licensee MDPI, Basel, Switzerland. This article is an open access article distributed under the terms and conditions of the Creative Commons Attribution (CC BY) license (http://creativecommons.org/licenses/by/4.0/).
Share and Cite
MDPI and ACS Style
Bracciale, L.; Loreti, P.; Detti, A.; Blefari Melazzi, N. Analysis of Data Persistence in Collaborative Content Creation Systems: The Wikipedia Case. Information 2019, 10, 330. https://doi.org/10.3390/info10110330
AMA Style
Bracciale L, Loreti P, Detti A, Blefari Melazzi N. Analysis of Data Persistence in Collaborative Content Creation Systems: The Wikipedia Case. Information. 2019; 10(11):330. https://doi.org/10.3390/info10110330
Chicago/Turabian StyleBracciale, Lorenzo, Pierpaolo Loreti, Andrea Detti, and Nicola Blefari Melazzi. 2019. "Analysis of Data Persistence in Collaborative Content Creation Systems: The Wikipedia Case" Information 10, no. 11: 330. https://doi.org/10.3390/info10110330
Note that from the first issue of 2016, this journal uses article numbers instead of page numbers. See further details here.