Dry Eye Disease and Tear Cytokine Levels—A Meta-Analysis

 , , , , and
Abstract
:1. Introduction
2. Results
2.1. Characteristics of the Included Studies
2.2. Study and Patient Characteristics.
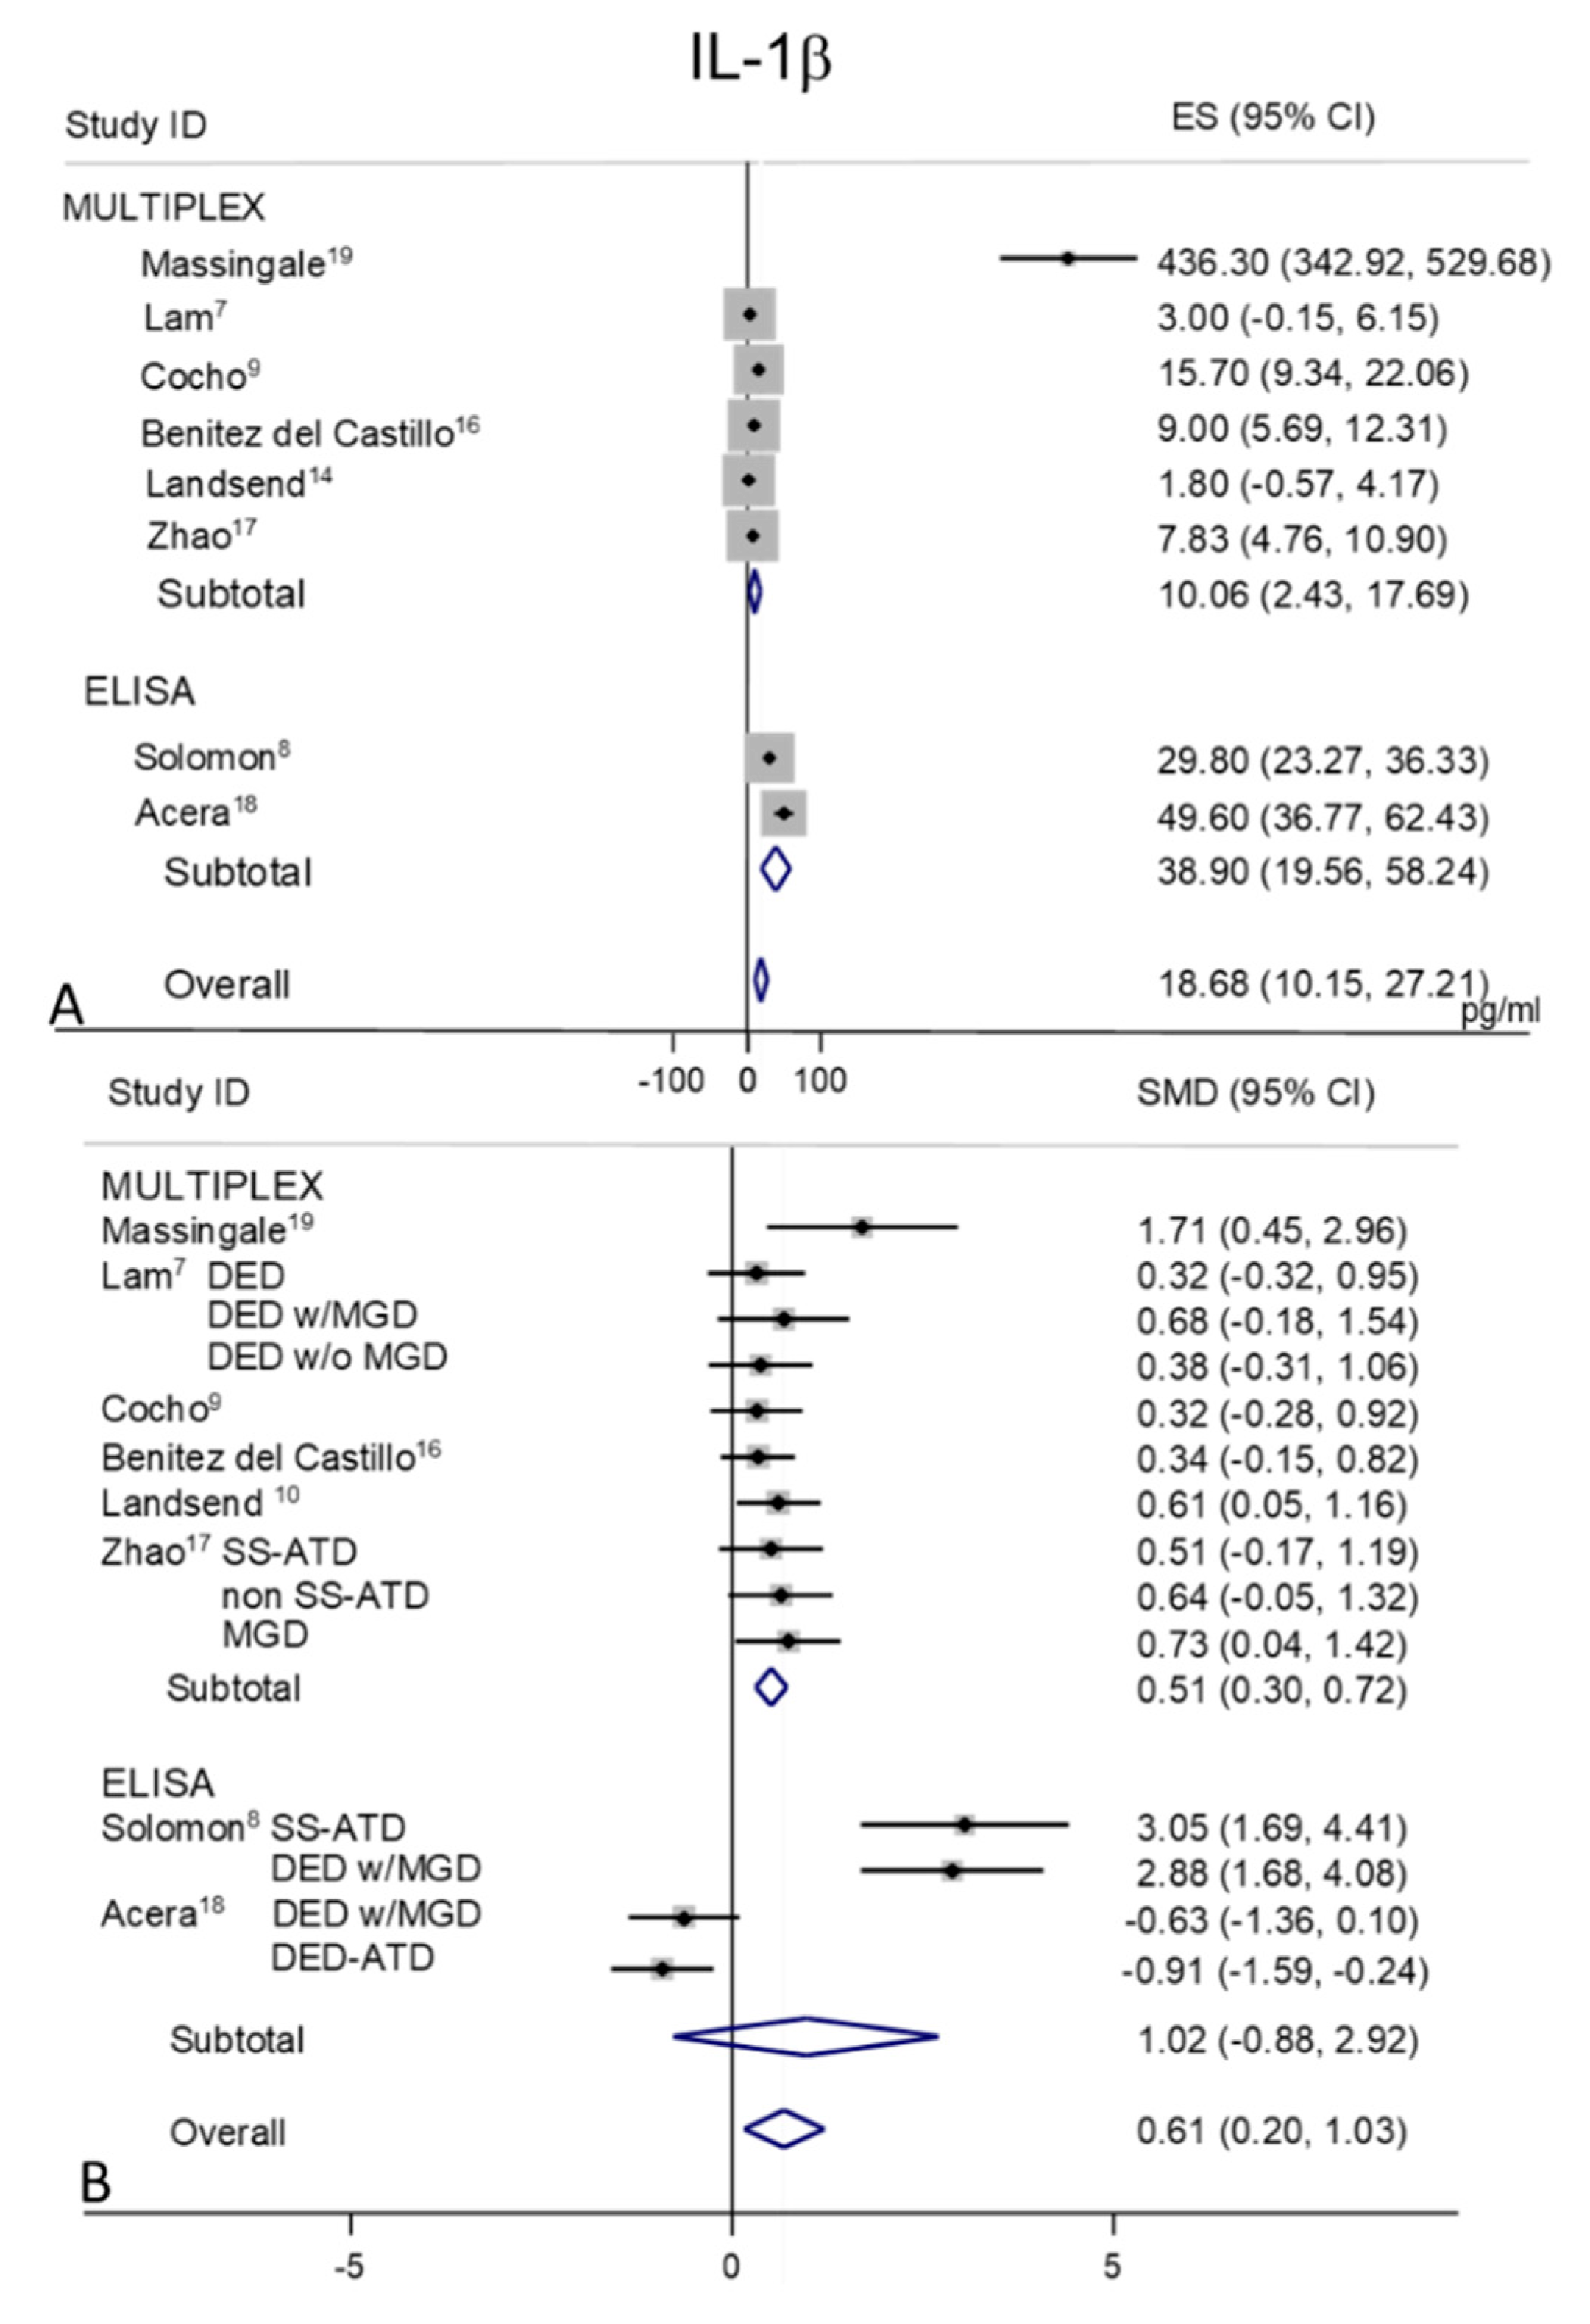
2.3. IL-1β
2.4. IL-2
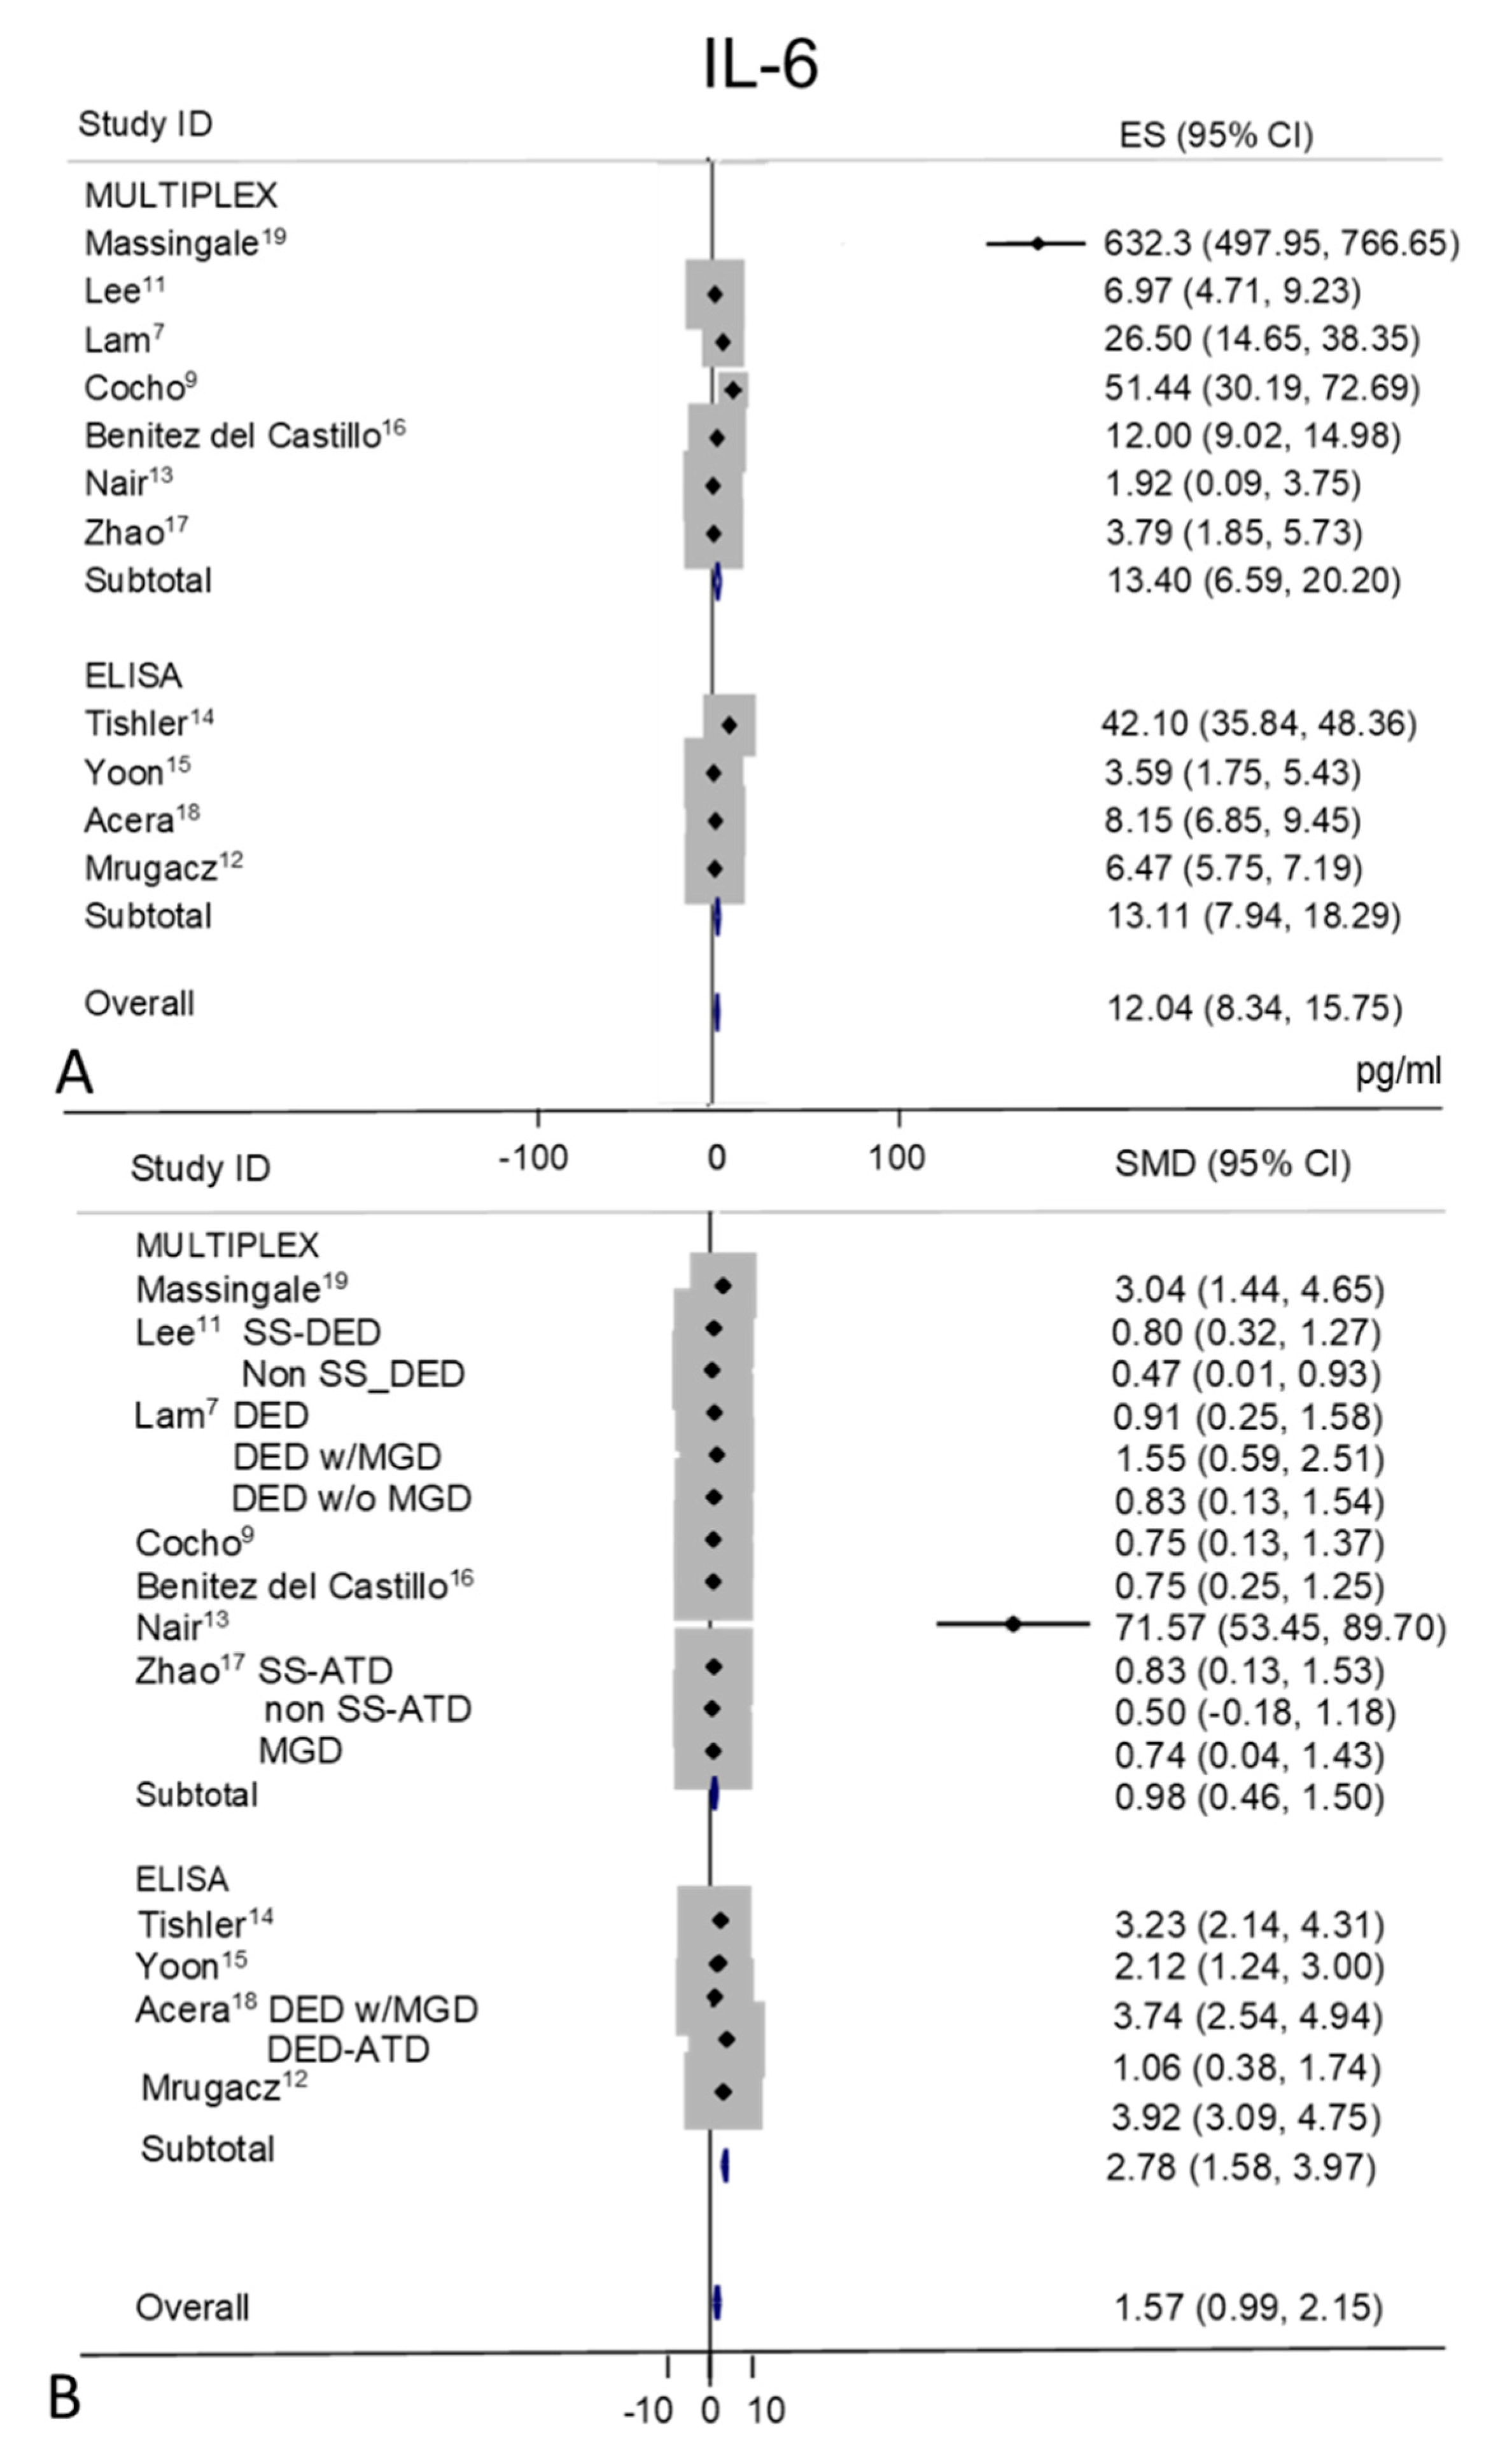
2.5. IL-6
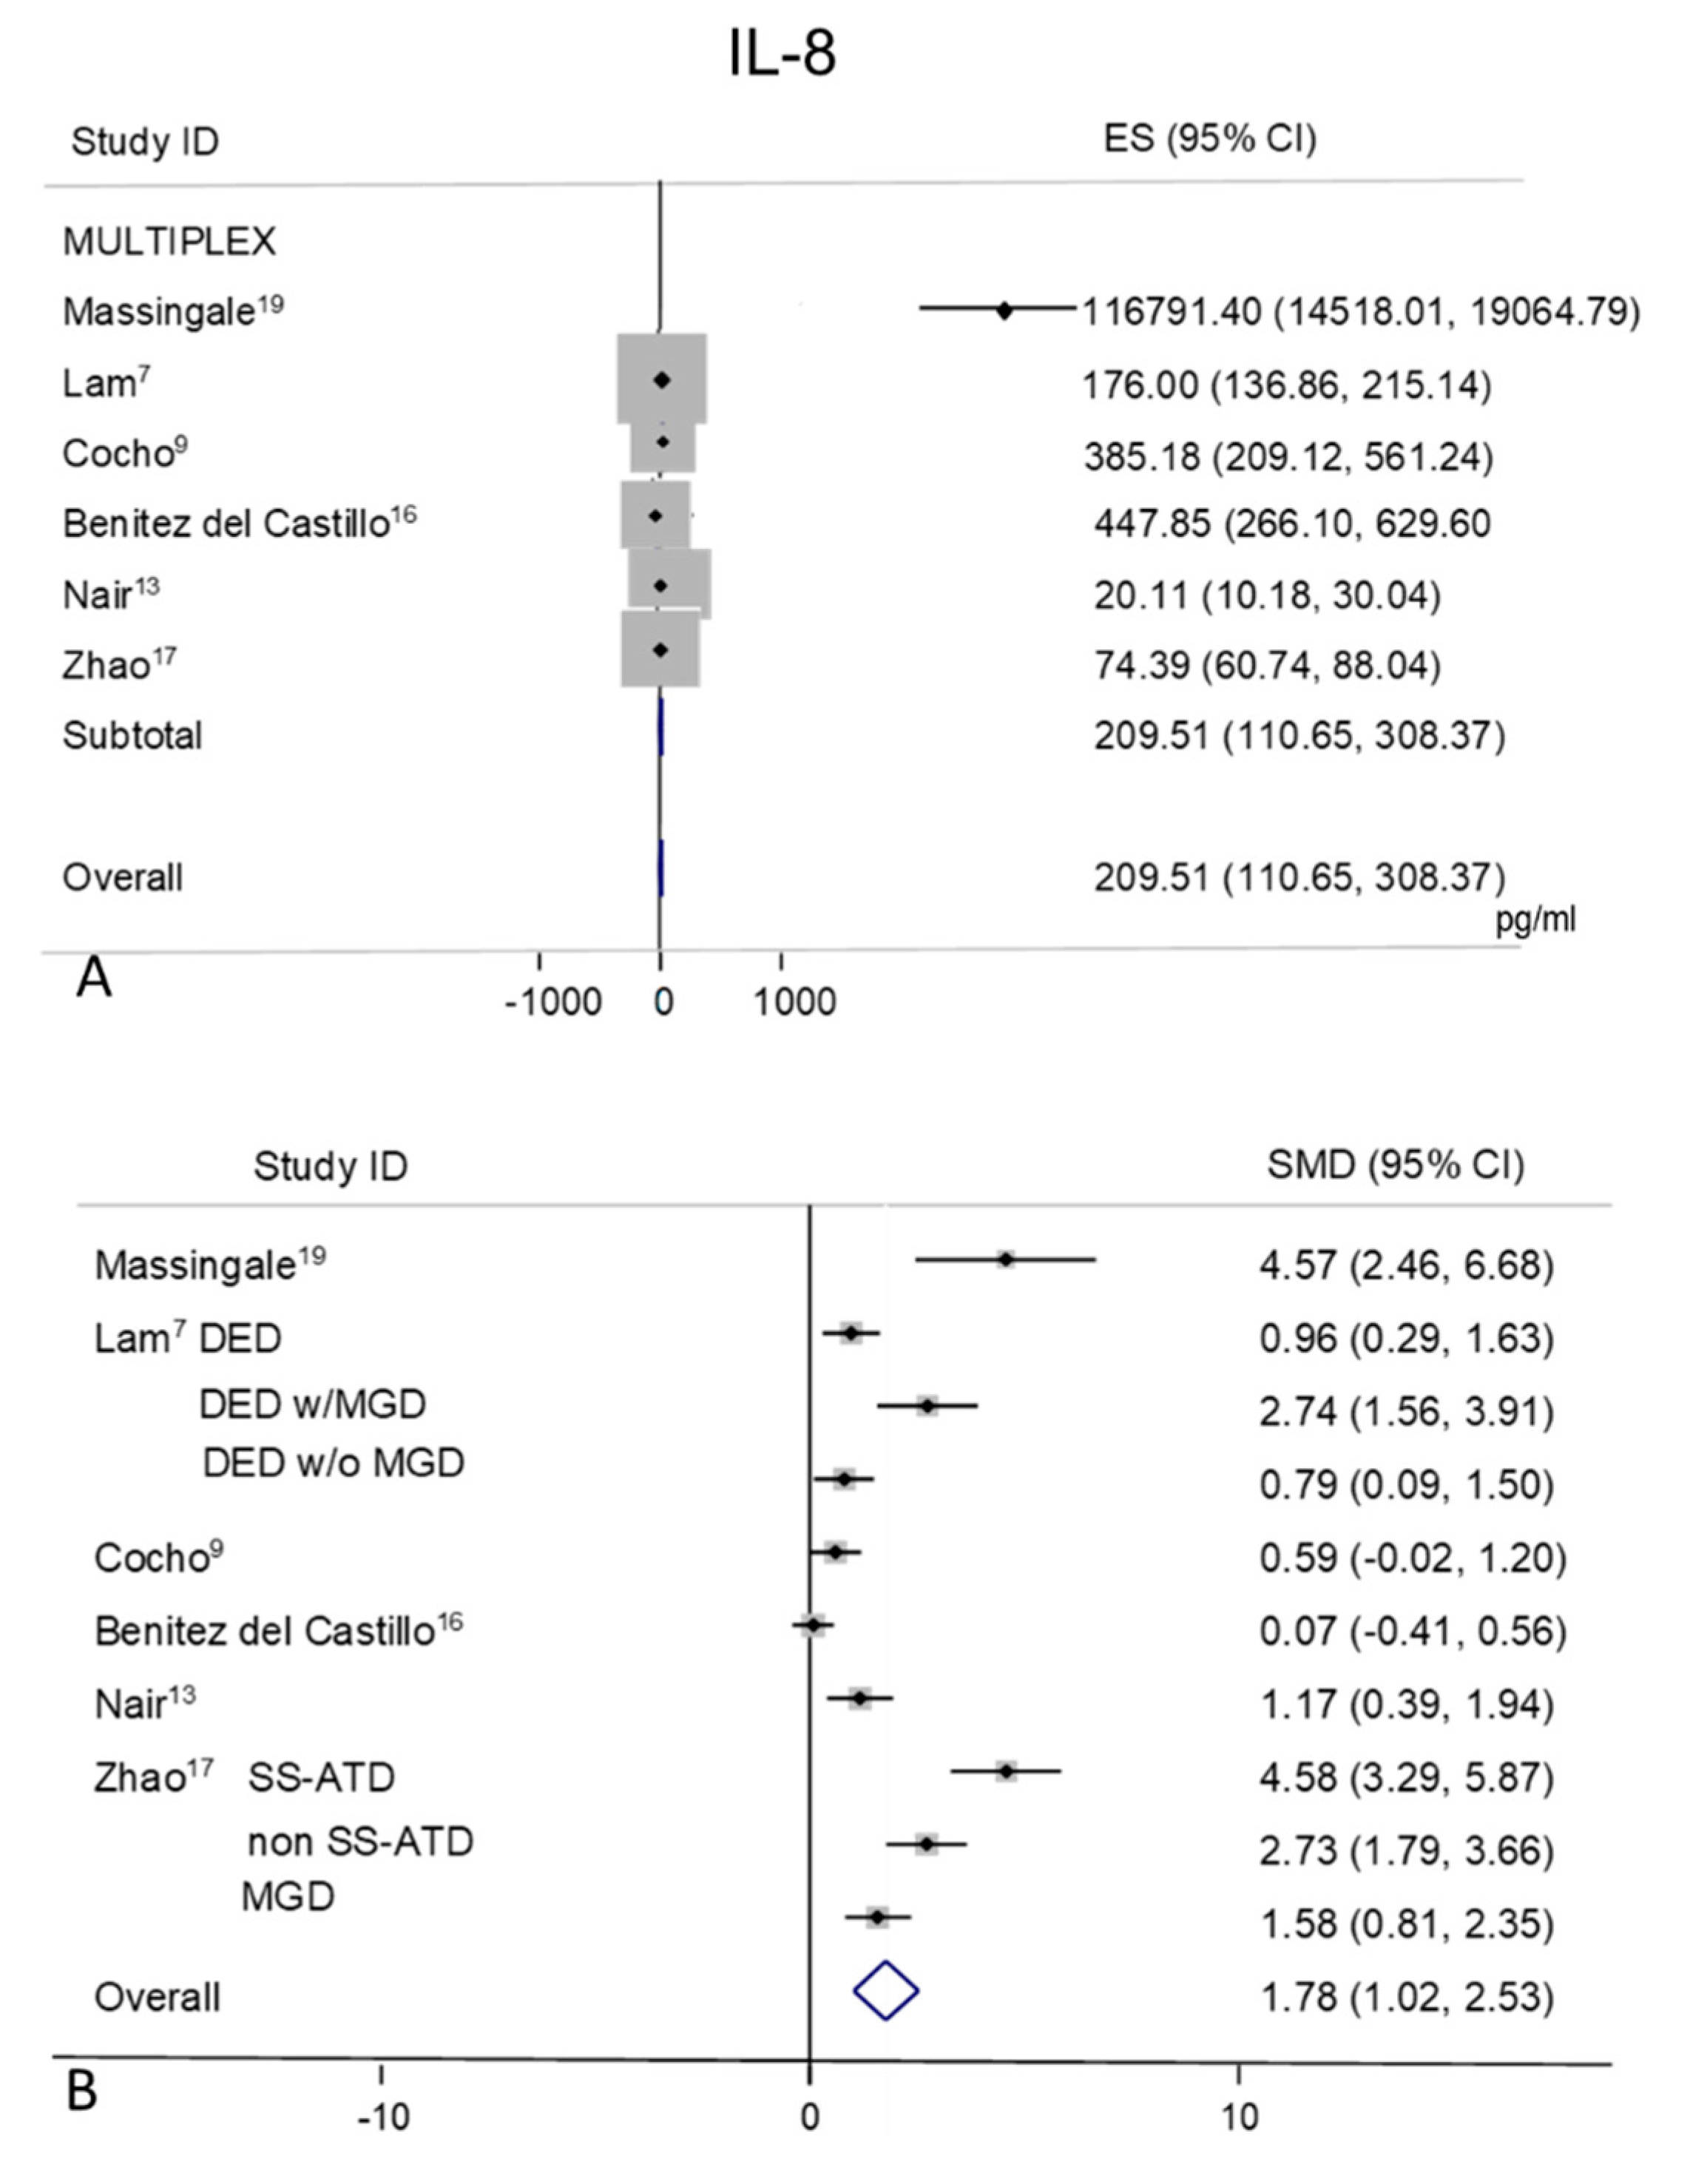
2.6. IL-8
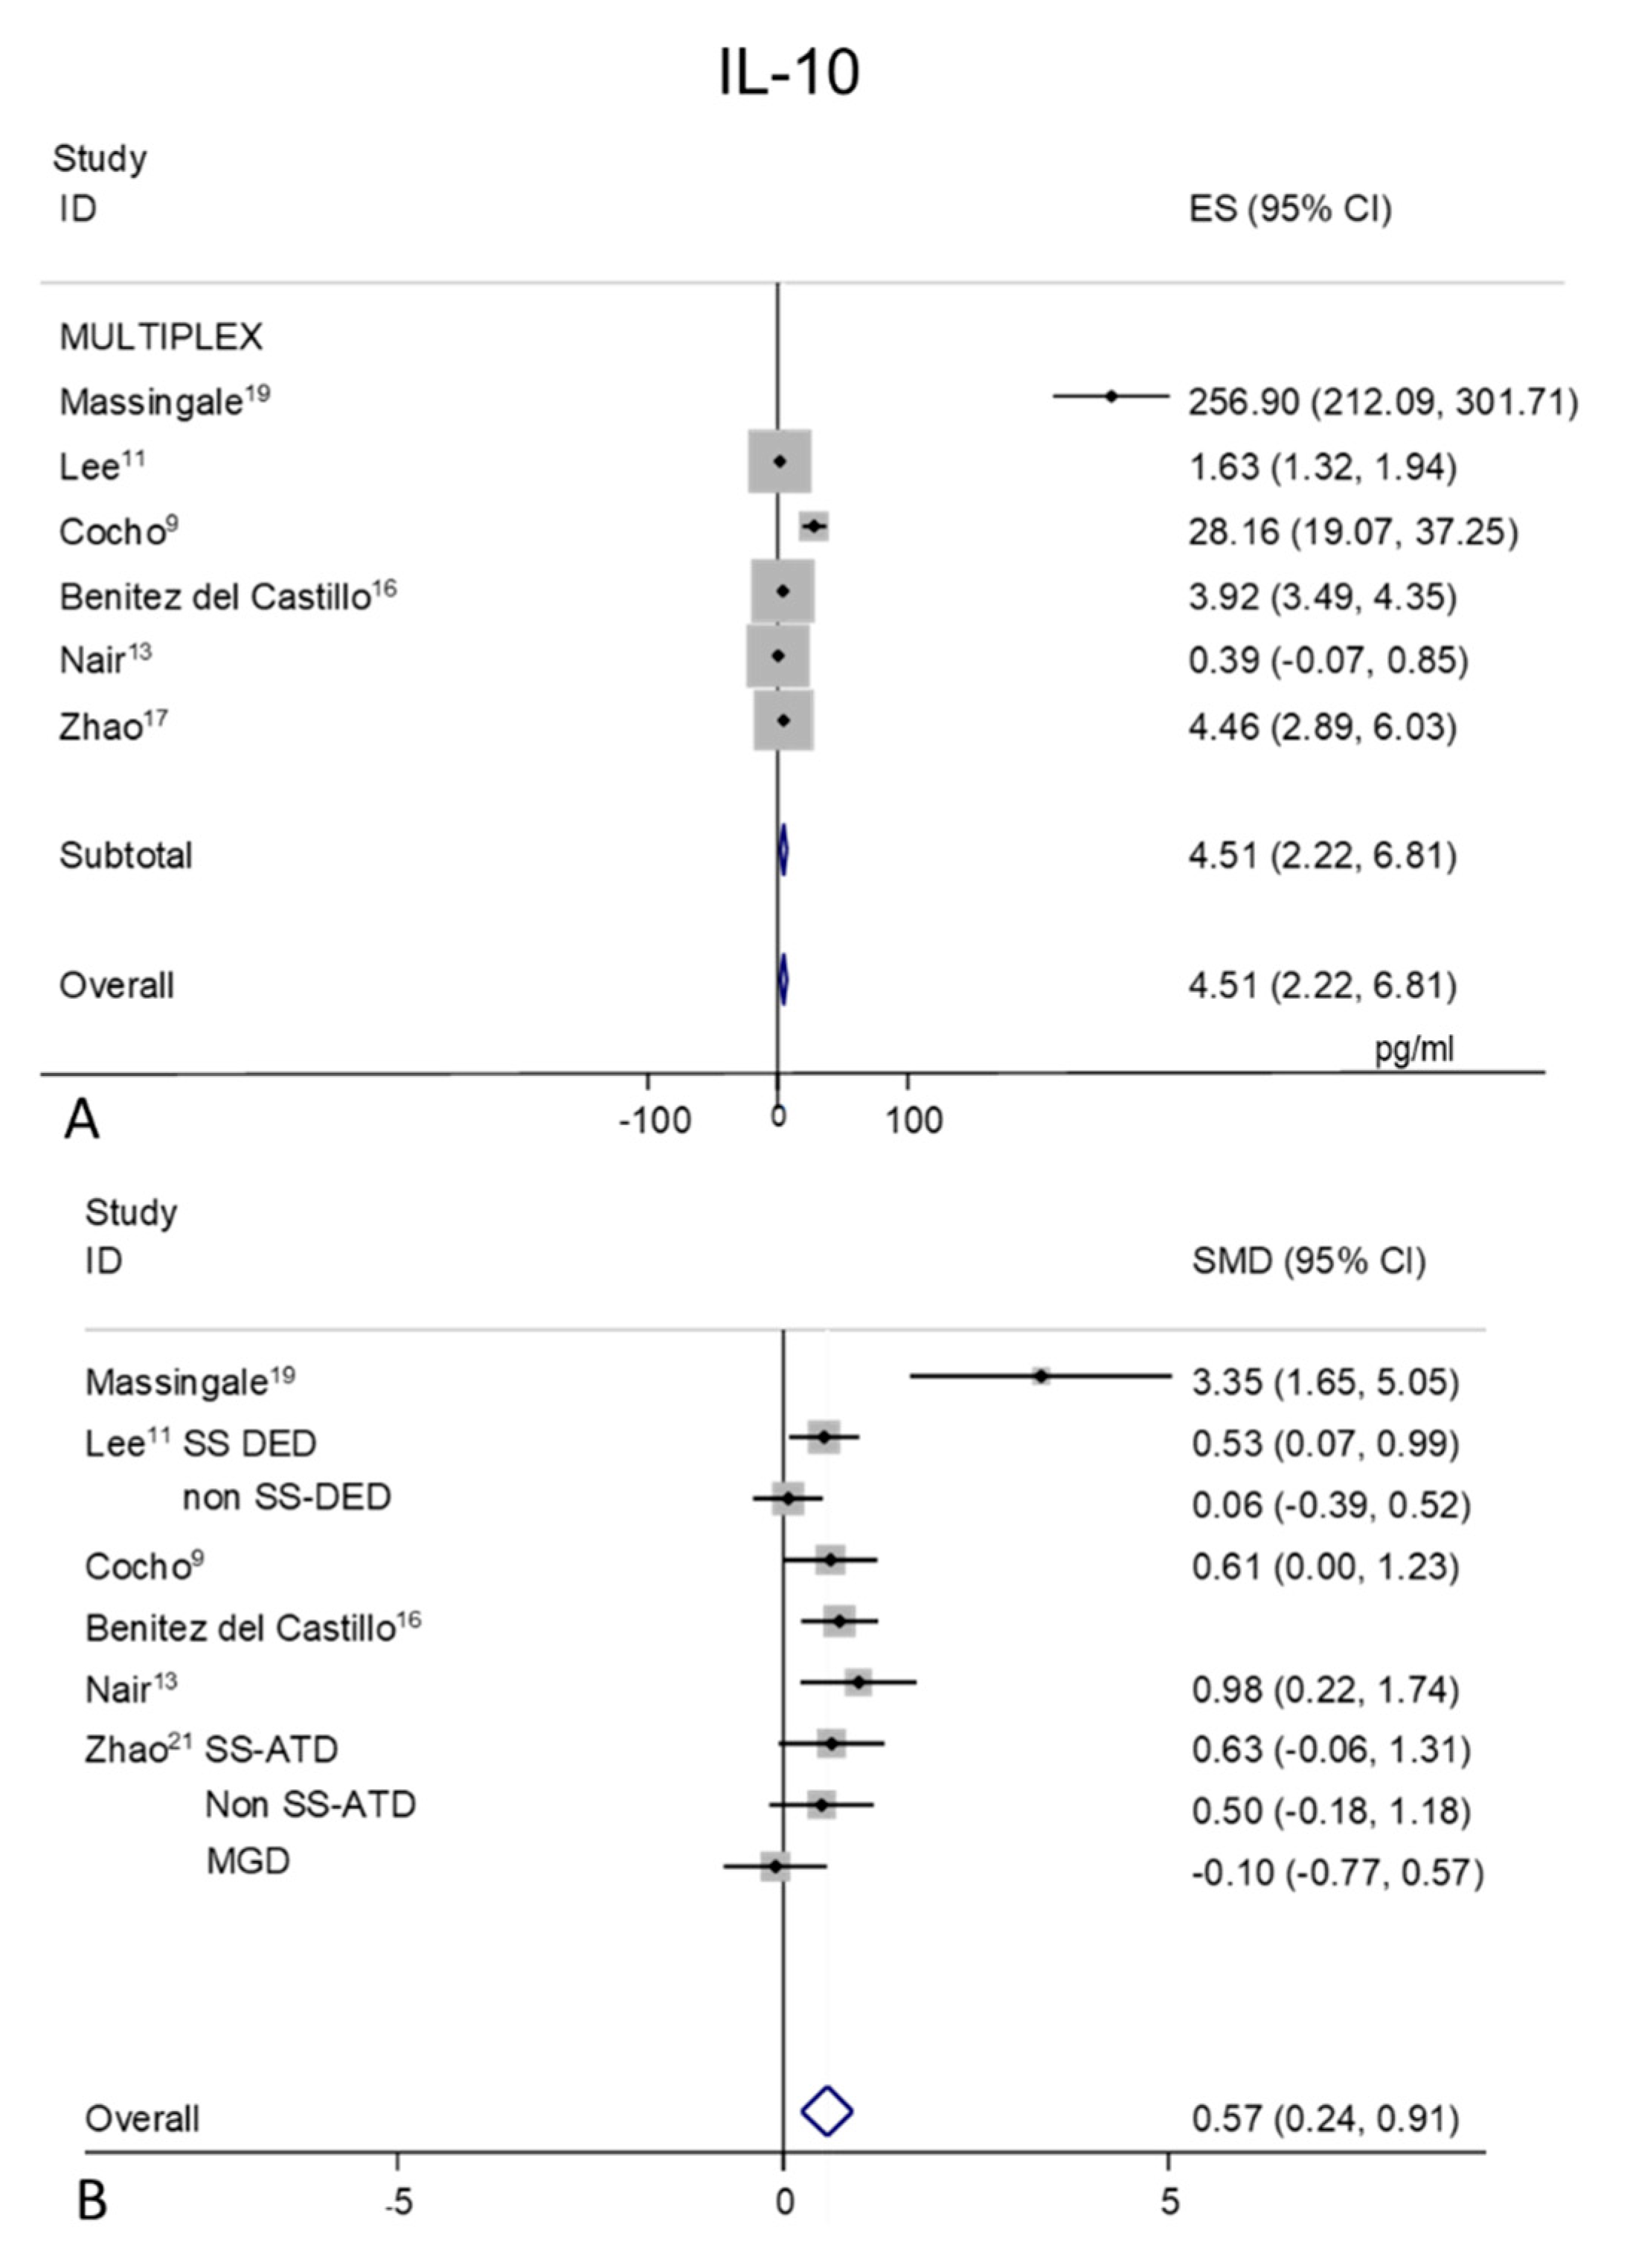
2.7. IL-10
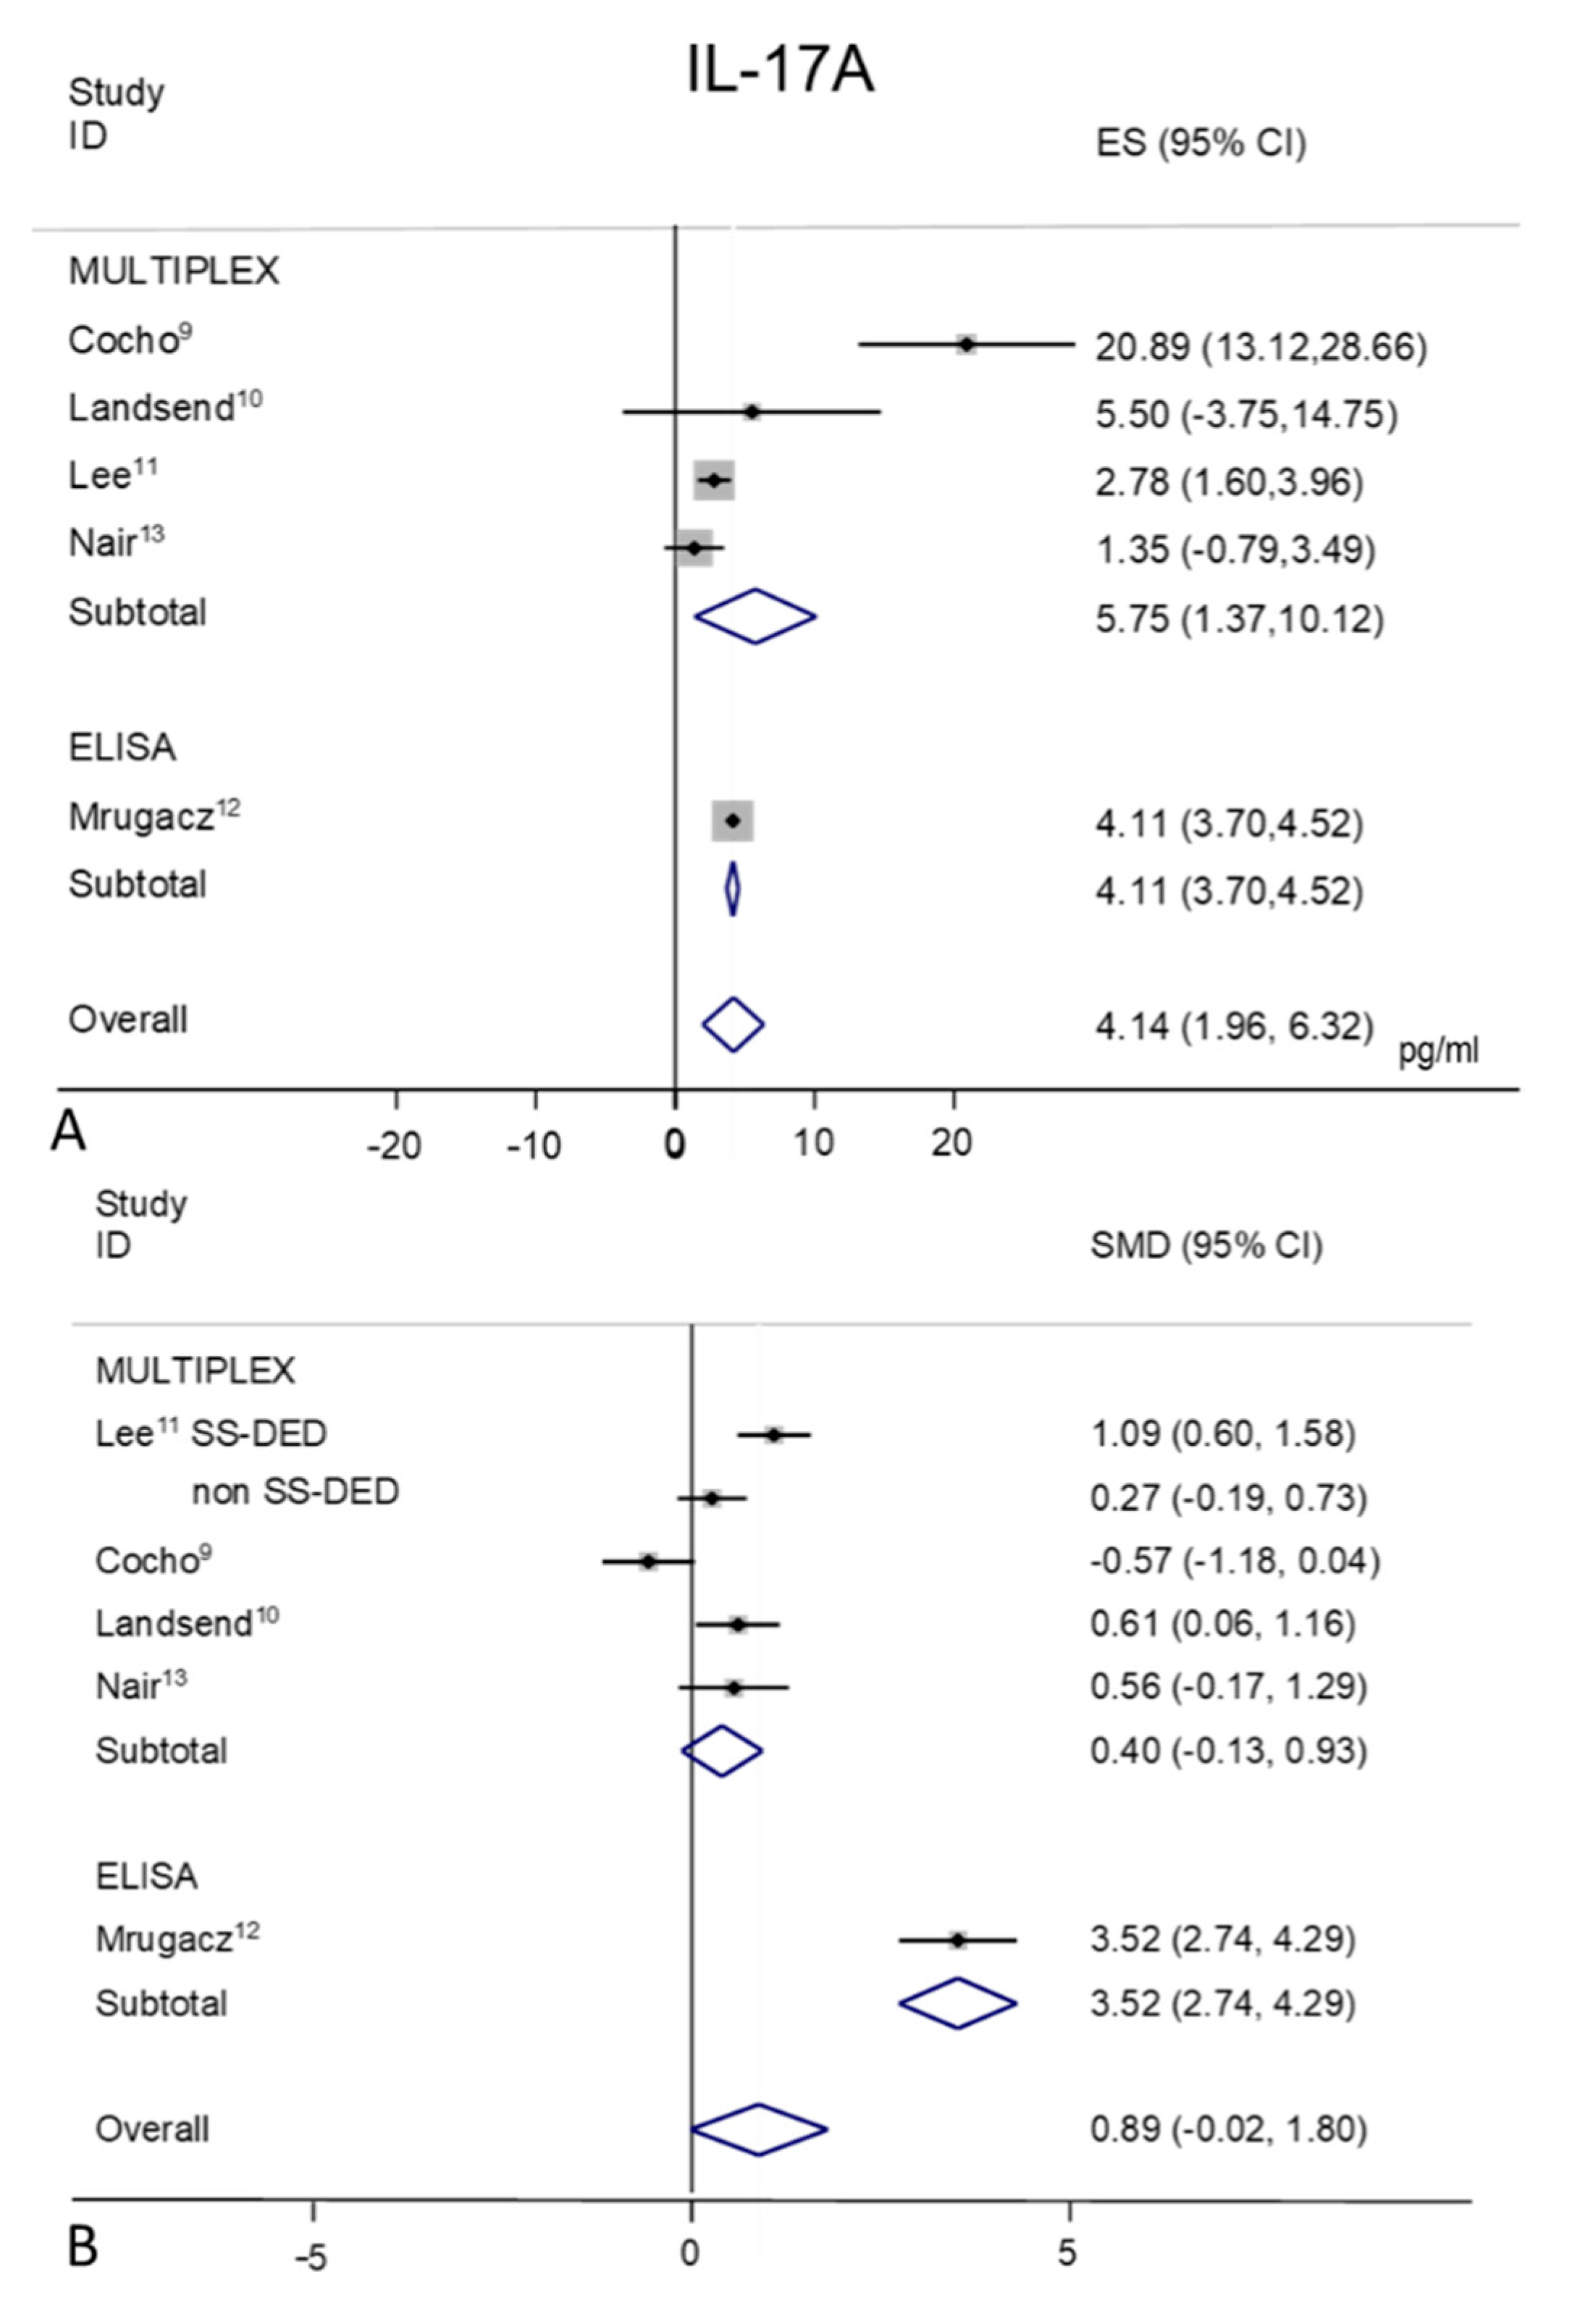
2.8. IL-17A
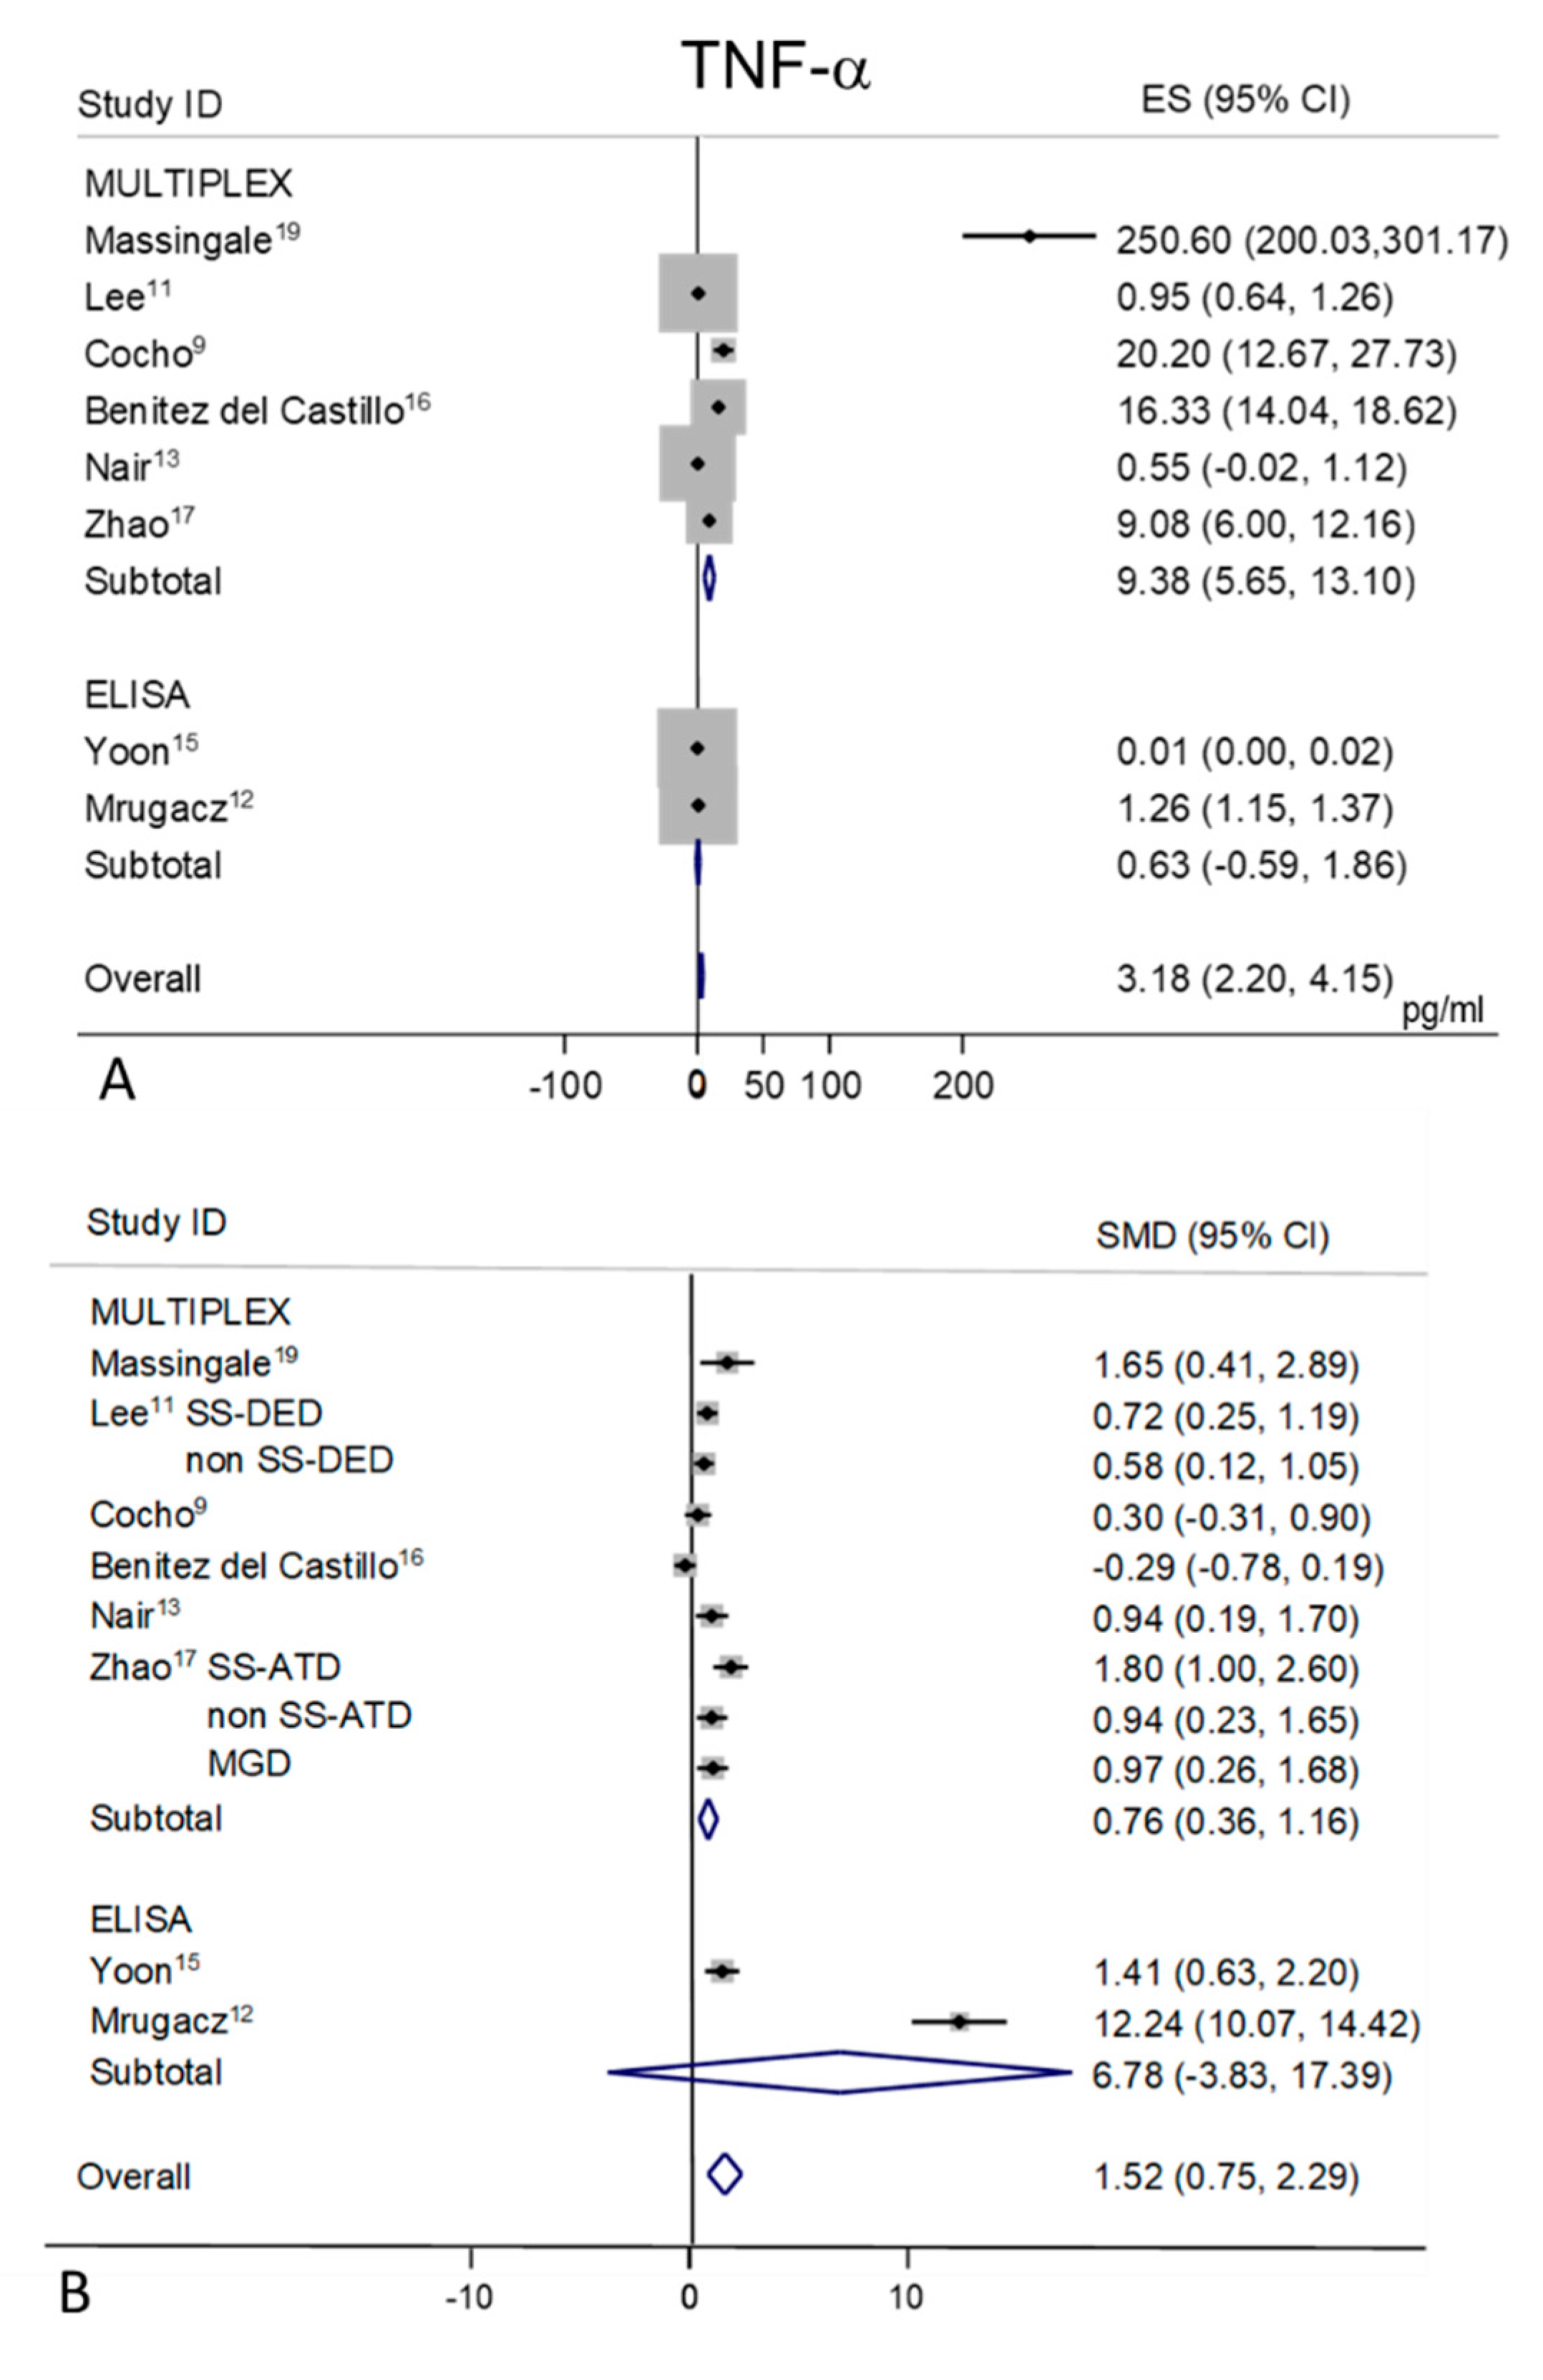
2.9. TNF-α
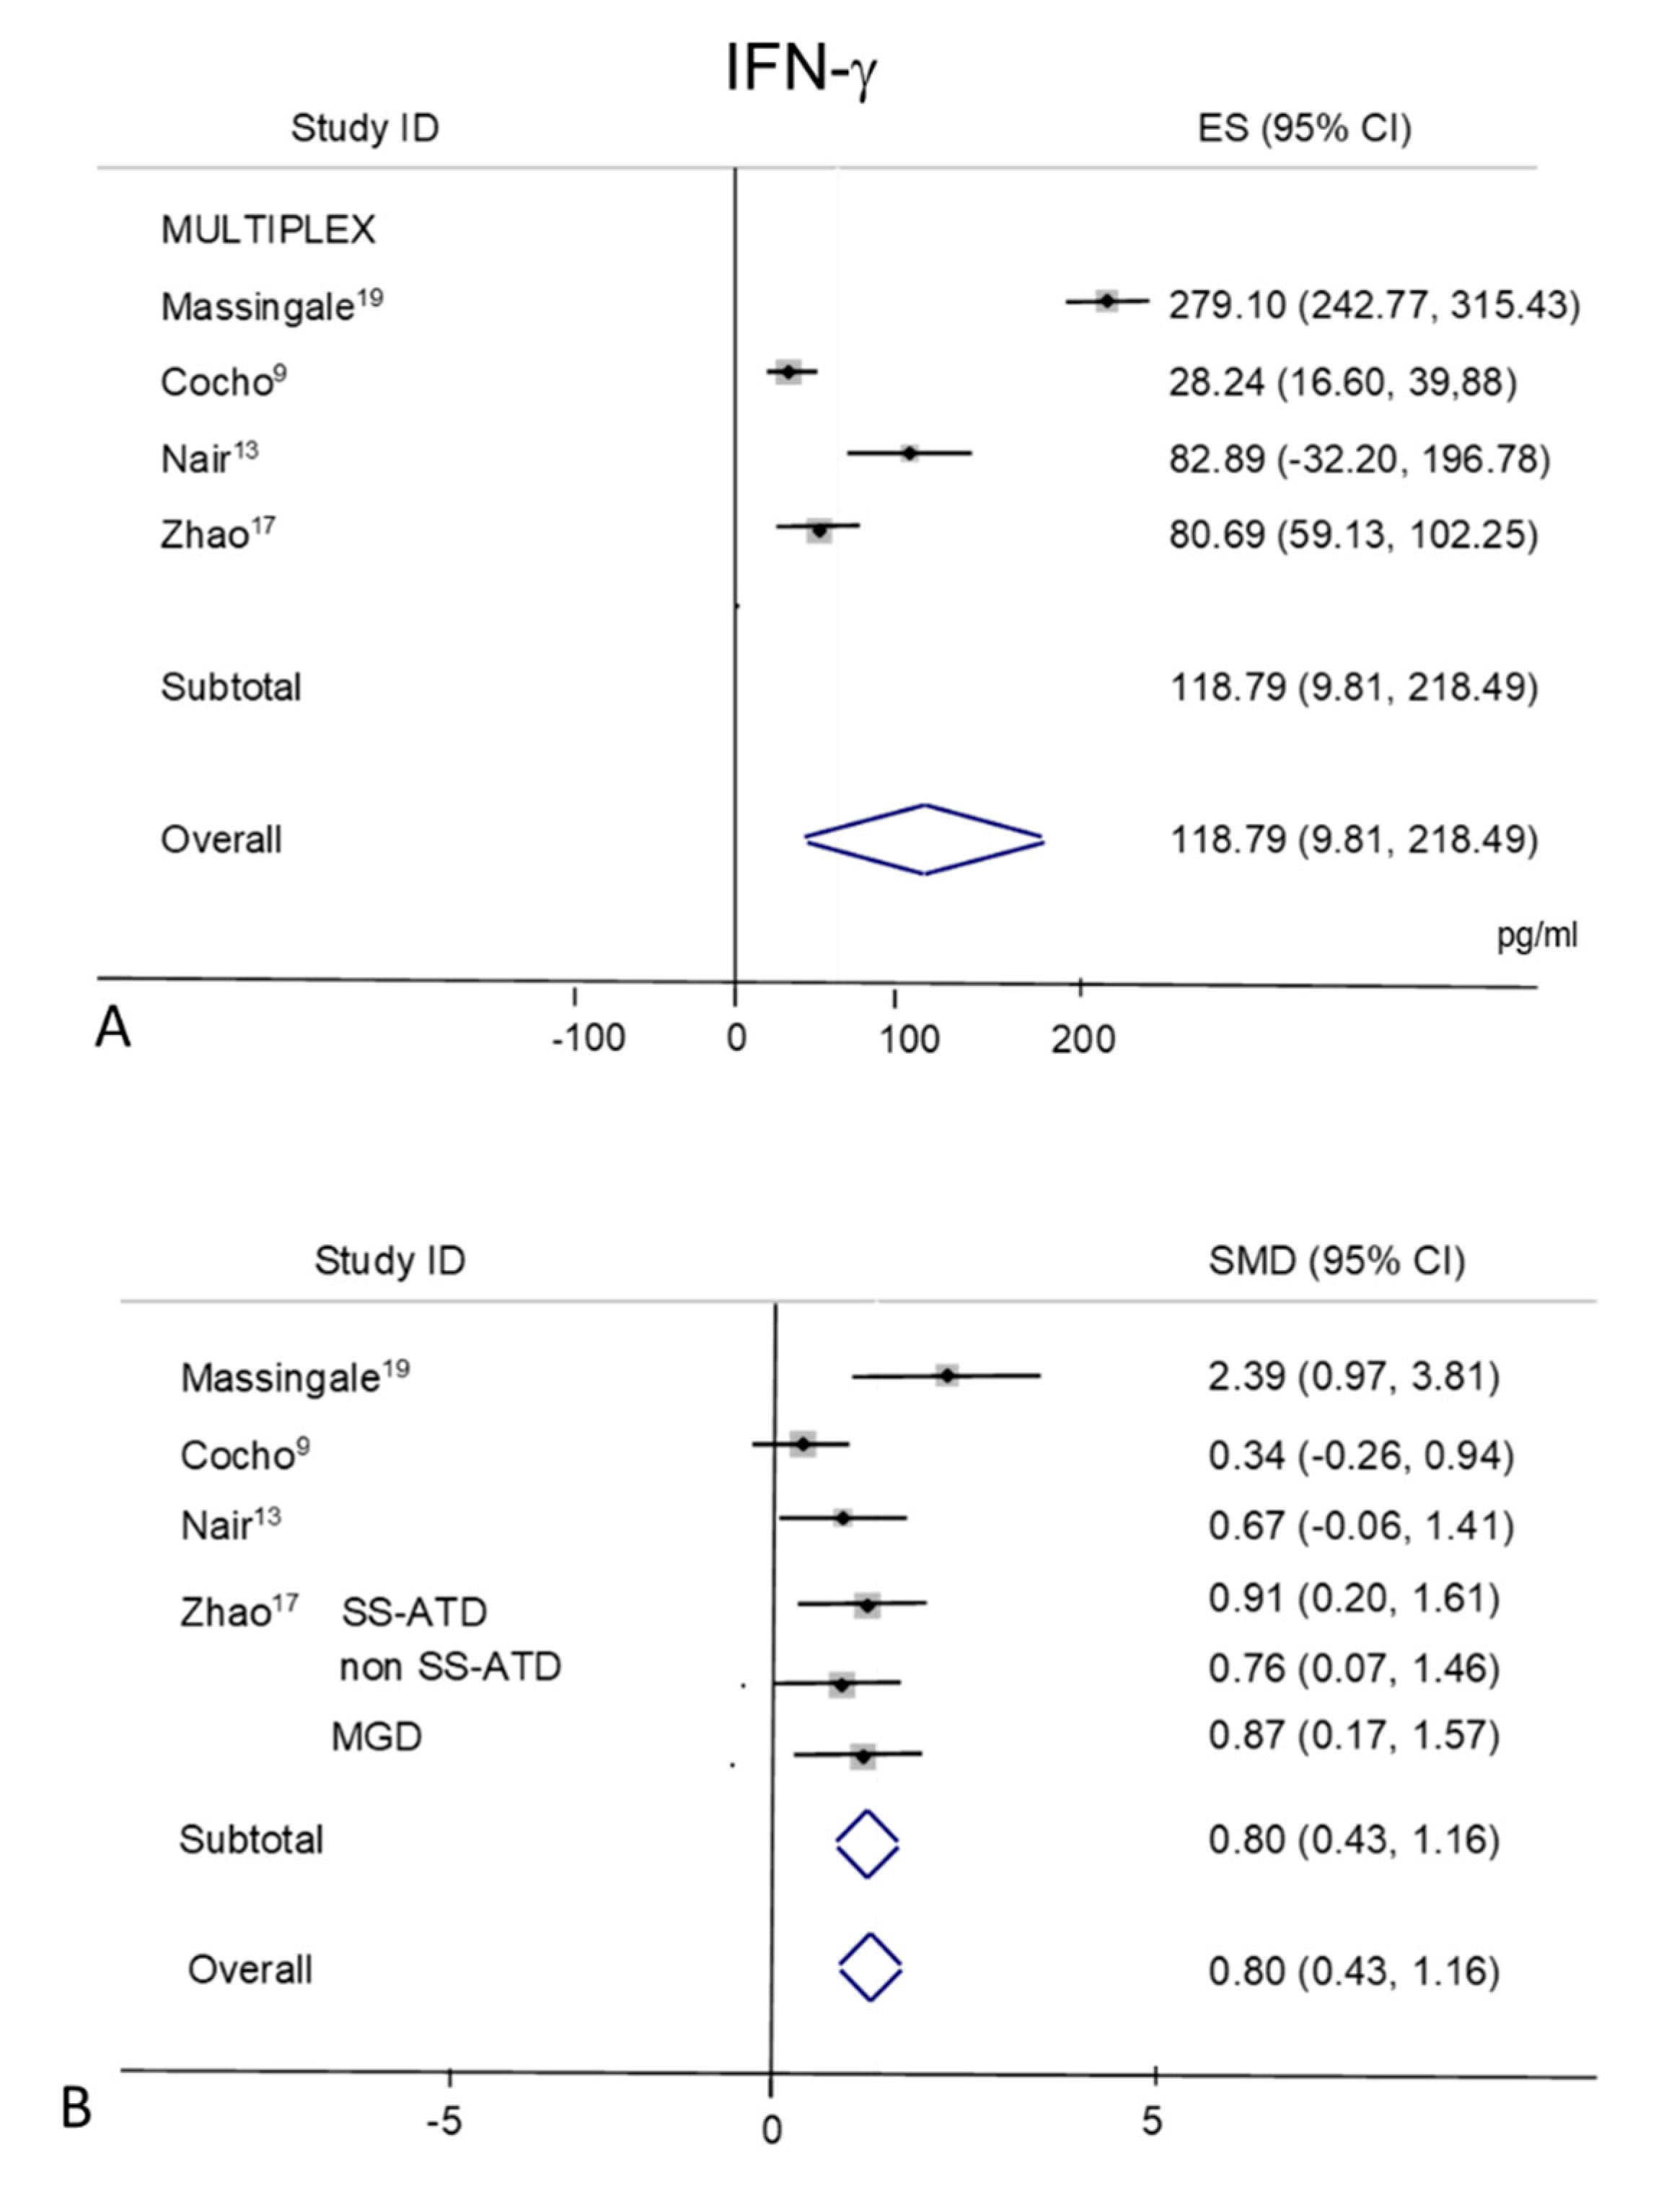
2.10. IFN-γ
3. Discussion
4. Methods
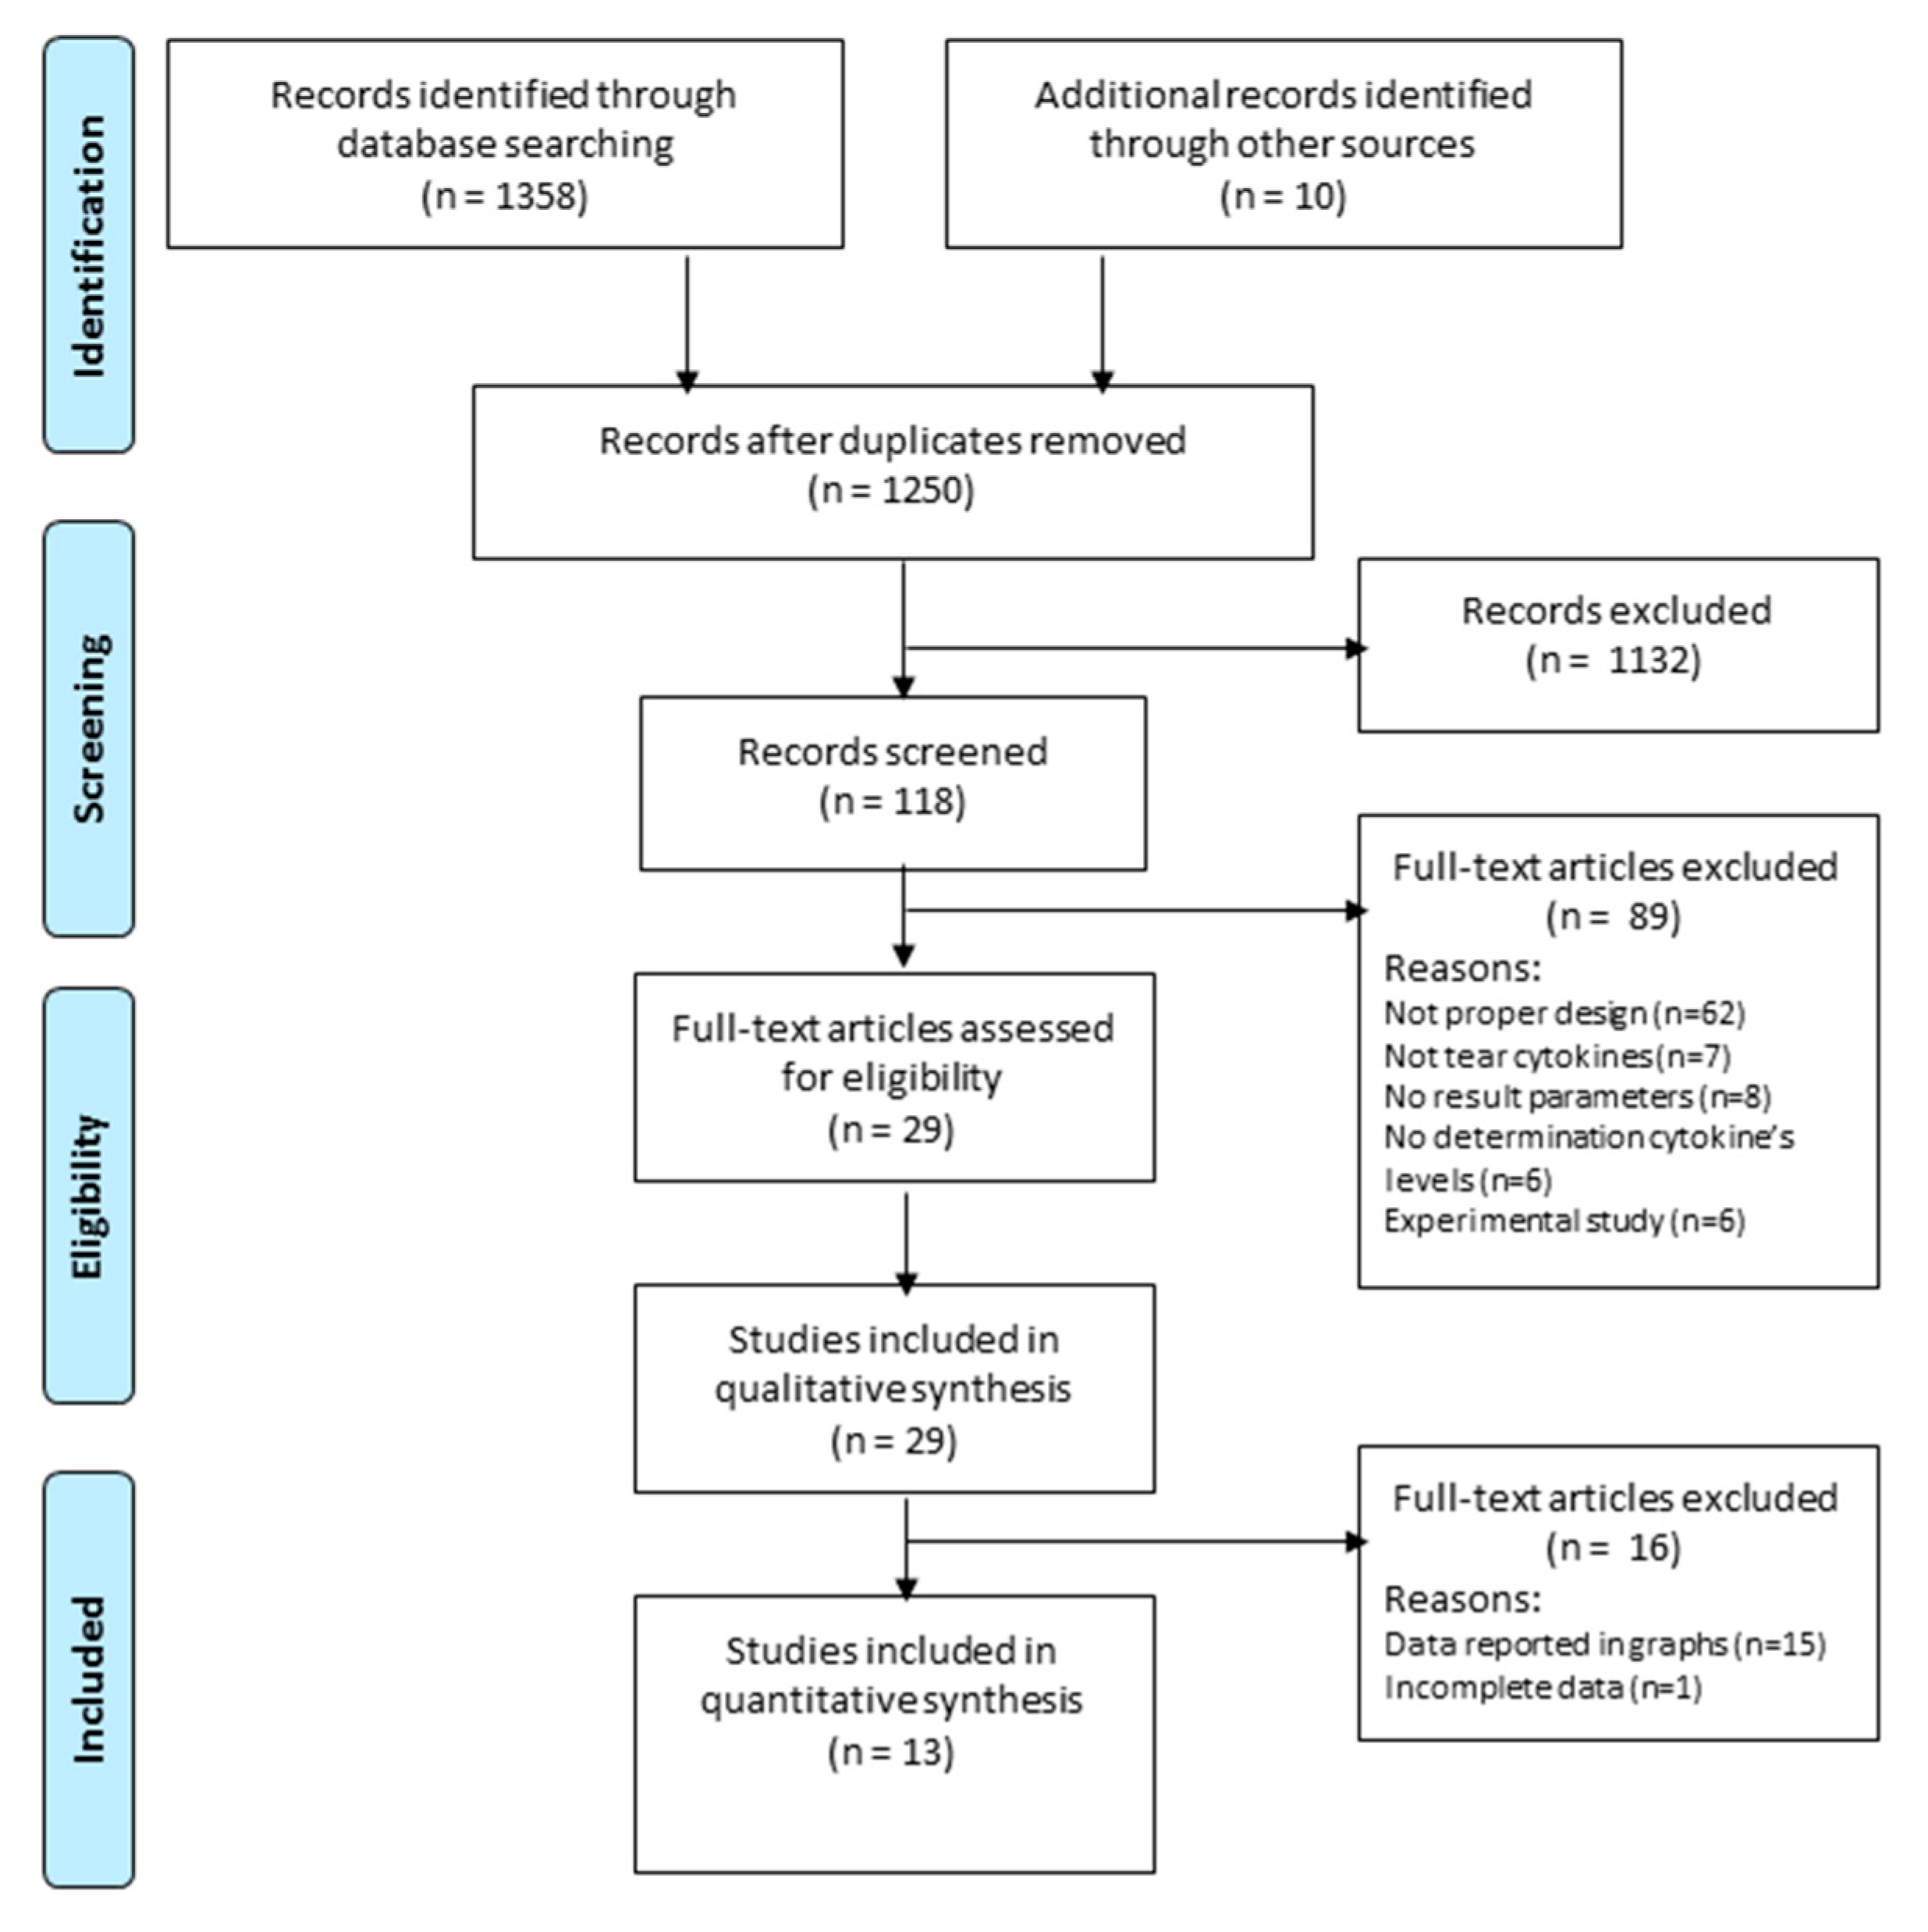
4.1. Search Strategy
4.2. Eligibility Criteria
4.3. Study Selection
4.4. Data Extraction
4.5. Quality Assessment
4.6. Data Analysis
5. Conclusions
Supplementary Materials
Author Contributions
Funding
Conflicts of Interest
References
- Stapleton, F.; Alves, M.; Bunya, V.Y.; Jalbert, I.; Lekhanont, K.; Malet, F.; Na, K.-S.; Schaumberg, D.; Uchino, M.; Vehof, J.; et al. TFOS DEWS II Epidemiology Report. Ocul. Surf. 2017, 15, 334–365. [Google Scholar] [CrossRef] [PubMed]
- Craig, J.P.; Nelson, J.D.; Azar, D.T.; Belmonte, C.; Bron, A.J.; Chauhan, S.K.; De Paiva, C.S.; Gomes, J.A.P.; Hammitt, K.; Jones, L.W.; et al. TFOS DEWS II Report Executive Summary. Ocul. Surf. 2017, 15, 802–812. [Google Scholar] [CrossRef] [PubMed]
- Benitez-Del-Castillo, J.; Labetoulle, M.; Baudouin, C.; Rolando, M.; Akova, Y.A.; Aragona, P.; Geerling, G.; Merayo-Lloves, J.; Messmer, E.M.; Boboridis, K.G. Visual acuity and quality of life in dry eye disease: Proceedings of the OCEAN group meeting. Ocul. Surf. 2017, 15, 169–178. [Google Scholar] [CrossRef] [PubMed] [Green Version]
- Craig, J.P.; Nichols, K.K.; Akpek, E.K.; Caffery, B.; Dua, H.S.; Joo, C.-K.; Liu, Z.; Nelson, J.; Nichols, J.J.; Tsubota, K.; et al. TFOS DEWS II Definition and Classification Report. Ocul. Surf. 2017, 15, 276–283. [Google Scholar] [CrossRef] [PubMed]
- VanDerMeid, K.R.; Su, S.P.; Krenzer, K.L.; Ward, K.W.; Zhang, J.-Z. A method to extract cytokines and matrix metalloproteinases from Schirmer strips and analyze using Luminex. Mol. Vis. 2011, 17, 1056–1063. [Google Scholar] [PubMed]
- Pflugfelder, S.C.; Jones, D.; Ji, Z.; Afonso, A.; Monroy, D. Altered cytokine balance in the tear fluid and conjunctiva of patients with Sjögren’s syndrome keratoconjunctivitis sicca. Curr. Eye Res. 1999, 19, 201–211. [Google Scholar] [CrossRef]
- Lam, H.; Bleiden, L.; De Paiva, C.S.; Farley, W.; Stern, M.E.; Pflugfelder, S.C. Tear Cytokine Profiles in Dysfunctional Tear Syndrome. Am. J. Ophthalmol. 2008, 147, 198–205.e1. [Google Scholar] [CrossRef] [Green Version]
- Solomon, A.; Dursun, D.; Liu, Z.; Xie, Y.; Macri, A.; Pflugfelder, S.C. Pro- and anti-inflammatory forms of interleukin-1 in the tear fluid and conjunctiva of patients with dry-eye disease. Investig. Ophthalmol. Vis. Sci. 2001, 42, 2283–2292. [Google Scholar]
- Cocho, L.; Fernandez, I.; Calonge, M.C.; Martínez, V.; González-García, M.J.; Caballero, L.; López-Corral, L.; García-Vázquez, C.; Vazquez, L.; Stern, M.E.; et al. Biomarkers in Ocular Chronic Graft Versus Host Disease: Tear Cytokine- and Chemokine-Based Predictive Model. Investig. Opthalmol. Vis. Sci. 2016, 57, 746. [Google Scholar] [CrossRef] [Green Version]
- Landsend, E.C.S.; Utheim, Ø.A.; Pedersen, H.R.; Aass, H.C.D.; Lagali, N.; Dartt, D.A.; Baraas, R.C.; Utheim, T.P. The Level of Inflammatory Tear Cytokines is Elevated in Congenital Aniridia and Associated with Meibomian Gland Dysfunction. Investig. Opthalmol. Vis. Sci. 2018, 59, 2197–2204. [Google Scholar] [CrossRef] [Green Version]
- Lee, S.Y.; Han, S.J.; Nam, S.M.; Yoon, S.; Ahn, J.M.; Kim, T.-I.; Kim, E.K.; Seo, K.Y. Analysis of Tear Cytokines and Clinical Correlations in Sjögren Syndrome Dry Eye Patients and Non–Sjögren Syndrome Dry Eye Patients. Am. J. Ophthalmol. 2013, 156, 247–253.e1. [Google Scholar] [CrossRef] [PubMed]
- Mrugacz, M.; Ostrowska, L.; Bryl, A.; Szulc, A.; Żelazowska-Rutkowska, B.; Mrugacz, G. Pro-inflammatory cytokines associated with clinical severity of dry eye disease of patients with depression. Adv. Med Sci. 2017, 62, 338–344. [Google Scholar] [CrossRef] [PubMed]
- Nair, S.; Vanathi, M.; Mahapatra, M.; Seth, T.; Kaur, J.; Velpandian, T.; Ravi, A.; Titiyal, J.S.; Tandon, R. Tear inflammatory mediators and protein in eyes of post allogenic hematopoeitic stem cell transplant patients. Ocul. Surf. 2018, 16, 352–367. [Google Scholar] [CrossRef] [PubMed]
- Tishler, M.; Yaron, I.; Geyer, O.; Shirazi, I.; Naftaliev, E.; Yaron, M. Elevated tear interleukin-6 levels in patients with Sjögren syndrome. Ophthalmology 1998, 105, 2327–2329. [Google Scholar] [CrossRef]
- Yoon, K.C.; Jeong, I.-Y.; Park, Y.-G.; Yang, S.-Y. Interleukin-6 and Tumor Necrosis Factor-α Levels in Tears of Patients With Dry Eye Syndrome. Cornea 2007, 26, 431–437. [Google Scholar] [CrossRef]
- Sánchez, J.B.-D.-C.; Morillo-Rojas, M.; Galbis-Estrada, C.; Pinazo-Durán, M. Determinación de mediadores de la respuesta inmune e inflamación en lágrimas: Cambios en ojo seco y glaucoma frente a población sana. Arch. Soc. Española Oftalmol. 2017, 92, 210–217. [Google Scholar] [CrossRef]
- Zhao, H.; Li, Q.; Ye, M.; Yu, J. Tear Luminex Analysis in Dry Eye Patients. Med. Sci. Monit. 2018, 24, 7595–7602. [Google Scholar] [CrossRef]
- Acera, A.; Rocha, G.; Vecino, E.; Lema, I.; Durán, J.A. Inflammatory Markers in the Tears of Patients with Ocular Surface Disease. Ophthalmic Res. 2008, 40, 315–321. [Google Scholar] [CrossRef]
- Massingale, M.L.; Li, X.; Vallabhajosyula, M.; Chen, N.; Wei, Y.; Asbell, P. Analysis of Inflammatory Cytokines in the Tears of Dry Eye Patients. Cornea 2009, 28, 1023–1027. [Google Scholar] [CrossRef]
- Calonge, M.C.; Enríquez-De-Salamanca, A.; Diebold, Y.; González-García, M.J.; Reinoso, R.; Herreras, J.M.; Corell, A. Dry Eye Disease as an Inflammatory Disorder. Ocul. Immunol. Inflamm. 2010, 18, 244–253. [Google Scholar] [CrossRef]
- Bron, A.J.; De Paiva, C.S.; Chauhan, S.K.; Bonini, S.; Gabison, E.E.; Jain, S.; Knop, E.; Markoulli, M.; Ogawa, Y.; Perez, V.; et al. TFOS DEWS II pathophysiology report. Ocul. Surf. 2017, 15, 438–510. [Google Scholar] [CrossRef] [PubMed]
- Stuchell, R.N.; Feldman, J.J.; Farris, R.L.; Mandel, I.D. The effect of collection technique on tear composition. Investig. Ophthalmol. Vis. Sci. 1984, 25, 374–377. [Google Scholar]
- Markoulli, M.; Gokhale, M.; You, J. Substance P in Flush Tears and Schirmer Strips of Healthy Participants. Optom. Vis. Sci. 2017, 94, 527–533. [Google Scholar] [CrossRef] [PubMed]
- Inic-Kanada, A.; Nussbaumer, A.; Montanaro, J.; Belij, S.; Schlacher, S.; Stein, E.; Bintner, N.; Merio, M.; Zlabinger, G.J.; Barisani-Asenbauer, T. Comparison of ophthalmic sponges and extraction buffers for quantifying cytokine profiles in tears using Luminex technology. Mol. Vis. 2012, 18, 2717–2725. [Google Scholar]
- Lafrance, M.W.; Kehinde, L.E.; Fullard, R.J. Multiple Cytokine Analysis in Human Tears: An Optimized Procedure for Cytometric Bead-Based Assay. Curr. Eye Res. 2008, 33, 525–544. [Google Scholar] [CrossRef]
- Wei, Y.; Gadaria-Rathod, N.; Epstein, S.; Asbell, P. Tear Cytokine Profile as a Noninvasive Biomarker of Inflammation for Ocular Surface Diseases: Standard Operating Procedures. Investig. Opthalmol. Vis. Sci. 2013, 54, 8327–8336. [Google Scholar] [CrossRef] [Green Version]
- Chao, C.; Richdale, K.; Jalbert, I.; Doung, K.; Gokhale, M. Non-invasive objective and contemporary methods for measuring ocular surface inflammation in soft contact lens wearers–A review. Contact Lens Anterior Eye 2017, 40, 273–282. [Google Scholar] [CrossRef]
- Ooi, K.G.-J.; Galatowicz, G.; Towler, H.M.A.; Lightman, S.; Calder, V. Multiplex Cytokine Detection versus ELISA for Aqueous Humor: IL-5, IL-10, and IFNγ Profiles in Uveitis. Investig. Opthalmol. Vis. Sci. 2006, 47, 272–277. [Google Scholar] [CrossRef]
- Benito, M.J.; González-García, M.J.; Tesón, M.; García, N.; Fernandez, I.; Calonge, M.C.; Enríquez-De-Salamanca, A. Intra- and inter-day variation of cytokines and chemokines in tears of healthy subjects. Exp. Eye Res. 2014, 120, 43–49. [Google Scholar] [CrossRef]
- Keustermans, G.C.; Hoeks, S.B.; Meerding, J.M.; Prakken, B.; De Jager, W. Cytokine assays: An assessment of the preparation and treatment of blood and tissue samples. Methods 2013, 61, 10–17. [Google Scholar] [CrossRef]
- Knobloch, K.; Yoon, U.; Vogt, P.M. Preferred reporting items for systematic reviews and meta-analyses (PRISMA) statement and publication bias. J. Cranio-Maxillofac. Surg. 2011, 39, 91–92. [Google Scholar] [CrossRef] [PubMed]
- Higgins, J.P.T.; GSe. Cochrane Handbook for Systematic Reviews of Interventions Version 5.1.0 the Cochrane Collaboration. 2011. Available online: www.handbook.cochrane.org (accessed on 1 March 2011).
- Stang, A. Critical evaluation of the Newcastle-Ottawa scale for the assessment of the quality of nonrandomized studies in meta-analyses. Eur. J. Epidemiol. 2010, 25, 603–605. [Google Scholar] [CrossRef] [PubMed] [Green Version]
- Guyatt, G.H.; Oxman, A.D.; E Vist, G.; Kunz, R.; Falck-Ytter, Y.; Alonso-Coello, P.; Schünemann, H.J. GRADE: An emerging consensus on rating quality of evidence and strength of recommendations. BMJ 2008, 336, 924–926. [Google Scholar] [CrossRef] [PubMed] [Green Version]
- DerSimonian, R.; Laird, N. Meta-analysis in clinical trials. Control. Clin. Trials 1986, 7, 177–188. [Google Scholar] [CrossRef]


| Selection | Comparability | Outcome | ||||
|---|---|---|---|---|---|---|
| Study | Reviewer A | Reviewer B | Reviewer A | Reviewer B | Reviewer A | Reviewer B |
| Benitez del Castillo et al. [16] Cocho et al. [9] Landsend et al. [10] Lee et al. [11] Mrugacz et al. [12] Nair et al. [13] Solomon et al. [8] Tishler et al. [14] Yoon et al. [15] Zhao et al. [17] Acera et al. [18] Massingale et al. [19] Lam et al. [7] | ★★★ ★★★★ ★★★ ★★★ ★★★★ ★★★ ★★★★ ★★★ ★★★★ ★★★ ★★★★ ★★ ★★★ | ★★★ ★★★★ ★★★ ★★★ ★★★★ ★★★ ★★★★ ★★★ ★★★★ ★★★ ★★★ ★★★ ★★★★ | ★ ★★ ★ ★ ★ ★ ★★ ★ ★ ★ ★ ★ ★ | ★ ★ ★★ ★ ★ ★ ★★ ★ ★ ★ ★ ★ ★ | ★★★ ★★★ ★★★ ★★★ ★★★ ★★★ ★★★ ★★★ ★★★ ★★★ ★★★ ★★ ★★★ | ★★★ ★★★ ★★★ ★★★ ★★★ ★★★ ★★★ ★★★ ★★★ ★★★ ★★★ ★★ ★★★ |
| Study | Study Group | Patients (n) | Tear Sample—Tear Collection | Cytokines Analysis | Results |
|---|---|---|---|---|---|
| Benitez-del-Castillo [16] | DED vs. control | 30 | Unstimulated tears—micropipette | Multiplex (Luminex R-200) | Higher levels of IL-1β, IL-2, IL-6, IL-8, IL-10, TNF-α and lower levels of VEGF in patients with DED |
| Cocho [9] | Chronic GVHD with DED vs. control | 22 | Unstimulated tears—capillary tube | Multiplex (Luminex IS-100) | Higher levels of IL-1Ra, IL-1β, IL-2, IL-6, IL-8, IL-10, IL-17A, and IFN-γ lower levels of EGF and IP-10 in patients with GVHD |
| Landsend [10] | DED w/aniridia vs. controls | 35 | Eluted from Schirmer strips—capillary tubes | Multiplex (Luminex IS 100) | A number of pro-inflammatory cytokines (IL-1β, IL-9, IL-17A, eotaxin, FGF2, and MIP-1a) are significantly elevated in tear fluid from DED w/aniridia patients, and correlate with parameters for MGD in aniridia. |
| Lee [11] | SS DED vs. non-SS DED vs control | 49 | Flush tears—micropipette | BDTM Cytometric Bead Array | Higher levels of IL-2, IL-4, IL-6, IL-10, IL-17A, and TNF-α in patients with SS-related DED |
| Mrugacz [12] | DED with depression vs. control | 32 | Unstimulated tears—micropipette | ELISA | Higher levels of IL-6, IL-17A and TNF-α in patients with DED and depression |
| Nair [13] | DED w/o GVHD vs. DED w/GVHD vs. control | 32 | Eluted from Schirmer strips—capillary tubes | Multiplex (Bio-plex-pro; Millipex) | Elevated levels of IL-2, IL 6, IL 8, IL 10, IL 12AP70, IL 17A, TNF-α, IFN-γ, and VEGF in DED w/GVHD eyes as compared to DED w/o GVHD and control eyes. |
| Solomon [8] | DED vs. control | 40 | Tears adsorbed with polyester wick | ELISA | Higher levels of IL-1α and IL-1β and lower levels of precursors IL-1β in patients with DED |
| Tishler [14] | pSS vs. control | 24 | Unstimulated tears—micropipette | ELISA | Higher levels of IL-6 in patients with primary SS |
| Yoon [15] | SS DED vs. non-SS DED vs. control | 32 | Unstimulated tears—micropipette | ELISA | Higher levels of IL-6 and TNF-α in patients with DED; higher levels of IL-6 in patients with SS-related DED |
| Acera [18] | DED vs. control | 46 | Tears adsorbed with cell sponge weck | ELISA | Higher levels of IL-1β and IL-6 in tear fluid of patients with DED and DED associated with blepharitis than in the control group |
| Lam [7] | DED vs. control | 40 | Unstimulated tears—micropipette | Multiplex (Luminex Beadlyte) | Higher levels of IL-1β, IL-6, IL-8, IL-12, and TNF-α in patients with DED |
| Zhao [17] | DED vs. control | 70 | Unstimulated tears—capillary tube | Multiplex (Luminex R-200) | Higher levels of TNF-α, IL-1α, IL-1β, IL-6, IL-8, IL-10, IL-12P70, IL-13, IFN-γ, and MIP-1a in DED patients compared with normal participants |
| Massingale [19] | DED vs. control | 14 | Unstimulated tears—microcapillaries | Multiplex (Luminex 100 TM) | Higher levels of IL-1β, IL-2, IL-4, IL-5, IL-6, IL-8, IL-10, IFN-γ, and TNF-α in DED patients |
© 2020 by the authors. Licensee MDPI, Basel, Switzerland. This article is an open access article distributed under the terms and conditions of the Creative Commons Attribution (CC BY) license (http://creativecommons.org/licenses/by/4.0/).
Share and Cite
Roda, M.; Corazza, I.; Bacchi Reggiani, M.L.; Pellegrini, M.; Taroni, L.; Giannaccare, G.; Versura, P. Dry Eye Disease and Tear Cytokine Levels—A Meta-Analysis. Int. J. Mol. Sci. 2020, 21, 3111. https://doi.org/10.3390/ijms21093111
Roda M, Corazza I, Bacchi Reggiani ML, Pellegrini M, Taroni L, Giannaccare G, Versura P. Dry Eye Disease and Tear Cytokine Levels—A Meta-Analysis. International Journal of Molecular Sciences. 2020; 21(9):3111. https://doi.org/10.3390/ijms21093111
Chicago/Turabian StyleRoda, Matilde, Ivan Corazza, Maria Letizia Bacchi Reggiani, Marco Pellegrini, Leonardo Taroni, Giuseppe Giannaccare, and Piera Versura. 2020. "Dry Eye Disease and Tear Cytokine Levels—A Meta-Analysis" International Journal of Molecular Sciences 21, no. 9: 3111. https://doi.org/10.3390/ijms21093111