
Weight Gain Prevention among Midlife Women: A Randomized Controlled Trial to Address Needs Related to the Physical and Social Environment


Abstract
:1. Introduction
2. Experimental Methods
2.1. Participants and Recruitment
2.2. Intervention Overview
2.3. Intervention Procedures
Lesson Development and Implementation
2.4. Measures
Anthropometric Measurements
2.5. Statistical Analysis
3. Results
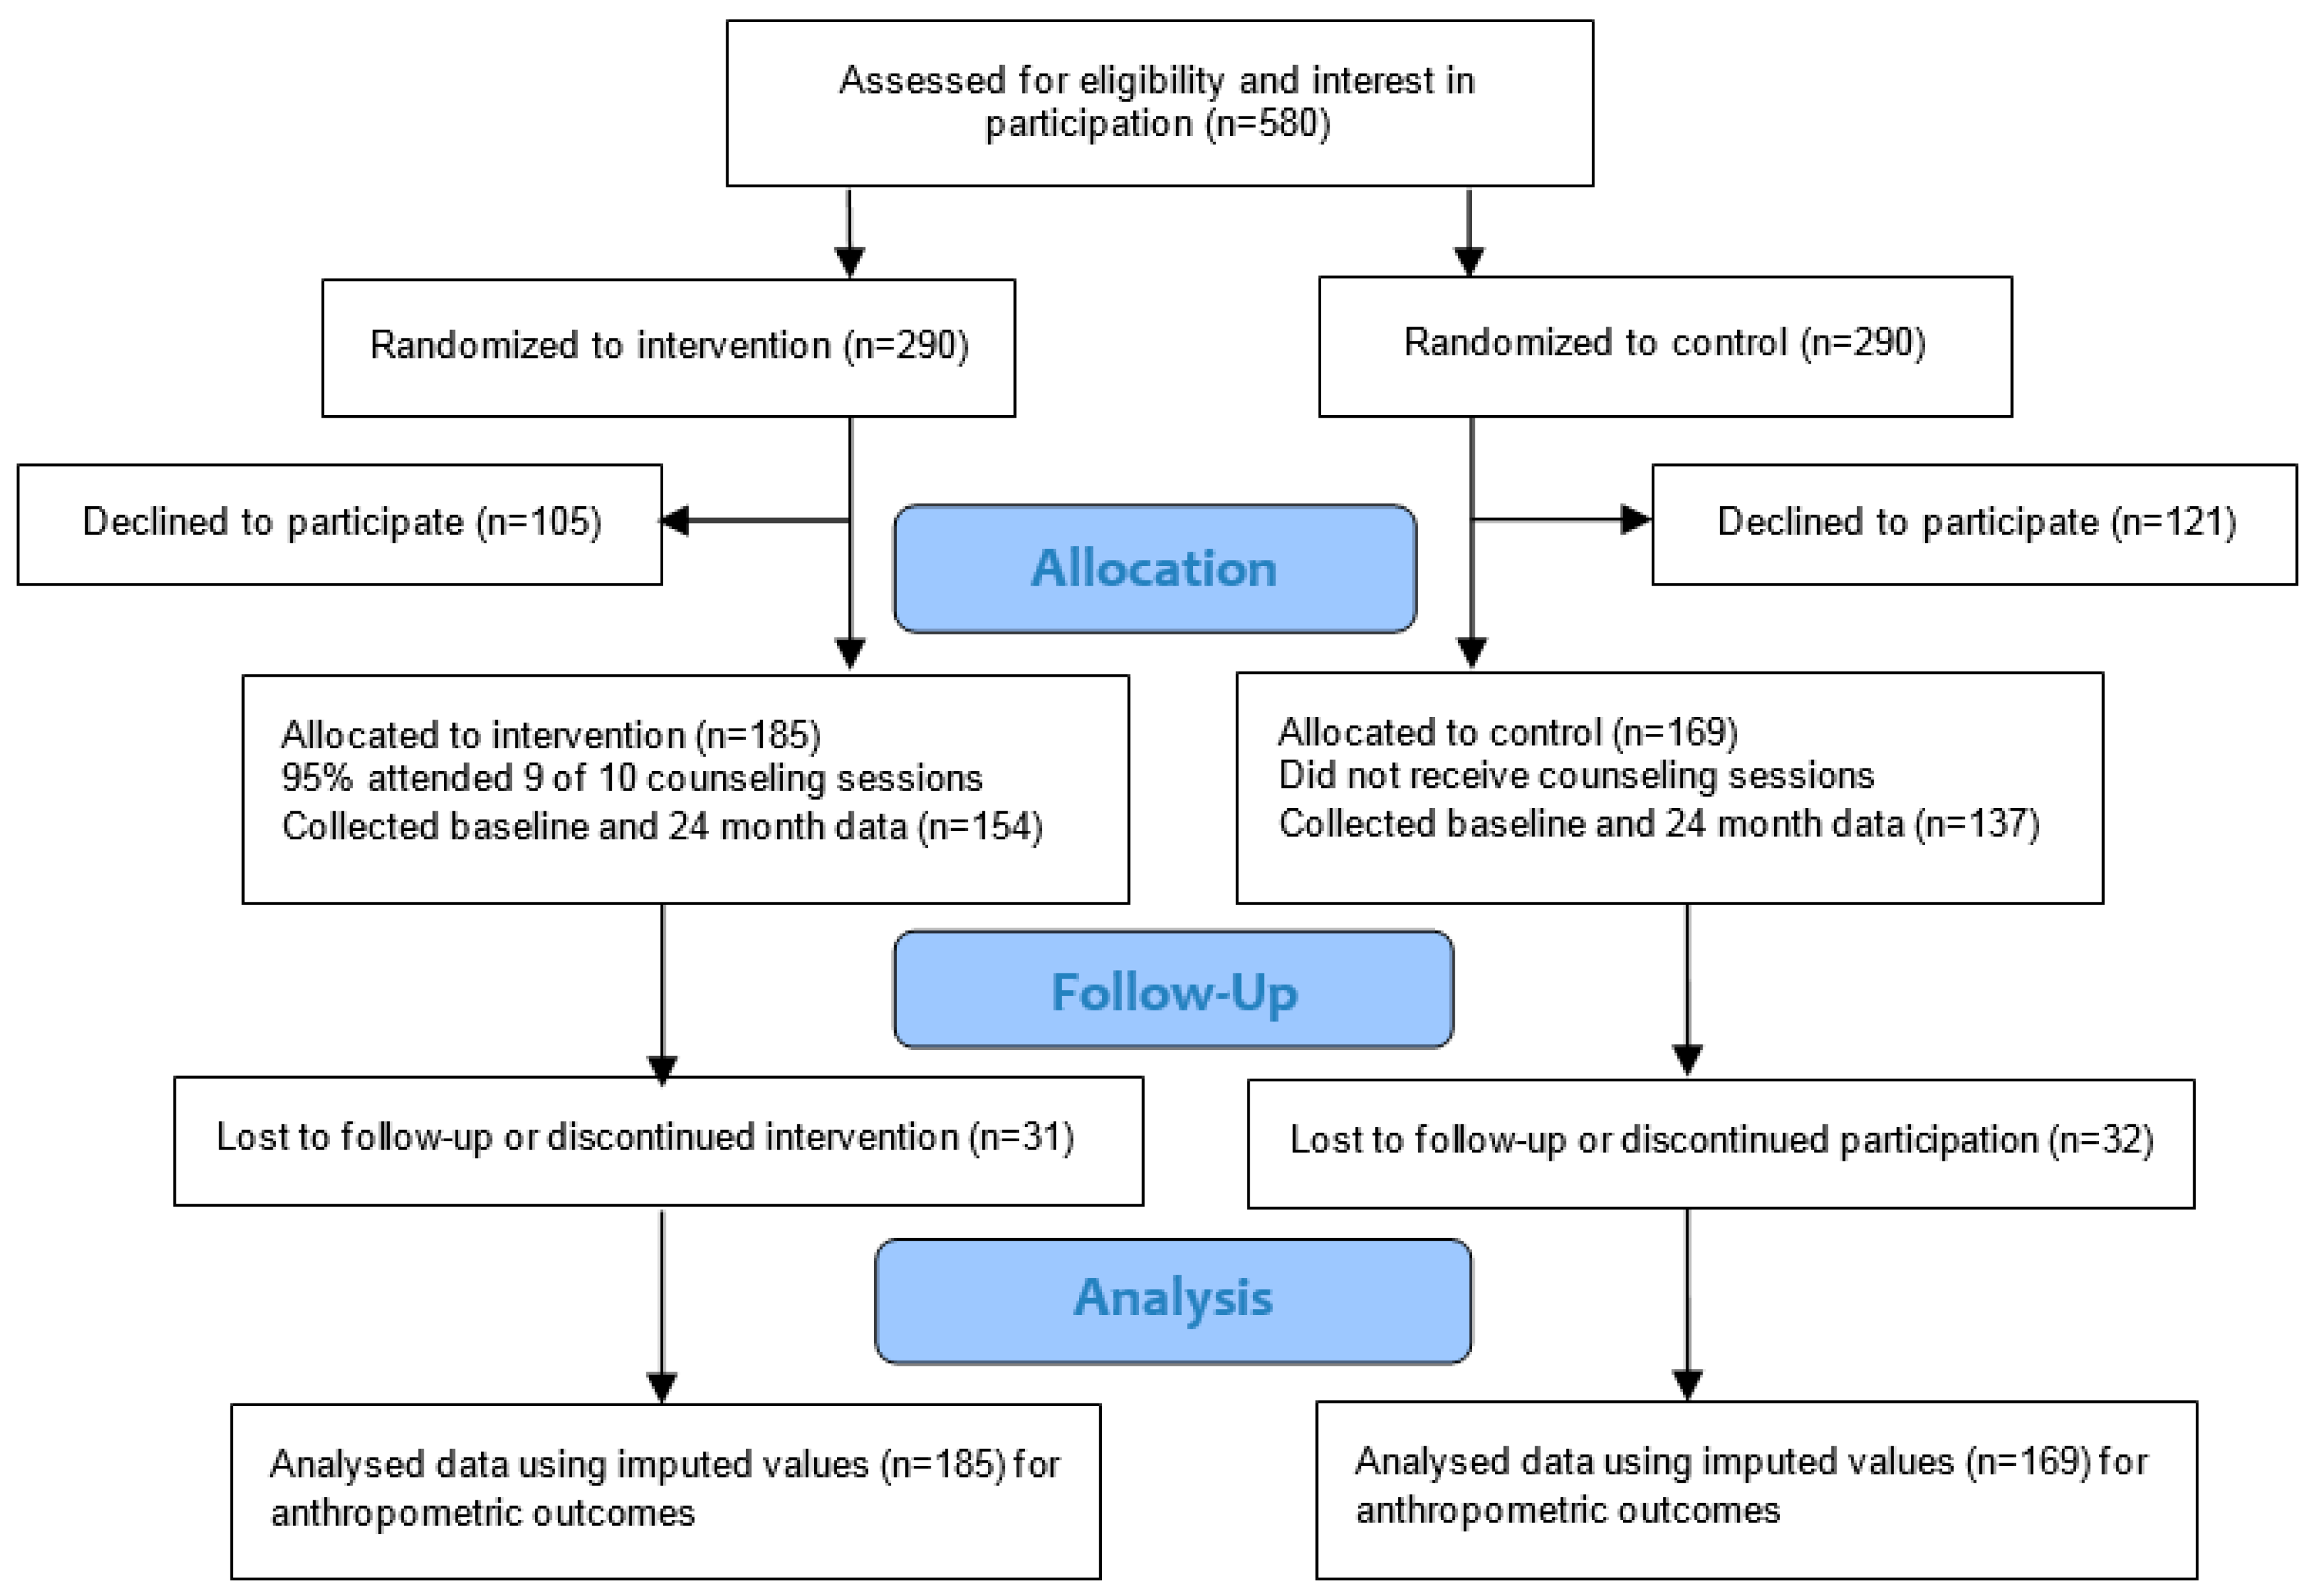
3.1. Retention
3.2. Demographic Characteristics
3.3. Food Group and Nutrient Intakes
3.4. Weight Change
4. Discussion
Limitations
5. Conclusions, Applications and Implications for Further Research
Acknowledgments
Author Contributions
Conflicts of Interest
References
- Lee, I.M.; Djousse, L.; Sesso, H.D.; Wang, L.; Buring, J.E. Physical activity and weight gain prevention. J. Am. Med. Assoc. 2010, 303, 1173–1179. [Google Scholar] [CrossRef] [PubMed]
- Nooyens, A.C.; Visscher, T.L.; Verschuren, W.M.; Schuit, A.J.; Boshuizen, H.C.; van Mechelen, W.; Seidell, J.C. Age, period and cohort effects on body weight and body mass index in adults: The Doetinchem cohort study. Public Health Nutr. 2009, 12, 862–870. [Google Scholar] [CrossRef] [PubMed]
- Sternfeld, B.; Wang, H.; Quesenberry, C.P., Jr.; Abrams, B.; Everson-Rose, S.A.; Greendale, G.; Matthews, K.A.; Torrens, J.I.; Sowers, M. Physical activity and changes in weight and waist circumference in midlife women: Findings from the Study of Women’s Health Across the Nation. Am. J. Epidemiol. 2004, 160, 912–922. [Google Scholar] [CrossRef] [PubMed]
- Stevens, J.; Erber, E.; Truesdale, K.P.; Wang, C.H.; Cai, J. Long- and short-term weight change and incident coronary heart disease and ischemic stroke: The Atherosclerosis risk in communities study. Am. J. Epidemiol. 2013, 178, 239–248. [Google Scholar] [CrossRef] [PubMed]
- Donahue, R.P.; Stranges, S.; Rafalson, L.; Dmochowski, J.; Dorn, J.; Trevisan, M. Risk factors for prehypertension in the community: A prospective analysis from the Western New York health study. Nutr. Metab. Cardiovasc. Dis. 2014, 24, 162–167. [Google Scholar] [CrossRef] [PubMed]
- Emaus, M.J.; van Gils, C.H.; Bakker, M.F.; Bisschop, C.N.; Monninkhof, E.M.; Bueno-de-Mesquita, H.B.; Travier, N.; Berentzen, T.L.; Overvad, K.; Tjønneland, A.; et al. Weight change in middle adulthood and breast cancer risk in the EPIC-PANACEA study. Int. J. Cancer 2014, 135, 2887–1899. [Google Scholar] [CrossRef] [PubMed]
- Brennan, S.L.; Cicuttini, F.M.; Pasco, J.A.; Henry, M.J.; Wang, Y.; Kotowicz, M.A.; Nicholson, G.C.; Wluka, A.E. Does an increase in body mass index over 10 years affect knee structure in a population-based cohort study of adult women? Arthritis Res. Ther. 2010, 12, R139. [Google Scholar] [CrossRef] [PubMed]
- Lombard, C.B.; Deeks, A.A.; Teede, H.J. A systematic review of interventions aimed at the prevention of weight gain in adults. Public Health Nutr. 2009, 12, 2236–2246. [Google Scholar] [CrossRef] [PubMed]
- Levine, M.D.; Klem, M.L.; Kalarchian, M.A.; Wing, R.R.; Weissfeld, L.; Qin, L.; Marcus, M.D. Weight gain prevention among women. Obesity 2007, 15, 1267–1277. [Google Scholar] [CrossRef] [PubMed]
- Lombard, C.; Deeks, A.; Jolley, D.; Ball, K.; Teede, H. A low intensity, community based lifestyle programme to prevent weight gain in women with young children: Cluster randomised controlled trial. BMJ 2010, 341, c3215. [Google Scholar] [CrossRef] [PubMed]
- Simkin-Silverman, L.R.; Wing, R.R.; Boraz, M.A.; Kuller, L.H. Lifestyle intervention can prevent weight gain during menopause: Results from a 5-year randomized clinical trial. Ann. Behav. Med. 2003, 26, 212–220. [Google Scholar] [CrossRef] [PubMed]
- Linde, J.A.; Nygaard, K.E.; MacLehose, R.F.; Mitchell, N.R.; Harnack, L.J.; Cousins, J.M.; Graham, D.J.; Jeffery, R.W. HealthWorks: Results of a multi-component group-randomized worksite environmental intervention trial for weight gain prevention. Int. J. Behav. Nutr. Phys. Act. 2012, 9, 14. [Google Scholar] [CrossRef] [PubMed]
- Williams, L.T.; Hollis, J.L.; Collins, C.E.; Morgan, P.J. Can a relatively low-intensity intervention by health professionals prevent weight gain in mid-age women? 12-month outcomes of the 40-something randomized controlled trial. Nutr. Diabetes 2014, 4, e116. [Google Scholar] [CrossRef] [PubMed]
- McAlister, A.L.; Perry, C.L.; Parcel, G.S. How individuals, environments, and health behaviors interact: Social cognitive theory. In Health Behavior and Health Education. Theory, Research and Practice, 4th ed.; Glanz, K., Rimer, B.K., Viswanath, K., Eds.; Jossey-Bass: San Francisco, CA, USA, 2008; pp. 169–185. [Google Scholar]
- Ahlgren, C.; Hammarström, A.; Sandberg, S.; Lindahl, B.; Olsson, T.; Larsson, C.; Fjellman-Wiklund, A. Engagement in new dietary habits-obese women’s experiences from participating in a 2-year diet intervention. Int. J. Behav. Med. 2016, 23, 84–93. [Google Scholar] [CrossRef] [PubMed]
- Rowe, S.; Alexander, N.; Almeida, N.G.; Black, R.; Burns, R.; Bush, L.; Crawford, P.; Keim, N.; Kris-Etherton, P.; Weaver, C. Translating the Dietary Guidelines for Americans 2010 to bring about real behavior change. J. Am. Diet. Assoc. 2011, 111, 28–39. [Google Scholar] [CrossRef] [PubMed]
- Keller, P.A.; Lehmann, D.R. Designing effective health communications: A meta-analysis. J. Public Policy Mark. 2008, 27, 117–130. [Google Scholar] [CrossRef]
- Eyles, H.C.; Mhurchu, C.N. Does tailoring make a difference? A systematic review of the long-term effectiveness of tailored nutrition education for adults. Nutr. Rev. 2009, 67, 464–480. [Google Scholar] [CrossRef] [PubMed]
- Miles, A.; Rapoport, L.; Wardle, J.; Afuape, T.; Duman, M. Using the mass-media to target obesity: An analysis of the characteristics and reported behaviour change of participants in the BBC’s “Fighting Fat, Fighting Fit” campaign. Health Educ. Res. 2001, 16, 357–372. [Google Scholar] [CrossRef] [PubMed]
- Slater, M.D.; Flora, J.A. Health lifestyles: Audience segmentation analysis for public health interventions. Health Educ. Q. 1991, 18, 221–233. [Google Scholar] [CrossRef] [PubMed]
- Sudo, N.; Degeneffe, D.; Vue, H.; Ghosh, K.; Reicks, M. Relationship between needs driving eating occasions and eating behavior in midlife women. Appetite 2009, 52, 137–146. [Google Scholar] [CrossRef] [PubMed]
- United States Department of Commerce; Bureau of the Census, and United States Department of Labor; Bureau of Labor Statistics. Current Population Survey: Annual Social and Economic (ASEC) Supplement Survey, 2006 (ICPSR0 4559). Available online: https://www.icpsr.umich.edu/icpsrweb/NACDA/studies/4559 (accessed on 29 February 2016).
- Brown, W.J.; Williams, L.; Ford, J.H.; Ball, K.; Dobson, A.J. Identifying the energy gap: Magnitude and determinants of 5-year weight gain in midage women. Obes. Res. 2005, 13, 1431–1441. [Google Scholar] [CrossRef] [PubMed]
- Milliken, L.A.; Martin, C.J.; Finkenthal, N.; Cussler, E.; Metcalfe, L.; Guido, T.A.; Going, S.B.; Lohman, T.G. Depressive symptoms and changes in body weight exert independent and site-specific effects on bone in postmenopausal women exercising for 1 year. J. Gerontol. Ser. A Biol. Sci. Med. Sci. 2006, 61, 488–494. [Google Scholar] [CrossRef]
- Perry, C. Eating Occasion Need States and Weight Gain Prevention in Midlife Women. Ph.D. Thesis, University of Minnesota, St. Paul, MN, USA, 1 December 2011. [Google Scholar]
- Ross, R.; Hill, J.O.; Latimer, A.; Day, A.G. Evaluating a small change approach to preventing long term weight gain in overweight and obese adults—Study rationale, design, and methods. Contemp. Clin. Trials 2016, 47, 275–281. [Google Scholar] [CrossRef] [PubMed]
- Lombard, C.; Harrison, C.; Kozica, S.; Zoungas, S.; Ranasinha, S.; Teede, H. Preventing weight gain in women in rural communities: A cluster randomised controlled trial. PLoS Med. 2016, 13, e1001941. [Google Scholar] [CrossRef] [PubMed]
- Kolar, A.S.; Patterson, R.E.; White, E.; Neuhouser, M.L.; Frank, L.L.; Standley, J.; Potter, J.D.; Kristal, A.R. A practical method for collecting 3-day food records in a large cohort. Epidemiology 2005, 16, 579–583. [Google Scholar] [CrossRef] [PubMed]
- Hislop, T.G.; Bajdik, C.D.; Balneaves, L.G.; Holmes, A.; Chan, S.; Wu, E.; Abanto, Z.U.; Butler, A.L. Physical and emotional health effects and social consequences after participation in a low-fat, high-carbohydrate dietary trial for more than 5 years. J. Clin. Oncol. 2006, 24, 2311–2317. [Google Scholar] [CrossRef] [PubMed]
- Godin, G.; Shephard, R.J. A simple method to assess exercise behavior in the community. Can. J. Appl. Sport Sci. 1985, 10, 141–146. [Google Scholar] [PubMed]
- United States Department of Agriculture. ChooseMyPlate Food Guidance System Website. Available online: http://www.choosemyplate.gov/ (accessed on 29 February 2016).
- Lohman, T.G.; Roche, A.F.; Martorell, R. Anthropometric Standardization Reference Manual; Human Kinetics Books: Champaign, IL, USA, 1991. [Google Scholar]
- Burke, L.E.; Wang, J.; Sevick, M.A. Self-monitoring in weight loss: A systematic review of the literature. J. Am. Diet. Assoc. 2011, 111, 92–102. [Google Scholar] [CrossRef] [PubMed]
- Mycroft, H. Morality and accountability in a commercial weight management group. J. Health Psychol. 2008, 13, 66–75. [Google Scholar] [CrossRef] [PubMed]
- Pillet-Shore, D. Weighing in primary-care nurse-patient interactions. Soc. Sci. Med. 2006, 62, 407–421. [Google Scholar] [CrossRef] [PubMed]
- Schulz, M.; Nothlings, U.; Hoffmann, K.; Bergmann, M.M.; Boeing, H. Identification of a food pattern characterized by high-fiber and low-fat food choices associated with low prospective weight change in the EPIC-Potsdam cohort. J. Nutr. 2005, 135, 1183–1189. [Google Scholar] [PubMed]
- Schulze, M.B.; Fung, T.T.; Manson, J.E.; Willett, W.C.; Hu, F.B. Dietary patterns and changes in body weight in women. Obesity (Silver Spring) 2006, 14, 1444–1453. [Google Scholar] [CrossRef] [PubMed]
- Gopinath, B.; Russell, J.; Kifley, A.; Flood, V.M.; Mitchell, P. Adherence to dietary guidelines and successful aging over 10 years. J. Gerontol. A Biol. Sci. Med. Sci. 2016, 71, 349–355. [Google Scholar] [CrossRef] [PubMed]
- Jeffery, R.W.; Harnack, L.J. Evidence implicating eating as a primary driver for the obesity epidemic. Diabetes 2007, 56, 2673–2676. [Google Scholar] [CrossRef] [PubMed]
- Allicock, M.; Ko, L.; van der Sterren, E.; Valle, C.G.; Campbell, M.K.; Carr, C. Pilot weight control intervention among US veterans to promote diets high in fruits and vegetables. Prev. Med. 2010, 51, 279–281. [Google Scholar] [CrossRef] [PubMed]
- Kroeze, W.; Werkman, A.; Brug, J. A systematic review of randomized trials on the effectiveness of computer-tailored education on physical activity and dietary behaviors. Ann. Behav. Med. 2006, 31, 205–223. [Google Scholar] [CrossRef] [PubMed]
- Hutfless, S.; Gudzune, K.A.; Maruthur, N.; Wilson, R.F.; Bleich, S.N.; Lau, B.D.; Fawole, O.A.; Anderson, C.A.; Segal, J. Strategies to prevent weight gain in adults. A systematic review. Am. J. Prev. Med. 2013, 45, e41–e51. [Google Scholar] [CrossRef] [PubMed]
- Hebert, J.R.; Clemow, L.; Pbert, L.; Ockene, I.S.; Ockene, J.K. Social desirability bias in dietary self-report may compromise the validity of dietary intake measures. Int. J. Epidemiol. 1995, 24, 389–398. [Google Scholar] [CrossRef] [PubMed]
- Taren, D.L.; Tobar, M.; Hill, A.; Howell, W.; Shisslak, C.; Bell, I.; Ritenbaugh, C. The association of energy intake bias with psychological scores of women. Eur. J. Clin. Nutr. 1999, 53, 570–578. [Google Scholar] [CrossRef] [PubMed]
- Tooze, J.A.; Subar, A.F.; Thompson, F.E.; Troiano, R.; Schatzkin, A.; Kipnis, V. Psychosocial predictors of energy underreporting in a large doubly labeled water study. Am. J. Clin. Nutr. 2004, 79, 795–804. [Google Scholar] [PubMed]


| Characteristics | Healthy Eating Occasion Needs | Less-Healthy Eating Occasion Needs | ||||
|---|---|---|---|---|---|---|
| Healthy Express | Comforting Interludes | Sensible Meals | Nurturing Family Meals | Indulgent Escapes | Fast Fueling | |
| Defining needs influenced by the physical and social environment | Eat healthy and quickly; Balance and control food & calorie intakes; Minimize time and effort | Personal moment, relax/unwind; Enjoy light meal or snack; Sensory gratification; Easy; Somewhat healthy, eat light | Eat healthy and responsibly; Control weight; Control calorie, fat, cholesterol, carbohydrate intakes | Show love, driven by emotional needs as caregiver; Family time with minimal complaints; Likely forsaking personal nutritional needs | Indulgent treat/reward; Focus on taste experience; Sensory gratification; Emotional benefit | Catch a quick bite, on the run; Eat quickly; Eat while doing other things; Dictated by time |
| Foods sought | Minimal effort, preparation, clean-up; Fast but still healthy; Low in fat, sodium; Nutrient dense | Satisfies craving; Fun to eat; Easy and fast, portable; Somewhat healthy | Healthy; Low in calories, fat, cholesterol, carbohydrates; Nutrient dense | Enjoyed by everyone; Nutritionally balanced; Within family budget | Satisfies cravings; Readily available; Treat, rich/indulgent; Easy to eat; Nostalgic connection | Minimal effort, planning, preparation, clean-up; Fast and ready to eat/portable; Easy to eat |
| Situation | Breakfast/lunch, weekday; Alone; At home or carried along | Breakfast/snack; Alone or with other adults; At home or away | Main meals; Alone or with other adults; At home | Dinner; Other adults and children; At home | Snacks; Alone; At home or restaurant | Lunch; Alone; At home or carried along |
| Lesson topics | Portion sizes; Time-saving strategies; Convenience foods; Nutrition information | Trigger identification, hunger scale use; Engage senses; Work/home environment changes; Alternative rewards | Health/nutrition claims on labels; Weekly meal plan; Recipe makeovers | Healthier options available; Meal planning; Grocery shopping tactics; Compare labels | Emotional vs. physical hunger, hunger scale; Non-food rewards; Compensation; Healthier options available; Strategies and plans | Healthy, on-the-go options, meal planning; Work/home environment changes; Nutritional cost of fast-food meals; Beverage calories |
| Variable | All Participants n = 354 | Intervention Group n = 185 | Control Group n = 169 | p Value (χ2 Test) |
| n (%) | n (%) | n (%) | ||
| Race | 0.64 | |||
| White | 275 (77.7 ) | 140 (75.7) | 135 (79.9) | |
| Black | 32 (9.0) | 20 (10.8) | 12 (7.1) | |
| Asian | 18 (5.1) | 9 (4.9) | 9 (5.3) | |
| Native American | 1 (0.3) | 1 (0.5) | 0 (0.0) | |
| Other | 28 (7.9) | 15 (8.1) | 13 (7.7) | |
| Spanish Origin | 0.99 | |||
| Non-Hispanic | 333 (94.1) | 174 (94.1) | 159 (94.1) | |
| Hispanic | 21 (5.9) | 11 (5.9) | 10 (2.8) | |
| Marital Status | 0.42 | |||
| Never Married | 29 (8.2) | 17 (9.2) | 12 (7.1) | |
| Married | 272 (76.8) | 136 (73.5) | 136 (80.5) | |
| Married, not Living with Spouse | 4 (1.1) | 3 (1.6) | 1 (0.6) | |
| Divorced/Widowed | 49 (13.9) | 29 (15.7) | 20 (11.8) | |
| Income | 0.88 | |||
| <20 K | 16 (4.5) | 9 (4.9) | 7 (4.1) | |
| 20–40 K | 39 (11.0) | 24 (13.0) | 15 (8.9) | |
| 40–60 K | 64 (18.1) | 33 (17.8) | 31 (18.3) | |
| 60–80 K | 61 (17.2) | 31 (16.8) | 30 (17.8) | |
| 80–100 K | 54 (15.3) | 28 (15.1) | 26 (15.4) | |
| >100 K | 103 (29.1) | 53 (28.6) | 50 (29.6) | |
| Refused | 17 (4.8) | 7 (3.8) | 10 (5.9) | |
| Employment | 0.07 | |||
| Full-time | 171 (48.3) | 85 (46.0) | 86 (50.9) | |
| Part-time | 104 (29.4) | 48 (25.9) | 56 (33.1) | |
| Not Employed | 37 (10.4) | 23 (12.4) | 14 (8.3) | |
| Homemaker | 36 (10.2) | 4 (13.0) | 12 (7.1) | |
| Retired | 6 (1.7) | 5 (2.7) | 1 (0.6) | |
| Education | 0.39 | |||
| High School | 25 (7.1) | 13 (7.0) | 12 (7.1) | |
| Some College | 86 (24.3) | 51 (27.6) | 35 (20.7) | |
| 2-Year College | 62 (17.5) | 35 (18.9) | 27 (16.0) | |
| 4-Year College | 144 (40.7) | 70 (37.8) | 74 (43.8) | |
| Graduate School | 37 (10.4) | 16 (8.7) | 21 (12.4) | |
| BMI Category | 0.60 | |||
| Less than 18.5 | 2 (0.7) | 1 (0.6) | 1 (0.7) | |
| 18.5–24.9 | 116 (39.9) | 60 (39.0) | 56 (40.9) | |
| 25.0–29.9 | 94 (32.3) | 46 (29.9) | 48 (35.0) | |
| 30 and above | 79 (27.1) | 47 (30.5) | 32 (23.4) | |
| Menopausal Status | 0.67 | |||
| Pre-menopausal | 174 (49.2) | 93 (50.3) | 81 (47.9) | |
| Post-menopausal | 180 (50.9) | 92 (49.7) | 88 (52.1) | |
| Variable | Mean (SD) | Mean (SD) | Mean (SD) | p Value (t-test) |
| Age (years) | 50.1 (5.1) | 49.9 (5.1) | 50.4 (5.1) | 0.31 |
| Household Design | Mean (SD) | Mean (SD) | Mean (SD) | |
| Adults in Household | 2.2 (0.8) | 2.2 (0.9) | 2.2 (0.7) | 0.99 |
| Children in Household | 0.9 (1.2) | 1.0 (1.2) | 0.8 (1.1) | 0.16 |
| Dietary Variable b | Baseline | 6 Months | 12 Months | 18 Months | 24 Months | Mean Difference | Overall Mixed Effect p Value | |||||
|---|---|---|---|---|---|---|---|---|---|---|---|---|
| Intervention (n = 174) | Control (n = 148) | Intervention (n = 167) | Control (n = 139) | Intervention (n = 152) | Control (n = 138) | Intervention (n = 151) | Control (n = 133) | Intervention (n = 154) | Control (n = 135) | Intervention and Control Group (95% CI) c (n = 322) | ||
| Energy, kcal | 1777 (38) | 1744 (36) | 1655 (33) | 1726 (43) | 1689 (39) | 1666 (41) | 1678 (42) | 1658 (37) | 1632 (37) | 1696 (42) | −35.1 (−101.4, 31.1) | 0.30 |
| Total fat, g | 39.8 (0.6) | 39.2 (0.7) | 38.9 (07) | 39.1 (0.7) | 38.3 (0.6) | 37.5 0.7) | 38.5 (0.7) | 38.7 (0.8) | 37.2 (0.6) | 37.8 (0.8) | −0.25 (−1.33, 0.84) | 0.67 |
| Saturated fat, g | 13.4 (0.3) | 13.4 (0.3) | 12.9 (0.3) | 13.0 (0.3) | 12.8 (0.3) | 2.1 (0.3) | 12.6 (0.3) | 12.9 (0.4) | 12.1 (0.3) | 12.6 (0.3) | −0.03 (−0.50, 0.44) | 0.90 |
| Sodium, mg | 1691 (27) | 1668 (31) | 1679 (25) | 1608 (28) | 1742 (29) | 1778 (48) | 1799 (34) | 1674 (30) | 1715 (31) | 1694 (27) | 32.5 (−19.0, 84.0) | 0.21 |
| Total fiber, g | 10.6 (0.3) | 11.1 (0.4) | 12.1 (0.3) | 11.9 (0.4) | 11.4 (0.3) | 11.6 (0.4) | 11.6 (0.3) | 11.5 (0.3) | 11.8 (0.3) | 11.6 (0.3) | 0.51 (−0.26, 1.28) | 0.19 |
| Fruit d | 1.5 (0.1) | 1.6 (0.1) | 1.7 (0.1) | 1.8 (0.1) | 1.6 (0.1) | 1.5 (0.1) | 1.7 (0.1) | 1.5 (0.1) | 2.0 (0.1) | 1.5 (0.1) | 0.18 (0.02, 0.35) | 0.03 |
| Vegetable d | 2.6 (0.1) | 2.8 (0.1) | 2.9 (0.1) | 3.1 (0.1) | 2.9 (0.1) | 2.8 (0.1) | 2.8 (0.1) | 2.9 (0.1) | 2.8 (0.1) | 3.0 (0.1) | 0.03 (−0.19, 0.26) | 0.78 |
| Whole grains d | 1.2 (0.1) | 1.3 (0.1) | 1.4 (0.1) | 1.3 (0.1) | 1.5 (0.1) | 1.4 (0.1) | 1.3 (0.1) | 1.2 (0.1) | 1.2 (0.1) | 1.3 (0.1) | 0.10 (−0.05, 0.24) | 0.21 |
| Refined grains d | 3.8 (0.1) | 3.6 (0.2) | 3.1 (0.1) | 3.3 (0.1) | 2.9 (0.2) | 3.4 (0.2) | 3.1 (0.2) | 3.2 (0.2) | 3.0 (0.2) | 3.3 (0.2) | −0.32 (−0.57, −0.07) | 0.01 |
| Low/reduced-fat dairy d | 1.1 (0.1) | 1.1 (0.1) | 1.2 (0.1) | 1.1 (0.1) | 1.3 (0.1) | 1.0 (0.1) | 1.2 (0.1) | 1.1 (0.1) | 1.1 (0.1) | 1.1 (0.1) | 0.14 (0.04, 0.24) | 0.01 |
| Sugars and candy d | 1.4 (0.1) | 1.1 (0.1) | 0.8 (0.1) | 1.1 (0.1) | 0.9 (0.1) | 1.0 (0.1) | 1.0 (0.1) | 0.8 (0.1) | 0.9 (0.1) | 1.0 (0.1) | −0.14 (−0.32, 0.01) | 0.08 |
| Added fats d | 2.6 (0.1) | 2.6 (0.1) | 2.2 (0.1) | 2.6 (0.1) | 2.0 (0.1) | 2.1 (0.1) | 2.1 (0.1) | 2.1 (0.1) | 1.7 (0.1) | 2.0 (0.1) | −0.18 (−0.38, 0.02) | 0.07 |
| Anthropometric Variable | Baseline | 6 Months | 12 Months | 18 Months | 24 Months | Mean Difference (95% CI) Intervention and Control b | Overall Mixed Effect p Value | |||||
|---|---|---|---|---|---|---|---|---|---|---|---|---|
| Intervention | Control | Intervention | Control | Intervention | Control | Intervention | Control | Intervention | Control | |||
| All women | (n = 185) | (n = 169) | (n = 169) | (n = 137) | (n = 156) | (n = 143) | (n = 152) | (n = 135) | (n = 154) | (n = 137) | (n = 354) | |
| Weight (kg) | 76.6 (1.3) | 74.2 (1.4) | 76.1 (1.3) | 74.2 (1.4) | 76.5 (1.3) | 74.4 (1.4) | 76.3 (1.3) | 74.2 (1.4) | 76.8 (1.3) | 74.6 (1.4) | −0.31 (−1.09, 0.46) | 0.43 |
| BMI (kg/m2) | 28.0 (0.5) | 27.5 (0.5) | 27.8 (0.5) | 27.5 (0.5) | 27.9 (0.5) | 27.6 (0.5) | 27.9 (0.5) | 27.5 (0.5) | 28.1 (0.5) | 28.1 (0.5) | −0.09 (−0.39, 0.21) | 0.57 |
| Waist circumference (cm) | 85.4 (1.0) | 83.7 (1.0) | 84.5 (1.0) | 83.2 (1.0) | 85.2 (1.0) | 83.6 (1.0) | 85.2 (1.0) | 83.3 (1.0) | 85.1 (1.0) | 83.6 (1.0) | −0.05 (−0.88, 0.77) | 0.89 |
© 2016 by the authors; licensee MDPI, Basel, Switzerland. This article is an open access article distributed under the terms and conditions of the Creative Commons Attribution (CC-BY) license (http://creativecommons.org/licenses/by/4.0/).
Share and Cite
Perry, C.D.; Degeneffe, D.; Davey, C.; Kollannoor-Samuel, G.; Reicks, M. Weight Gain Prevention among Midlife Women: A Randomized Controlled Trial to Address Needs Related to the Physical and Social Environment. Int. J. Environ. Res. Public Health 2016, 13, 530. https://doi.org/10.3390/ijerph13060530
Perry CD, Degeneffe D, Davey C, Kollannoor-Samuel G, Reicks M. Weight Gain Prevention among Midlife Women: A Randomized Controlled Trial to Address Needs Related to the Physical and Social Environment. International Journal of Environmental Research and Public Health. 2016; 13(6):530. https://doi.org/10.3390/ijerph13060530
Chicago/Turabian StylePerry, Courtney D., Dennis Degeneffe, Cynthia Davey, Grace Kollannoor-Samuel, and Marla Reicks. 2016. "Weight Gain Prevention among Midlife Women: A Randomized Controlled Trial to Address Needs Related to the Physical and Social Environment" International Journal of Environmental Research and Public Health 13, no. 6: 530. https://doi.org/10.3390/ijerph13060530