Evaluation of the Hydro—Mechanical Efficiency of External Gear Pumps


Fluid Power Lab, Engineering Department Enzo Ferrari, via P. Vivarelli 10, 41125 Modena, Italy
*
Author to whom correspondence should be addressed.
Energies 2019, 12(13), 2468; https://doi.org/10.3390/en12132468
Submission received: 29 March 2019
/
Revised: 24 May 2019
/
Accepted: 23 June 2019
/
Published: 26 June 2019
(This article belongs to the Special Issue Energy Efficiency and Controllability of Fluid Power Systems 2018)
Abstract
:This paper proposes and describes a model for evaluating the hydro-mechanical efficiency of external gear machines. The model is built considering and evaluating the main friction losses in the machines, including the viscous friction losses at the tooth tip gap, at the bearing blocks-gears gaps, at the journal bearings, and the meshing loss. To calculate the shear stress at each gap interface, the geometry of the gap has to be known. For this reason, the actual position of the gears inside the pump casing and consequent radial pressure distribution are numerically calculated to evaluate the gap height at the tooth tips. Moreover, the variation of the tilt and reference height of the lateral gaps between the gears and the pump bushings are considered. The shear stresses within the lateral gaps are estimated, for different lateral heights and tilt values. At the journal bearings gaps, the half Sommerfeld solution has been applied. The meshing loss has been calculated according to the suggestion of the International Standards. The hydro-mechanical efficiency results are then discussed with reference to commercial pumps experimentally characterized by the authors in a previous work. The average percentage deviation from experimental data was around 2%, without considering the most critical operating conditions (high delivery pressure, low rotational speed). The limits of this approach are also explained. Finally, the role of each source of loss is discussed, considering different operating conditions and two values of fluid viscosity. Lateral gap losses and meshing loss are much more relevant in determining the hydro-mechanical efficiency variation in the pump’s operating range, especially at a low delivery pressure. Moreover, while lateral gap losses increase with the rotational speed, the meshing loss shows the opposite behavior. The tooth tip gap losses are never as relevant, but they increase at high pressure. The journal bearings losses become comparable with the lateral and meshing ones at high delivery pressure values. Considering the pumps analyzed and the operating range of delivery pressure values and rotational speed values, the meshing loss made the mechanical efficiency vary in a percentage range of ±7%, with lateral losses in the range of about the ±15%, when also considering the extreme operating points (low speed, high pressure; high speed, low pressure). The weight of the lateral losses slightly reduced when we analyzed the higher temperature results, while the meshing losses slightly increased.
1. Introduction
This paper proposes and describes a model for the evaluation of the hydro-mechanical efficiency of external gear machines. The efficiency of positive displacement machines is a critical topic, as today, all fluid power applications have been challenged to reduce energy dissipation, with the aim of reducing pollution and fuel consumption (mobile applications) or electric and other energy requirements (industrial applications). Specifically, external gear machines are often used in fluid power applications since they are robust, affordable, and able to work with fluids characterized by an average level of contamination. Given their wide diffusion it’s not a surprise that many researchers in past and recent times have studied these kinds of machines, using both experimental and numerical methodologies. A comprehensive review of the scientific literature focused on gear machines (gerotor, external, and internal gear types) is reported in [1]. Among the main contributions to external gear machines, we should mention the works of Koc et al. [2], who studied the design and behavior of hydraulically balanced gear pumps, and of Mancò and Nervegna [3], who performed an experimental analysis by measuring the pressure within the inter-teeth volume chambers and compared the data with the numerical results coming from a lumped parameter model. Later, Borghi et al. [4,5,6,7,8] comprehensively studied the radial and axial balance of external gear pumps and motors, discussing the role of these two aspects in determining the volumetric efficiency of the machine. Vacca et al. [9,10,11,12,13] developed a complex numerical model able to simulate the radial balance of the external gear machine together with a detailed analysis of the lubricating gaps, considering the elastic deformation of the surfaces due to the pressure and temperature distribution inside the gaps. Moreover, del Campo et al. [14,15] applied extensive CFD analysis and experimental measurements, focusing in particular on the study of cavitation and of the meshing process of external gear pumps. Cavitation in external gear pumps is a topic also improved by Edge et al. in [16], Borghi et al. in [17], and Frosina et al. in [18], with different approaches, using in-house and commercial CFD code. Wang et al. [19] applied the control volume approach, focusing on the analysis and optimization of the design of the machine to improve performance. Mucchi et al. [20,21] have also studied external gear pumps by means of a lumped parameter approach coupled with a finite element model, with special focus on vibration and noise emissions analyses. All these contributions have been important to generate knowledge about the physical phenomena influencing the performance of these kinds of positive displacement machines, and at the same time, to improve and propose new designs. Among the aspects studied, as also observed in [1], the analysis and evaluation of hydro-mechanical efficiency is one of the less commonly considered. An experimental analysis regarding the efficiency of external gear pumps, discussing volumetric and hydro-mechanical efficiency trends, is reported in [22], and these experimental data are used also in the present paper, to validate the proposed model.
Generally speaking, there are two main approaches in the literature to numerically evaluate hydro-mechanical efficiency. One method is based on the interpolation of experimental data followed by a description of the hydro-mechanical efficiency trend by means of coefficients. This method can be effective and can lead to low inaccuracies with respect the experimental data. As a downside, the impact of macro-design parameters and operating conditions may be lost in the attempt to replicate the experimental data in the best possible way. The other approach is to study, within the machine, the complex gap interfaces that are considered the main elements responsible in influencing pump efficiency (for example [23]).
The model presented in this paper aims to consider the relevant phenomena within the machine during its operation; this method can influence hydro- mechanical efficiency without also losing the simplicity of setting parameters and while remaining able to highlight the role of the macro design parameters and operating conditions.
To do that, the proposed model takes into account the position of the gears inside the pump casing, calculated with a numerical procedure for each operating condition and design of the pump. This is an important aspect not only for the evaluation of the gap at the teeth tip where viscous friction losses can arise, but also because it influences the radial pressure distribution within the inter-teeth volumes of the gears and, as a consequence, the axial balance of the pump.
In this model the bushing block lateral height is derived from the mechanical tolerances of the components and their coupling (two extreme values are normally considered in the tests, inside the range of the tolerances), and a variable tilt for the bearing blocks inside the casing is considered. Finally, the model includes loss due to the meshing process. At the end, the designer has only to tune one parameter, the lateral gap tilt, because the design and operating parameters are already known.
By comparison with the experimental data, it is shown that the model is able to qualitatively depict the hydro-mechanical efficiency trend as the operating condition of the pump changes, which allows us to discuss the role of each loss when different operating conditions and pump designs are considered.
The model is discussed for the case of pumps but can be modified and also applied in the case of motors.
In the following parts of the paper, the reader will find: an introduction of the hydro-mechanical efficiency of the external gear pump and its calculation in the scientific literature by means of an interpolation of data, how the mechanical efficiency has been calculated in the numerical model presented here and a discussion of the results obtained together with the comparison between experimental and numerical results.
2. The Hydro-Mechanical Efficiency Definition and Evaluation
The hydro-mechanical efficiency for a positive displacement pump is defined as the ratio between the theoretical torque Tth at the shaft of the machine over the real torque Tr:
The theoretical torque is calculated by means of the machine displacement V (the volume of fluid displaced at each revolution of the shaft) and the pressure difference between the ports of the machine Δp. The real torque can be defined as the sum of the theoretical torque and all the losses Ti,loss due to mechanical and viscous friction. Mechanical efficiency can be evaluated experimentally using numerical models. Both ways may be challenging, and the numbers obtained with the experimental analysis may be affected by an inaccuracy that is unexpectedly high [24,25].
For example, when measuring the torque at the pump shaft within a high interval of delivery pressure values, the error of the torque meter—often given as a percentage of the instrument’s full scale—happens to be quite high when measuring near the zero of the scale, and reduces to a very small value when measuring near the full scale. Moreover, the displacement of the pump, being calculated from measured data, is affected by an error.
When moving to the numerical models, in order to be able to evaluate the efficiency of the positive displacement pumps, complex tribology problems that involve the gaps of the machine should be analyzed. The downside of this analysis is that, given the complexity of the approach, this method is not easily applicable in the context of daily industrial work and requires one to develop a proper numerical procedure.
On the other hand, there exist models which synthesize a wide experimental analysis using an equation [26], which is hopefully able to depict the physical phenomena that influence the efficiency definition. This approach is, however, valid for the pumps tested and has to be repeated anytime the pump design changes significantly. Sometimes, the definition of interpolating curves leads to the definition of negative coefficients and the connection between the physical phenomena and the efficiency definition is, hence, lost [27].
Similar models have been introduced by Wilson [28] and have been discussed later by many authors, such as Ivantysin and Ivantysinova (again in [27]), Zarotti et al. in [29], and Osinski et al. in [30], who also introduced modifications and new coefficients to better reproduce the experimental trends. These models distinguish the sources of the losses in:
- Viscous friction torque loss Tμ: the product between viscosity , a coefficient of torque loss due to Newtonian friction , linked to the dimensions of the pump, the angular speed of the pump and the displacement .
- Dry friction torque loss Tcl: the product between the theoretical torque and a coefficient of torque loss due to Coulomb friction .
- Constant torque loss : independent from both load and speed.
- Density related torque loss Tρ: which can be expressed as the product of fluid density , the square of the rotational speed and a coefficient of torque loss linked to density, . This term has been introduced in both the Osinski and Ivantysynova models.
Following this approach, when testing a high number of pumps, it is possible to define general laws that describe the relation between efficiency and the operating conditions, fluid viscosity, and some major geometric parameters, as in [26]. However, to be as general as possible, these models may be unable to describe some aspects that influence efficiency, thus losing the ability to be used during the design phase in order to improve machine performance.
The approach preferred in this paper is to try to describe each loss, starting from the physical phenomena that determine it, as described in the following sections of the paper.
3. Definition of the Contribution of Losses
The evaluation of mechanical and viscous losses has been approached here considering the physical phenomena behind each single kind of loss, while at the same time trying to maintain the definition of all the parameters needed to define each loss.
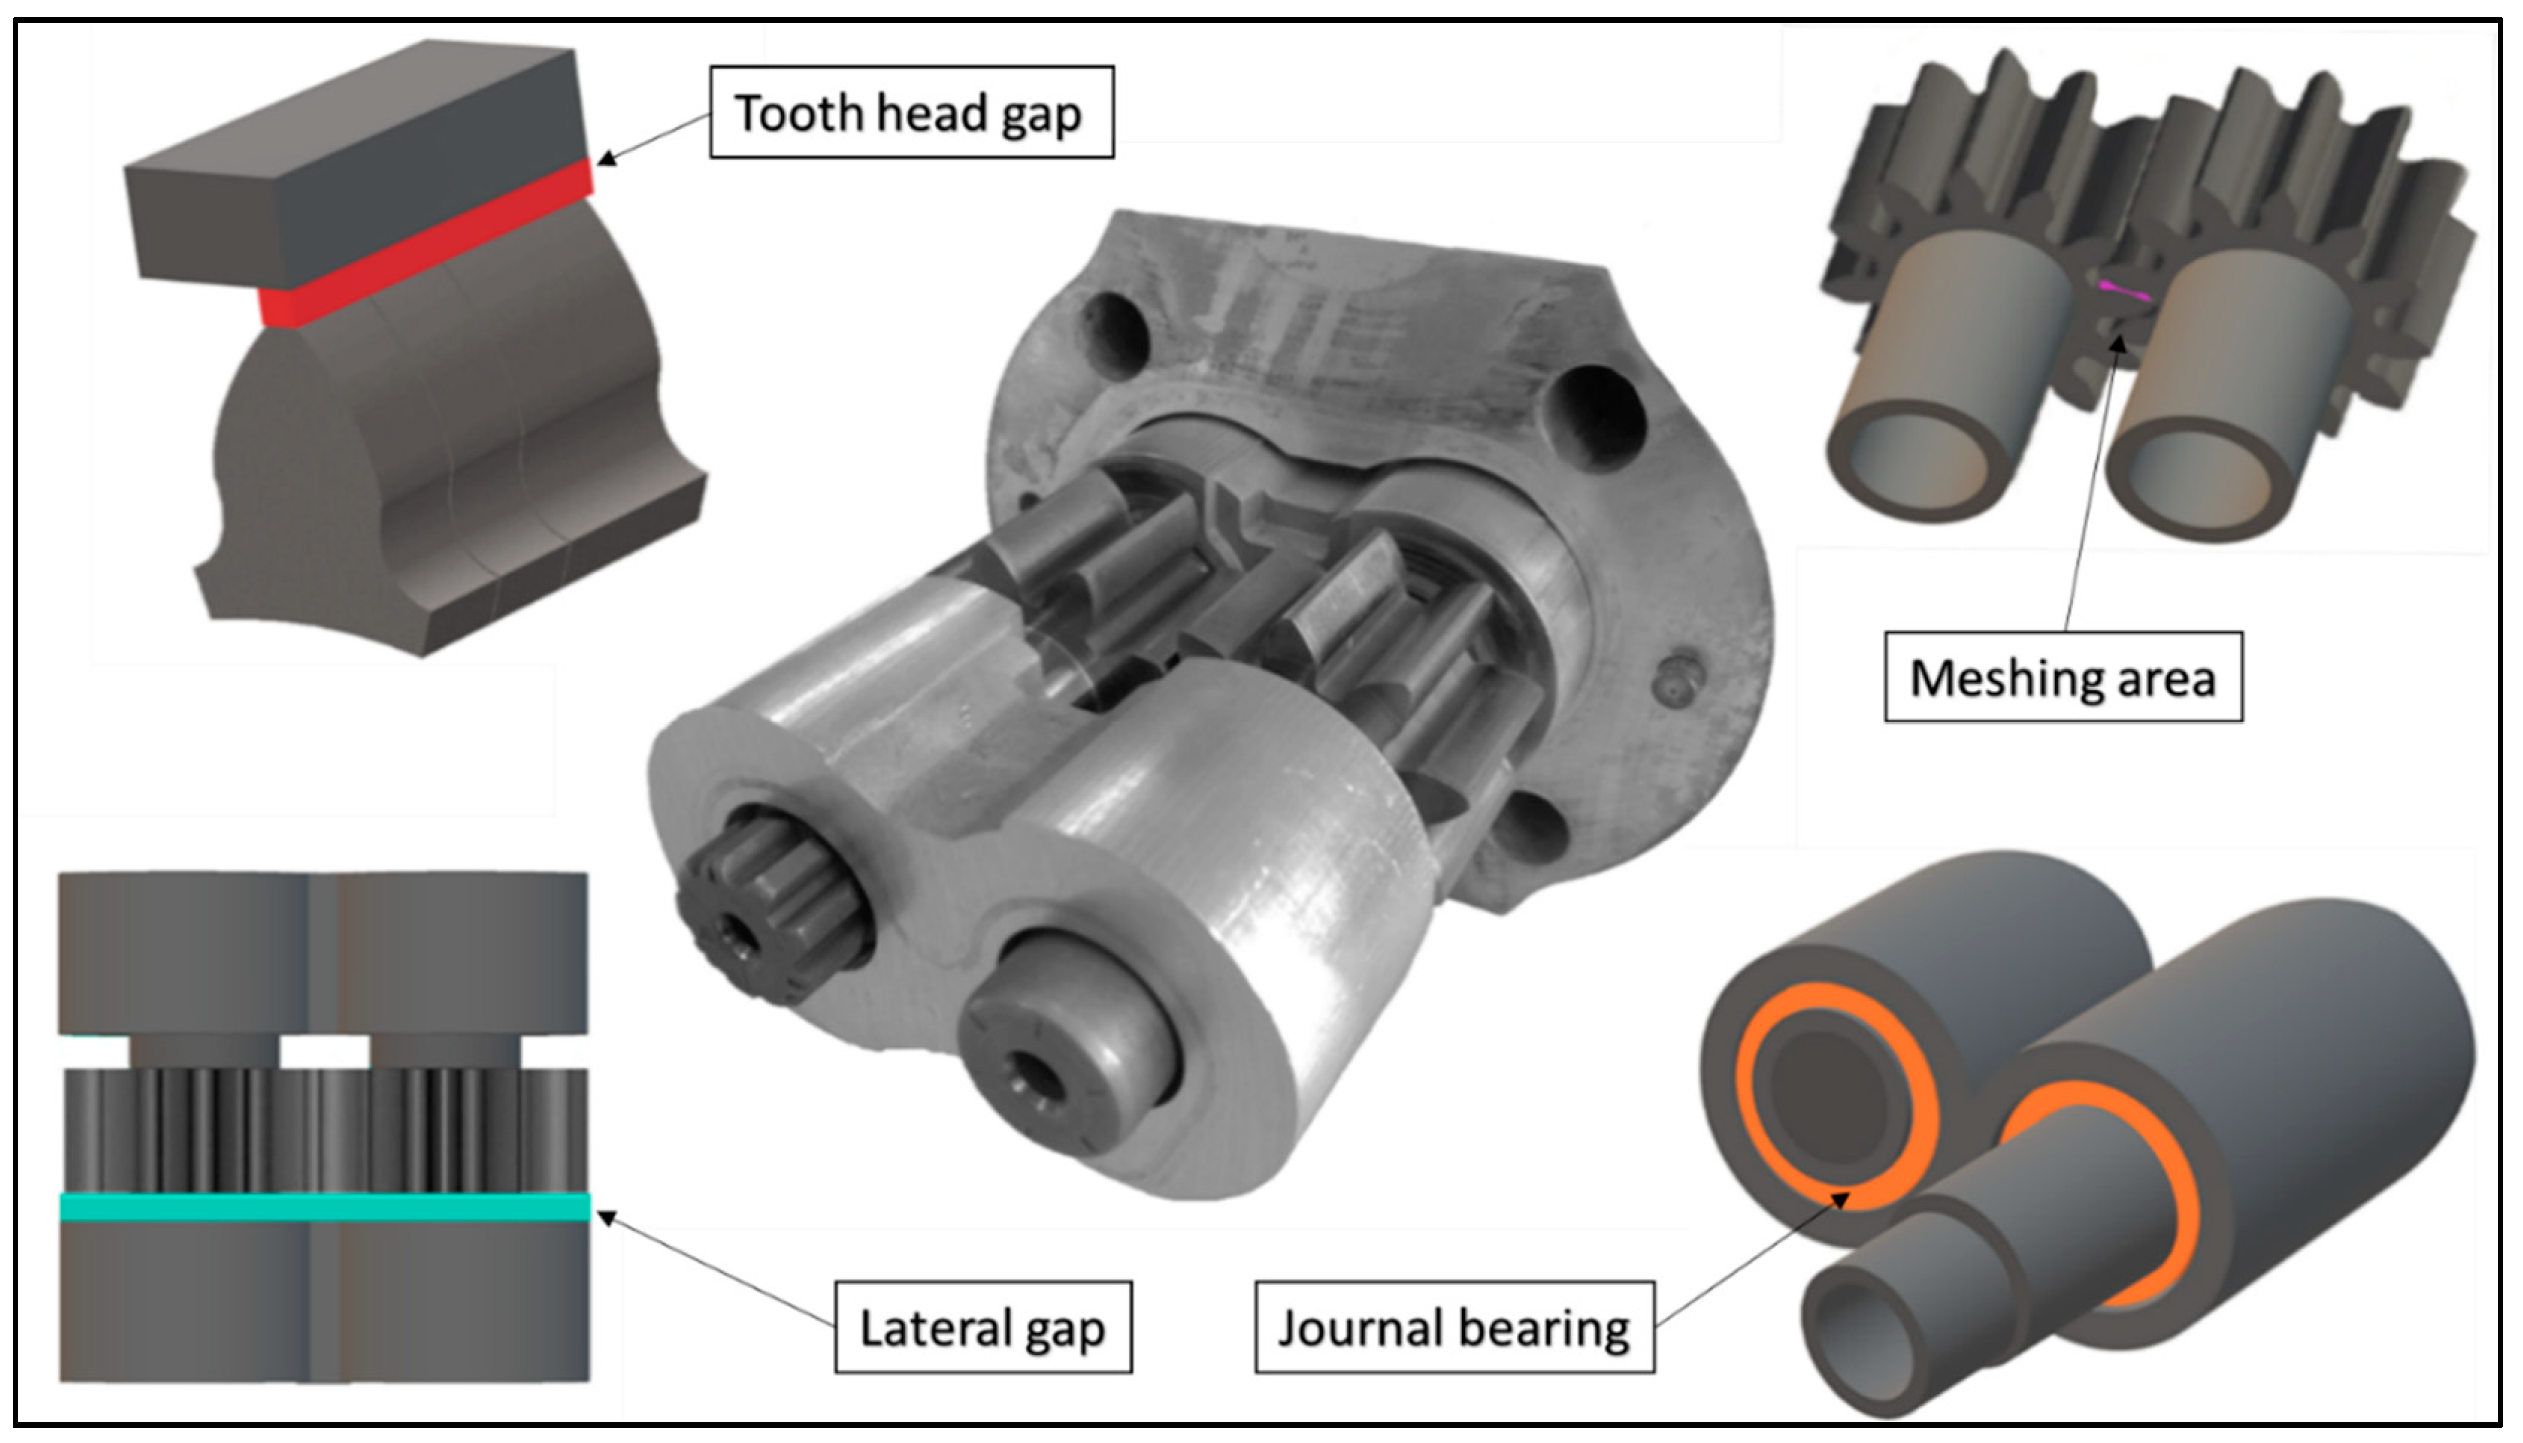
First of all, all the main sources of mechanical-viscous losses have been identified and are listed in the following (making reference to Figure 1):
- The viscous friction loss generated in the journal bearings couplings between the gear shafts and the bushing blocks;
- The viscous friction loss at the teeth tips, within the gap between the tooth tip and the machine’s internal casing;
- The viscous friction loss generated within the gap between the gear’s lateral surface and the internal surfaces of the bushing blocks of the machine.
- Mechanical loss due to the gears meshing.
For the purpose of this work, the lubricating gaps (tooth tip—pump casing; journal bearings; lateral bushing blocks-gears) have been considered in a full film lubrication regime. The fluid film prevents contact between two surfaces, relatively moving one respective to the other and generating a bearing load that counteracts the load coming from the confining components. At the same time, shear stress arises in the lubricating film and influences the mechanical efficiency of the machine. The shear stress τ within the fluid that separates the two walls (with a certain thickness h in the y axis direction that is much smaller than the dimensions along the other axis and with one wall, moving with speed u along the x axis) is defined in Equation (6):
where u = fluid speed, μ = fluid absolute viscosity
To evaluate this shear stress, it was assumed that:
- The flow inside the gap is laminar;
- The inertia forces are negligible compared to viscous ones;
- Fluid is incompressible;
- The viscosity of the lubricant is constant with pressure, when the fluid temperature in the test has been changed, and the fluid viscosity has been modified according to the ASTM diagrams.
Given these hypotheses, the shear stress that the lubricant layer transmits to the confining mobile wall (positioned at y = 0), can be calculated as:
Integrating Equation (7) along the x axis and then z axis, we obtain the friction force that arises as a consequence of viscous friction in the gap. Multiplying this contribution with the opportune distance between the gap and the gear shaft center, the loss torque contribution of this generic gap is determined.
To calculate the loss at each gap, besides the design parameters of the pump and the operating conditions, the radial pressure distribution is needed. This pressure, influenced also by the operating conditions, changes as a function of the gear’s angular position and the eccentric position of the gears inside the pump casing. This pressure influences, hence, the tooth tip gap’s geometry and the axial balance of the pump.
The pressure within an inter-teeth volume, which is moving peripherally together with the gear from the suction port to the delivery port, will increase from low to the high operating pressure values. This rising pressure can involve one or more inter-teeth volumes, depending on the geometry of the floating bushing block’s internal surface and operating conditions, as shown in [5,6]. In the remaining angular interval that covers the internal casing up to the delivery port, the inter-teeth volume pressure is equal to the delivery pressure.
In the meshing area instead, an abrupt pressure is observed to decrease when the meshing teeth loose contact and the inter teeth volume is exposed to suction pressure. The approach used in this paper to calculate the inter-teeth pressure is described in [6] and again in [7] and recalled in the next section.
In the following paragraphs, each contribution of loss is described, and then the results obtained by the model are presented and compared with the measured ones.
3.1. Tooth Tip Gap—Machine Internal Casing
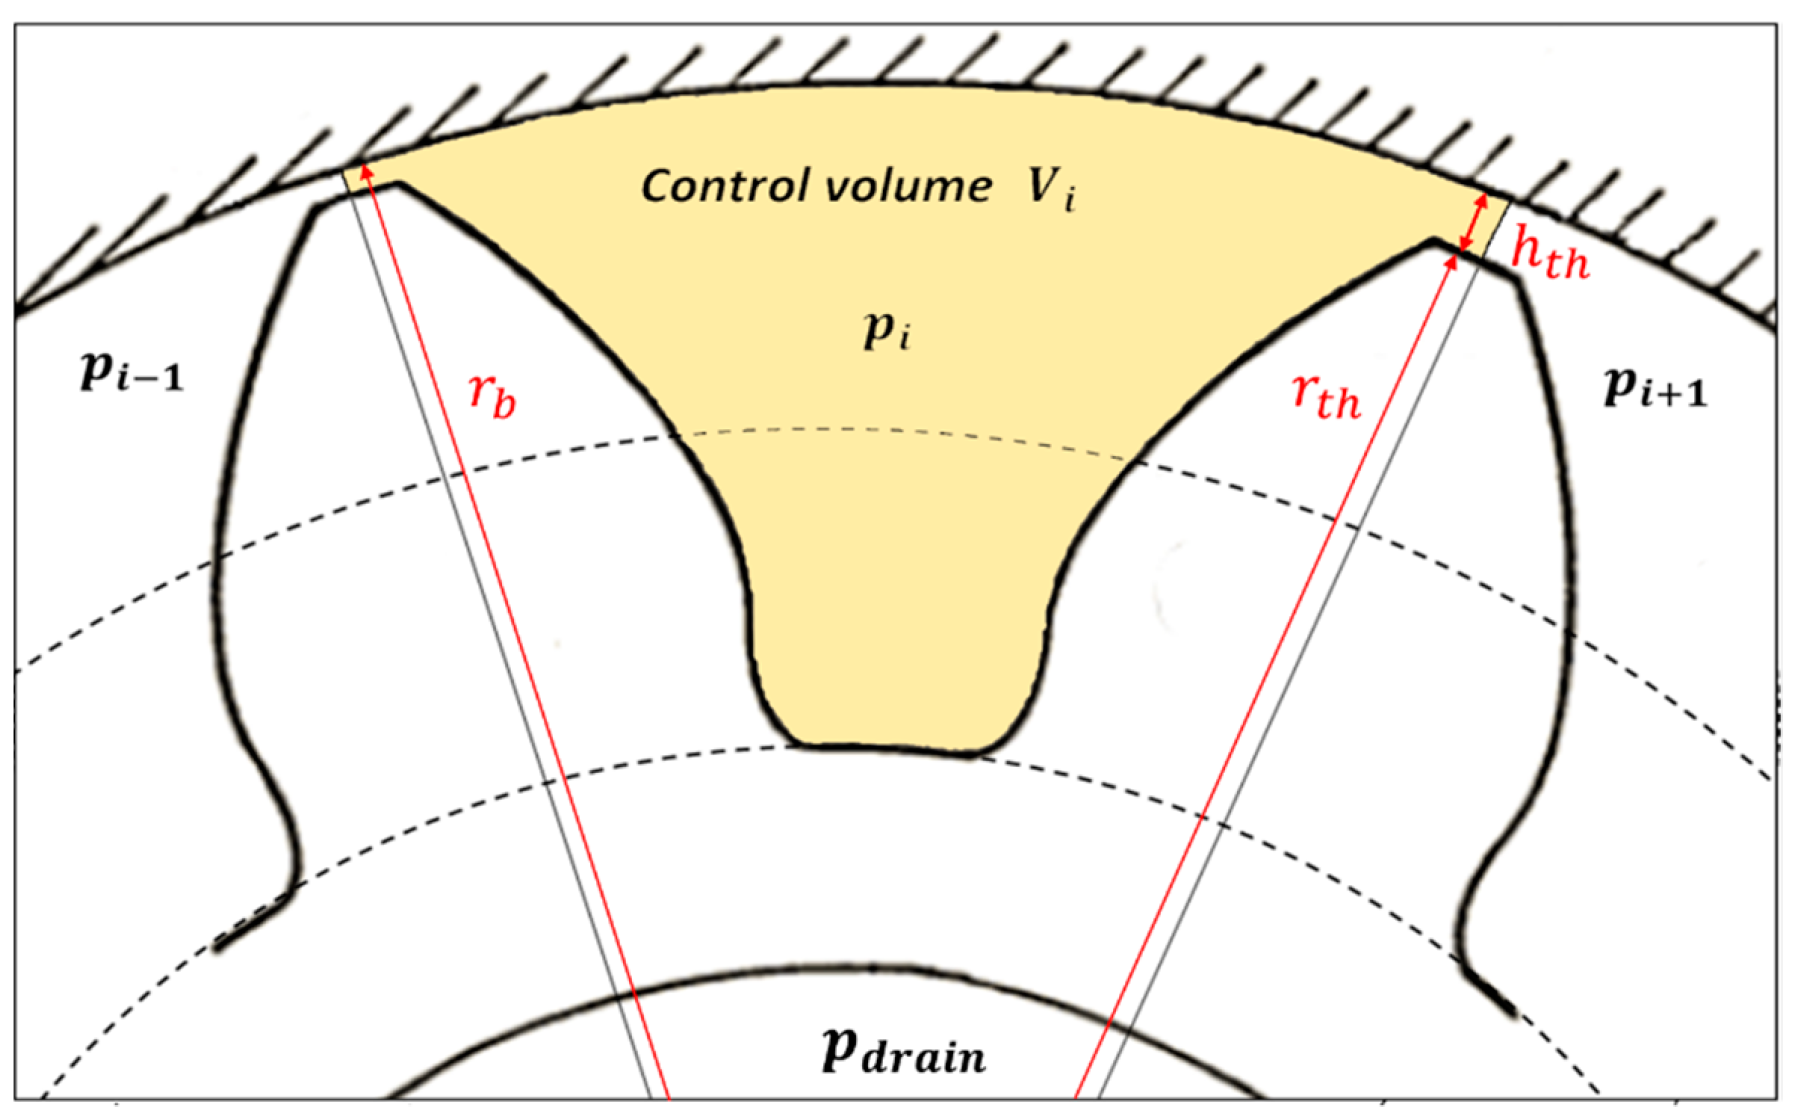
To define the gap between the tooth tip and the machine casing, the position of the gears inside the casing during the pump operation has to be studied. Different loads are acting on the gears, such as the radial pressure distribution, the meshing force, and the reaction of the journal bearings, formed by the gear shafts and the bushing blocks. An equilibrium position can be calculated only with a numerical procedure, as shown in [3,6]. A first attempt position of the gear inside the pump casing, defined by means of an eccentricity module and angular position, is used to compute the radial pressure distribution. The pressure within the inter-teeth volume is calculated applying the continuity equation to the control volume (Figure 2), considering the leakages exchanged with the neighboring inter-teeth volumes and the drain. The continuity equation was solved using a first order Backward Euler differentiation scheme; next, the resulting algebraic equations were solved by adopting the Newton Raphson method.
The radial pressure distribution together with the meshing force constitute the load that the two journal bearings (gear shaft-bushing blocks) have to counteract. Knowing the total load and giving the geometrical symmetry, each journal bearing is supposed to support half of the total force. Knowing the reaction load needed at the journal bearing, the “real” eccentric position of the gear shaft is determined using interpolating polynomials as a function of the Sommerfeld number, until the eccentricity value for the gear (module and direction) that allows the gear equilibrium is determined. The calculus is iterated starting from this second value (radial pressure distribution has to be calculated congruently) until the old and new values of gear positions significantly coincide.
Once the convergence of the numerical method is reached, the position of the gears is known, and both the height of the gap at each tooth tip and the pressure inside the inter teeth volumes are defined. At this point, the losses can be calculated according to the real geometry of the gap. In the definition of the tooth gap height, the running-in process, which causes wear in the pump’s internal casing, is taken into account. This wear, in fact, can considerably change the height of the tooth tip gap nearby the suction port. Since the radial pressure distribution changes periodically within the interval , where z is the teeth number (see also [6]), the eccentricity position and module also change in the interval.
Generally, the gears, under the action of the load, move towards the suction port, and, therefore, the height of the gap is minimal for the teeth near the suction port and is maximum for those close to the outlet.
The height of the tooth tip gap and the angular position where it reaches the minimum value is different between the driven and the driving gear, due to the difference in the direction of the meshing force and in the radial pressure trends:
- In the case of the driven gear, the meshing force acts by pushing the gear towards the suction, adding its own contribution to the radial pressure load;
- In the case of the driving gear, the meshing force points the opposite direction and, therefore, subtracts its own value to the radial pressure contribution load.
The gap height hth for one gear can be defined by Equation (8):
where γ is the direction of eccentricity, e the eccentricity module, θ the gear angular position, the radius of pump internal casing, and the radius of the tooth tip.
To calculate the contribution of the friction losses of each tooth tip gap, it is necessary to consider the actual height at the tooth tip. The number of teeth that actually interface with the internal surface of the pump casing depends on the gear teeth number and on the extension of the arc between the suction port and the delivery port.
With reference to Figure 3, which shows the geometry of the tooth gap, the shear stress has been calculated in the following (Equation (9)):
The pressure distribution along the gap was considered constant in this gap.
As a consequence, the torque losses, referred to as the tooth tip gap , can be calculated as the product between friction force (Equation (10)) and the radius , as can be seen in the following (Equation (11)):
3.2. Journal Bearing between the Gear Shaft and the Bushings
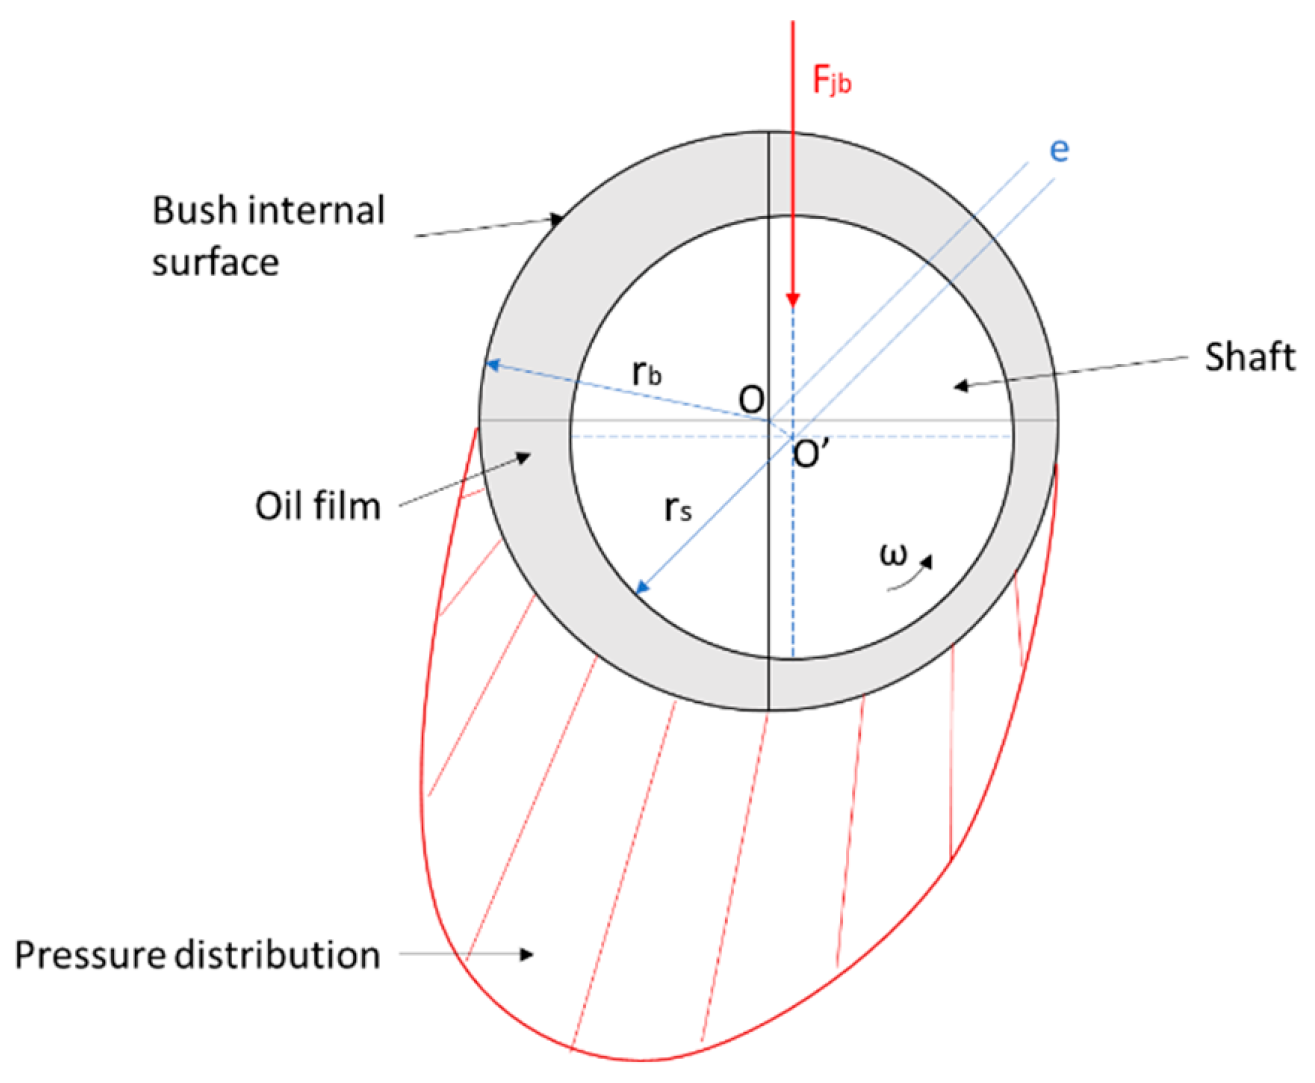
The reference scheme for modelling the friction in the journal bearings coupling is the lubricated rotoidal pair (Figure 4). It is possible to easily calculate the friction torque that emerges in the gap as a function of the Sommerfeld number (Equation (12)), which takes into account the load and geometry applied to the lubricating gap:
where , is shaft angular speed, the force acting on the shaft, and the bushing length. Given the relation between the friction coefficient and the Sommerfeld number, the friction torque can be determined as Equation (13):
3.3. Lateral Lubricating Gap
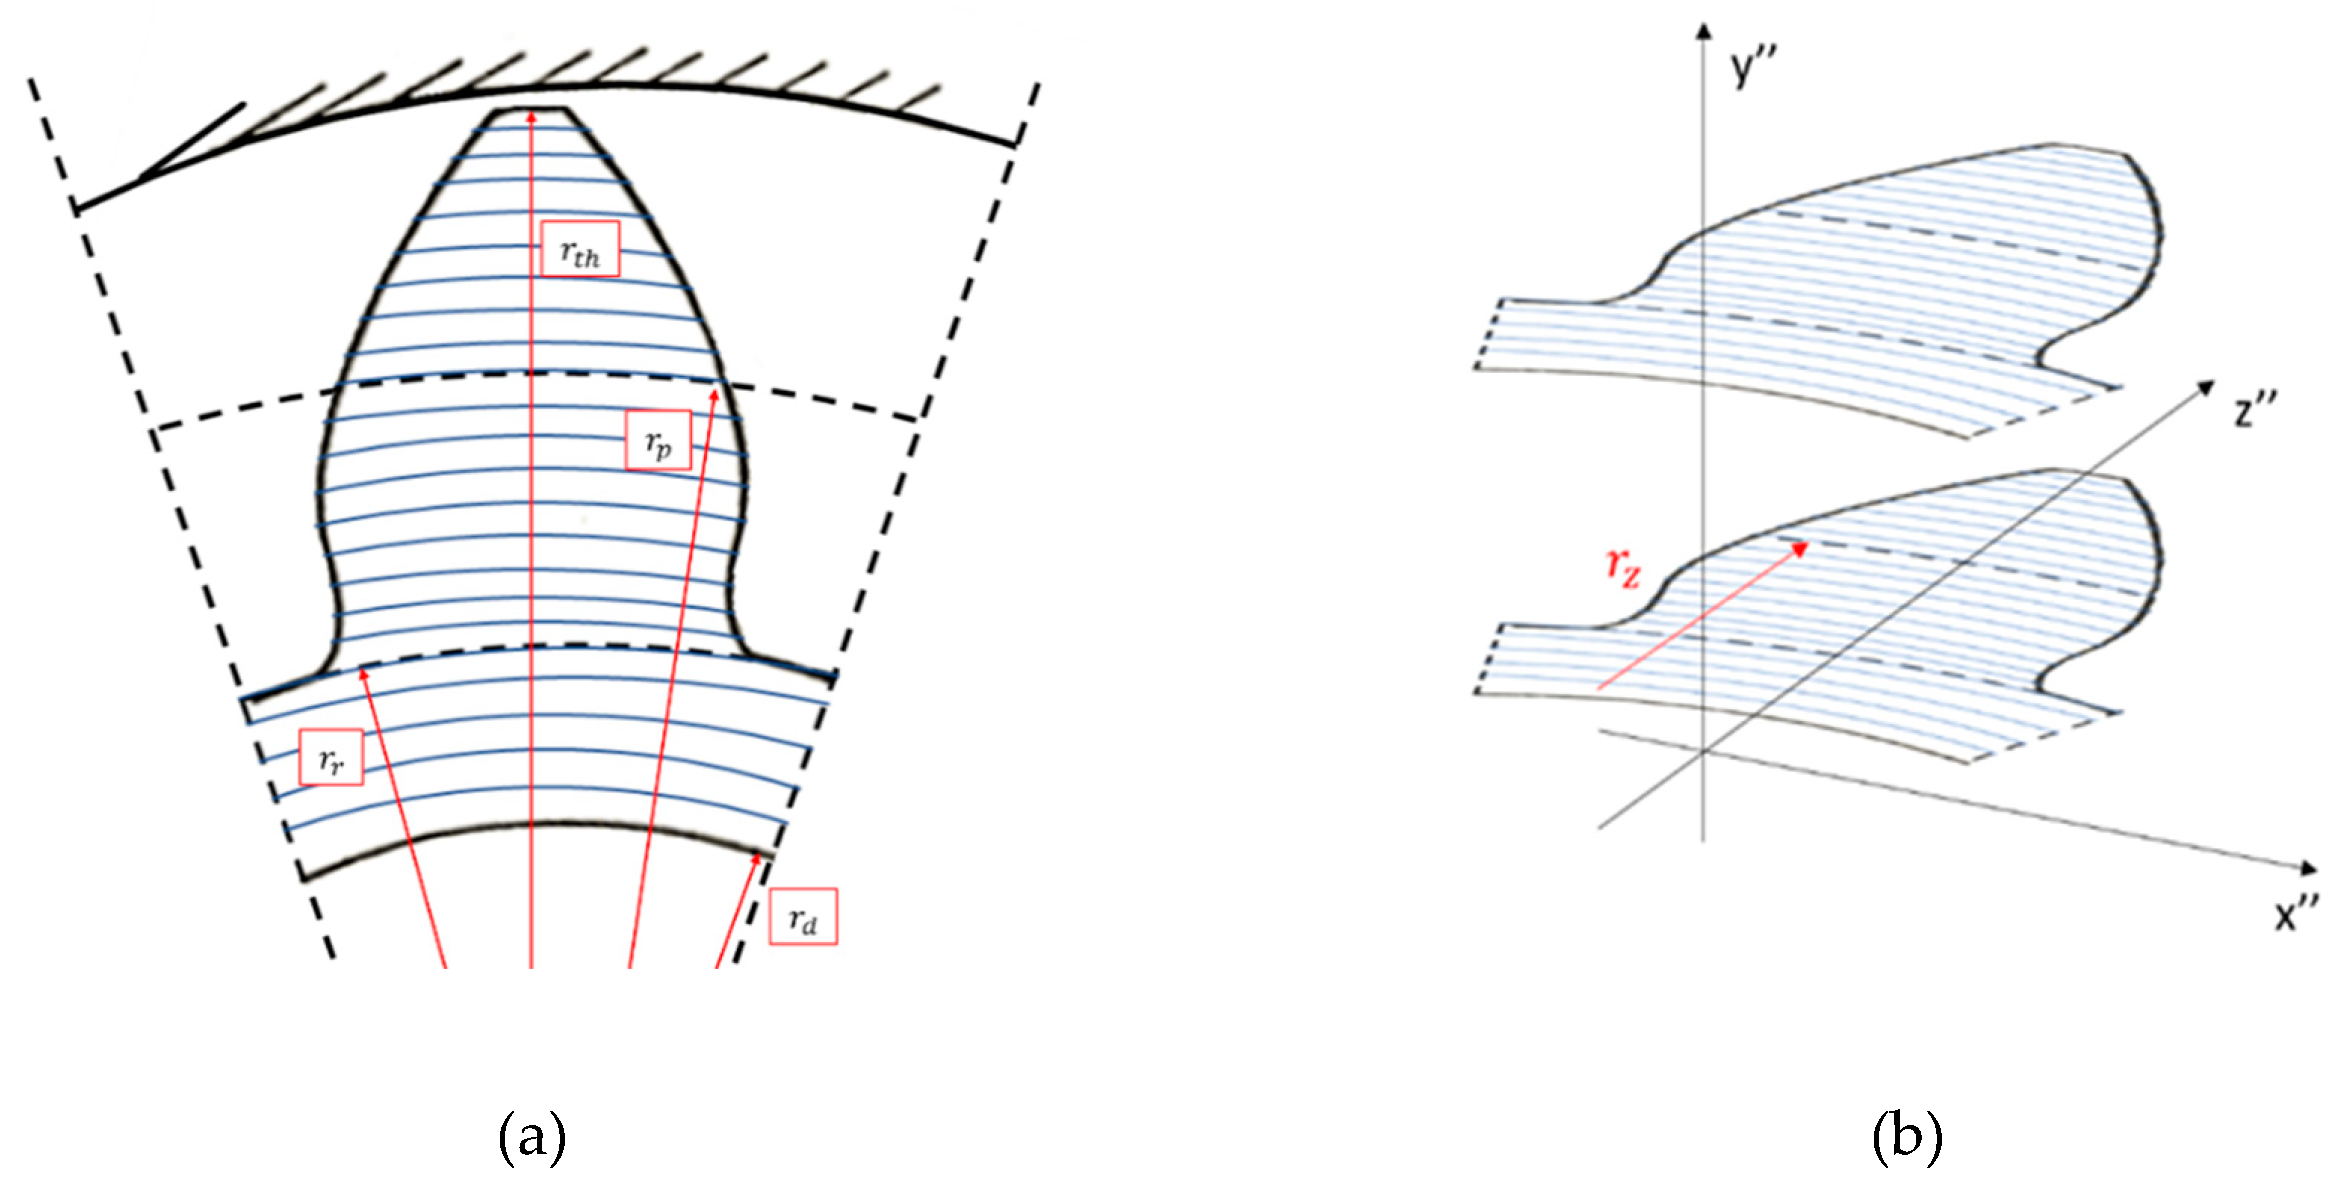
The Lateral Lubricating gap appears between the gears and the floating bushing blocks, whose distance from the gears can be variable during the pump’s operation. Referring to one tooth, the pertinent portion of the gap is between the tooth tip diameter and the drain circle diameter (Figure 5).
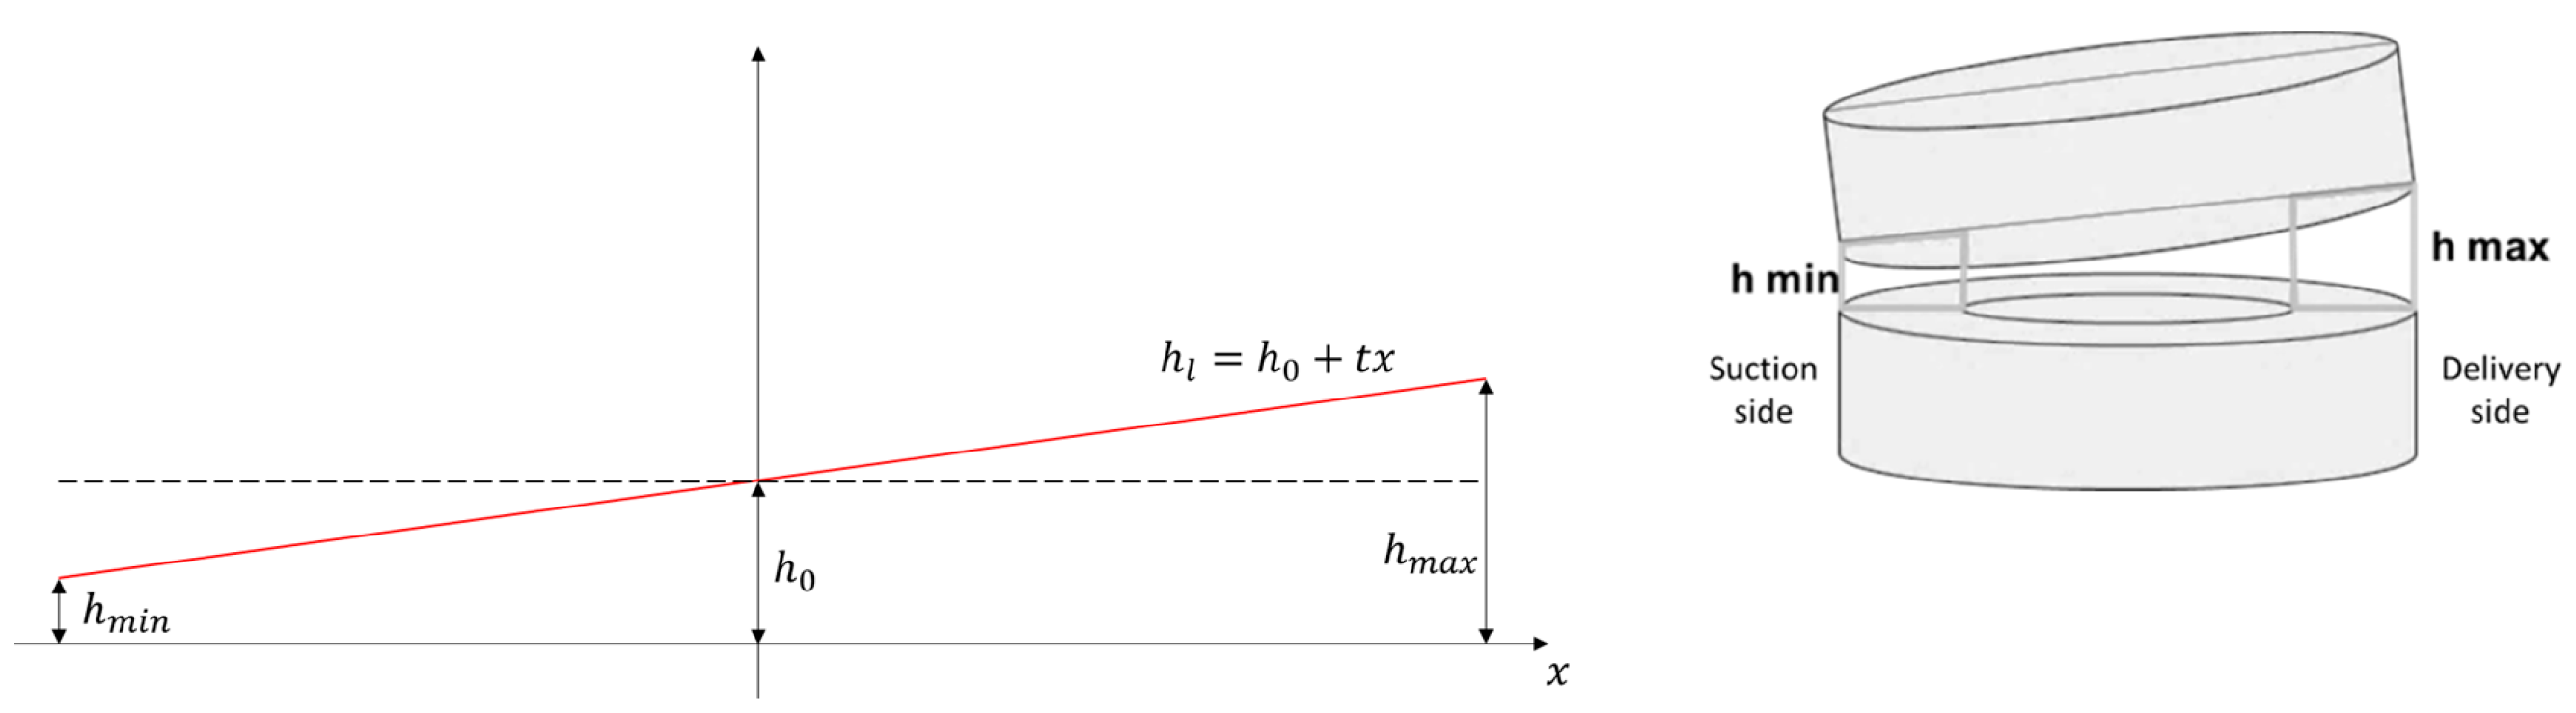
The tooth has been split into a certain number of slices, and each of these portions of the gap is characterized by a reference height value hl,I that depends on the initial position of bushing in terms of central height h0 and tilt t, as in Equation (14) and as shown in Figure 6:
Several studies have researched this aspect [2,4], showing that the main tilt direction of the bushing with respect to the gears is around a line that crosses the centres of the bushings, as assumed in Figure 6. This tilt may be towards the suction or the delivery port, depending on the design of the balancing surfaces of the bushing blocks. The height and tilt values are not known parameters a priori, so their values have been varied at opportune intervals. The results from previous analysis [22] of the pumps considered showed that the main tilt of the bearing blocks is towards the suction, so this information has been utilized also in this work. Knowing the pressure values within the inter-teeth volume, as a result of the procedure previously described to obtain the radial pressure distribution, and knowing the drain pressure, the pressure at the border of each slice is identified. The total viscous friction torque loss (Equation (17)) is the sum of the product between the reference radius () and the lateral gap friction force () at each slice, calculated as in Equation (16), integrating the shear stress (Equation (15)):
The pressure gradient on the lateral gap corresponding to the teeth surface was approximated as linear, corresponding to the tooth performing the sealing (nearby the suction), across which almost all the variations occur in pressure between the low and high values.
However, the trend of pressure on the tooth is not linear. Nonetheless, when considering a constant gap height and flat surfaces, the distribution obtained from the simplified Reynolds equation leads to a trend very similar to a linear one.
Clearly, when a tilt of the bearing blocks is introduced, the pressure trend can be different, but this practically occurs only when the tilt assumes high values (as shown in [5]).
Given this simplification and since only the teeth for which the effect of the pressure gradient is considered are nearby the suction, where the pressure increases in the inter-teeth volumes as a consequence of leakages, the tangential stress calculated in the model will be much more influenced by the rotational velocity of the gears.
3.4. Meshing Loss
The contribution of the torque loss due to meshing has been evaluated here according to ISO/TR 14179-1 [31], which describes the losses in gear boxes made of gear wheels. In order to consider the case of an external gear pump, the formulation has been modified considering the two equal gears and using half the theoretical torque Tth for each gear.
The calculation of losses must obviously be carried out for each gear, and the final loss is the sum of the contributions. The parameters used in the calculation are listed in Table 1.
The meshing loss is defined via the use of the coefficients and , called the creep ratio of approach and withdrawal, respectively. These two values are equal in the case of two identical gears:
The value of the coefficient , which is the geometric parameter, is calculated as:
The evaluation of the average friction coefficient is particularly critical. The expression to be used according to the International Standard is the following:
where ve [] is the peripheral velocity on the pitch circle, υ the kinematic viscosity of the fluid [cSt] and ], called load intensity, is:
From the previous equations, the contribution of loss due to the meshing process, can be calculated as shown in the Equation (22):
4. Sensitivity of the Model with Respect to the Lateral Clearance Height and Discussion of the Results
The results coming from the model have been compared with the experimental measurement of mechanical efficiency shown in [22]. The pumps analyzed are characterized by the design parameters shown in Table 2 and represented in Figure 7:
Different operating conditions within the working range of the machine have been tested. Moreover, a strategy has been chosen to set the unknown parameters, such as the central height of the bearing blocks. It was chosen to set the central height h0 to a fixed value and then to repeat the calculation, imposing a tilt of the bearing blocks towards the suction, spanning from the minimum (0%) to the maximum value (99%, to avoid the condition of contact between the gears and the bushing blocks). The tilt direction of the bearing blocks, which reduces the lateral gap in the low-pressure side, has been suggested by experimental results and the numerical analysis performed in [22]. The calculated hydro-mechanical efficiency for a certain operating condition and reference central height is then the arithmetic average of the values corresponding to each tilt analyzed.
The authors are aware that the tilt of the lateral gap changes with the operating conditions, but in general, a designer or manufacturer does not know the height and the tilt. He or she just knows that these two parameters can adjust themselves during pump operation, within certain constraints.
Considering that, this simplified model has the aim of estimating efficiency, allowing one to set these two parameters to common sense values, respecting the constraints.
The idea of presenting the results by averaging the values calculated in correspondence to different values of tilt is a way to eliminate one unknown parameter in the problem, which is the most difficult to even be guessed. For this reason, averaging the results obtained for different tilt values seems a precautionary approach.
The reference height was instead chosen as a fixed parameter in each series of simulations, since it is possible to estimate a value for this parameter from the tolerances of the manufacturer while assembling the pump. Nevertheless, this value can strongly influence the results of the model and must be chosen carefully. Our model is sensitive to this setting, as the following results will show.
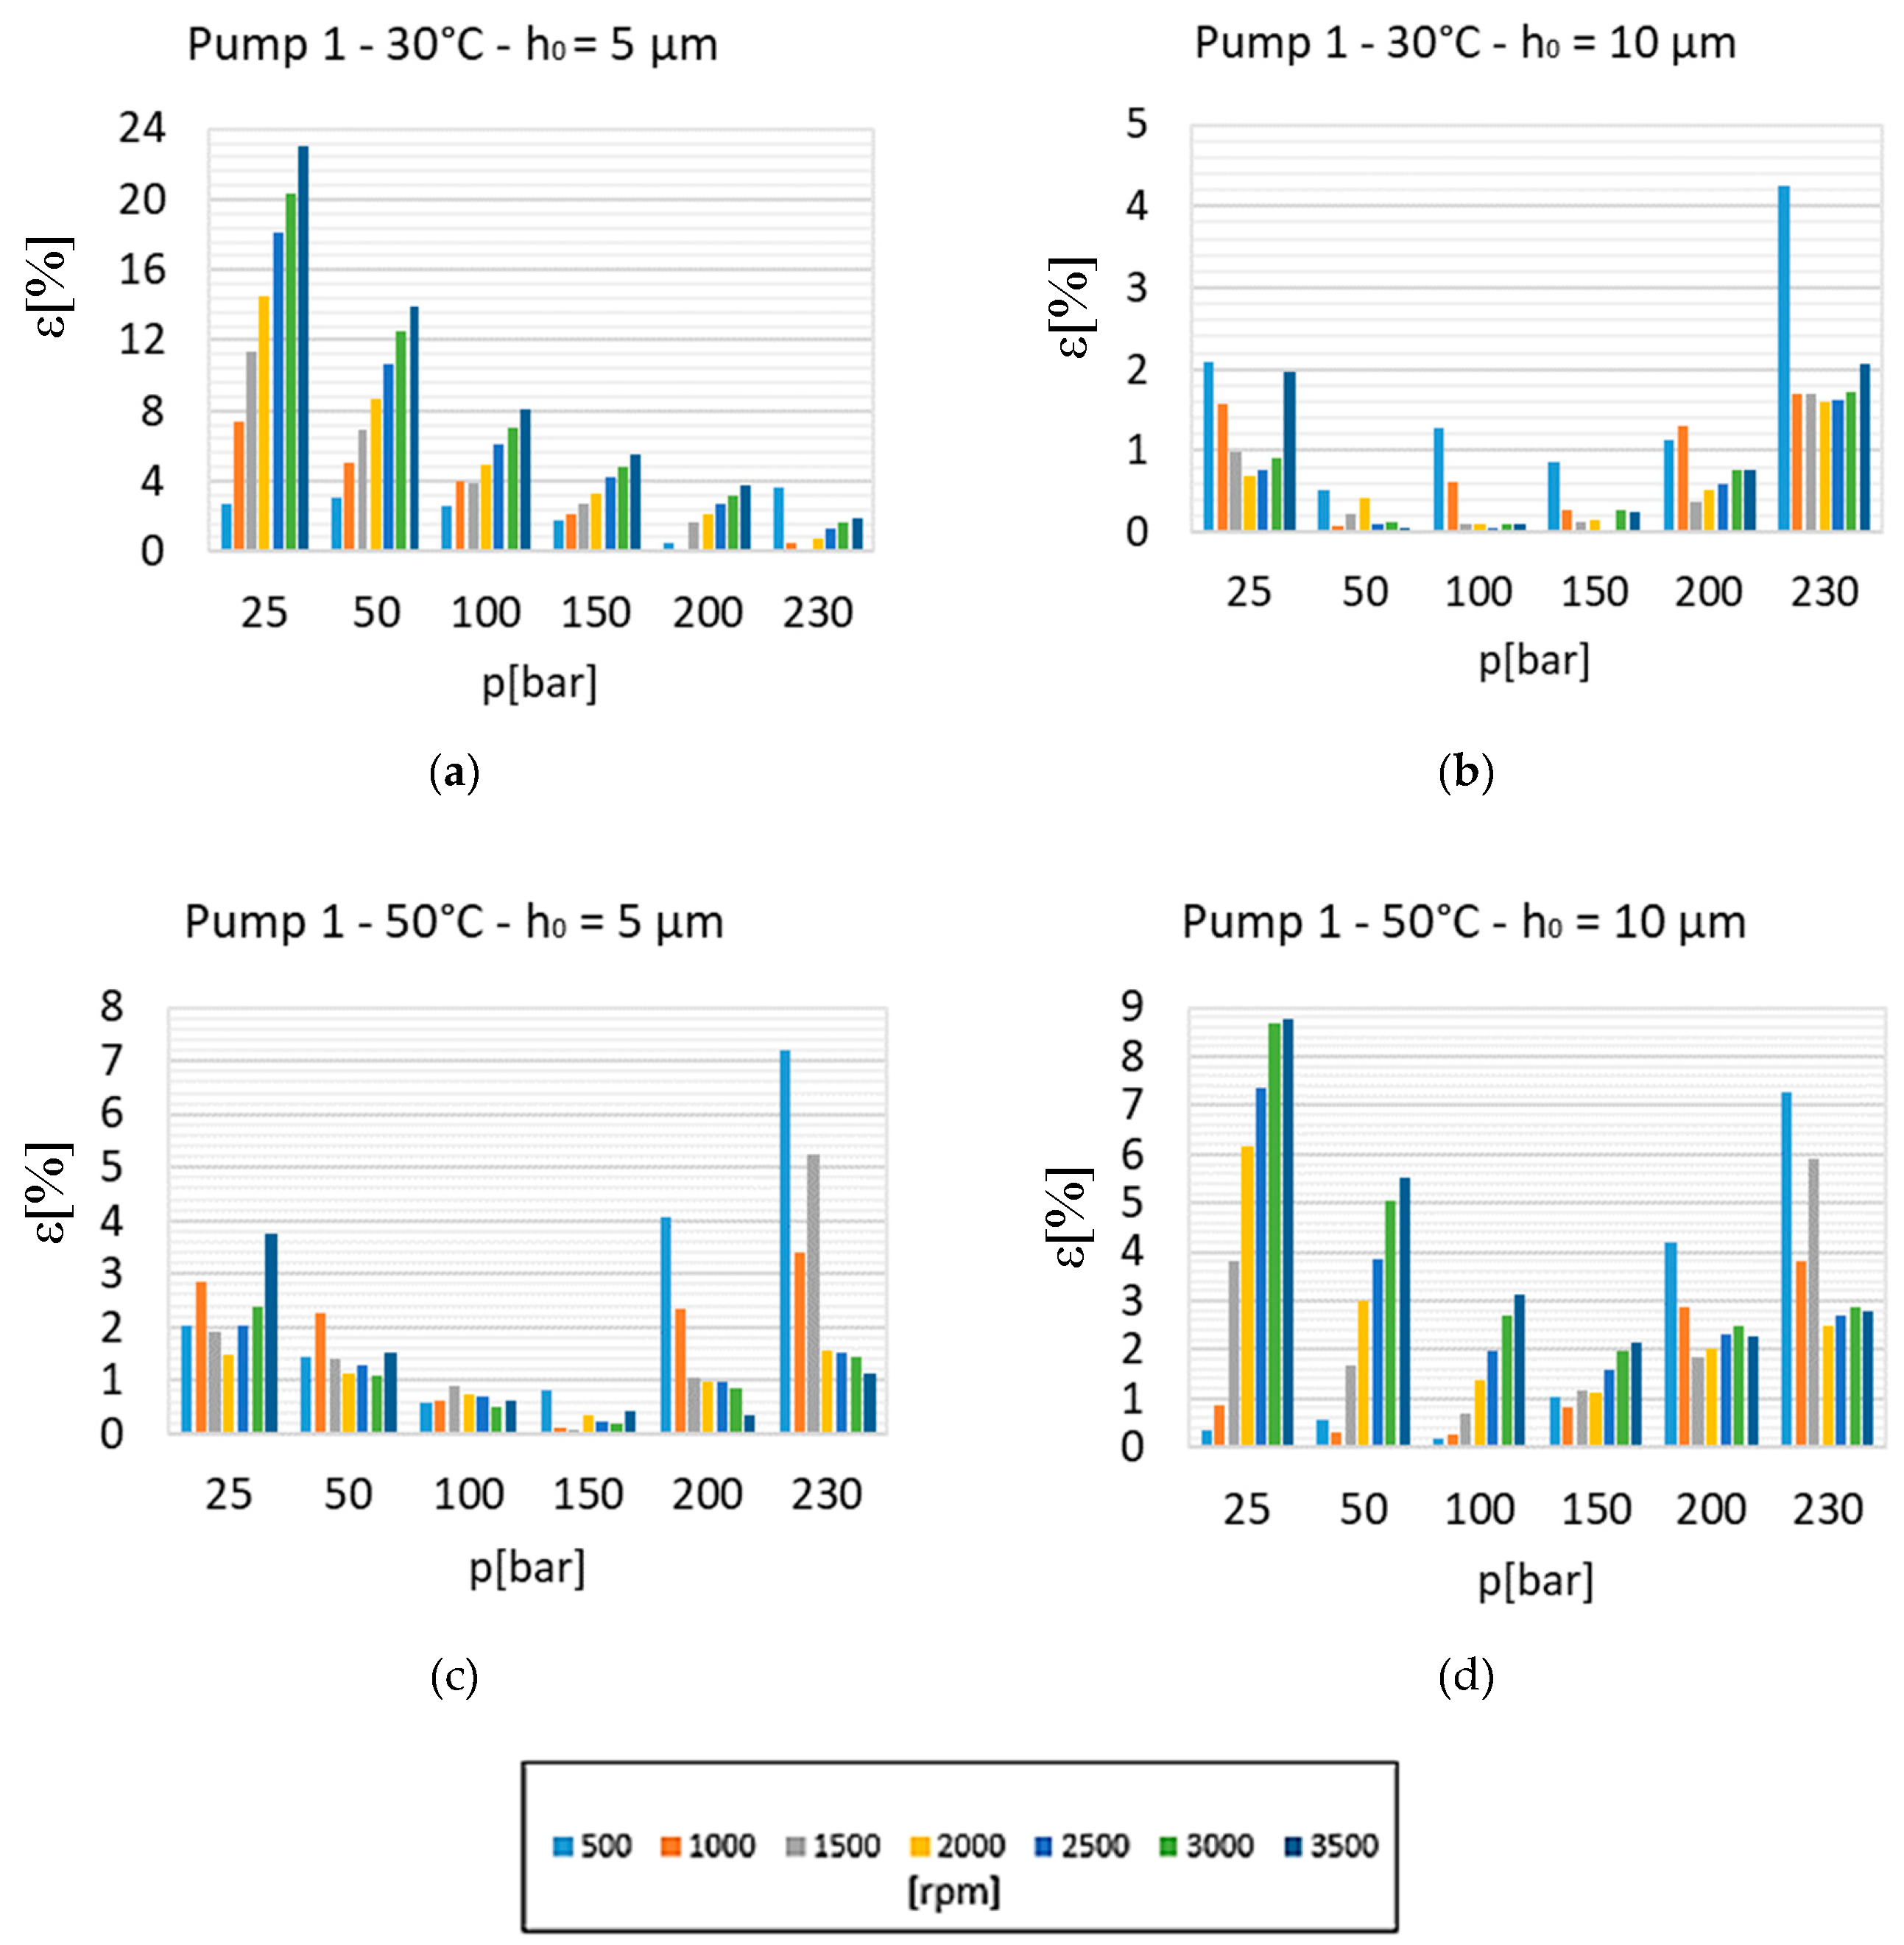
The graphs below in Figure 8 show the relative error ε, calculated according to Equation (23), between the mechanical efficiency measured experimentally () and the mechanical efficiency of the pump calculated with the model ():
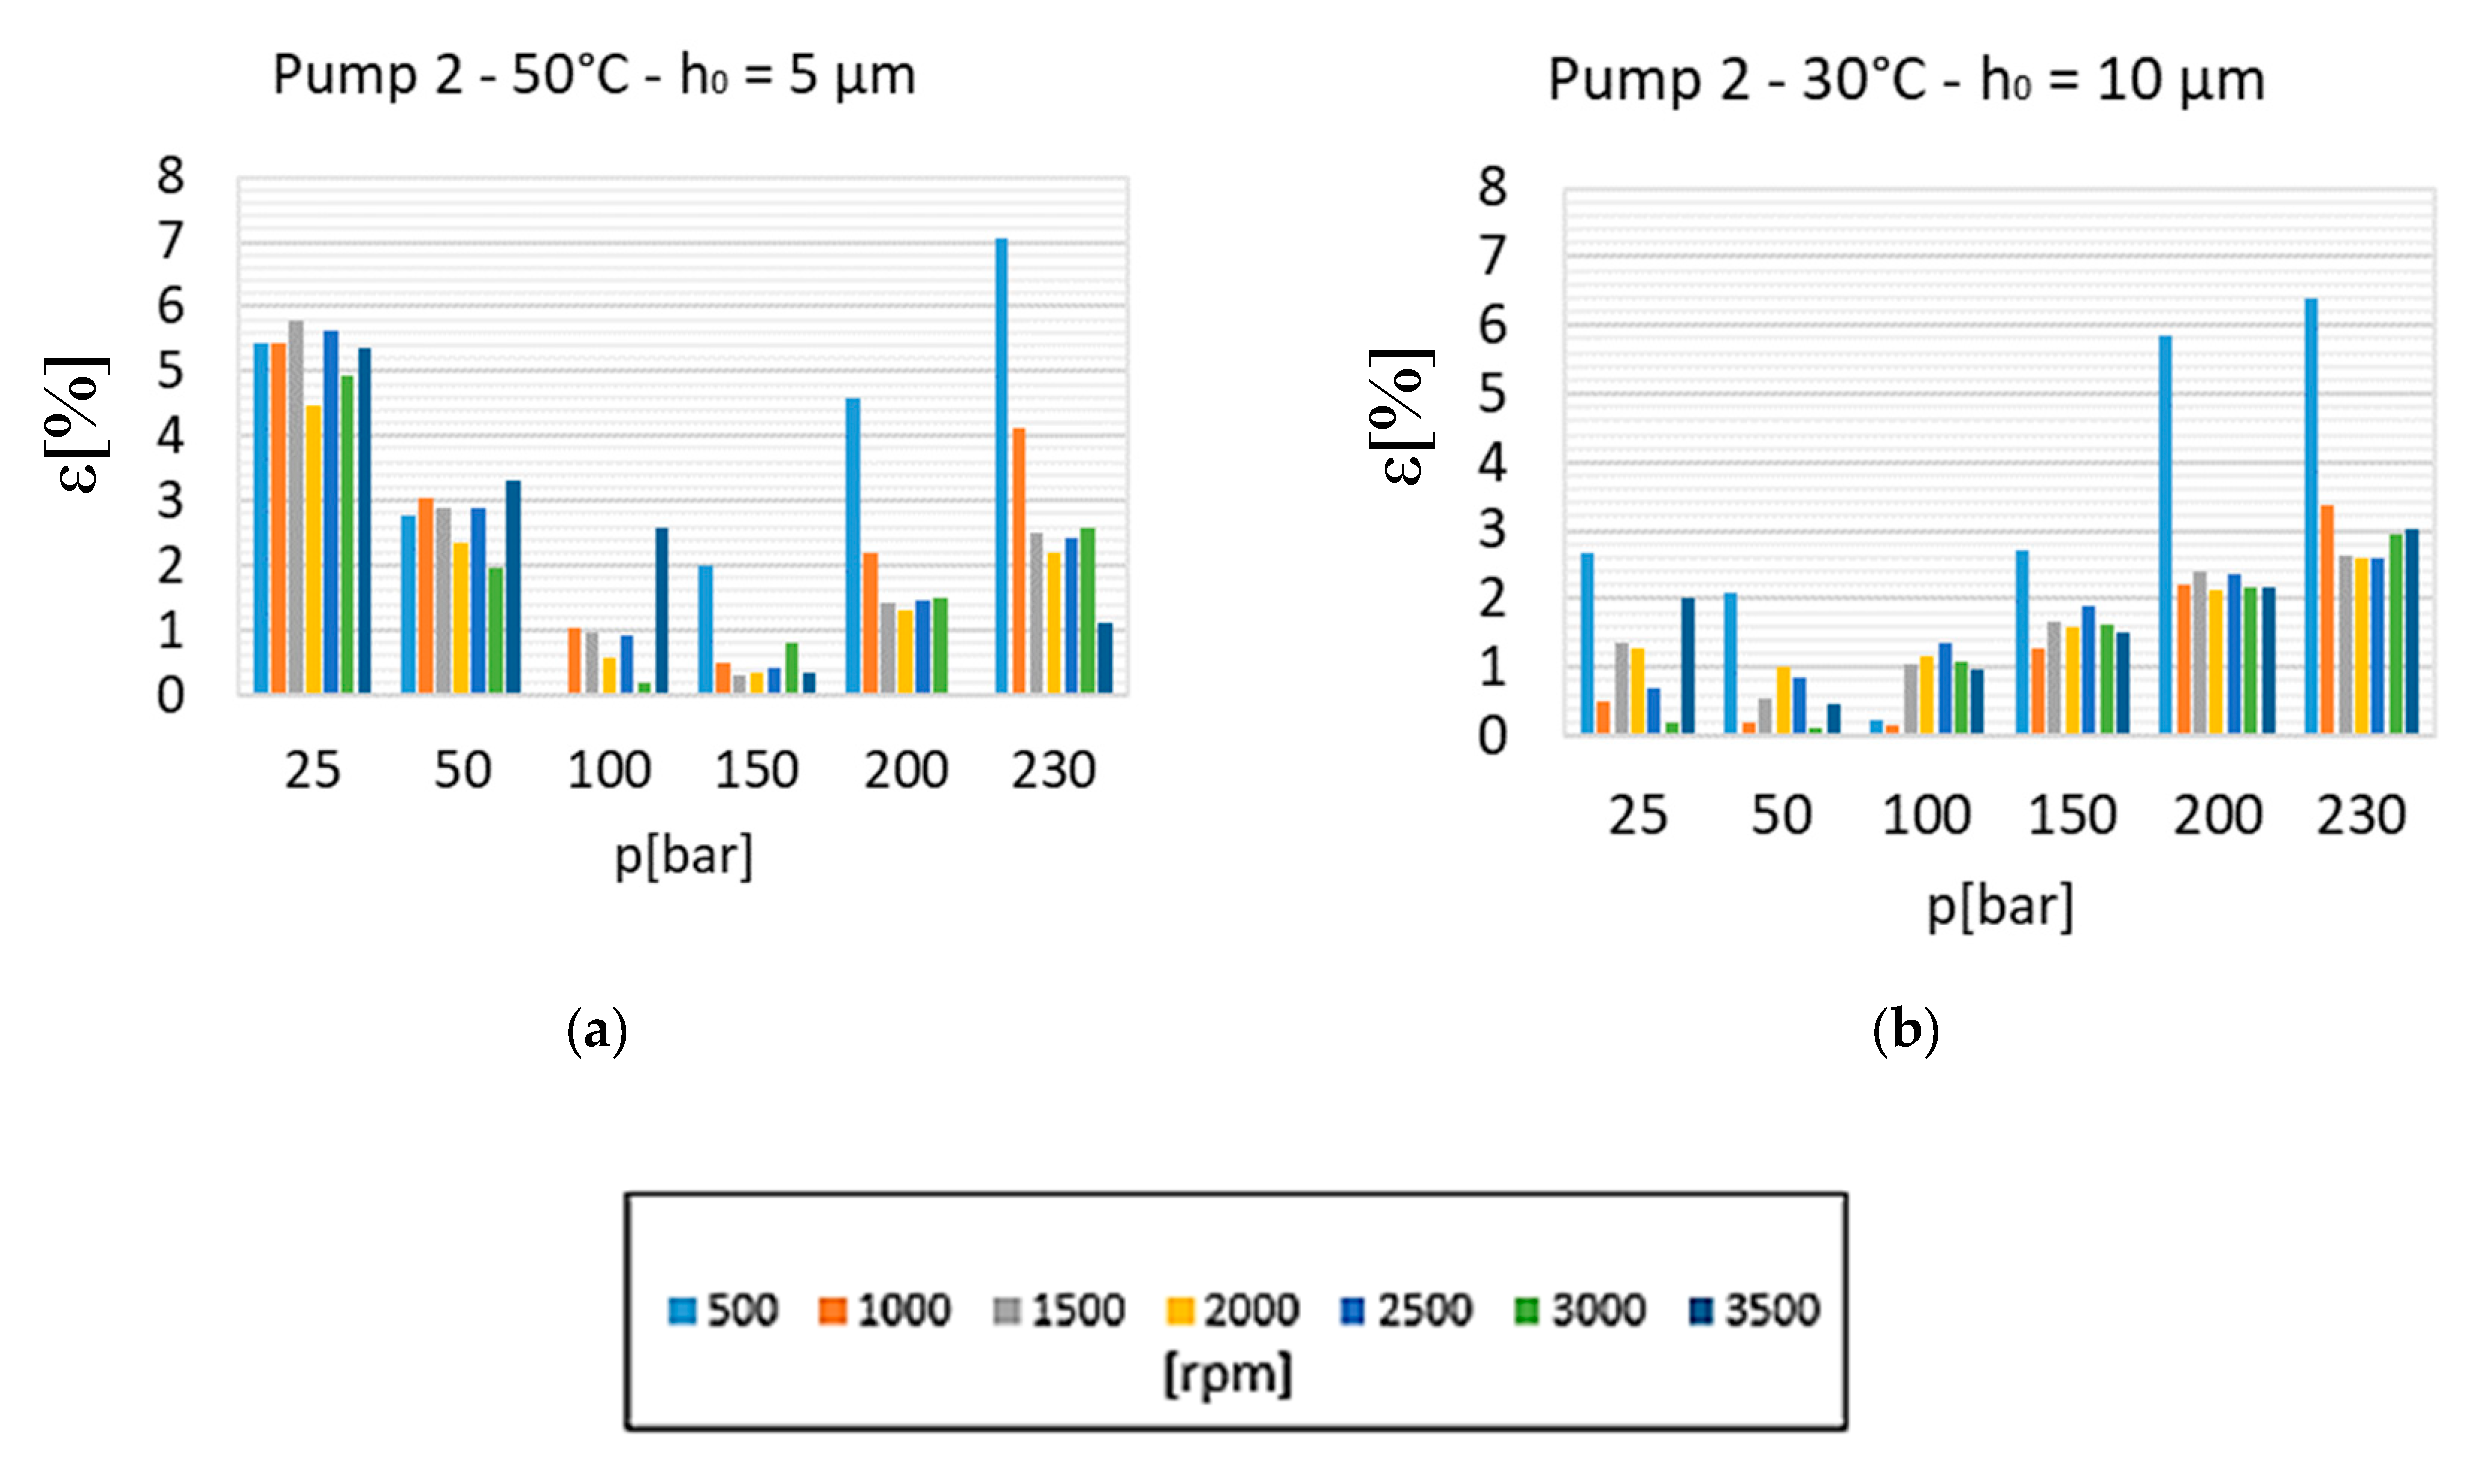
The operating pressure at the delivery port varied between 25 and 230 bar, and the operating speed between 500 rpm and 3500 rpm. Further, two different temperature values for the fluid, corresponding to two different values of fluid viscosity, were tested. Looking at the results for a reference height of 5 μm at 30 °C (pump 1, Figure 8a), it can be observed that the deviation goes under 10% at the medium–high delivery pressure values (150 bar–200 bar–230 bar). At the medium–low delivery pressure values, the percentage error is high. Since the reference height is the only parameter that can be changed, and the bearing blocks can adjust their position inside the pump casing according to different operating conditions, a different value of the reference gap height was chosen: 10 μm (Figure 8b). Except for one specific operating condition, a low rotational speed (500 rpm) and high delivery pressure (230 [bar]), which that is generally the most critical for a pump, the error is lower than, or around, 2%. In the low speed/high pressure operating point, it is possible that the bearing block worked with a lower central height respect the other conditions, because the hydrodynamic contribution of the lateral gap due to speed is lower, while the pressure force is high. This condition, however, does not represent the average operating condition of interest for the pump, nor the average position assumed by the bearing blocks inside the pump. For these reasons, it was decided not to correct all the procedures to meet this single experimental point. Similar results have been obtained for pump 1 at 50 °C (Figure 8c,d), but this time the reference lateral height that allows one to maintain a percentage error within 4% (with the exception of the same critical operating points at low speed and high pressure) is equal to 5 μm (Figure 8c). This is congruent with the fact that at a higher temperature and lower viscosity value, the gap height decreases in order to gain the pressure distribution needed to sustain the load within the lateral gap. The same tests with these values of reference gap height were performed on the other pump, pump 2, and similar results have been obtained, as shown in Figure 9a,b. Percentage errors are below or around 5%, with the exception of the critical points. At the average value of rotational speed and delivery pressure, the percentage error is below 3%.
The average error for both the pumps considered is below 2%.
As a general comment, when comparing the measured data with the calculated ones, the uncertainty in the measurement reaches ±6% in the smaller measured torque values, due to the torque meter accuracy and full-scale range of the instrument. Moreover, a small error, very difficult to be evaluated, also affects the value of the pump displacement used for the calculation of efficiency [22], since the pump displacement was derived by the measurement of the flow rate and rotational speed, using the method suggested by Toet et al. ([32]).
Finally, some limits of the approach used are highlighted for this comparison. Heavily tilted bearing block operation likely happens at low speed where, in fact, the model shows higher inaccuracy when compared with experimental measurement, even after adjusting the value of the reference gap height as a function of the fluid temperature.
Moreover, at low operating pressure, the pressure distribution in the gap is quite different from what considered in the simplified approach presented here. In this other operating condition, the model shows, again, higher inaccuracy values.
Given these considerations and its limits, this model for hydro-mechanical efficiency calculation is able to qualitatively depict efficiency trends.
The following figures (Figure 10 and Figure 11) show the hydro-mechanical efficiency values calculated considering one type of loss at a time and the weight of each calculated loss on mechanical efficiency. The pump considered is depicted in Figure 10 and discussed as pump 1.
From these charts, some considerations can be made, which can be helpful in understanding the pump behavior’s, viscosity and operating conditions influence and can also be used as a design level to test modifications aimed to improve the machine’s efficiency.
The trend of the journal bearing’s losses is determined by the definition of the friction coefficient, which increases with rotational speed and decreases with the bearing load, being at the same time an inverse function of the clearance. Furthermore, the load, which is the radial pressure distribution of the pump, is a function of the speed, too. Specifically, when the speed is increasing, a delayed increase of the pressure is expected within the inter-teeth volumes nearby the suction port. This happens because of the less relevant weight of the leakages exchanged by the volume and the adjacent inter teeth volumes. As a consequence, the total radial load on the gear is higher.
At a low speed range and medium or high delivery pressure, the losses increase with speed and load; at a low speed range and medium or low delivery pressure, the losses slightly increase with speed and decrease with the load; in the medium or high speed range, the losses slightly increase or remain constant with speed and increase with pressure.
Meshing losses decrease with the rotational speed and the delivery pressure because of the friction coefficient defined as an inverse function of both the load and rotational speed. The losses within the lateral gap increase with the rotational speed, especially at low delivery pressure, while the influence of the speed is softened by an increase of the delivery pressure. Together with the meshing loss, the lateral gap losses strongly influence mechanical efficiency.
Losses at the tooth tip gap are more significant at a high delivery pressure and low rotational speed, as a consequence of higher displacement of the gears towards the suction in this operating condition, while in the rest of the range, they are very low, also as a consequence of the short extension of the gap involved.
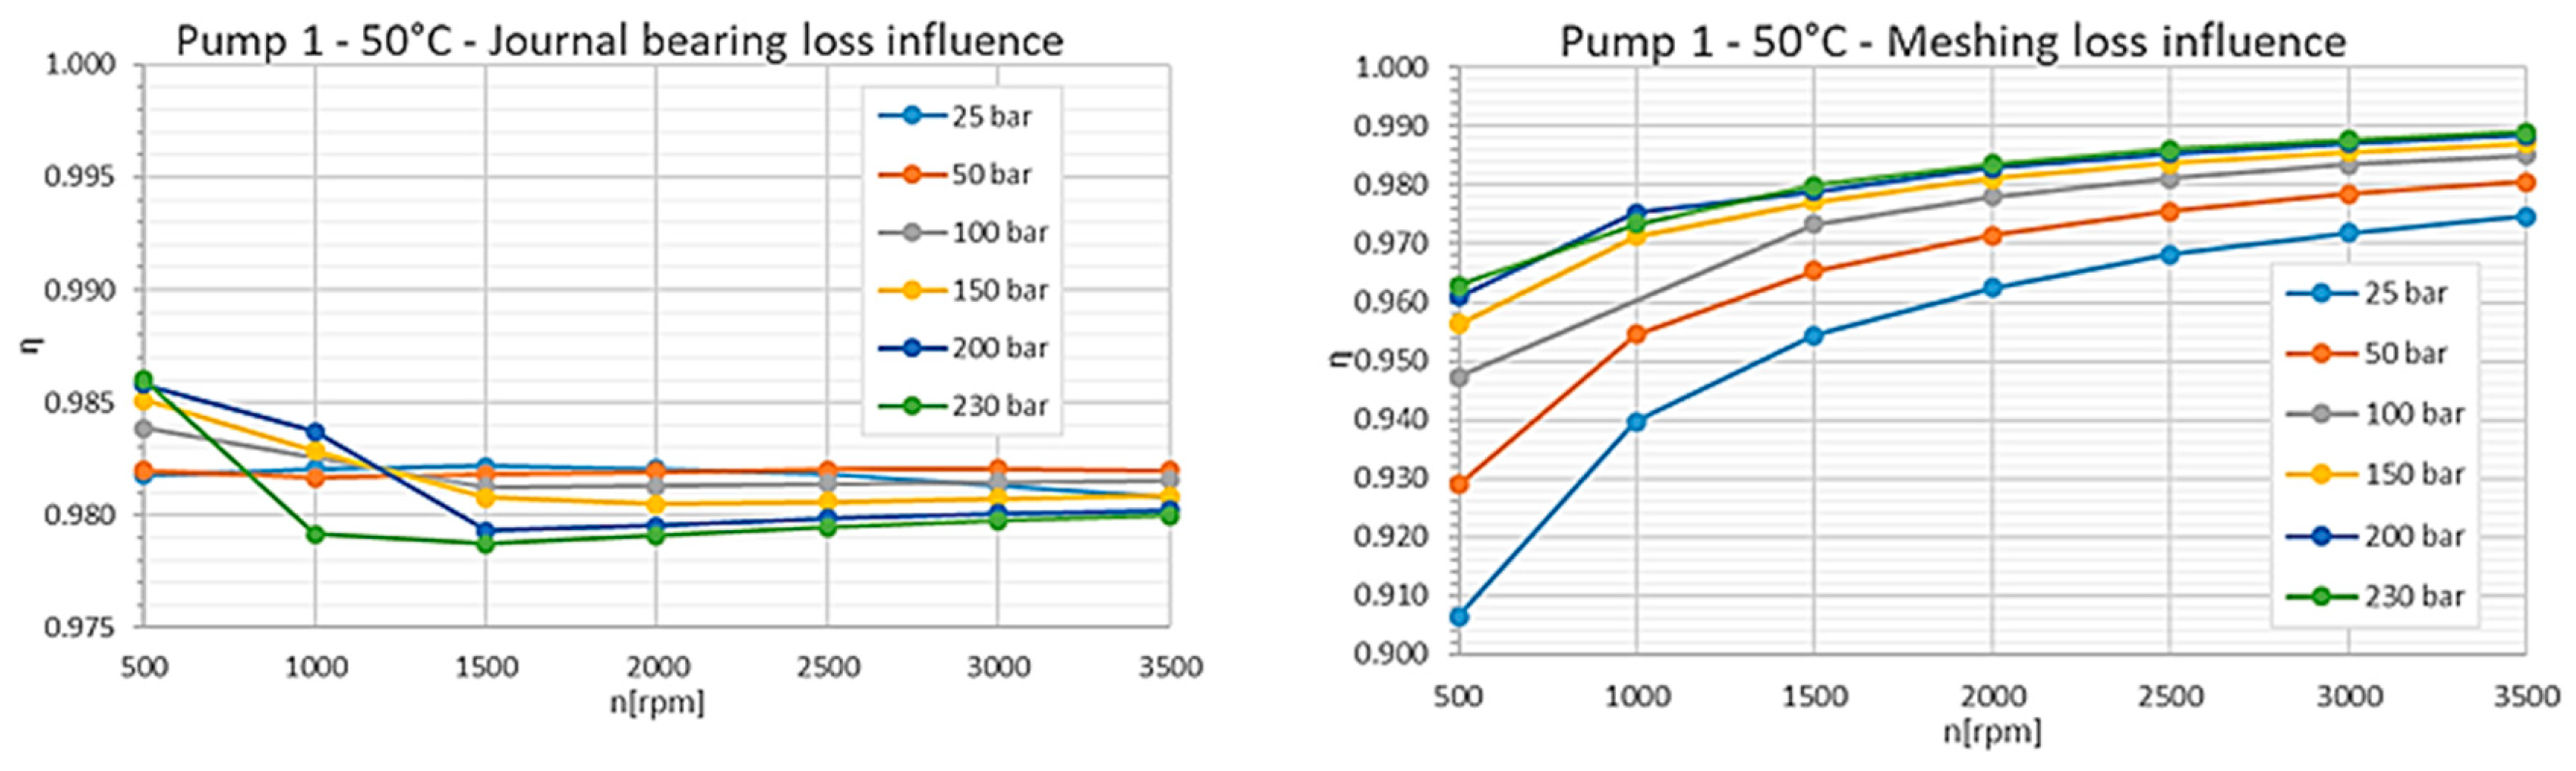
Figure 11 shows the influence of each source of loss with a fluid temperature of 50 °C. Hence, with a lower fluid viscosity, the trend of the journal bearing losses is similar to the one described for 30 °C, with the effect that viscosity change leads to slightly lower losses.
The meshing loss source considers a friction loss that is proportional to the inverse of the viscosity, so an increase of this loss is visible at 50 °C. The lateral gap losses and tooth tip gap losses are instead lower than the case at 30 °C as a consequence of the viscosity decreasing.
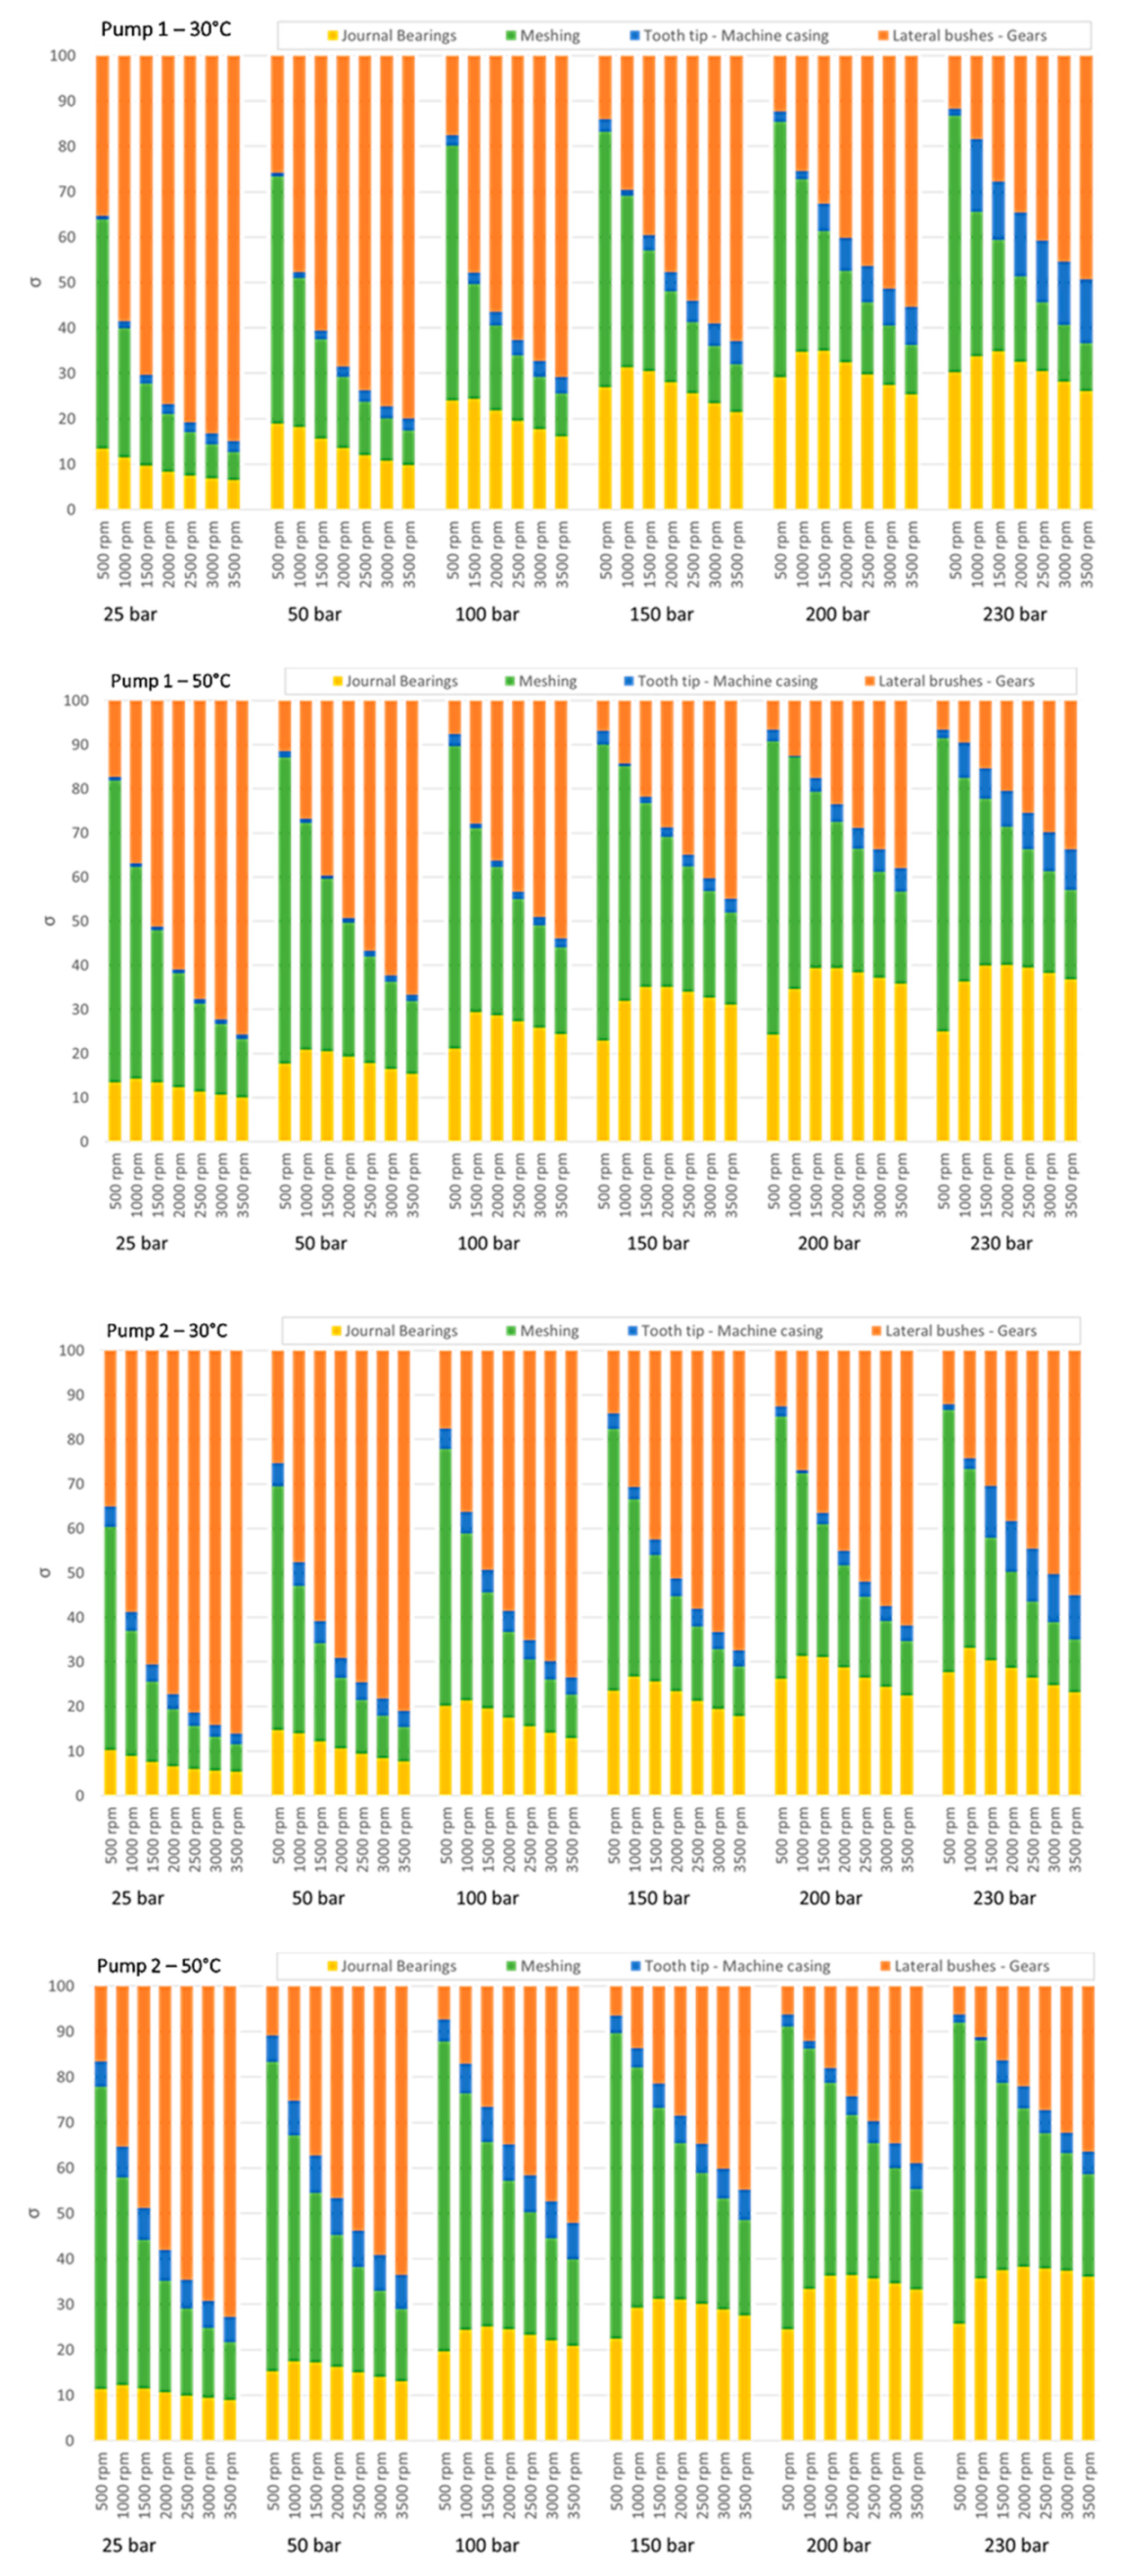
Figure 12 shows another way to look at the results, which may be helpful when considering which design modification can be useful in order to optimize mechanical efficiency. In these charts, related to the two pumps, the weight of each loss is shown as functions of the operating conditions and fluid temperature. Looking at the results at 30 °C, while at low delivery pressure, the lateral gap losses and the meshing loss contribution have higher weight in determining mechanical efficiency, at high pressure the journal bearing loss also plays a significant role. At higher fluid temperatures, the weight of the journal bearing, and meshing losses, are higher. The friction coefficient adopted in the meshing loss definition is an inverse function of fluid viscosity, which decreases as the fluid temperature increases. The lateral gap losses and tooth tip losses decrease with the fluid temperature as a consequence of the reduced viscosity that lowers the viscous friction contribution. The journal bearing friction coefficient does not change significantly in the range of temperatures considered, but its weight on the overall losses slightly increases at higher temperatures.
The design characteristics can play a role in determining the trend and magnitude of losses. Pump 1, if compared with pump 2, shows a higher weight for the tooth tip losses at high delivery pressure values, while it is the opposite in the low pressure range, and the journal bearing losses are characterized by a higher weight in all the operating conditions. Moreover, the weight of the tooth tip losses increases with speed for pump 1 while for pump 2, the behavior is different at the two tested temperature values.
Pump 2 is characterized by a longer circumferential groove on the internal surface of the bushing blocks, and so this behavior is determined by the different position assumed by the gears within the pump during operation as a consequence of the different radial load determined by the different circumferential groove. Especially at high speed values, where the circumferential groove is more effective in determining the radial pressure distribution, the gears in pump 2 have less loaded journal bearings.
5. Conclusions
In this work, the authors presented and discussed a model to determine the hydro-mechanical efficiency of external gear pumps. The model presented in this paper is distinguished from what is found in literature. Our model takes into account the position of the gears inside the pump casing, calculated with a numerical procedure for each operating condition and the design of the pump. This model guesses the bushing block lateral height starting from the mechanical tolerances of the components and their coupling, while considering a variable tilt for the bearing blocks inside the casing. Finally, this model includes loss due to the meshing process. The final aim to define such a model was to be able to relate the friction losses at the design elements of the pump, while keeping the setting of the parameters within the model easy for the user.
The results of the hydro-mechanical efficiency are then discussed with reference to commercial pumps experimentally characterized by the authors in a previous work. The average percentage deviation from experimental data is around 2%, without considering the most critical operating conditions (high delivery pressure, low rotational speed).
The role of each source of loss is discussed for the different design of the pumps, considering several operating conditions and two values of fluid viscosity. It is also worth noting that this kind of discussion on the role and trend of each loss defining the hydro-mechanical efficiency of an external gear pump is not easy to be discerned in the scientific literature (only in [23], to the best of the authors knowledge), while the volumetric efficiency has been much more heavily debated.
Lateral gap loss and meshing loss are much more relevant in determining the hydro-mechanical efficiency variation in the pump operating range than the other losses, especially for lower values of delivery pressure. Moreover, while lateral gap loss increases with rotational speed, meshing loss shows the opposite behavior. The tooth tip gap loss is never very relevant, but it increases at high pressure. The journal bearing loss become comparable with the lateral and meshing ones at high delivery pressure values.
Considering the pumps analyzed and the operating range of delivery pressure values and rotational speed values analyzed, the journal bearing loss makes the mechanical efficiency vary in a percentage range of ±0.5%, with the meshing loss in the range of the ±7%, the lateral loss in the range of about the ±15%, and the tooth tip gap loss in the range of ±1%. The weight of the lateral loss slightly reduces the higher temperature results, while the meshing loss slightly increases the results.
These considerations should lead the focus of the designers who want to improve the performance of the pump from the point of view of efficiency. The bearing blocks design is particularly critical in affecting mechanical efficiency, and this design also influences volumetric efficiency. Therefore, to obtain an optimal compromise, both the volumetric leakages and friction losses must be considered. From the point of view of efficiency, however, if the external gear pump is used at the intermediate level of speeds (1000–2000 rpm) and delivery pressure (100–200 bar), the efficiency is quite good and varying the operating points around the said values does not change the efficiency much.
The whole process of optimizing the design of the bearing blocks and possibly the meshing process is, therefore, worthwhile for special applications, where the possible increment of cost is paid back from the reduction of dissipations. Moreover, this process is certainly mandatory when considering the use of special fluid, such eco-friendly fluid, which may be characterized by different characteristic values for viscosity and different behaviours with temperature variations.
Author Contributions
E.N. and B.Z. conceived, designed, and realized the experiments and numerical analysis; E.N., B.Z. and M.B. analyzed the data; E.N., B.Z., and M.B. wrote the paper.
Funding
This research received no external funding.
Conflicts of Interest
The authors declare no conflict of interest.
Nomenclature
| Symbol | Description |
| Tooth tip thickness | |
| Gear face width | |
| Eccentricity module | |
| Friction coefficient | |
| Journal bearing friction coefficient | |
| Force acting on the gear shaft | |
| Contribution of the viscous friction force at the slice of the lateral gap | |
| Friction force arising within the tooth tip gap | |
| Creep ratio | |
| Creep ratio of approach | |
| Creep ratio of withdrawal | |
| h | Gap height (general) |
| Lateral gap height | |
| Tooth tip gap height | |
| Reference height of the lateral gap | |
| Load intensity | |
| Bushing length | |
| Geometrical parameter | |
| Pump rotational speed | |
| Fluid pressure | |
| Pressure difference between pump ports | |
| Radius of the machine internal casing | |
| Drain radius | |
| Operating pitch radius | |
| Root radius | |
| External radius (tooth tip radius) | |
| Gear shaft radius | |
| Reference radius of the slice of the lateral gap | |
| Sommerfeld number | |
| Lateral Bushing tilt coefficient | |
| Viscous friction torque loss | |
| Dry friction torque loss | |
| Density related torque loss | |
| Constant term torque loss | |
| Journal bearing torque loss | |
| Lateral gap torque loss | |
| Torque losses (generic) | |
| Meshing torque loss | |
| Pump real torque | |
| Pump theoretical torque | |
| Tooth tip torque loss | |
| Fluid speed | |
| Fluid speed value at the movable surface of the gap | |
| Machine displacement | |
| Peripheral velocity on the pitch circle | |
| Reference system coordinates | |
| Number of teeth | |
| Transverse pressure angles | |
| γ | Direction of eccentricity |
| Difference between machine internal chasing radius and gear shaft radius | |
| Relative error | |
| Mechanical efficiency | |
| Calculated mechanical efficiency | |
| Measured mechanical efficiency | |
| Angular position of the gear | |
| Fluid absolute viscosity | |
| Fluid density | |
| Shear stress | |
| Fuid kinematic viscosity | |
| Newtonian friction loss coefficient | |
| Coulombian friction loss coefficient | |
| Density loss coefficient | |
| ω | Angular velocity |
References
- Rundo, M. Models for Flow Rate Simulation in Gear Pumps: A Review. Energies 2017, 10, 1261. [Google Scholar] [CrossRef]
- Koç, E.; Kurbant, A.O.; Hooke, C.J. An analysis of the lubrication mechanisms of the bush-type bearings in high pressure pumps. Tribol. Int. 1997, 30, 553–560. [Google Scholar] [CrossRef]
- Mancò, S.; Nervegna, N. Pressure Transients in an external gear hydraulic pump. In Proceedings of the 2nd JHPS International Symposium on Fluid Power, Tokyo, Japan, 6–9 September 1993. [Google Scholar]
- Paltrinieri, F.; Milani, M.; Borghi, M.; Zardin, B. Studying the Axial Balance of External Gear Pumps. In Proceedings of the SAE Commercial Vehicle Engineering Congress and Exibition, Chicago, IL, USA, 1–3 November 2005. [Google Scholar]
- Borghi, M.; Paltrinieri, F.; Milani, M.; Zardin, B. Pressure Transients in External Gear Pumps and Motors Meshing Volumes. In Proceedings of the SAE Commercial Vehicle Engineering Congress and Exibition, Chicago, IL, USA, 1–3 November 2005. [Google Scholar]
- Zardin, B.; Borghi, M. Modelling and simulation of external gear pumps and motors. In Proceedings of the 5th FPNI Ph.D. Symposyum, Kracow, Poland, 1–5 July 2008. [Google Scholar]
- Borghi, M.; Paltrinieri, F.; Zardin, B.; Milani, M. External Gear Pumps and Motors Bearing Blocks Design: Influence on the Volumetric Efficiency. In Proceedings of the 51st National Conference on Fluid Power, Las Vegas, NV, USA, 12–14 March 2008. [Google Scholar]
- Borghi, M.; Zardin, B. Axial Balance of External Gear Pumps and Motors: Modelling and Discussing the Influence of Elastohydrodynamic Lubrication in the Axial Gap. In Proceedings of the ASME International Mechanical Engineering Congress and Exposition, Volume 15: Advances in Multidisciplinary Engineering. Houston, TX, USA, 13–19 November 2015. [Google Scholar] [CrossRef]
- Casoli, P.; Vacca, A.; Berta, G.L. A Numerical Model for the Simulation of Flow in Hydraulic External Gear Machines; Power Transmission and Motion Control (PTMC); University of Bath (GB): Bath, UK, 2006; pp. 147–168. ISBN 08-6197-135-3. [Google Scholar]
- Dhar, S.; Vacca, A.; Lettini, A. A novel elastohydrodynamic model for the lubricating gaps in external gear machines: Evaluation of axial balance. In Proceedings of the 7th FPNI Ph.D. Symposium on Fluid Power, Reggio Emilia, Italy, 27–30 June 2012; ISBN 978-88-7559-069-7. [Google Scholar]
- Dhar, S.; Vacca, A. A fluid structure interaction–EHD model of the lubricating gaps in external gear machines: Formulation and validation. Tribol. Int. 2013, 62, 78–90. [Google Scholar] [CrossRef]
- Thiagarajan, D.; Vacca, A. Mixed Lubrication Effects in the Lateral Lubricating Interfaces of External Gear Machines: Modelling and Experimental Validation. Energies 2017, 10, 111. [Google Scholar] [CrossRef]
- Zhou, J.; Vacca, A.; Casoli, P. A novel approach for predicting the operation of external gear pumps under cavitating conditions. Simul. Model. Pract. Theory 2014, 45, 35–49. [Google Scholar] [CrossRef]
- Del Campo, D.; Castilla, R.; Raush, G.; Gamez-Montero, P.; Codina, E. Pressure effects on the performance of external gear pumps under cavitation. Proc. Inst. Mech. Eng. Part C J. Mech. Eng. Sci. 2014, 228, 2925–2937. [Google Scholar] [CrossRef]
- Castilla, R.R.; Gamez-Montero, P.J.; del Campo, D.D.; Raush, G.G.; Garcia-Vilchez, M.M.; Codina, E.E. Three-Dimensional Numerical Simulation of an External Gear Pump with Decompression Slot and Meshing Contact Point. ASME J. Fluids Eng. 2015, 137, 041105. [Google Scholar] [CrossRef]
- Edge, K.; Keogh, P.; Eaton, M. Modelling and Simulation of Pressures within the Meshing Teeth of Gear Pumps. In Proceedings of the International Conference on Recent Advances in Aerospace Actuation Systems and Components, Toulouse, France, 13–15 June 2001. [Google Scholar]
- Borghi, M.; Milani, M.; Paltrinieri, F.; Zardin, B. The Influence of Cavitation and Aeration on Gear Pumps and Motors Meshing Volumes Pressures. In Proceedings of the ASME International Mechanical Engineering Congress and Exposition, Chicago, IL, USA, 5–10 November 2006. [Google Scholar]
- Frosina, E.; Senatore, A.; Rigosi, M. Study of a High-Pressure External Gear Pump with a Computational Fluid Dynamic Modeling Approach. Energies 2017, 10, 1113. [Google Scholar] [CrossRef]
- Wang, S.; Sakura, H.; Kasarekar, A. Numerical modelling and analysis of external gear pumps by applying generalized control volumes. Math. Comput. Model. Dyn. Syst. 2011, 17, 501–513. [Google Scholar] [CrossRef]
- Mucchi, E.; Dalpiaz, G.; Rivola, A. Dynamic behavior of gear pumps: Effect of variations in operational and design parameters. Meccanica 2011, 46, 1191. [Google Scholar] [CrossRef]
- Mucchi, E.; Venturi, V.; Dalpiaz, G. A Hybrid LP/FE Model for the Dynamic Analysis of External Gear Pumps. ASME. In Proceedings of the ASME International Mechanical Engineering Congress and Exposition, Volume 9: Mechanical Systems and Control, Parts A, B, and C, Seattle, WA, USA, 11–15 November 2007; pp. 1523–1532. [Google Scholar] [CrossRef]
- Borghi, M.; Zardin, B.; Specchia, E. External Gear Pump Volumetric Efficiency: Numerical and Experimental Analysis; SAE Technical Paper No. 2009-01-2844; SAE International: Chicago, IL, USA, 2009. [Google Scholar] [CrossRef]
- Thiagarajan, D.; Vacca, A. Investigation of Hydro-Mechanical Losses in External Gear Machines: Simulation and Experimental Validation. Fluid Power Systems Technology. In Proceedings of the BATH/ASME 2016 Symposium on Fluid Power and Motion Control, Bath, UK, 7–9 September 2016; p. V001T01A015. [Google Scholar] [CrossRef]
- Manring, N.D. Measuring Pump Efficiency: Uncertainty Considerations. ASME J. Energy Resour. Technol. 2005, 127, 280–284. [Google Scholar] [CrossRef]
- Rahmfeld, R.; Skirde, E. Efficiency Measurement and Modeling- Essential for Optimizing Hydrostatic Systems. In Proceedings of the 7th International Fluid Power Conference, Aachen, Germany, 22–24 March 2010; ISBN 9783940565938. [Google Scholar]
- Michael, P.; Khalid, H.; Wanke, T. An Investigation of External Gear Pump Efficiency and Stribeck Values; SAE Technical Paper: No. 2012-01-2041; SAE International: Chicago, IL, USA, 2012. [Google Scholar] [CrossRef]
- Ivantysyn, J.; Ivantysynova, M. Hydrostatic Pumps and Motors, Principles, Designs, Performance, Modelling, Analysis, Control and Testing; Akademia Books International: New Delhi, India, 2002. [Google Scholar]
- Wilson, W.E. Positive Displacement Pumps and Fluid Motors; Pitman Publishing Corporation: London, UK, 1950. [Google Scholar]
- Zarotti, G.L.; Nervegna, N. Pump efficiency approximation. In Proceedings of the 6th International Fluid Power Symposium, Cambridge UK, 8–10 April 1981; pp. 145–164. [Google Scholar]
- Osinski, P.; Deptula, A.; Partyka, M.A. Discrete optimization of a gear pump after tooth root undercutting by means of multi-valued logic trees. Arch. Civ. Mech. Eng. 2013, 13, 422–431. [Google Scholar] [CrossRef]
- International Organization for Standardization, ISO/TR 14179-1:2001. Available online: https://www.iso.org/standard/34636.html (accessed on 25 June 2019).
- Toet, G.; Johnson, J.; Montague, J.; Torres, K.; Garcia-Bravo, J. The Determination of the Theoretical Stroke Volume of Hydrostatic Positive Displacement Pumps and Motors from Volumetric Measurements. Energies 2019, 12, 415. [Google Scholar] [CrossRef]
Figure 1.
External gear pump components and identification of the mechanical-viscous sources of loss.
Figure 1.
External gear pump components and identification of the mechanical-viscous sources of loss.

Figure 2.
Control volume considered for continuity equation application.

Figure 3.
Reference scheme of the tooth tip gap considered in the model.

Figure 4.
Qualitative pressure distribution in the journal bearing (gear shaft-bushing blocks gap).

Figure 5.
Reference tooth subdivision. (a) Tooth region considered to calculate the lateral losses (b) same region in 3D representation with the frame of reference adopted
Figure 5.
Reference tooth subdivision. (a) Tooth region considered to calculate the lateral losses (b) same region in 3D representation with the frame of reference adopted

Figure 6.
Inclination of the floating bushes.

Figure 7.
View of the gears and internal surface of the bushing blocks for pump 1 (a) and 2 (b).

Figure 8.
Relative errors on the calculation of the mechanical efficiency of pump 1 for different operating conditions and fluid temperature: (a) 30 °C and h0 = 5 μm; (b) 30 °C and h0 = 10 μm; (c) 50 °C and h0 = 5 μm; (d) 50 °C and h0 = 10 μm.
Figure 8.
Relative errors on the calculation of the mechanical efficiency of pump 1 for different operating conditions and fluid temperature: (a) 30 °C and h0 = 5 μm; (b) 30 °C and h0 = 10 μm; (c) 50 °C and h0 = 5 μm; (d) 50 °C and h0 = 10 μm.

Figure 9.
Relative errors on the calculation of the mechanical efficiency of pump 2 for different operating conditions and fluid temperature: (a) 50 °C and h0 = 5 μm; (b) 30 °C and h0 = 10 μm.
Figure 9.
Relative errors on the calculation of the mechanical efficiency of pump 2 for different operating conditions and fluid temperature: (a) 50 °C and h0 = 5 μm; (b) 30 °C and h0 = 10 μm.

Figure 10.
Calculated mechanical efficiency for pump 1 at 30 °C considering one type of loss at a time.
Figure 10.
Calculated mechanical efficiency for pump 1 at 30 °C considering one type of loss at a time.

Figure 11.
Calculated mechanical efficiency for pump 1 at 50 °C considering one type of loss at a time.
Figure 11.
Calculated mechanical efficiency for pump 1 at 50 °C considering one type of loss at a time.


Figure 12.
Losses weight in percentage (σ) for pump 1 and 2 at 30 °C and 50 °C fluid temperature and for all the operating conditions tested.
Figure 12.
Losses weight in percentage (σ) for pump 1 and 2 at 30 °C and 50 °C fluid temperature and for all the operating conditions tested.


Table 1.
Parameters of the meshing losses calculation.
| Symbol | Description |
|---|---|
| Number of teeth | |
| Gear face width | |
| Operating pitch radius | |
| External radius (tooth tip radius) | |
| Transverse pressure angles | |
| Wheel rotation speed |
Table 2.
Geometrical Parameters Characterizing the Pump.
| Parameter | Value | Unit |
|---|---|---|
| Pressure Contact Angle | 20 | [degrees] |
| Gear Head Diameter | 14.49 | [mod] |
| Gear Root Diameter | 9.51 | [mod] |
| Drain Diameter | 7.72 | [mod] |
| Number of Teeth | 12 | - |
| Reference Lateral Height | 10 | [μm] |
| Gear Face Width | 2.83 | [mod] |
© 2019 by the authors. Licensee MDPI, Basel, Switzerland. This article is an open access article distributed under the terms and conditions of the Creative Commons Attribution (CC BY) license (http://creativecommons.org/licenses/by/4.0/).
Share and Cite
MDPI and ACS Style
Zardin, B.; Natali, E.; Borghi, M. Evaluation of the Hydro—Mechanical Efficiency of External Gear Pumps. Energies 2019, 12, 2468. https://doi.org/10.3390/en12132468
AMA Style
Zardin B, Natali E, Borghi M. Evaluation of the Hydro—Mechanical Efficiency of External Gear Pumps. Energies. 2019; 12(13):2468. https://doi.org/10.3390/en12132468
Chicago/Turabian StyleZardin, Barbara, Emiliano Natali, and Massimo Borghi. 2019. "Evaluation of the Hydro—Mechanical Efficiency of External Gear Pumps" Energies 12, no. 13: 2468. https://doi.org/10.3390/en12132468
Note that from the first issue of 2016, this journal uses article numbers instead of page numbers. See further details here.