What’s Conventional and What’s Special in a Reservoir Study for Underground Gas Storage


Dipartimento di Ingegneria dell’Ambiente, del Territorio e delle Infrastrutture (DIATI), Politecnico di Torino, Corso Duca degli Abruzzi 24, 10129 Torino, Italy
Energies 2018, 11(5), 1245; https://doi.org/10.3390/en11051245
Submission received: 8 March 2018
/
Revised: 27 April 2018
/
Accepted: 1 May 2018
/
Published: 14 May 2018
(This article belongs to the Section L: Energy Sources)
Abstract
:The development of an underground gas storage (UGS) project and its subsequent management must ensure technical feasibility, commercial value and long-term efficiency. The UGS industry has borrowed much of its knowledge from other disciplines (primarily oil and gas reservoir engineering), but it has also developed its own technology. This paper provides a methodological approach based on current practices and available methods for designing and safely operating a UGS (including the so-called “delta-pressure” option to enhance UGS performance) and highlights what is special in UGS compared to oil and gas reservoirs.
1. Introduction
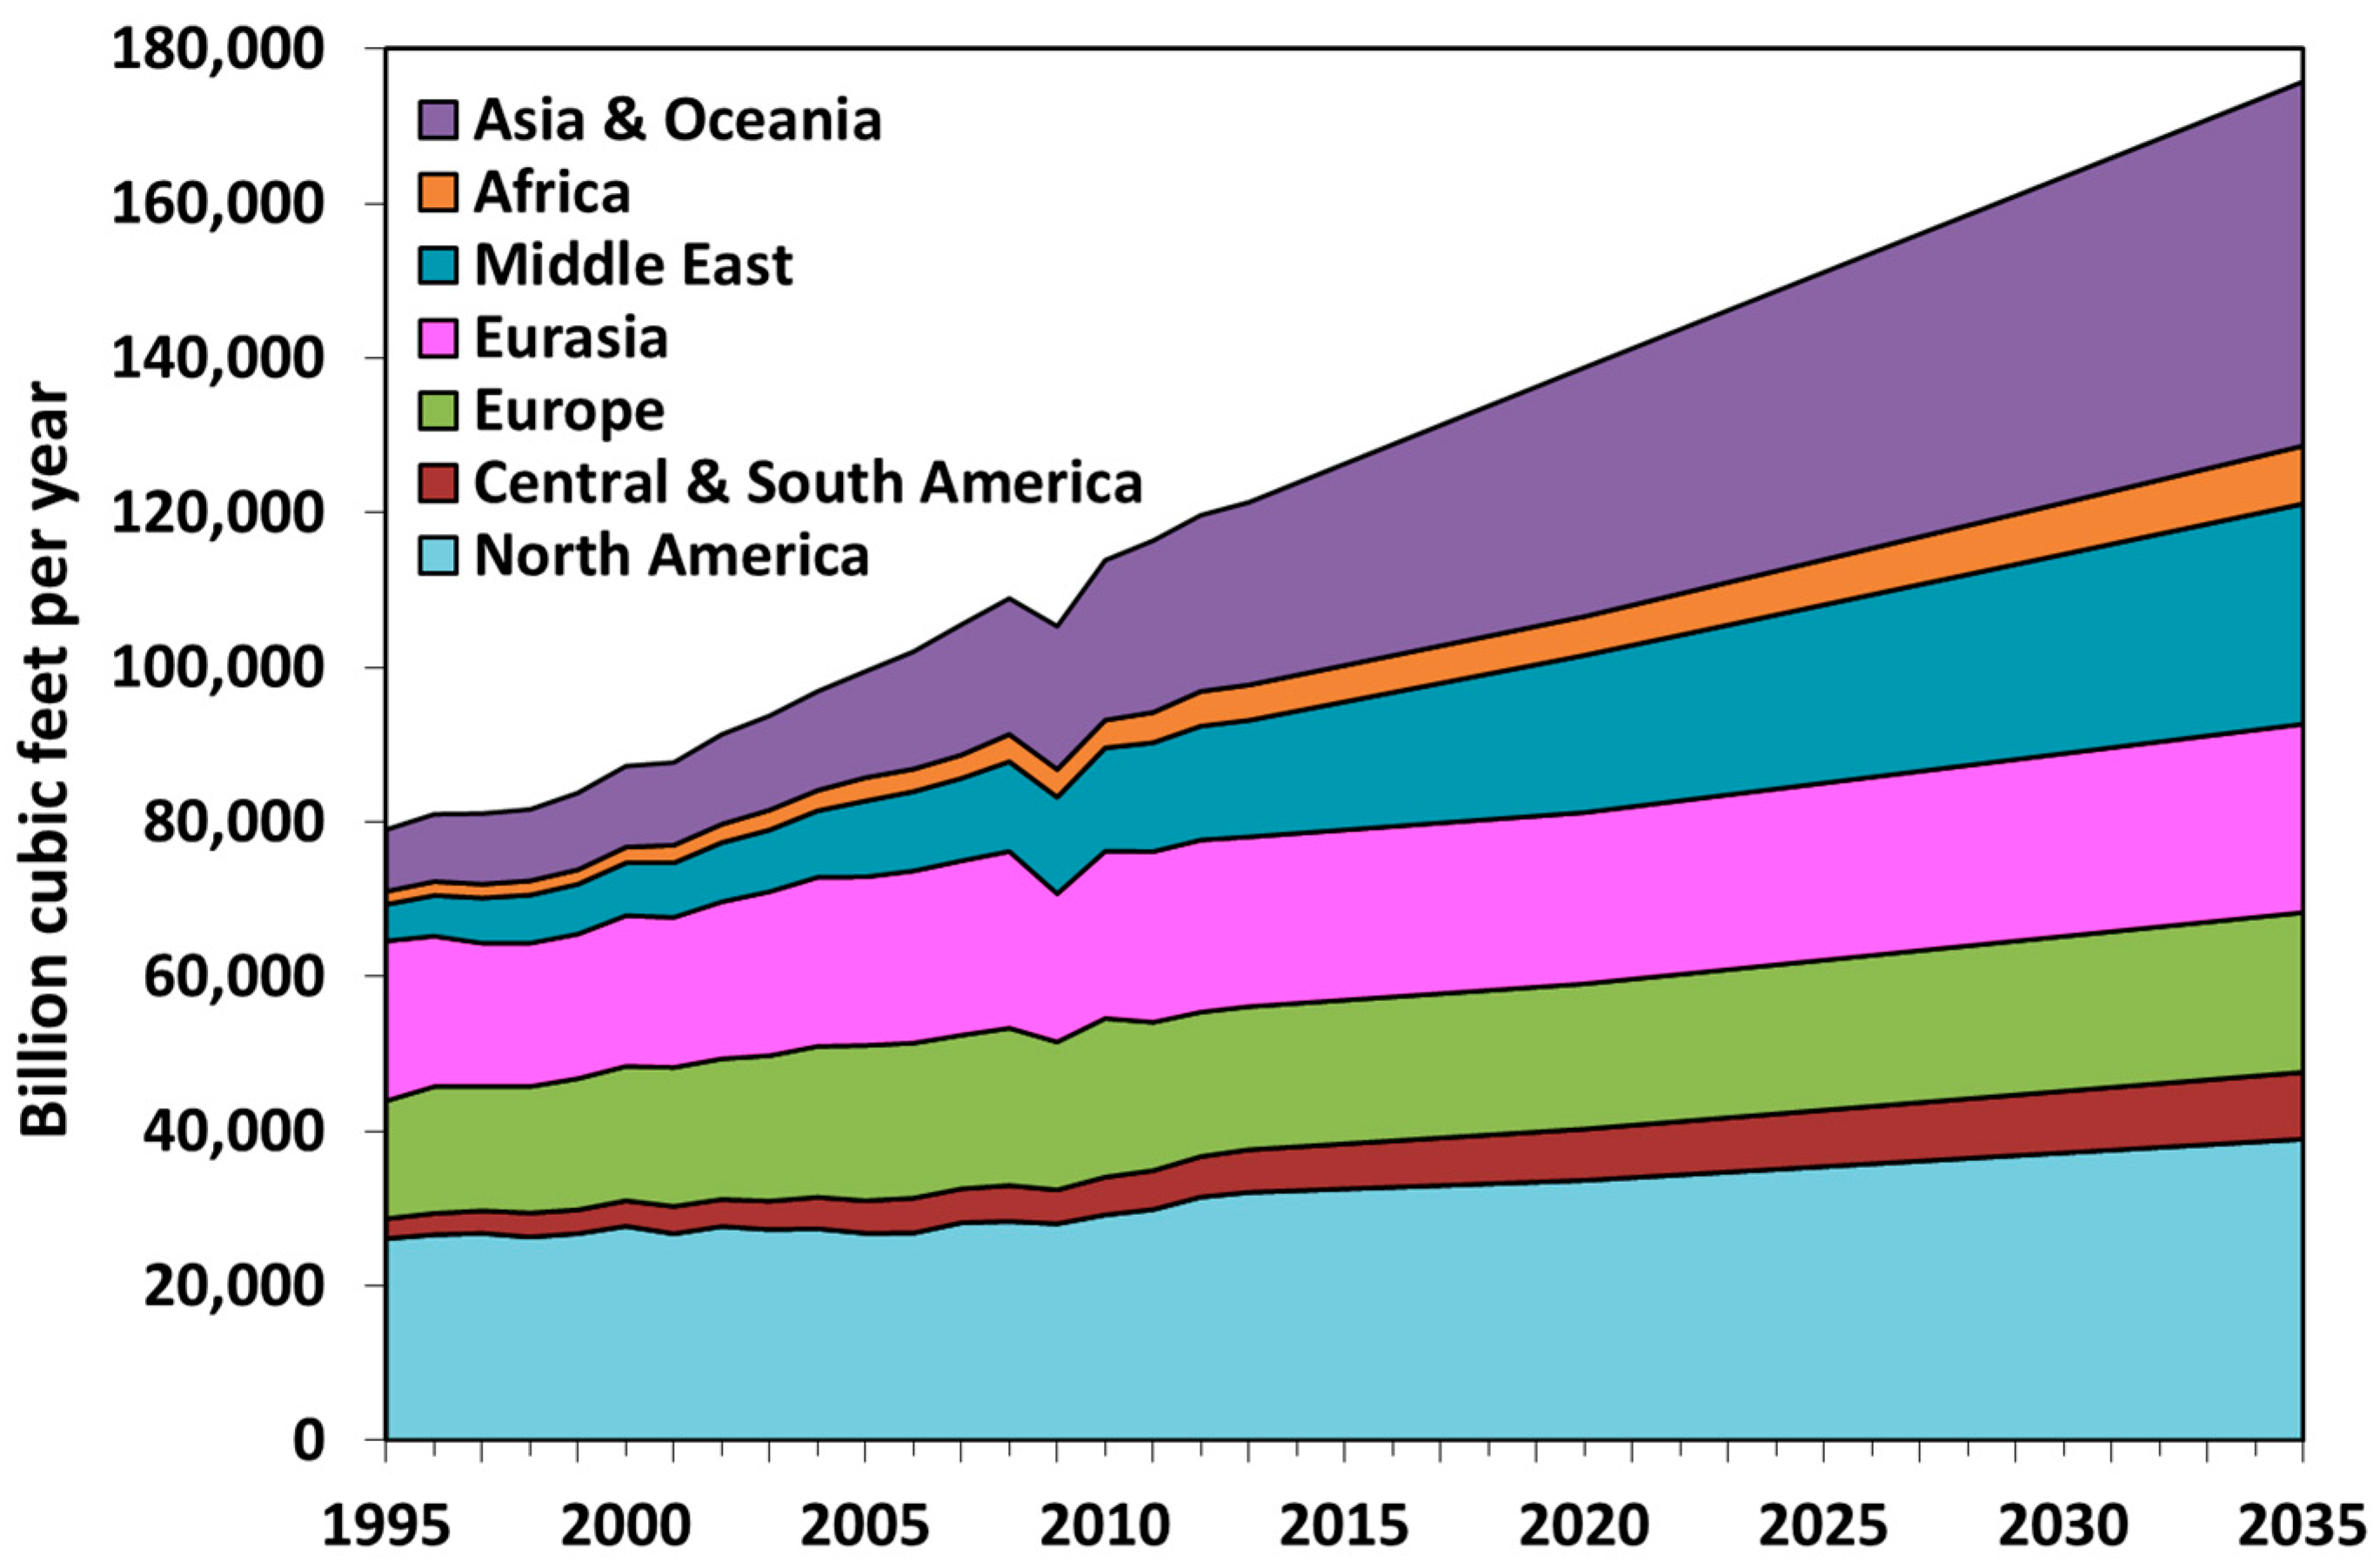
The concept of storing natural gas underground in geologic formations arose from the need to balance the divergence between a constant gas supply and the seasonal and daily variability of gas consumption. The first successful underground storage of natural gas in a depleted natural gas reservoir occurred in 1915 in Ontario, Canada. The original and primary scope of underground gas storage (UGS) was the variation in peak demand of a well-defined consumer area and the optimization of the transport network. Storage also served to conserve some of the gas being wasted or flared during summer months. Since then, hundreds of facilities have been developed: North America has more than two-thirds of the world sites, with 392 storage facilities in the US and 62 in Canada. Europe holds the second rank in terms of number of facilities with 143, followed by the Commonwealth of Independent States (CIS) with 48, Asia-Oceania with 23, the Middle East with 3, and Argentina with just one [1]. Thus, not only has the underground storage of natural gas become a large and essential part of the delivery system but also the increasing demand over the past years (Figure 1) together with insufficient indigenous gas resources has called for a constant increase in underground storage capacity and deliverability, through the creation of both new facilities and the upgrading of existing ones [2,3,4,5,6]. The quantities of imported gas and the distances between producing and consumer countries have gradually increased over time: in particular from Mexico and Canada to the United States and from Siberia, the North Sea and Africa to Europe. Furthermore, the need for strategic storage to make up for temporary disruptions in supply in the case of political events, technical problems, accidents (e.g., interruptions of transport pipelines) or emergencies (e.g., extreme weather conditions) has become critical to safeguard customers and to better negotiate supplies.
Underground gas storage may be defined as the long-term safe isolation of natural gas within geological formations. Thus, two of the most important characteristics of an underground storage are its ability to hold natural gas for future use and the rate at which that gas can be withdrawn. The amount of gas that can be injected and withdrawn during a normal cycle of the storage is called working gas (or top gas); the remaining gas in the reservoir is referred to as base gas (or cushion gas) and it must ensure sufficient pressure to provide the required delivery. Because the base gas remains in the reservoir during the whole life of the UGS, it comprises a major part of the investment to develop the facility.
Depleted gas and oil reservoirs, deep saline formations, salt caverns and un-minable coal beds are the favorite candidates for safe geological storage of natural gas, but several reconditioned mines are also in use as gas storage facilities (Figure 2).
Historically, depleted gas or partially depleted gas reservoirs (fields located deep underground where most of the recoverable product has been extracted) have been the most sizeable and commonly used formations for natural gas storage. A depleted field typically represents the most suitable option because of its ability to contain and trap gas (given the reservoir has contained gas on a geological timescale, it should be capable of doing so again). Pressure is used to force the gas into and out of the porous and permeable reservoir while a sealing caprock prevents vertical fluid migration. However, if the original formation pressure is exceeded during storage operations to increase the working gas volume, there is a risk that the caprock may fail to confine the gas. Thus, both the mechanical resistance and the hydraulic sealing capacity of the caprock must be carefully investigated. Geomechanical analyses are also needed for well performance monitoring (especially when sand production might occur triggered by high withdrawal rates), evaluation of potential subsidence and storage surveillance. Different methodologies to those employed for conventional reservoir studies are needed which are particularly suited for UGS characterization, development and monitoring. Not only does a UGS project require the same basic sets of information as a typical reservoir study (geophysics, geology, well logging and core analysis and production history), it also requires specific additional data (from in situ measurements and laboratory experiments on cores) to test the mechanical integrity of the reservoir to withstand potentially higher pressures than previously encountered.
A significant advantage of depleted fields is the level of knowledge already gained and readily available: information about the geological, structural and petrophysical characteristics and about the fluid-flow properties are inherited from the exploration and primary production phases. Uncertainties are reduced or mitigated with significant economic and technical benefit. From a commercial standpoint, depleted reservoirs typically provide very good storage efficiency both in terms of seasonal movable gas volume (i.e., the working gas) and high peak performances (i.e., injection/withdrawal gas rates).
Deep saline aquifers represent a common alternative for UGS. They typically cost more to develop and operate due to the large cushion gas requirement and the need to verify the reservoir’s ability to contain gas. Furthermore, the development and management of saline aquifers require that the original formation pressure is exceeded to displace the water initially saturating the pores of the rock to accommodate the gas. Thus, the sealing capacity of the caprock as well as the presence of spill points must be assessed in order to prevent gas leakage a lateral gas migration.
Salt caverns and excavated caverns within rocks such as coal and granite are generally developed in regions where reservoirs are not available. They are typically much smaller in volume than either depleted reservoirs or aquifers but can provide high delivery rates suitable for meeting meet peak load demands [3].
Each type of UGS has its own physical characteristics and economics but the development of any new UGS project and its subsequent management will always require several steps and actions to ensure technical feasibility, commercial value and long-term efficiency. Enhancing the capacity and deliverability of an existing UGS would call for substantially the same procedure.
The successful development of a UGS must include an appropriate site selection based on subsurface information, but also suitable performance analysis, preferably based on a fully integrated geological, fluid-dynamic and geo-mechanical approach, and eventually an adequate monitoring program to satisfy domestic technical and safety regulations together with social and environmental concerns. The latter particularly applies to delta-pressuring to ensure the long-term feasibility of the project. Delta-pressuring is a term used for the operation of a storage reservoir at a maximum working pressure in excess of its initial formation pressure. It is a common option to enhance the performance of UGS, especially in terms of working gas. There are dozens of UGS operated under delta-pressure conditions in the US and Canada and a few in Europe.
The UGS industry has borrowed much of its knowledge from other industries (primarily oil and gas reservoir engineering and production), but it has also needed to develop a technology of its own to meet specific challenges and concerns. In other words, what had begun as an “undisciplined” field of study within reservoir engineering, is now evolving into a self-contained “discipline”. In the following, the recommended practice and currently available methods are provided for the design and safe operation of a UGS in either a depleted reservoir or an aquifer.
2. UGS Key Aspects
2.1. Threshold Pressure
The transport capacity of the fine-grained sedimentary rocks constituting the caprock of existing reservoirs is clearly negligible as this top seal has been able to retain hydrocarbons over geological time. However, should the original formation pressure be exceeded during storage operations the sealing efficiency of the caprock formation must be evaluated anew; this is generally done through the measurement of the threshold pressure. The threshold pressure can be defined as the minimum pressure required by gas to displace the water initially filling the pores of the caprock. At this stage gas enters the caprock but cannot flow through it yet; continuous flow paths of the gas are established only when the gas content across the entire caprock thickness exceeds a minimum value (i.e., the gas saturation exceeds the critical gas value).
Direct measurements of the threshold pressure require lab experiments on the caprock cores (or plugs) to be performed at reservoir conditions. A two-phase fluid flow drainage process is induced through the rock sample in a triaxial cell, which reproduces the in situ confining pressure and stress conditions acting on the rock [10]. The test can be performed and interpreted according to different experimental procedures and approaches [11,12,13]; generally, mercury-air or nitrogen-water systems are utilized in lab experiments and the results are then corrected according to the real gas-water characteristics. A detailed literature review of threshold pressure measurement can be found in [14]. Regardless from the adopted experimental procedure, threshold pressure evaluation via lab analysis is always time-consuming (in the order of days or even weeks) due to the poor fluid transport property of the tested fine-grained caprocks. Consequently, different experimental and theoretical relations between threshold pressure values and petrophysical rock properties, such as permeability, porosity and formation resistivity, have also been developed [15,16,17]. However, even if these correlations represent a cheap and prompt alternative for a first-guess parameter estimation, only lab analyses can provide a reliable threshold pressure evaluation. This will define the maximum average pressure that can be safely reached in the reservoir.
2.2. Well Testing
Conventional well testing consists in analyzing the pressure transient recorded downhole during the production of reservoir fluids at either a constant or a variable rate, and subsequent shut-in phase. Well tests have been widely used for several decades in the oil industry for the evaluation of reservoir characteristics, which are key information for field development and facilities design [18,19,20,21,22,23]. However, the UGS industry has some specific requirements, such as:
- repeated assessment of well productivity and injectivity because of turbulence effects affecting well performance during a storage cycle due to the significant variation of reservoir pressure conditions;
- repeated assessment of formation damage due to the high risk of sand production and consequent gravel pack/screen clogging;
- identification of lateral/vertical variations of petrophysical properties causing uneven pressure distribution; relatively minor heterogeneities can significantly affect the dynamic response of the system due to the high rates imposed by storage activities.
The need to acquire this information, which would call for expensive traditional testing campaigns, can be better satisfied by alternative well testing procedures, such as harmonic pulse testing [24,25,26,27,28,29,30,31,32,33,34,35,36,37,38,39,40] and injection testing [41,42]. A harmonic test is characterized by a periodic sequence of alternating production or injection rates that can be imposed after a long shut-in of the tested well, similar to conventional well testing, or can be superposed to ongoing production, minimizing or avoiding economic losses. Furthermore, it offers the advantage of not requiring the initial static pressure nor the previous production history of the well to be known [43] and it is particularly sensitive to lateral/vertical variations of rock properties. The second most interesting unconventional methodology is injection testing. An injection test consists in injecting, rather than producing, a fluid in a potential reservoir zone and in monitoring the pressure response. Except for fluid sampling, injection tests can provide the same information as conventional tests [44,45]. This methodology is easily applied to UGS because gas injection is the very essence of gas storage and the critical issues that can arise when injecting a fluid which is immiscible with the reservoir fluid are removed [46]. Thus, reservoir and well information can be unlocked at a very low cost if downhole pressure is monitored during gas injection and then analyzed [47].
2.3. Rock Mechanics
Despite no USG failures having been reported worldwide due to leakage through the caprock or along (reactivated) faults [48,49] current regulations and public concerns call for geomechanical analyses to assess the magnitude and extension of ground movements and fault stability. The characterization of the geomechanical behavior of the system requires in situ measurements (along the wells and downhole) and lab tests on cores. In principle, both the intact rock and the faults, if any, should be characterized under existing reservoir conditions.
2.3.1. In-Situ Stresses
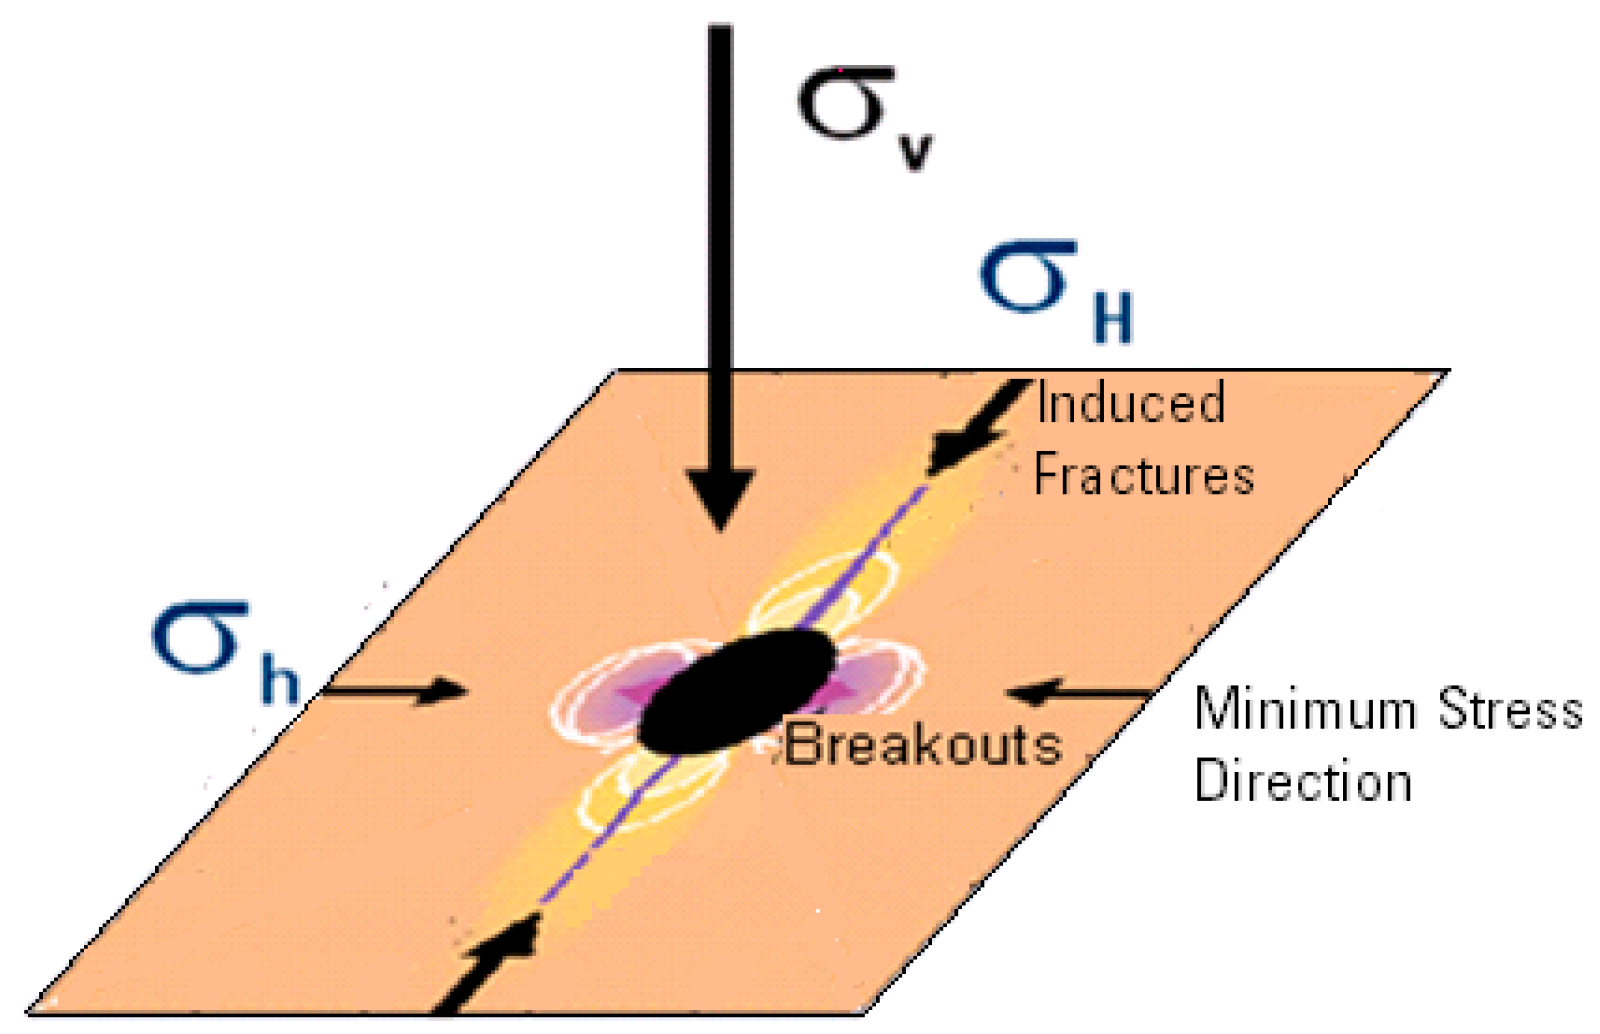
The knowledge of the magnitudes and directions of original and induced stresses is essential for proper geomechanical modeling. The stress distribution drives the orientation and confinement of the induced fractures and breakouts: induced fractures (by drilling and by stress tests) develop perpendicular to the minimum stress direction while breakouts are oriented parallel to minimum stress direction (Figure 3) [9].
It is widely accepted that the full stress tensor cannot be completely assessed by a single method. The vertical stress is generally inferred from density logs while the most direct method for estimating the minimum horizontal stress is hydraulic fracturing. The latter can be performed via wireline stress logs, extended-leak off tests and/or micro-hydraulic fracturing tests. These techniques require injecting fluids at pressures that normally exceed the formation pressure, thereby causing a breakdown. The minimum horizontal stress magnitude can be deduced from an accurate record and analysis of the fracture closure pressure. A caliper log with at least four arms or ultrasonic borehole imaging data is used to define the breakout orientation. The maximum horizontal stress is the most difficult to accurately constrain and, because it cannot be measured directly, only analytical solutions can be of help. Image logs are used to identify fractures induced by drilling and stress tests; they can be helpful in the identification of the direction of the maximum horizontal stress [50].
In seismically active regions, important information about the in-situ stress field can be obtained from earthquake focal mechanisms, also known as fault plane solutions [51]. There are clear advantages to properly utilizing constrained earthquake focal plane mechanisms to map the stress field: earthquakes record stress-induced deformations at mid-crustal depths; they sample relatively large volumes of rock and, due to the continued improvement of global networks, well-constrained focal mechanisms for mapping the stress field are nowadays quite easy to access [52].
2.3.2. Intact Rock
The characterization of the intact rock requires the determination of deformation and strength parameters which are dictated by the constitutive law (purely elastic, elasto-plastic, visco-elasto-plastic, etc.) while the strength parameters are imposed by the yield criterion (Mohr–Coulomb, Tresca, von Mises, etc.).
If the applicability of an elastic law is assumed, rock behavior can be described based on the Young’s modulus, Poisson’s ratio, bulk modulus and shear modulus. Due to the mathematical relations among the elastic moduli, only two of them are needed to fully characterize the system. The elastic moduli can be experimentally determined under static or dynamic loading conditions. Static conditions imply the measurement of the deformation induced in a material by application of a known force; dynamic conditions involve the measurement of ultrasonic wave velocities. The static method is applied via lab analysis and consequently the static moduli refer to the core scale; the dynamic values can be determined at core scale via lab tests, at wellbore scale via log data and at reservoir scale via seismic acquisition. Technical literature shows that, in general, the static moduli are 5% to 10% lower than the dynamic moduli for the same rock [53,54]. Dynamic moduli are representative of the small strain behavior of soils, while static moduli are more useful when soil strains increase. Thus, the loading conditions imposed by storage activities are better represented by the dynamic moduli because the range of deformations in the depletion and injection phases usually correspond to small strains [55].
The determination of the clay’s oedometric behavior (a measure of its consolidation properties) is essential for a realistic description of the rock deformation during UGS activities. Generally, cores are recovered from the reservoir and the caprock only and hence log data are used to characterize the overburden rocks. During primary production, the caprock clays usually work in a normally consolidated way and their deformation modulus can be 3 or 4 times lower than the characteristic values of over-consolidated behavior, which typically represent the formation status during re-pressurization and storage cycles.
2.3.3. Faults
Fault characterization is critical: indirect data acquired from outcrops or seismic surveys have a limited resolution which does not provide internal details of the fault zones. Additionally, direct lab tests are hampered by the generally poor quality of cored material for mechanical testing. Fault microstructural and geomechanical properties are a consequence of strain rate, principal stress orientation, shear sense, pore pressure, lithification state and diagenesis and they can differ significantly between the extremes of cohesionless, unlithified sand and brittle cemented sandstones. Therefore, to predict fault rock properties, it is essential to establish the diagenetic history as well as the burial depth at which the deformation occurred [56].
3. Dynamic Modeling
The efficient management of any storage system requires the definition of a reliable analysis tool, usually a 3D numerical model, which is then used for defining the most viable development and operational strategy from both economic and technical standpoints. The generation of static (geological) and dynamic (fluid-flow) reservoir numerical models is a common practice in the oil industry to forecast the future performance of the field and relies on the use of industry-standard commercial software. The static and dynamic approach for UGS analysis follows the same basic workflow as a typical reservoir study. However, there are issues which are specifically relevant to gas storage: changing gas composition; a slight decrease in reservoir temperature due to repeated injection of “cold” gas; the heightened effects of petrophysical heterogeneities on the pressure response due to the repeated withdrawal and injection of gas at high rates (typically never experienced during primary production) resulting in rapid and significant pressure variations; hysteresis of gas-water relative permeabilities, capillary pressures and rock compressibility. In addition, the historical production data that are fed to the simulator are typically merged into regular (e.g., monthly) time steps to reduce the simulation run-time; but in the case of UGS the frequent switches between gas withdrawal and injection must be properly accounted for.
Gas storage operators have often faced the difficult task of having to find, within “conventional” reservoir engineering, appropriate solutions to these very specific problems. The author’s experience has been to build upon existing standard reservoir studies and methodologies to answer the increasingly specific questions of natural gas storage studies.
3.1. Schedule Definition
Amongst the major issues one must deal with in UGS management is the schedule of a reservoir in which withdrawal and injection might have quick, sudden and frequent switches. A production history accounting for daily rates would not be feasible because short time intervals imply excessively long simulation run time; however, cumulative net produced or injected volumes averaged over a period of time (whether this is a week or a month) would not match the real stocked and withdrawn gas volumes and would not find correspondence with flowing pressure measurements (downhole and at the well head). Moreover, a representative schedule is needed to have more reliable short-term forecasting capabilities, which are key to the accurate prediction of the actual flow of gas to improve profits from selling extra gas and to avoid the penalties should there be a difference between the expected and actual flow rate.
Routines were developed by the author for the automatic identification of injection and withdrawal rates in a historical sequence with appropriate merging in potentially uneven periods of time; they proved very effective for the simulation of the true UGS production history whilst reducing the run time of the simulator to a reasonable duration, especially when the UGS had been operated for years and/or the number of wells is large (Figure 4).
3.2. Gas PVT Properties
Like in any standard reservoir study, a UGS dynamic model calibration is achieved by changing the most uncertain input parameters within feasible ranges [57]. However, the physics of the phenomena induced by storage activities is strictly related to some specific parameters, such as gas compressibility.
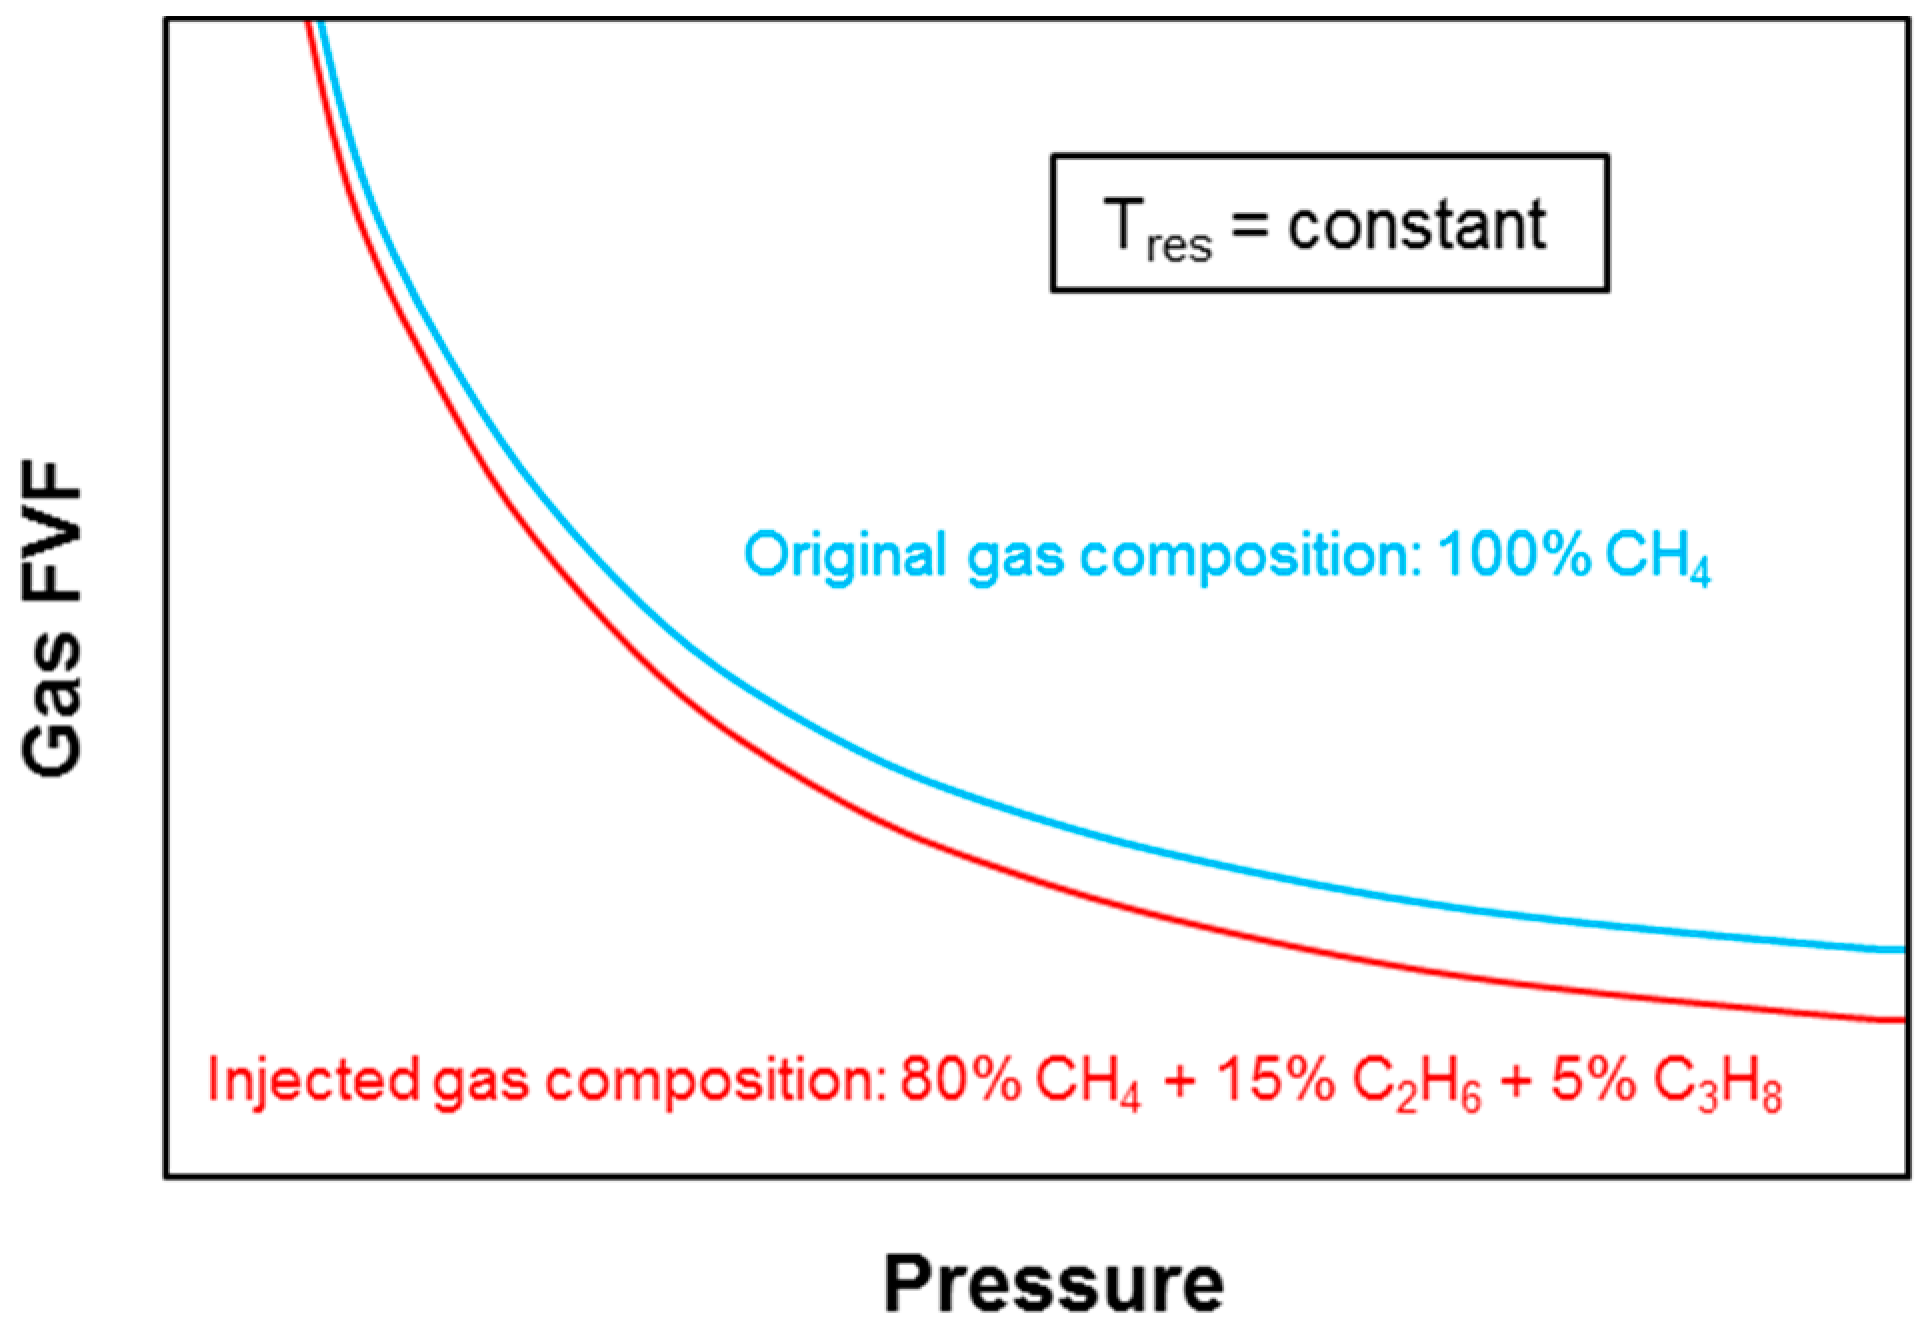
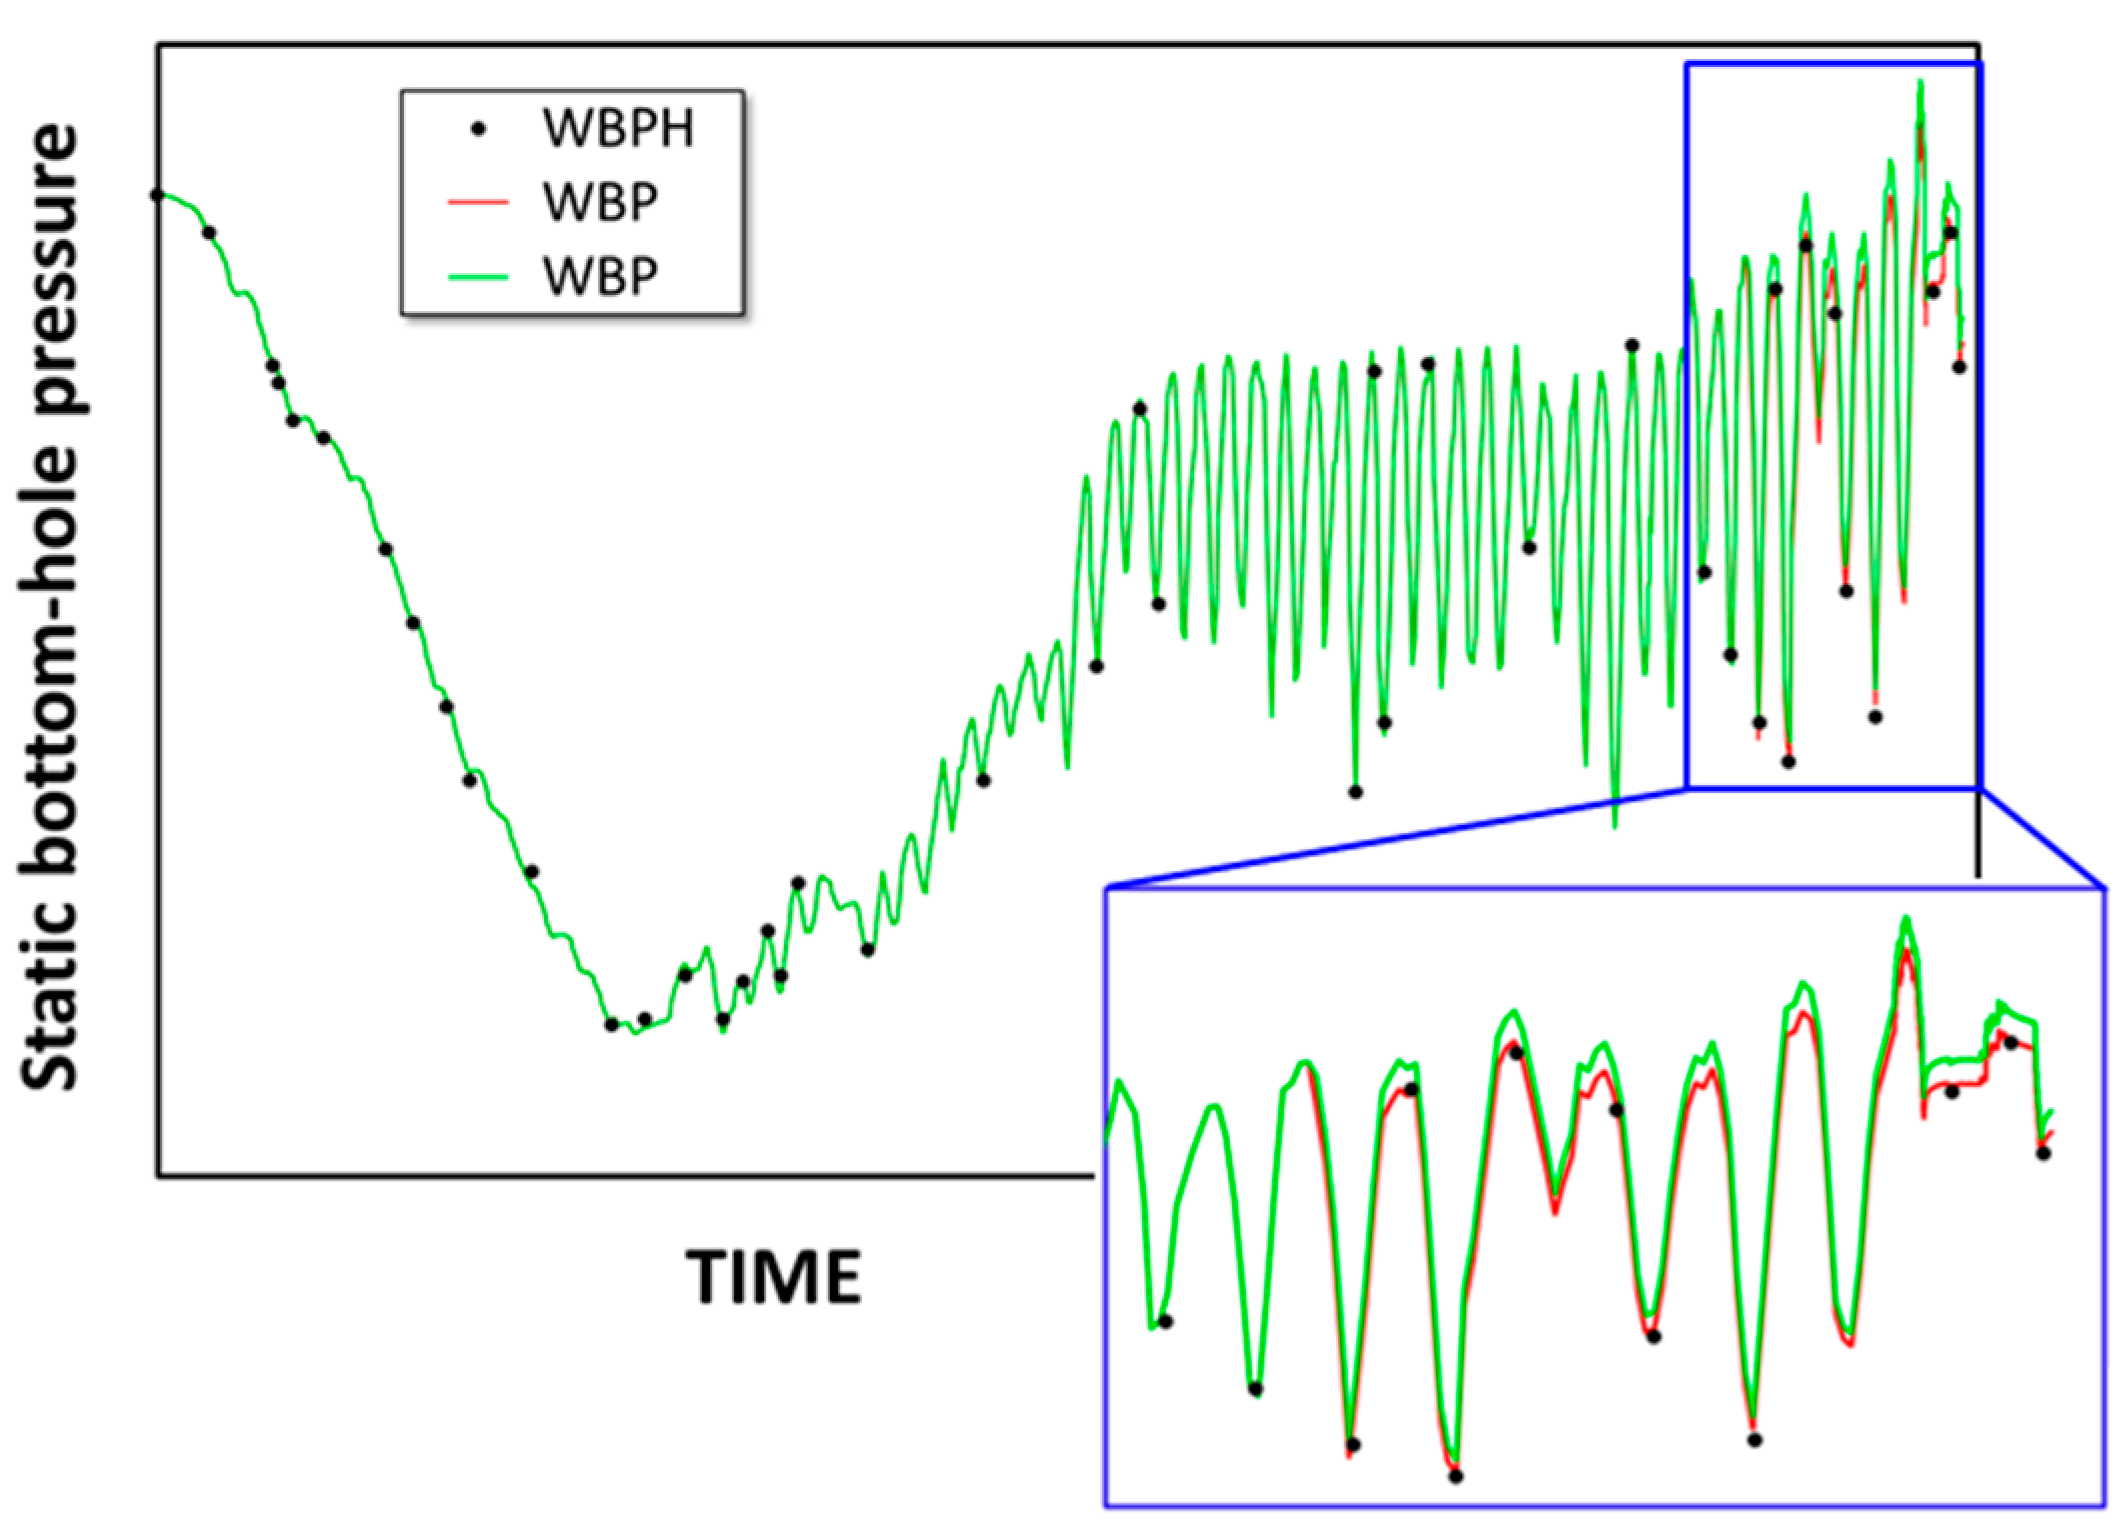
The chemical composition of the stored gas can differ significantly from the original reservoir gas. The composition of the gas injected during each summer season depends on commercial opportunities and market availability and it may even vary during one single injection cycle. Usually, the methane (CH4) percentage ranges from 85% to 90%, but the fractions of the heavier components can vary as well. Obviously, composition variations affect the gas PVT (Pressure-Volume-Temperature) behavior (Figure 5) as a function of pressure and, ultimately, the dynamics of the system because pore pressure is intrinsically connected with gas compressibility which, in turn, is a function of gas composition (Figure 6).
Compositional models could be adopted to accurately simulate the effects induced by gas composition modifications. However, in the author’s experience, compositional models and the complexity they entail are not required. A step-change variation of the gas composition and its properties (namely, the formation volume factor FVF) between primary production and storage phase is generally sufficient to account for the gas compressibility variation during the field life.
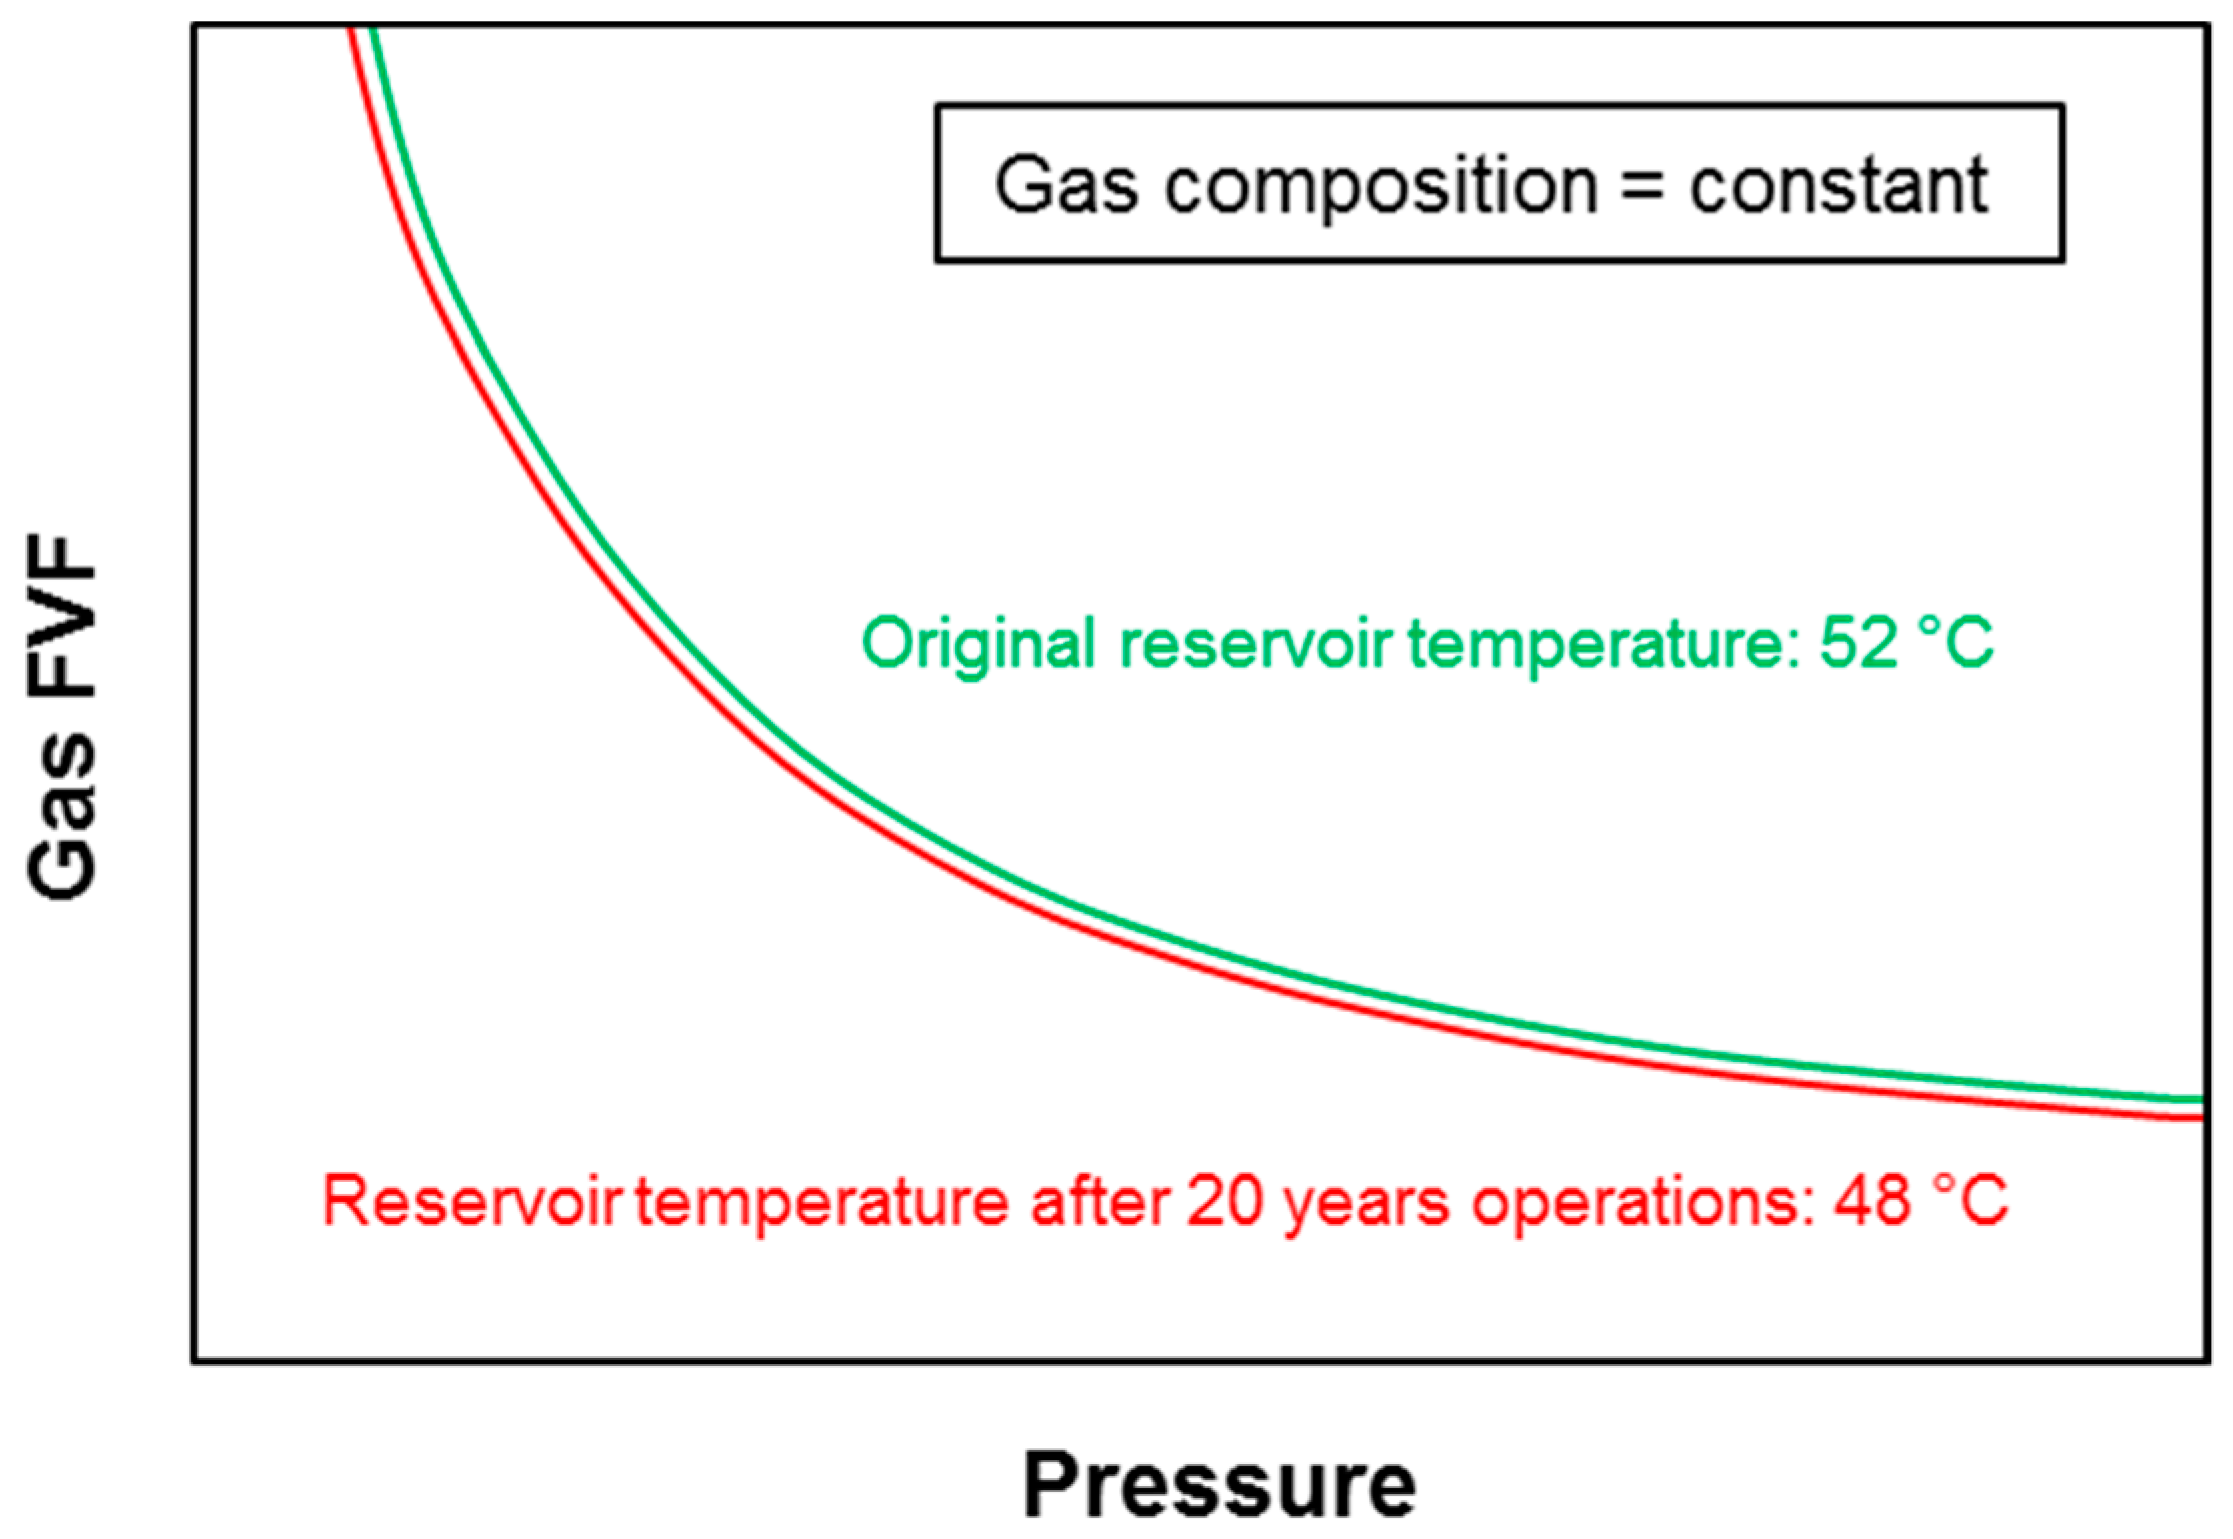
Furthermore, it is well known that gas PVT parameters are also a function of thermodynamic conditions. In conventional reservoirs temperature depends on the local geothermal gradient and all the processes taking place in the reservoir are assumed to be isothermal. In such cases, thermal effects only affect the pressure drops in the wellbore between downhole and the wellhead when the gas flows to the surface. Conversely, in gas storage, temperature variations can have a significant influence on the dynamic behavior of the reservoir. The author’s experience is that UGS are usually subject to a gradual cooling over time due to repeated injection of relatively cold gas: the decrease in temperature may be of 1–2 Celsius degrees over 10 years of storage activity.
The dynamics of the system is affected by temperature variations because pore pressure depends on gas compressibility which, in turn, is a function of temperature. Figure 7 shows the gas formation volume factor FVF as a function of pressure for two different reservoir pressure values; Figure 8 demonstrate that the reservoir temperature affects the simulated bottomhole pressure. However, in the author’s experience, thermal models are not required because, whilst the temperature variations are not negligible, their effects can instead be accounted for by modifying the gas PVT properties over time in the dynamic simulation.
Even if both gas composition and temperature variations have a limited impact on the storage pressure response, the combined effect can be relevant (up to a few bars) and therefore cannot be ignored. This is especially true when, as is often the case, constraints on the maximum operating reservoir pressure are set by the authorities.
3.3. Reservoir Heterogeneity
The effect of reservoir heterogeneities on the system’s dynamic response during gas storage is typically much more significant than during primary production. This is because the typical seasonal sequence of gas withdrawal in winter and injection in summer creates a single cycle during which the average pressure variation equals or exceeds that experienced by the reservoir during its entire primary production life. Recently, following changes in the gas market mainly in the use of gas for power generation and industry, there has been a trend towards more flexible periods of injection and withdrawal with shorter and more frequent changes. As a consequence, the reservoir pressure-dependent phenomena (such as the aquifer response or the hydraulic communications between compartments) become even more predominant in the determination of the storage response. If a tight injection/withdrawal schedule is implemented, the reservoir system has a limited time to respond and the dynamic behavior can be severely affected by local geological features. If the time for pressure equilibration is not long enough, the presence of faults or heterogeneities with limited transmissibility can cause the creation of several pseudo-compartments in the reservoir, which tend to respond as independent units despite being in hydraulic communication.
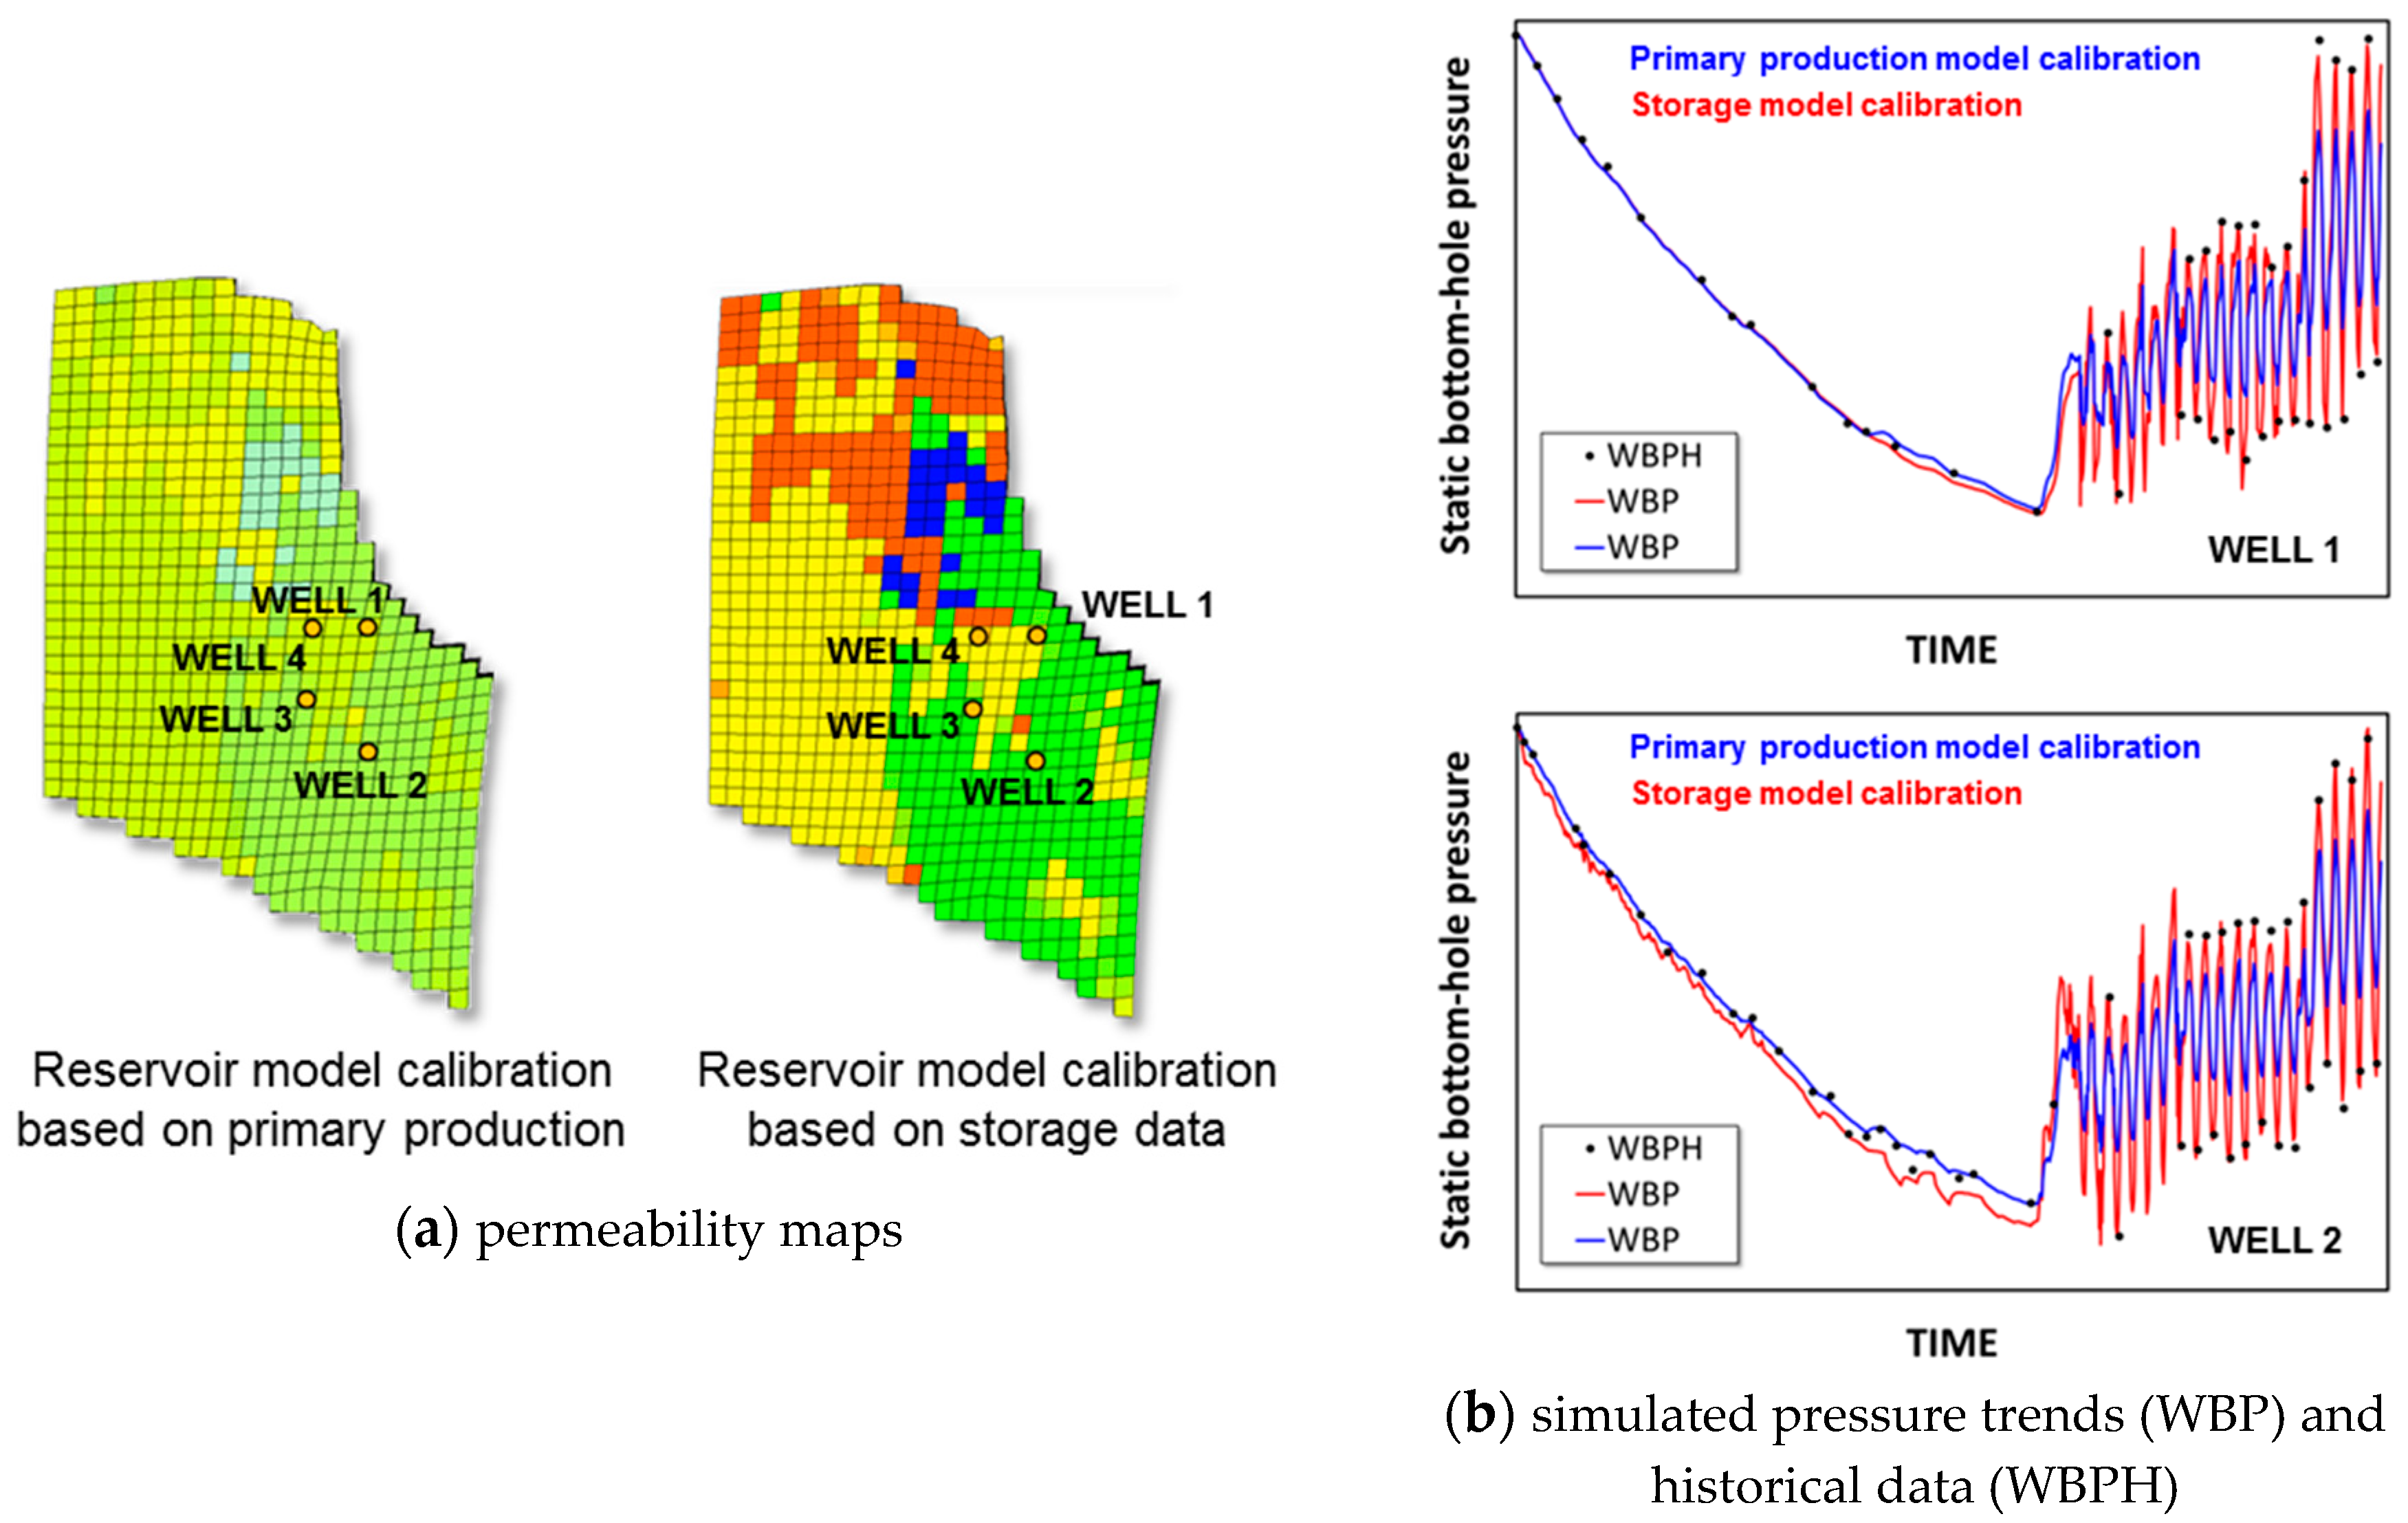
The model calibrated on the previous primary production phase often fails to predict the preferential flow paths of the gas during storage activities and this reflects on the simulated maximum and minimum well pressures. Thus, it is quite common that a new history is required to capture the dynamic behavior of the reservoir during storage. Figure 9 shows an example where a reservoir model which satisfactorily matched the pressure data during primary production had to be recalibrated to match the pressure data collected during the storage phase.
3.4. Hysteresis
Relative permeabilities are one of the key descriptors in classical formulations of multiphase flow in porous media. Experimental evidence and analysis of pore-scale physics demonstrate conclusively that relative permeabilities are not only functions of fluid saturations and that they display strong irreversible hysteresis effects [58] (and references therein). Generally, different relative permeability curves are obtained if the direction of flow changes. This is the case of any gas storage with water drive where, following the alternation of withdrawal and injection periods and the consequent movement of the aquifer, the direction of saturation reverses repeatedly. Because the reservoir pressure may vary considerably, the transition zone where significant saturation changes occur can be quite large. During the withdrawal phase, the wetting fluid (water) displaces the non-wetting fluid (gas) in an imbibition-like process; this leads to the disconnection of the once continuous gas phase into bubbles which remain trapped behind the advancing water front. During the injection period, the non-wetting phase (gas) displaces the wetting phase (water) in a drainage-like process and the relative permeability to gas assumes a different shape. Capillary pressure also exhibits hysteresis and hence the saturation changes will also affect the capillary rise in the transition zone.
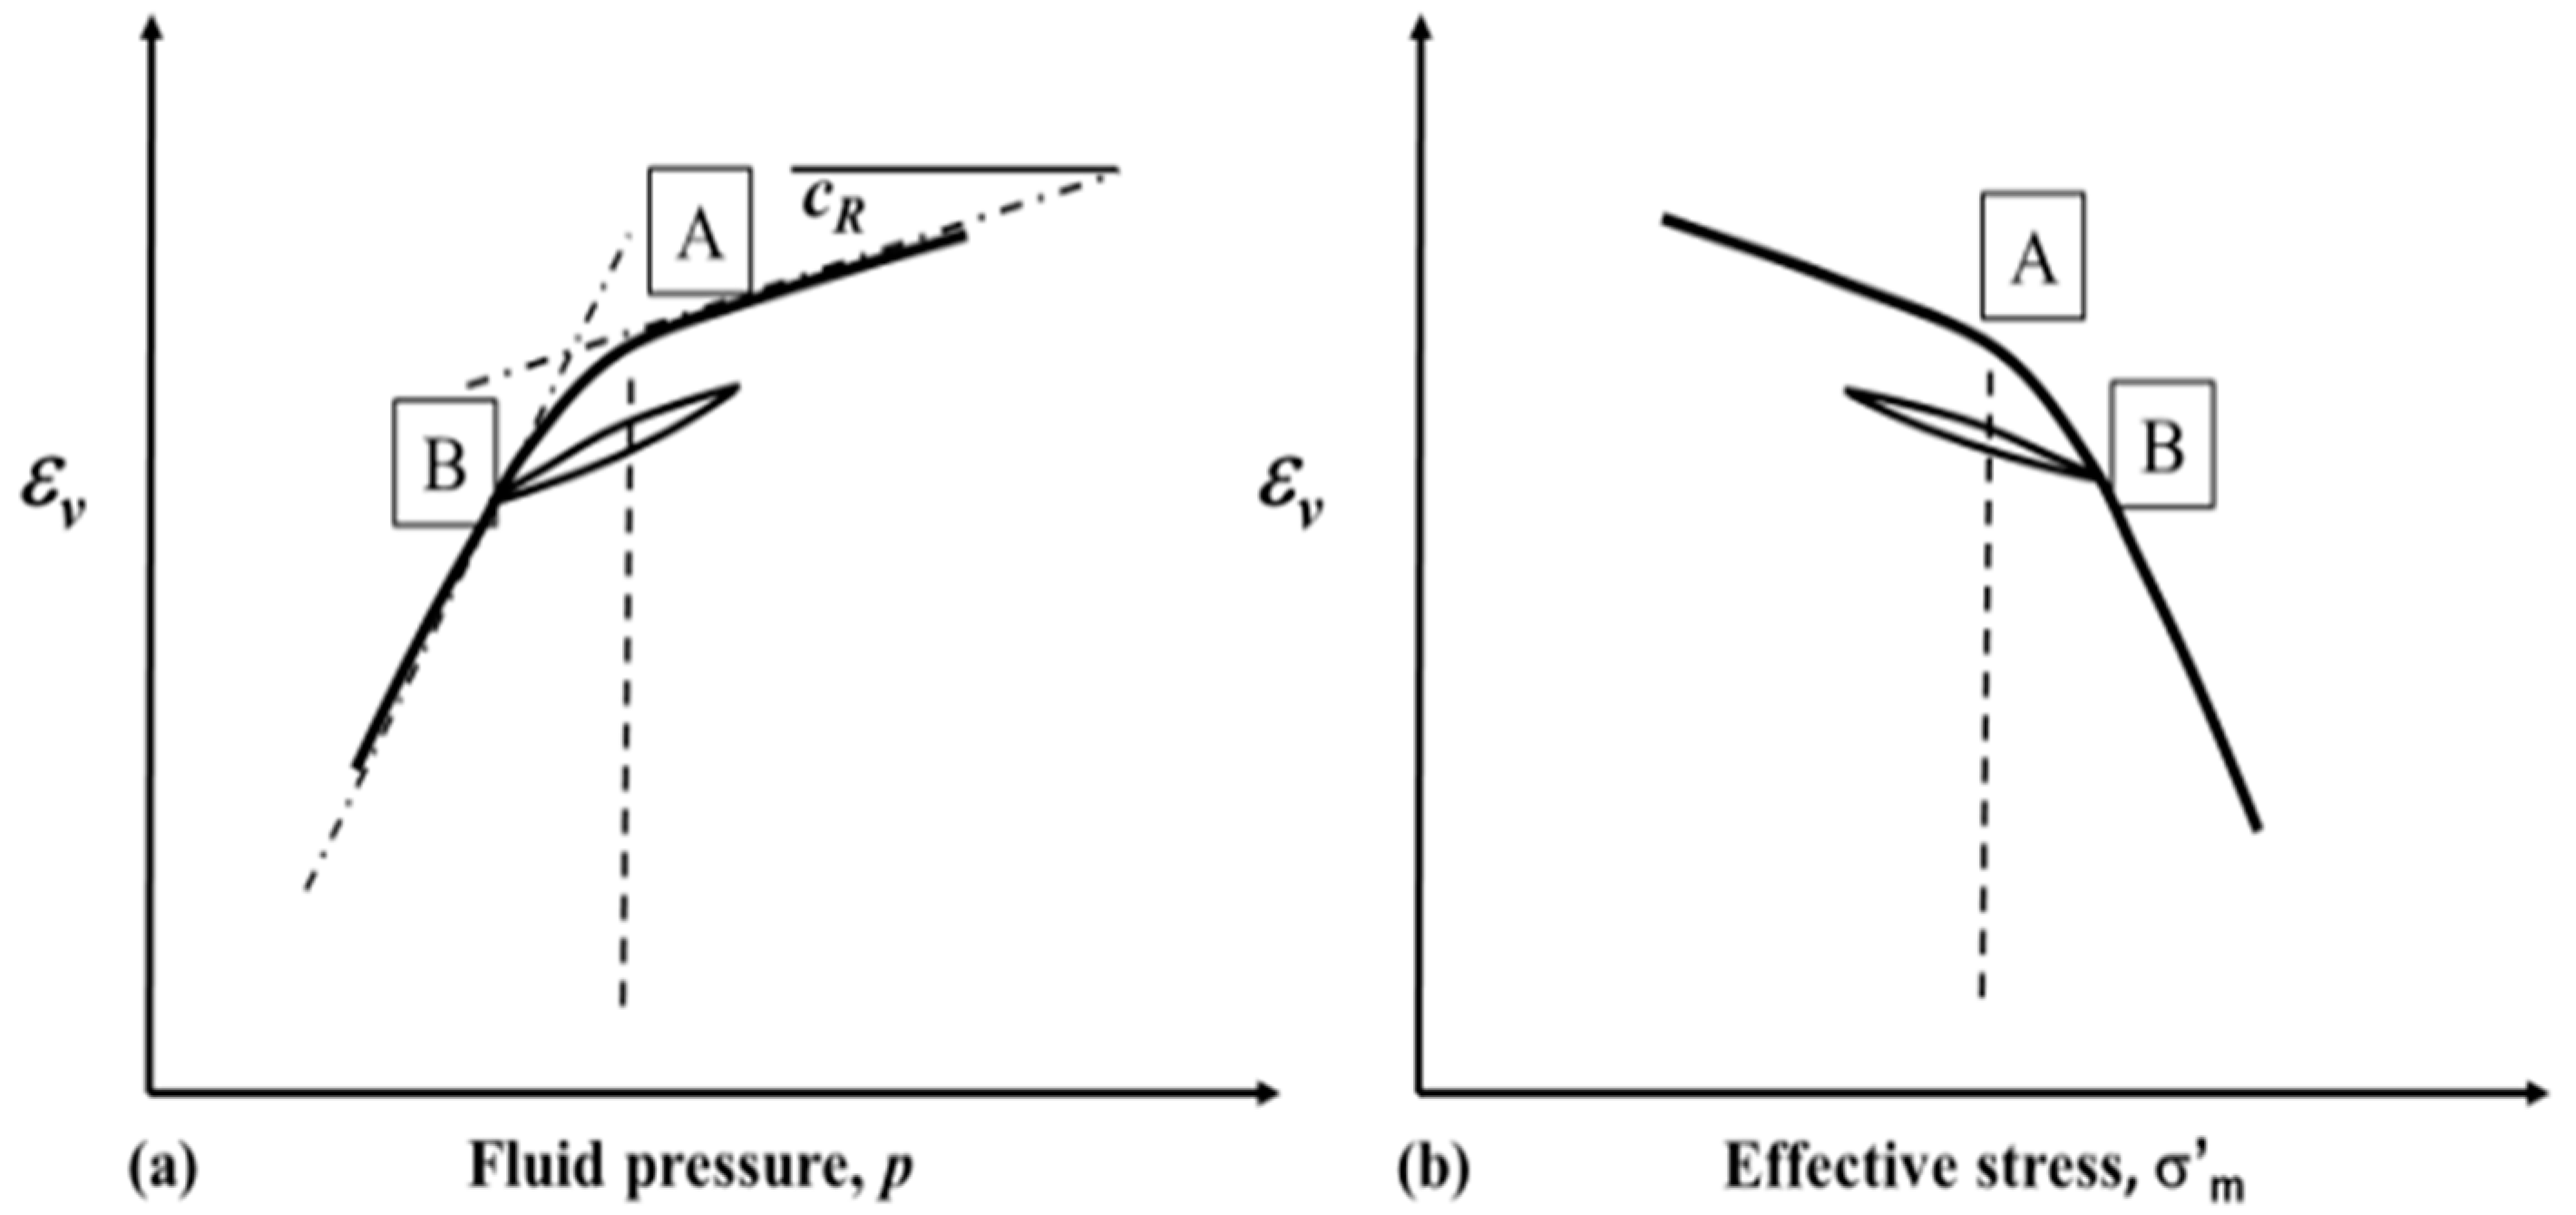
During primary production, all reservoirs undergo a certain degree of deformation. Standard reservoir models generally account for formation compaction through rock compressibility, assumed to be constant or variable with pressure. This simplification is acceptable in the case of hydrocarbon production from medium to well consolidated formations because the monotonic elastic compression and/or compaction induced by pore pressure decline is roughly linear. In storage fields, repeated gas withdrawal and injection generate a sequence of loading-unloading cycles in both the sandy permeable formation and in the confining clayey caprock [59]. In a volumetric deformation (εv) diagram vs effective stress (Figure 10), the effective stress increment due to primary production causes elastic rock deformation; however, when the effective stress exceeds the preconsolidation stress (point A) plastic deformation occurs, generating an irreversible reduction of porosity (compaction) and permeability, and the curve slope increases. The elastic deformation before the onset of compaction can be approximated by conventional rock compressibility, . When the rock is unloaded (due to fluid injection), the volume rebound is not as large as the compaction was, and it is often close to the elastic response [60]. A new reloading of the material due to fluid production initially causes a quasi-elastic response until the previous effective stress is reached (point B); then the material follows again the plastic-failure line [61]. This type of hysteresis is usually displayed by rocks experiencing cyclical storage operations: when the effective stress decreases due to fluid injection, the unloaded material is less compressible compared to when it was loaded over the same stress interval. Additionally, the unloaded material is less compressible also during subsequent reloading to the original stress conditions.
Despite the typical lack of laboratory data allowing a thorough description of the hystereses described before, it is often necessary to account for it in the reservoir model so as to predict the correct reservoir dynamic response over time.
3.5. Injection Strategy
If an active aquifer bounding the reservoir is present, reservoir depletion can be associated with significant water encroachment which, in turn, causes a reduction of the pore volume available for gas. This phenomenon can be partly reversed and the gas-water contact pushed back during gas injection, but much depends on the injection strategy: the longer the storage is maintained at low pressure, the more significant the water flooding and the smaller the storage volume. Due to the compressibility and mobility contrast between gas and water, gas injection initially causes a pressure increase in the gas-saturated portion of the reservoir and only afterwards will water displacement occur. In order to preserve the storage volume, after any withdrawal period is concluded, pressure should be restored as soon as possible (via gas injection) so as to offset the tendency of the aquifer to invade the reservoir.
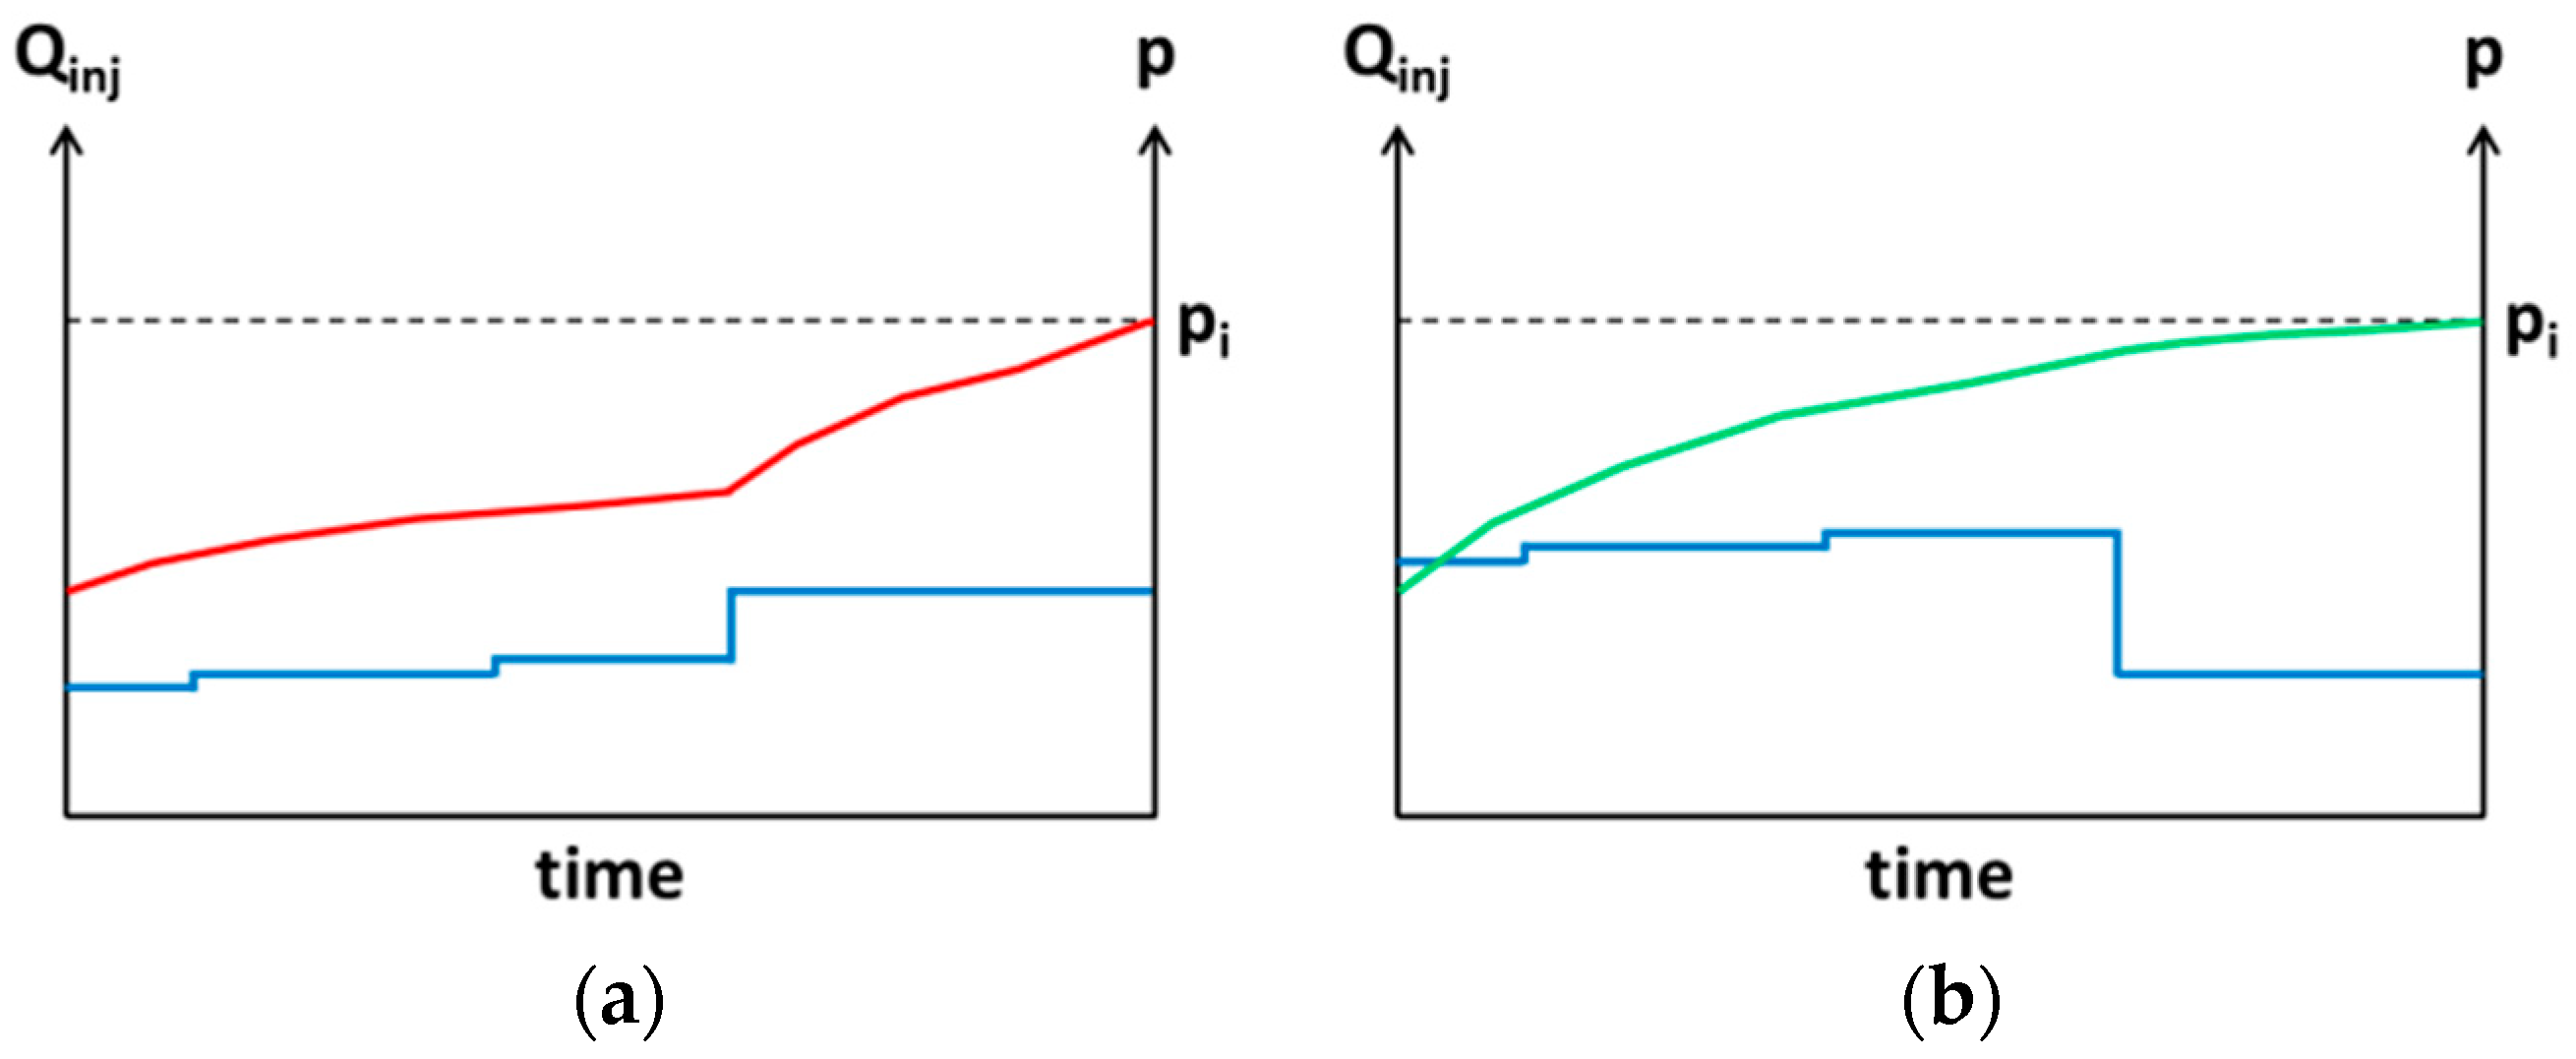
Should the aquifer be given time to advance in the reservoir a higher pressure would be needed to displace the water and accommodate the same amount of gas because of the lower water mobility compared to that of gas. If constraints exist on the maximum injection pressure due to well completion (mechanical resistance), compressor capacity, or regulations (typically, that the initial formation pressure should not be exceeded), then the volume of gas in the storage at the end of the injection phase might be significantly lower. Figure 11 shows how an initially low gas injection rate will lead to a smaller stored volume (a) compared to the case where an initially high gas rate is injected (b) if a constraint on the maximum reservoir pressure is set (i.e., the initial pressure in this example).
Therefore, although the gas injection strategy is often dictated by gas availability on the market rather than by technical considerations, an attempt should be made to meet the ideal injection strategy to maximise working gas. In any case it should be acknowledged that in water drive fields working gas is not a fixed volume and does vary depending on how the storage is operated.
To increase working gas and also enhance the storage performance delta-pressuring has shown large economic benefits to the storage industry and has proven to be particularly favourable in the presence of an active aquifer because it helps keep or restore the pore volume available to gas. However, delta-pressuring requires additional design and monitoring activities when compared to a conventionally operated facility for ensuring long-term feasibility of the project. Existence of safety conditions must be assessed before and during delta-pressuring a UGS, the main issues being the absence of leakage through the caprock, the geomechanical integrity of both the reservoir and the caprock, the mechanical integrity of the wells, potential lateral gas spills, and the reactivation of existing faults, if any, under the alternating injection and withdrawal cycles over the entire life of the storage.
3.6. UGS System Management
A different philosophy rules over field exploitation during gas storage operations, with different constraints and following a different (and variable) schedule when compared to the conventional primary production phase. Therefore, if the reservoir is drained and filled unevenly due to local heterogeneities hindering gas flows through the reservoir and/or an active aquifer is present, the well number and location and the production/injection schedule become predominant issues to maximize the storage efficiency.
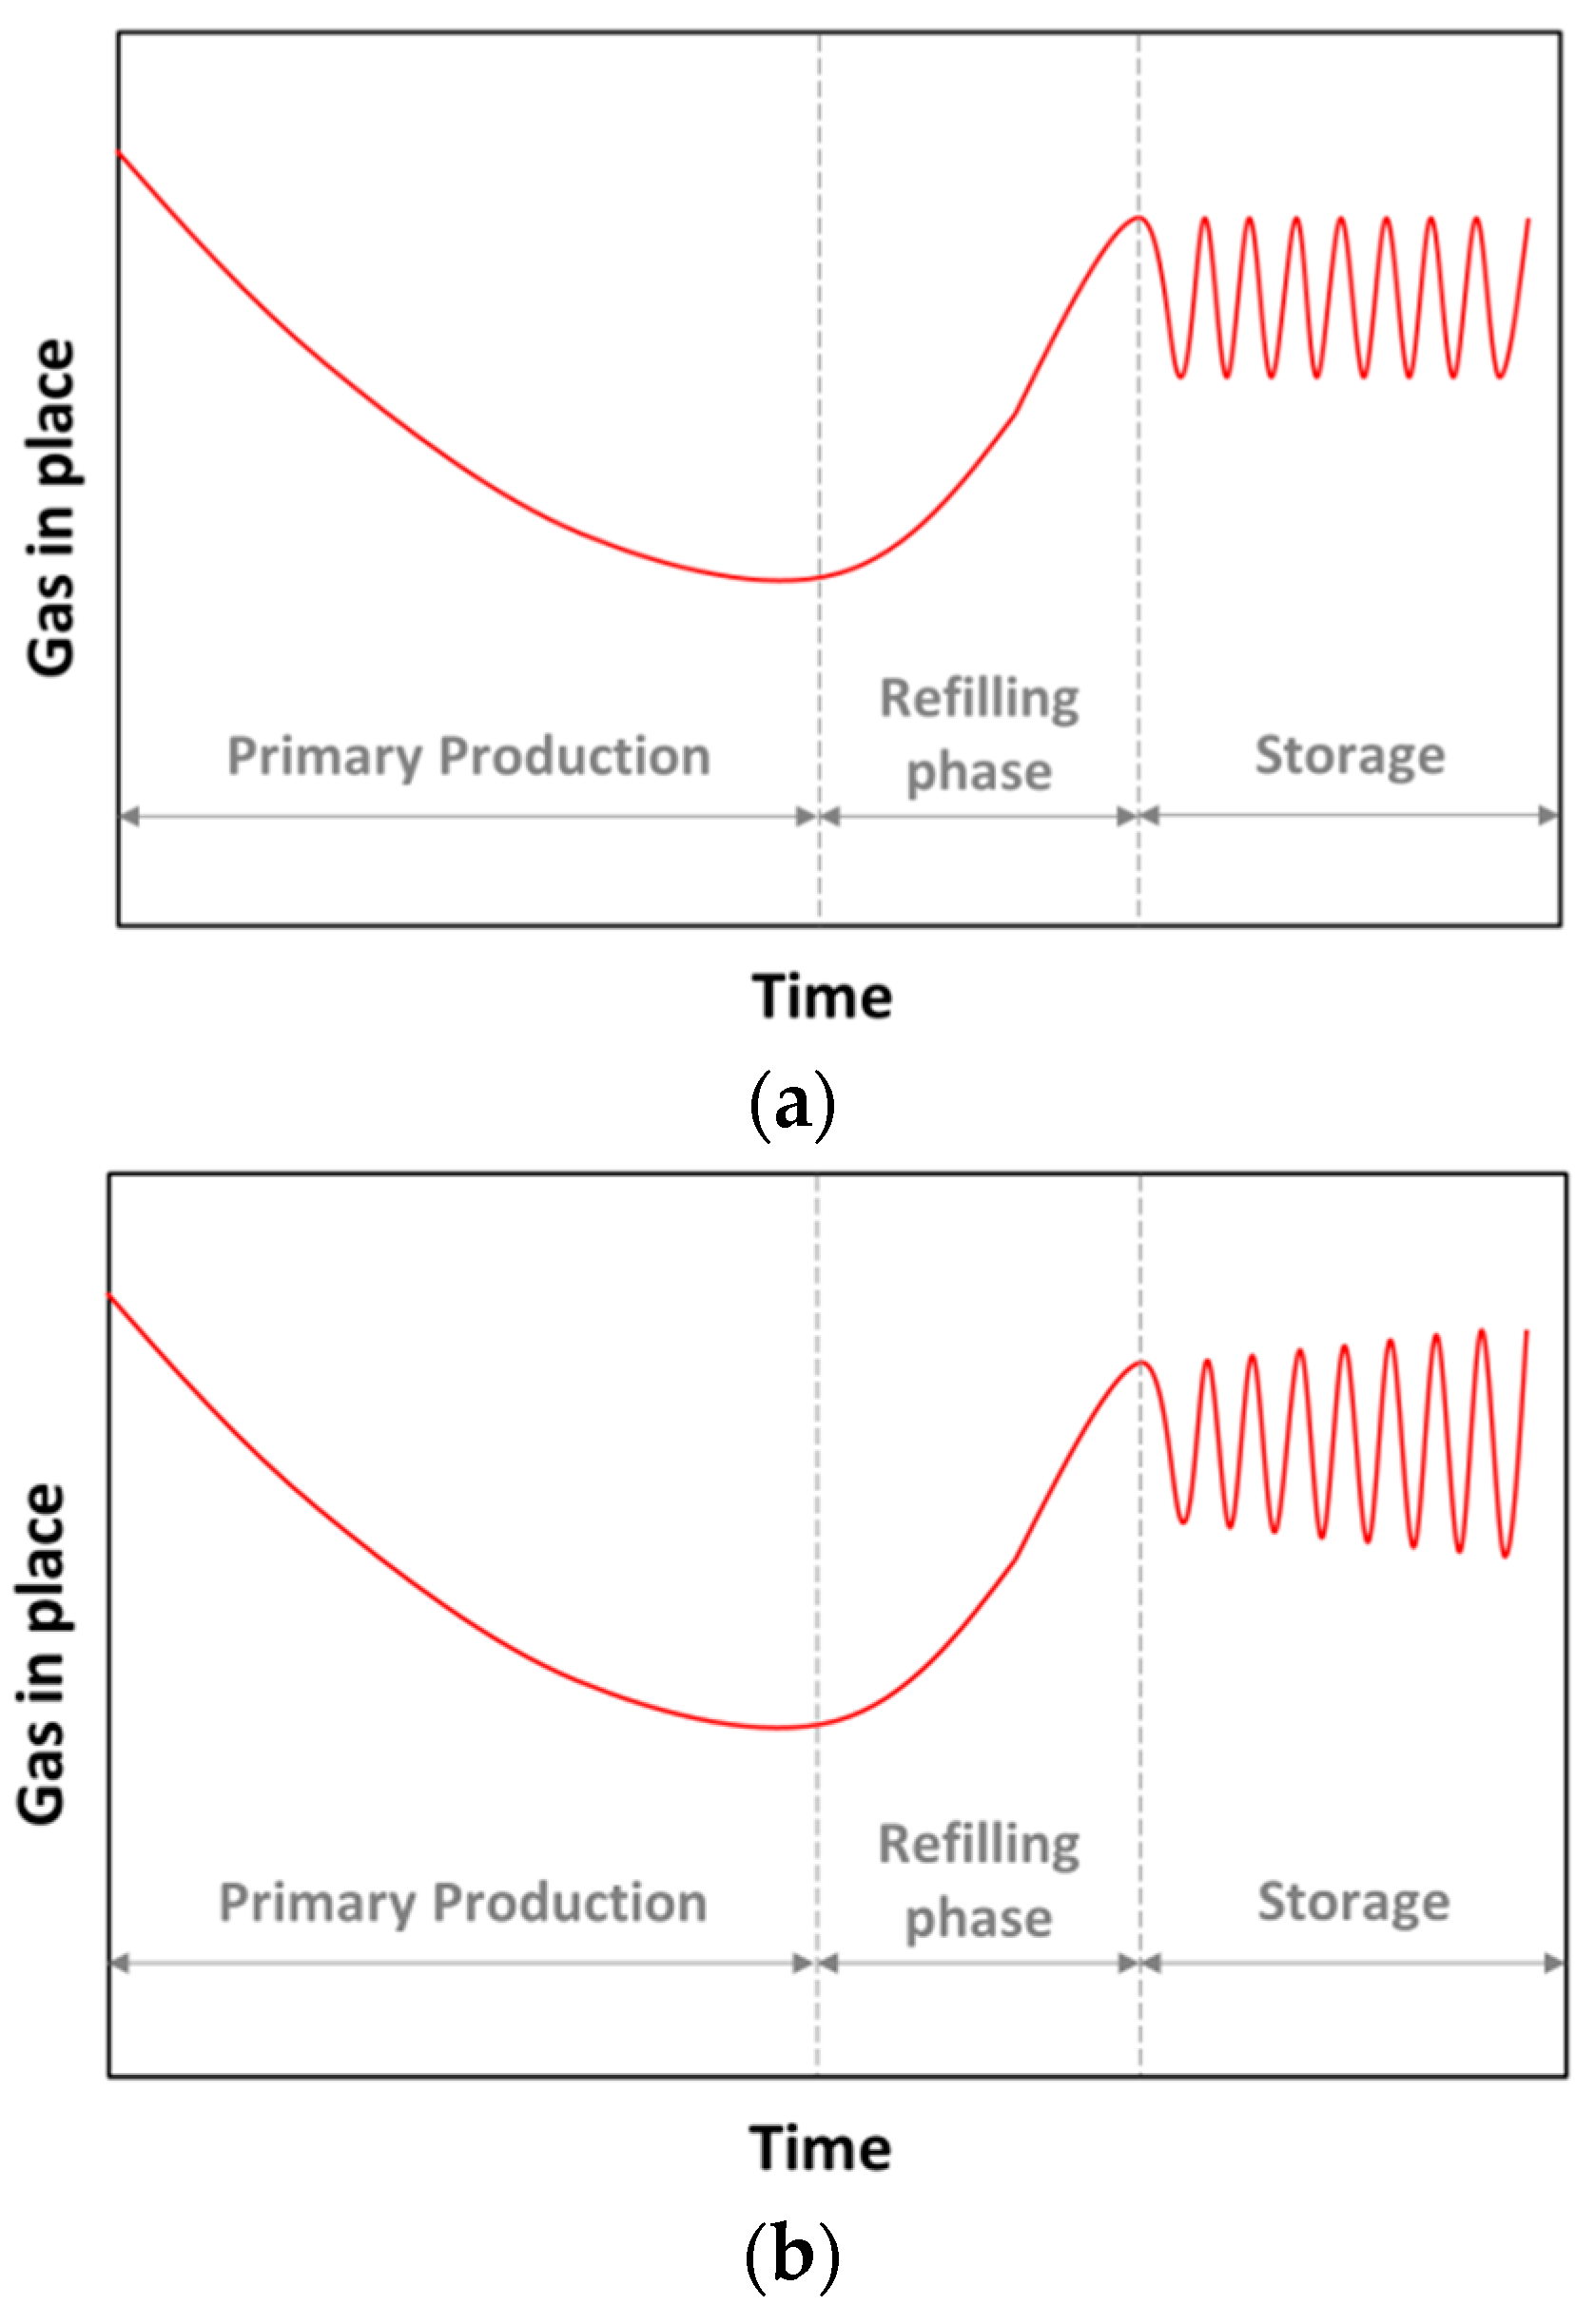
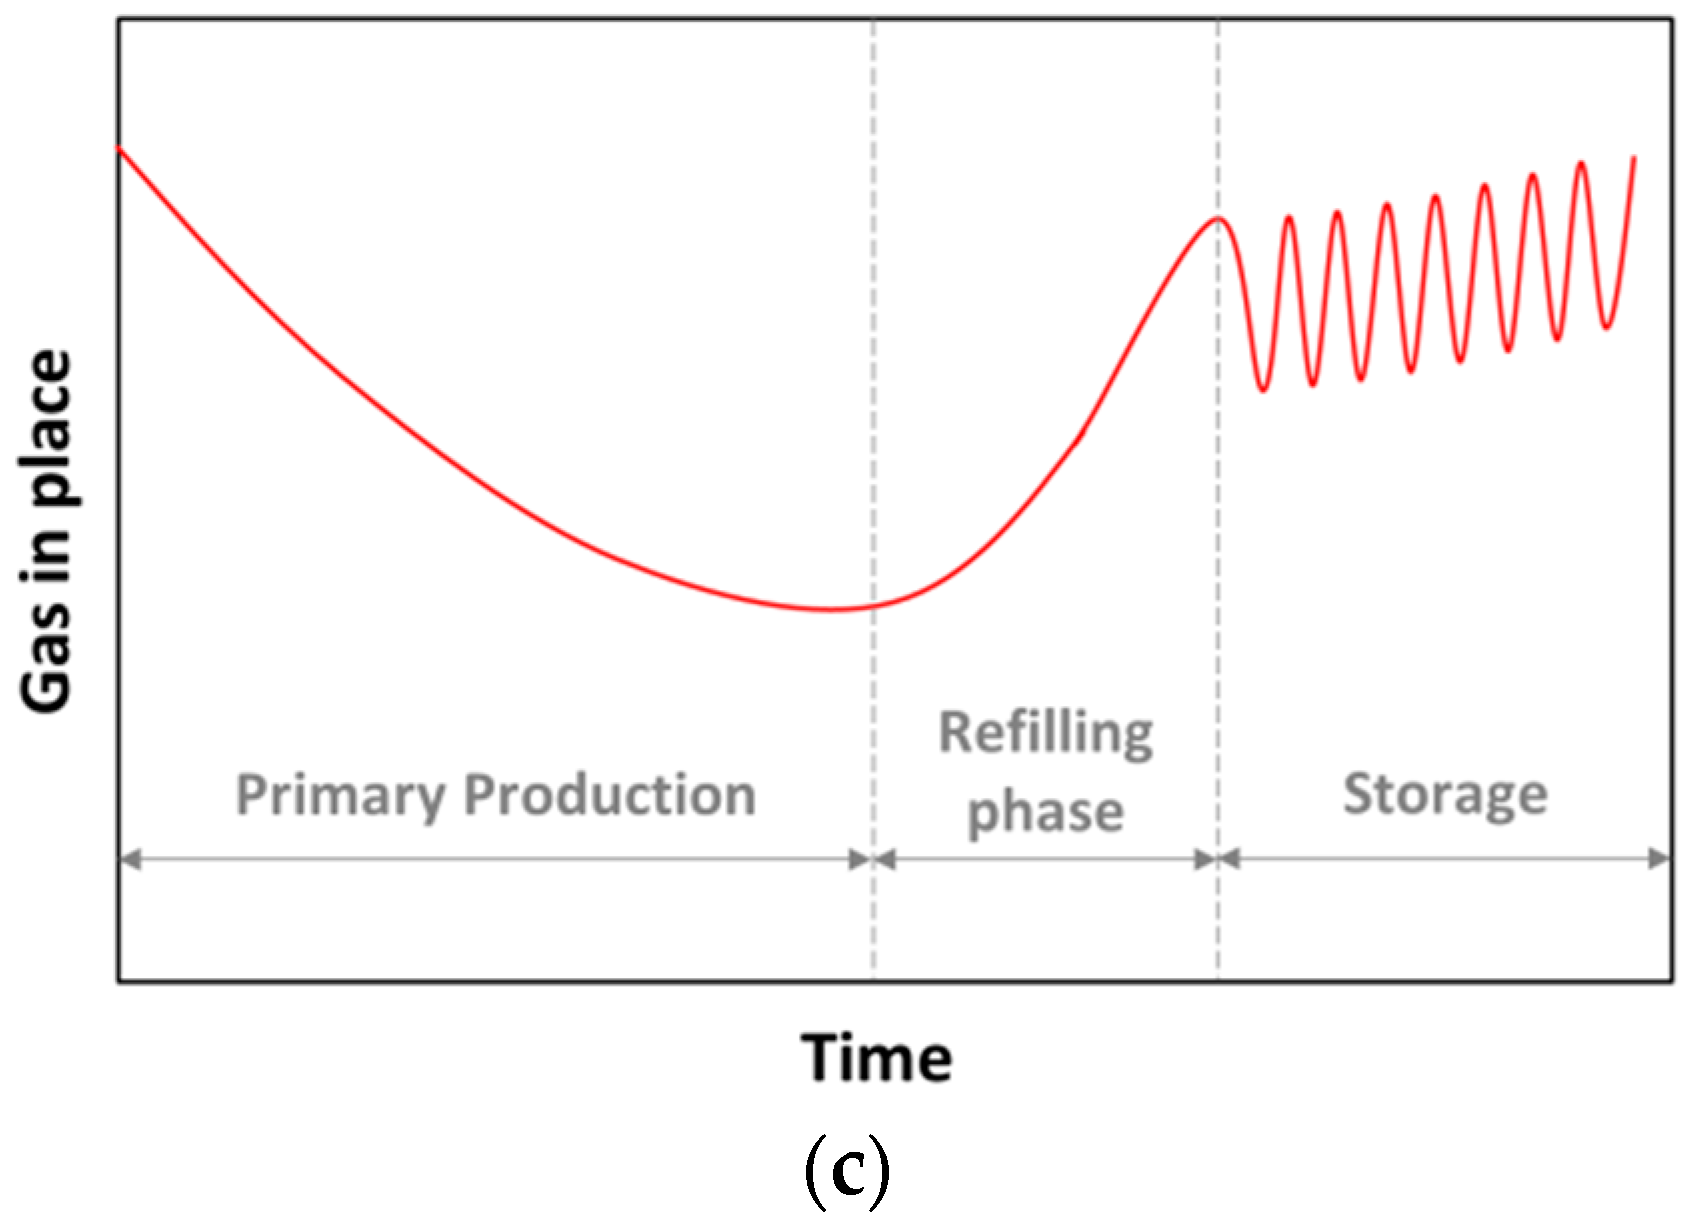
Ideally, the withdrawal/injection strategy should be defined based on the reservoir characteristics to ensure the efficiency of the storage. However, typically commercial needs steer the withdrawal and injection strategy without full attention being paid to reservoir issues and thus compromising the long-term performance of the storage. Therefore, it is recommended to fully couple the commercial model with the technical model when designing a gas storage management plan. It is also good practice to forecast the storage behavior for at least ten operational cycles so as to assess that the working gas is stable (i.e., remains constant) and balanced (withdrawal and injection volumes keep the same) over time (Figure 12).
4. Geomechanical Modeling
Geomechanical models are usually not implemented in conventional reservoir engineering, except for cases of stress-sensitive formations where the strong nonlinear dependency of porosity and permeability on effective stress must be accounted for. Conversely, a multi-disciplinary model capable of reproducing the mutual effects of fluid flow and deformation processes can be extremely useful for simulating gas storage behavior under different operational strategies and assessing safety conditions, especially if over-pressure conditions are foreseen [62,63,64]. Commercial software can be used for this scope.
The mechanical and dynamic consequences of stress changes due to production and injection operations could jeopardize the containment capability of a UGS in terms of caprock integrity and fault (re)activation. Rock deformations induced in the reservoir can propagate to surface which may result in subsidence; in case of storage activities, seasonal injection and withdrawal operations cause cyclical movements of the ground surface, i.e., subsidence and rebound. Safety analysis of a UGS should thus include the development of a reliable geomechanical model to assess the magnitude of these phenomena, not to mention that in many countries these analyses are required to comply with national regulations and to gain social acceptance of any new projects.
Mechanical analysis can be developed at different scales and levels of integration with other disciplines involved in a UGS study. Simplified analytical approaches can be of great support to provide a rough, immediate and inexpensive estimate of particular effects. Specific issues (such as well integrity) can be dealt with by modeling only a limited portion of the whole system. Yet the safety assessment of the whole system, particularly the investigation of the induced ground movements, require the definition of a full 3D numerical model extended over a regional scale to evaluate the production/storage operation effects on not only the reservoir but also the surrounding formations.
4.1. Fluid-Flow and Geomechanical Coupling
A rigorous system analysis should account for the appropriate dependencies between multiphase flow and stress-strain processes considering that dynamic and mechanic couplings physically exist to some extent in all reservoirs. However, numerical modeling of coupled processes is extremely complex. From Biot’s theory of multiphase flow in deformable porous media, the integrated approach has evolved to the current fully coupled fluid-flow-geomechanical modeling method, where all the relevant aspects are incorporated into one comprehensive model to investigate not only single phenomena but also their mutual interactions. This integrated fluid-flow and stress/strain approach represents the best solution for evaluating the sealing capacity of the caprock, the mechanical integrity of both the reservoir and the caprock and the reactivation of existing faults according to different storage scenarios—including delta-pressuring. The key concept of coupled processes is based on Terzaghi’s principle which states that all quantifiable changes in stress to a soil (compression, deformation, shear resistance) are a direct result of a change in effective stress. A change in fluid pressure will change the effective stresses and cause the reservoir and the surrounding rocks to deform. Nonetheless, the pressure field is also by itself a function of the deformations and, hence, the coupling [60,64].
4.2. Geological Modeling at a Regional Scale
In geological modeling, the domain of investigation usually includes the reservoir, its surrounding formations and the overburden to surface (Figure 13). When a depleted field is converted into UGS, numerical static (geological) and dynamic (fluid-flow) reservoir models have already been generated. But they tend to focus on the scale of the phenomena under investigation (i.e., the reservoir which contains the hydrocarbon bearing formations) and seldom include the neighboring formations or the aquifer. The extension of these existing models (and their associated grids) for a UGS study requires additional information about the regional geology to be gathered and integrated. The new dataset can include: interpretation of seismic surfaces, well data, geological maps and other geophysical data (e.g., results of seismic tomography) that allow the extension of the original geological horizons and sequence. Since well data is usually sparse in areas where the search for hydrocarbon was unsuccessful, the conceptual geological model and the information about the geological evolution of the region become of greater importance. If seismic data is not available and the construction of a seismic map is impossible, the structural model is extended at the regional scale using the available stratigraphic markers together with the geological maps or sections, outcrops and a conceptual regional depositional model.
A crucial point in the construction of an extended grid is the incorporation of faults. Because they can be subject to high pressure differences during withdrawal and injection operations, sealing or partially sealing faults can be critical to UGS safety. Thus, the fault system should be realistically reproduced in the geomechanical model.
4.3. Dynamic Modeling at a Regional Scale
The dynamic model of a UGS should include the caprock formation for performing safety analysis in case of delta-pressuring. As already discussed, gas leaking through the caprock could occur if a continuous flow path is established. Thus, gas penetration and consequent water displacement, which can be either reversible or irreversible following injection and withdrawal cycles, should be modeled; extensive theoretical support to correctly simulate the physics of the phenomenon is available in [65,66].
One of the main issues when setting-up the UGS dynamic model for geomechanical purposes is the way in which the aquifer is simulated. In a standard reservoir model, aquifer effects are usually simulated adopting analytical aquifers. This approach is extremely valuable for conventional reservoir studies because of the computational time-saving. However, when geomechanical analyses are to be performed volumetric aquifers are required because the extension of the pressure sink in the aquifer(s) surrounding the reservoir is fundamental to the analysis of the global stress/strain equilibrium.
4.4. Model Calibration
During the initialization phase, the original stress field and the initial pore pressure distribution of the undisturbed formations are determined as a function of depth, formation characteristics, fluids saturating the porous media and in situ field stresses.
The calibration process should be based not only on production data but also on information related to the stress/strain evolution recorded during production, such as surface subsidence measurements if available. To this end, the analysis of satellite ground images acquired over time (PSInSARTM (Trade Mark of Tele-Rilevamento Europa—T.R.E. s.r.l., Milan, Italy) methodology) can provide the pattern and magnitude of land displacement over the field [67] with very good precision (millimeter-scale movements of large zones can be monitored). Thus, the data assimilation process should include the petrophysical characteristics, the aquifer features, the geomechanical properties (e.g., the initial stress field, the elastic moduli and the fault strength parameters) until the reservoir historical behavior is matched with acceptable accuracy.
5. Monitoring
5.1. Surface Monitoring
Standard ground surface monitoring techniques provide information on a selected number of points within an area, both in the cases of geotechnical monitoring (clinometers, extensometers, distometers, etc.), GPS (Global Positioning System) or conventional topographic survey [68,69,70,71,72,73]. These conventional monitoring techniques are usually accurate measures of a limited set of benchmarks and require ground access.
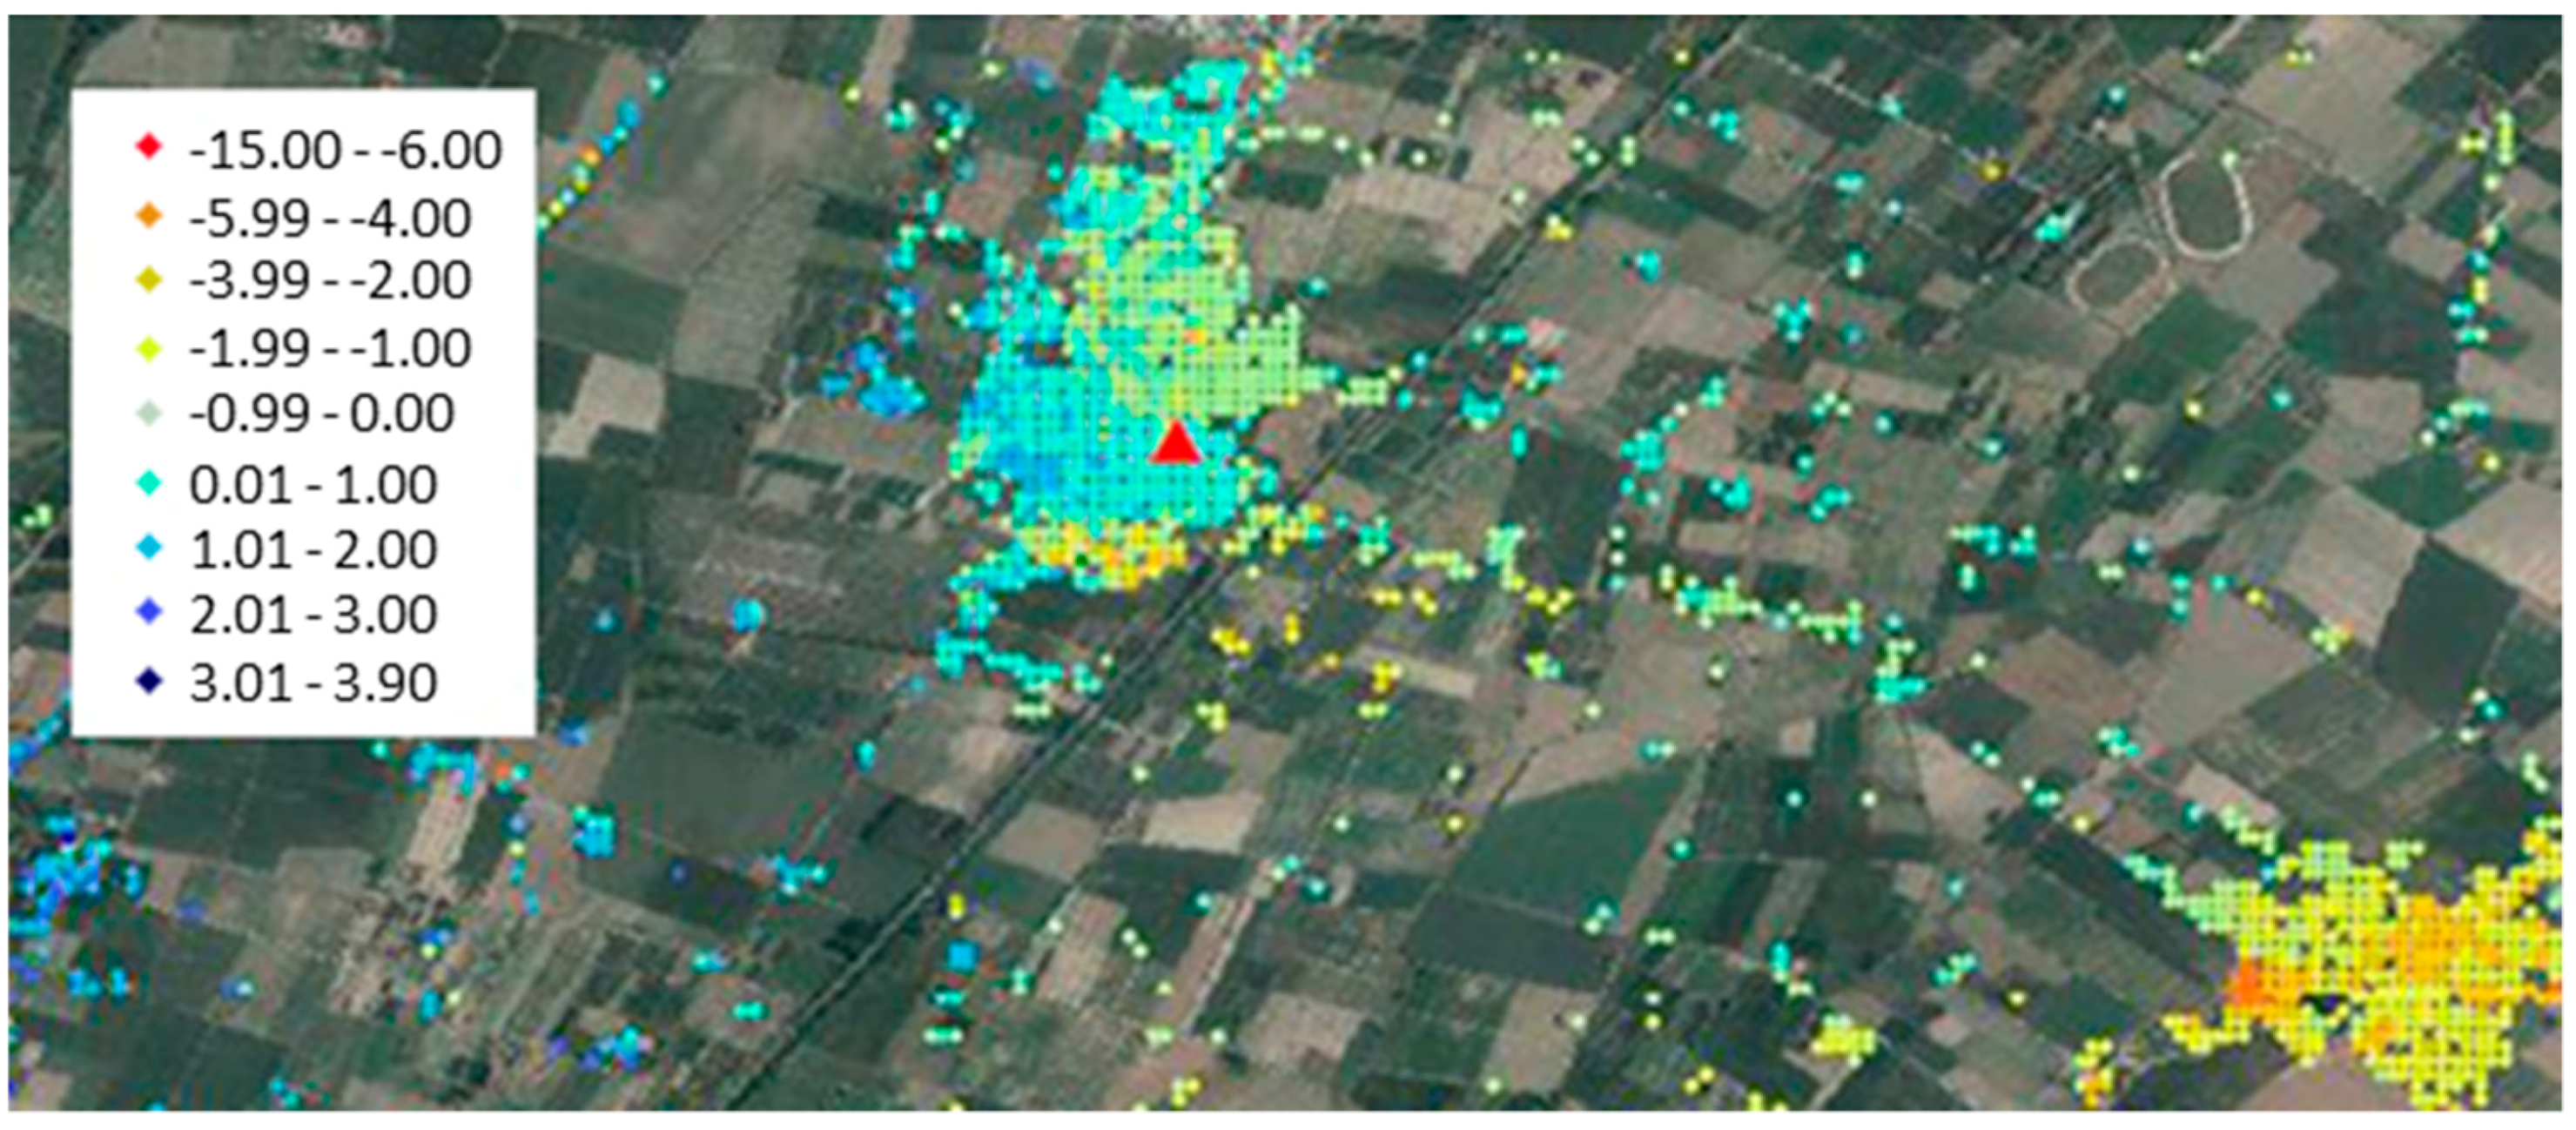
Over the last decades, Synthetic Aperture Radar (SAR) technology has demonstrated its potential in the assessment of ground surface displacement fields over wide areas [74,75,76,77,78]. SAR technology is based on data acquisition from remote sensing satellites and it can supply a deformation map of a ground portion without the necessity of positioning targets on the ground and without any physical contact with it [79]. According to different microwave imagining techniques, such as Interferometric (InSAR), Differential Interferometric (DInSAR), Permanent Scatterers (PS), time monitoring of ground surface deformation for large surface areas is made possible with a millimetric scale [80] (Figure 14).
5.2. Well Monitoring
For the purpose of evaluating the performance of a field and assessing gas inventory, regular measurements of static bottomhole pressures are taken. Static bottomhole pressure surveys are usually performed at the end of each withdrawal cycle and at the end of each injection cycle. Bottomhole static surveys are typically executed on rotation in different wells, which also serve the scope of assessing reservoir connectivity. Some storage wells can also be equipped with permanent downhole gauges for a continuous monitoring of bottomhole conditions.
Observation wells are typically used to monitor pressure and saturation changes in critical zones of the structure, such as saddles and spill points. RST logs for saturation monitoring are often recorded twice a year (with maximum and minimum gas volume) to verify the movement of the gas-water contact (GWC) and to ensure that it is not moving below spill point [9].
Telemetry is used for continuous monitoring of the well head pressures and gas rates and to check well performance evolution.
In order to ensure the mechanical integrity of the seal rocks it is recommended to measure the in situ stress in the reservoir and especially in the caprock several times during reservoir re-pressurization by performing a mini-frac test or an extended leak-off test. The strategy for safe injection should be adjusted accordingly [81].
5.3. Wellbore Integrity Monitoring
Efficient zonal isolation provided by the cement sheath placed between casing and wellbore is a primary requirement for UGS wells since they are subject to extreme stresses caused by high injection pressures and production rates over a longer lifetime with respect to producer wells. In addition, the caprock deformation induced by pressure variations is believed to act as a shear force between the pipe and the cement sheath and this may induce microcracks or microannulus over time [82]. The most common flaws identified in cement, causing loss of zonal isolation, are microannulus (i.e., a gap, in the order of microns, between the casing and cement sheath) and channelling (i.e., a void in the annulus, often due to off-centered pipe, leading to poor cement placement).
A correct assessment of cement distribution behind the production pipe is particularly important because the failure of the cement can lead to loss of zonal isolation, gas migration behind the casing and potential corrosion problems. Any of those conditions can lead to a costly repair job or even abandonment of the storage well since UGS fields are often strategically located close to large urban areas, where it is particularly important to have leak-free wells [9,83].
Wireline logging with sonic and ultrasonic tools is an efficient method that provides a detailed analysis of cement distribution and identification of discrete defects like channeling or microannulus. Remedial actions typically include the option of re-entering the wells to ensure integrity on a regular basis, or on a call basis if and when a problem arises.
5.4. Microseismic Monitoring
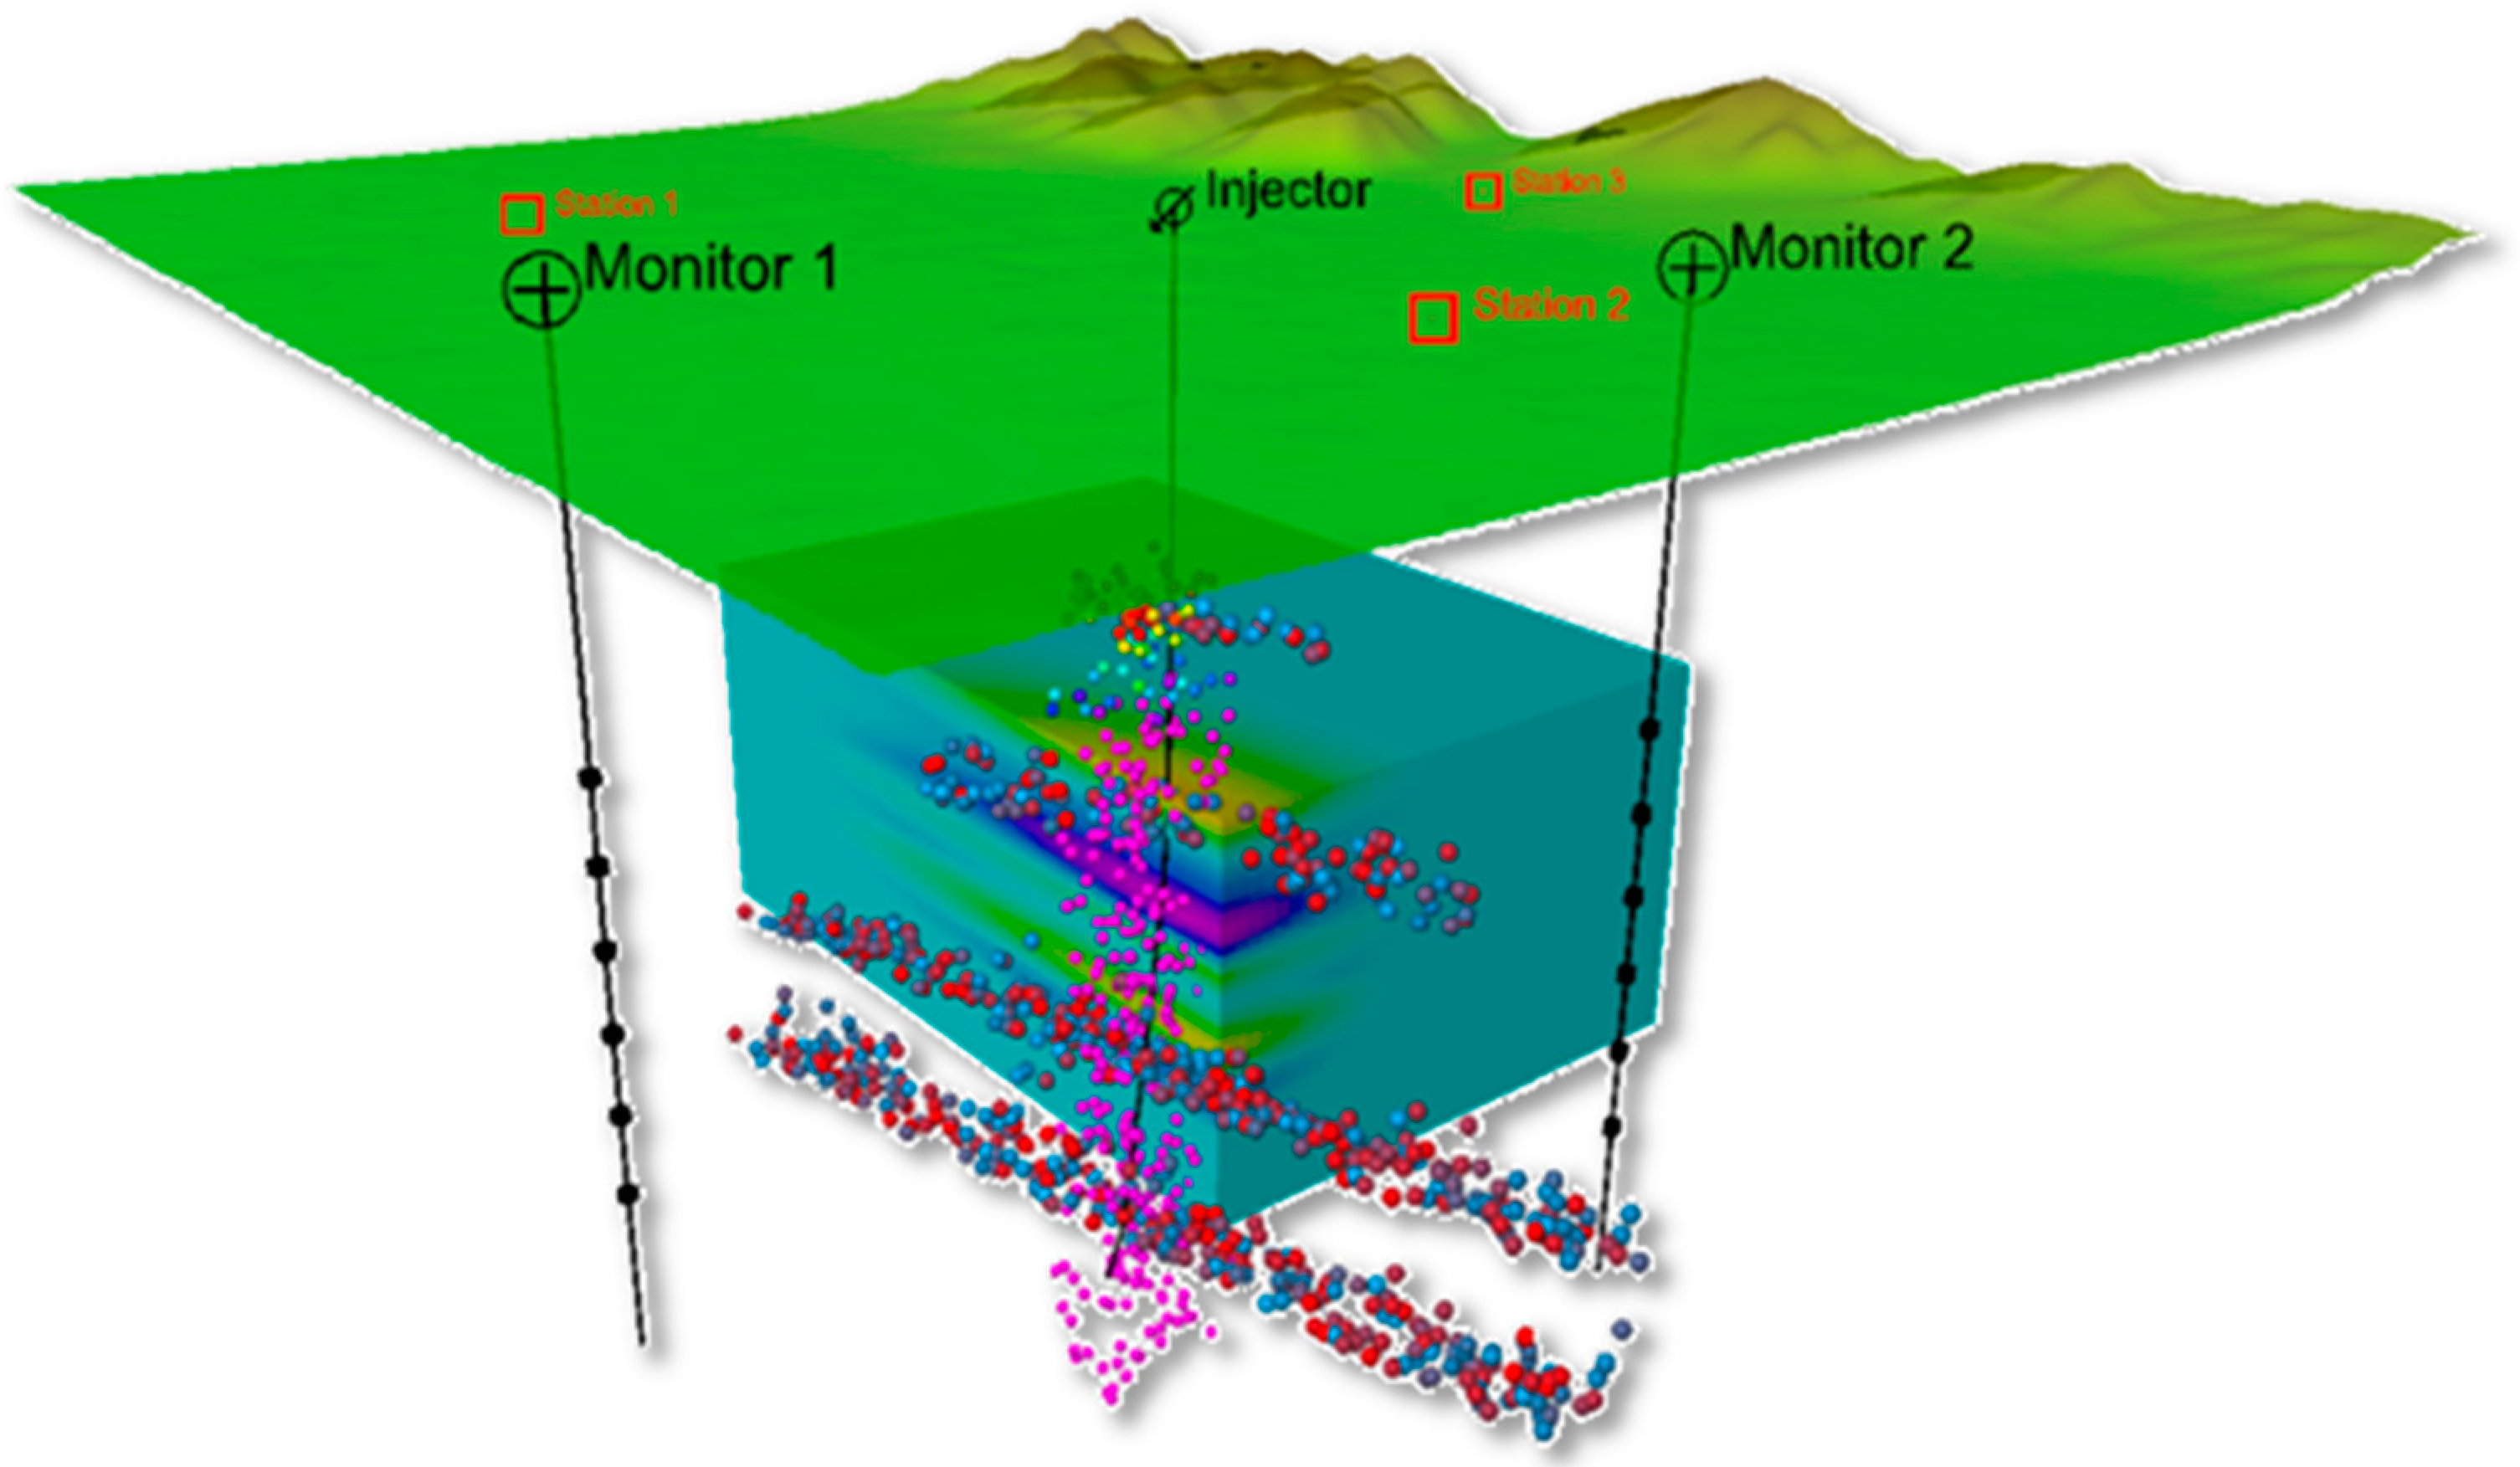
Passive seismic monitoring detects microseismic events induced in a reservoir by the modification of pore pressures or by the reactivation or creation of small fractures. These microearthquakes, with magnitudes in the order of −4 to 0 on the Richter scale [84] are picked up by static arrays of sensors installed inside wells or by small surface networks (Figure 15). Despite the small magnitude of the induced events, microseismicity can be very helpful to track pressure changes and, possibly, gas movements.
In general, the main advantage of using microseismic monitoring is its continuous nature. In other words, if a cause and effect link can be established between the appearance of microseismicity and the increase in pore pressure in the formation due to the flow of gas, then, theoretically, a real-time picture is provided of the passage of gas at certain specific points. It is also possible to characterize weakness zones in the formation (or its caprock), where pre-existing fractures or joints move in brittle shear and therefore constitute preferential flow paths [85].
6. Conclusions
Natural gas is typically stored in depleted or partially depleted reservoirs. Pressure is used to force the gas into and out of the rock. In spite of the fact that a significant level of knowledge is usually available for depleted reservoirs from the preceding exploration and primary production phases, underground gas storage design and management require specific technical expertise, especially to maximize performance and ensure long-term efficiency. It is the author’s belief that the body of knowledge that now exists and the skills that have been acquired are such that UGS studies may be considered a self-contained discipline.
Some of the main aspects to be accounted for are related to the change in gas composition, reservoir temperature and formation stresses due to the injection and withdrawal cycles. Moreover, awareness of the potential impact of reservoir heterogeneities and water encroachment on the gas storage strategy and thus on the well location and number must be gained to optimize the storage performance both in terms of working gas and deliverability.
Safety conditions must be assessed and adequate monitoring actions put in place over the entire life of the storage. This is particularly important when the storage is designed to operate at a maximum working pressure that exceeds the initial formation pressure (delta-pressure conditions)—a common option used to increase the working gas volume. The main issues to be addressed through an integrated fluid-flow and stress/strain approach are the absence of leakage through the caprock, the geomechanical integrity of both the reservoir and the caprock and the reactivation of existing faults, if any, under the alternating injection and withdrawal cycles.
Acknowledgments
The author would like to acknowledge the Petroleum Engineering Group of Politecnico di Torino for its valuable input on the topic presented in this paper.
Conflicts of Interest
The author declares no conflicts of interest.
References
- Cedigaz. Underground Gas Storage in the World—2017 Status. (July 2017a). Available online: http://www.cedigaz.org/resources/free-downloads.aspx/ (accessed on 1 March 2018).
- Simeoni, C.; Sedlacek, R.; Rokosz, W.; Khan, S.; Joffre, G.H.; Odevall, C.; Ten Eyck, P.; Noteboom, H.; Radu, G.; Kunev, V. The underground natural gas study in Europe and in Central Asia. In Proceedings of the 16th World Petroleum Congress, Calgary, AB, Canada, 5–11 June 2000; pp. 98–99. [Google Scholar]
- Lord, A.S. Overview of Geologic Storage of Natural Gas with an Emphasis on Assessing the Feasibility of Storing Hydrogen; Technical Report SAND2009-587; Sandia National Laboratories: Albuquerque, NM, USA, 2009. [Google Scholar]
- American Gas Association. Survey of Underground Storage of Natural Gas in the United States and Canada: 2010/11; American Gas Association: Washington, DC, USA, 2012. [Google Scholar]
- Confort, M.J.F.; Mothe, C.G. Estimating the required underground natural gas storage capacity in Brazil from the gas industry characteristics of countries with gas storage facilities. J. Nat. Gas Sci. Eng. 2014, 18, 120–130. [Google Scholar] [CrossRef]
- Juez-Larré, J.; Remmelts, G.; Breunese, J.N.; van Gessel, S.F.; Leeuwenburgh, O. Using underground gas storage to replace the swing capacity of the giant natural gas field of Groningen in the Netherlands. A reservoir performance feasibility study. J. Pet. Sci. Eng. 2016, 145, 34–53. [Google Scholar] [CrossRef]
- Cedigaz. Medium and Long Term Natural Gas Outlook 2017. (July 2017b). Available online: http://www.cedigaz.org/resources/free-downloads.aspx/ (accessed on 1 March 2018).
- U.S. Energy Information Administration (EIA). Available online: https://www.eia.gov/ (accessed on 1 March 2018).
- Cantini, S.; Klopf, W.; Revelant, R.; Verga, F. Integrated Log Interpretation Approach for Underground Gas Storage Characterization. In Proceedings of the SPE EUROPEC/EAGE Annual Conference and Exhibition (Paper SPE 131536), Barcelona, Spain, 14–17 June 2010. [Google Scholar]
- Hildenbrand, A.; Schlomer, S.; Krooss, B. Gas breakthrough experiments on fine-gained sedimentary rocks. Geofluids 2002, 2, 3–23. [Google Scholar] [CrossRef]
- Al-Bazali, T.M.; Zhang, J.; Chenevert, M.E.; Sharma, M.M. Measurement of the Sealing Capacity of Shale Caprocks. In Proceedings of the SPE Annual Technical Conference and Exhibition, Dallas, TX, USA, 9–12 October 2005. [Google Scholar]
- Al-Bazali, T.M.; Zhang, J.; Chenevert, M.E.; Sharma, M.M. Estimating the Reservoir Hydrocarbon Capacity through Measurement of the Minimum Capillary Entry Pressure of Shale Caprocks. In Proceedings of the SPE Annual Technical Conference and Exhibition, New Orleans, LA, USA, 4–7 October 2009. [Google Scholar]
- Egermann, P.; Lombard, J.M.; Bretonnier, P. A fast and accurate method to measure threshold capillary pressure of caprocks under representative conditions. In Proceedings of the SCA International Symposium, Trondheim, Norway, 18–22 September 2006. [Google Scholar]
- Rodwell, W.R.; Harris, A.W.; Horseman, S.T.; Lalieux, P.; Müller, W.; Ortiz-Amaya, L.; Preuss, K. Gas Migration and Two-Phase Flow through Engineered and Geological Barriers for a Deep Repository for Radioactive Waste: A Joint EC/NEA Status Report; Publications Office of the European Union: Luxembourg, 1999; ISBN-10 9282881326. [Google Scholar]
- Davies, P.B. Evaluation of the Role of Threshold Pressure in Controlling Flow of Waste-Generated Gas into Bedded Salt at the Waste Isolation Pilot Plant; Technical Report SAND 90-3246; Sandia National Laboratories: Albuquerque, NM, USA, 1991. [Google Scholar]
- Swanson, B. A simple correlation between permeabilities and mercury capillary pressures. J. Pet. Technol. 1981, 33, 2498–2504. [Google Scholar] [CrossRef]
- Thomas, L.; Katz, D.; Tek, M. Threshold pressure phenomena in porous media. Soc. Pet. Eng. J. 1968, 8, 174–186. [Google Scholar] [CrossRef]
- Bourdet, D.P.; Whittle, T.M.; Douglas, A.A.; Picard, Y.M. A new set of type curves simplifies well test analysis. World Oil 1983, 196, 95–106. [Google Scholar]
- Bourdet, D.P.; Ayoub, J.A.; Whittle, T.M.; Picard, Y.M.; Kniazeff, V. Interpreting well tests in fractured reservoirs. World Oil 1983, 197, 77–87. [Google Scholar]
- Bourdet, D. Well Test Analysis: The Use of Advanced Interpretation Models. In Handbook of Petroleum Exploration & Production, 1st ed.; Elsevier: New York, NY, USA, 2002; Volume 3, ISBN 9780444509680. [Google Scholar]
- Coelho, A.C.D.; de Carmargo, C.; Kato, E.T.; Legrand, V.M.Q.F. Utilizing mini-DST for formation evaluation. In Proceedings of the SPE Latin American and Caribbean Petroleum Engineering Conference, Rio de Janeiro, Brazil, 20–23 June 2005. [Google Scholar]
- Gringarten, A.C. From straight lines to deconvolution: The evolution of the state of the art in well test analysis. SPE Reserv. Eval. Eng. 2008, 11, 41–62. [Google Scholar] [CrossRef]
- Gringarten, A.C. Practical use of well test deconvolution. In Proceedings of the SPE Annual Technical Conference and Exhibition, Florence, Italy, 20–22 September 2010. [Google Scholar]
- Kuo, C.H. Determination of Reservoir Properties from Sinusoidal and Multirate Flow Tests in One or More Wells. Soc. Pet. Eng. J. 1972, 12, 499–507. [Google Scholar] [CrossRef]
- Black, J.H.; Kipp, K.L., Jr. Determination of hydrogeological parameters using sinusoidal pressure tests: A theoretical appraisal. Water Resour. Res. 1981, 17, 686–692. [Google Scholar] [CrossRef]
- Kazi-Aoual, M.N.; Bonnet, G.; Jouanna, P. Reconnaissance of saturated porous media by harmonic analysis. I. Direct problem. Eur. J. Mech. B/Fluids 1991, 10, 51–72. [Google Scholar]
- Rosa, A.J.; Horne, R.N. Reservoir Description by Well Test Analysis Using Cyclic Flow Rate Variation. SPE Form. Eval. 1997, 12, 247–254. [Google Scholar] [CrossRef]
- Hollaender, F.; Hammond, P.S.; Gringarten, A.C. Harmonic Testing for Continuous Well and Reservoir Monitoring. In Proceedings of the SPE Annual Technical Conference and Exhibition, San Antonio, TX, USA, 29 September–2 October 2002. [Google Scholar]
- Copty, N.K.; Findikakis, A.N. Stochastic analysis of pumping test drawdown data in heterogeneous geologic formations. J. Hydraul. Res. 2004, 42, 59–67. [Google Scholar] [CrossRef]
- Despax, D.; Dovis, R.; Fedele, J.-M.; Martin, J.-P. Method and Device for Determining the Quality of an Oil Well Reserve. U.S. Patent 6,801,857, 5 October 2004. [Google Scholar]
- Renner, J.; Messar, M. Periodic pumping tests. Geophys. J. Int. 2006, 167, 479–493. [Google Scholar] [CrossRef]
- Rochon, J.P.; Jaffrezic, V.; Boutaud de la Combe, J.L.; Azari, M.; Roy, S.; Dorffer, D.F.; Singer, J.M. Method and Application of Cyclic Well Testing with Production Logging. In Proceedings of the SPE Annual Technical Conference and Exhibition, Denver, CO, USA, 21–24 September 2008. [Google Scholar]
- Ahn, S.; Horne, R.N. Estimating Permeability Distributions from Pressure Pulse Testing. In Proceedings of the SPE Annual Technical Conference and Exhibition, Florence, Italy, 19–22 September 2010. [Google Scholar]
- Fokker, P.A.; Verga, F. Application of harmonic pulse testing to water–oil displacement. J. Petrol. Sci. Eng. 2011, 79, 125–134. [Google Scholar] [CrossRef]
- Fokker, P.A.; Salina Borello, E.; Serazio, C.; Verga, F. Estimating reservoir heterogeneities from pulse testing. J. Pet. Sci. Eng. 2012, 86–87, 15–26. [Google Scholar] [CrossRef]
- Fokker, P.A.; Renner, J.; Verga, F. Numerical modeling of periodic pumping tests in wells penetrating a heterogeneous aquifer. Am. J. Environ. Sci. 2013, 9, 1–13. [Google Scholar] [CrossRef]
- Morozov, P.E. Harmonic Testing of Hydraulically Fractured Wells. In Proceedings of the 17th European Symposium on Improved Oil Recovery, St. Petersburg, Russia, 16–18 April 2013. [Google Scholar]
- Vinci, C.; Steeb, H.; Renner, J. The imprint of hydro-mechanics of fractures in periodic pumping tests. Geophys. J. Int. 2015, 202, 1613–1626. [Google Scholar] [CrossRef]
- Sun, A.Y.; Lu, J.; Hovorka, S. A harmonic pulse testing method for leakage detection in deep subsurface storage formations. Water Resour. Res. 2015, 51, 4263–4281. [Google Scholar] [CrossRef]
- Salina Borello, E.; Fokker, P.A.; Viberti, D.; Espinoza, R.V.; Verga, F. Harmonic-Pulse Testing for Non-Darcy-Effects Identification. SPE Res. Eval. Eng. 2017, 20, 486–501. [Google Scholar] [CrossRef]
- Beretta, E.; Tiani, A.; Lo Presti, G.; Verga, F. Value of injection testing as an alternative to conventional well testing: Field experience in a sour-oil reservoir. SPE Reserv. Eval. Eng. 2007, 10, 112–121. [Google Scholar] [CrossRef]
- Verga, F.; Rocca, V. Green methodologies to test hydrocarbon reservoirs. Am. J. Environ. Sci. 2010, 6, 1–10. [Google Scholar] [CrossRef]
- Fokker, P.A.; Salina Borello, E.; Verga, F.; Viberti, D. Harmonic Pulse Testing for Well Performance Monitoring. J. Pet. Sci. Eng. 2018, 162, 446–459. [Google Scholar] [CrossRef]
- Verga, F.; Viberti, D.; Salina Borello, E. A new insight for reliable interpretation and design of injection tests. J. Pet. Sci. Eng. 2011, 78, 166–177. [Google Scholar] [CrossRef]
- Verga, F.; Viberti, D.; Serazio, C. Estimation of skin components for a partially completed damaged well from injection tests. J. Pet. Sci. Eng. 2012, 90–91, 165–174. [Google Scholar] [CrossRef]
- Azzarone, E.; Beretta, E.; Guglielmelli, A.; Nunzi, P.; Mariotti, P. Gas Injection Testing & PLT—Offshore Eni Experience. In Proceedings of the 10th Offshore Mediterranean Conference, Ravenna, Italy, 23–25 March 2011. [Google Scholar]
- Azzarone, E.; Beretta, E.; Marzorati, D. Injection Testing: Gas Storage Field Experience. In Proceedings of the SPE EUROPEC/EAGE Annual Conference & Exhibition Incorporating, London, UK, 10–13 June 2013. [Google Scholar]
- Health and Safety Laboratory. Failure Rates for Underground Gas Storage—Significance for Land Use Planning Assessments; RR671 Research Report; HSE: Liverpool, UK, 2008. [Google Scholar]
- Rubinstein, J.L.; Mahani, A.B. Myths and Facts on Wastewater Injection, Hydraulic Fracturing, Enhanced Oil Recovery, and Induced Seismicity. Seism. Res. Lett. 2015, 86, 1060–1067. [Google Scholar] [CrossRef]
- Desroches, J.; Etchécopar, A.; Wileveau, Y.; Diaz, E.; Cantini, S.; Blum, M.S. Combination of Microhydraulic Fracturing and Wellbore Images Provides Measurement of the Full Stress Sensor: A Case Study. In Proceedings of the 46th SPWLA, New Orleans, LA, USA, 26–29 June 2005. [Google Scholar]
- Benetatos, C.; Málek, J.; Verga, F. Moment tensor inversion for two micro-earthquakes occurred inside the Háje gas storage facilities, Czech Republic. J. Seism. 2013, 17, 557–577. [Google Scholar] [CrossRef]
- Zoback, M.D. Reservoir Geomechanics: Earth Stress and Rock Mechanics Applied to Exploration, Production and Wellbore Stability; Cambridge University Press: Cambridge, UK, 2007; p. 449. ISBN 978-0-521-77069-9. [Google Scholar]
- Mashinsky, E. Differences between static and dynamic elastic moduli of rocks: Physical causes. Russ. Geol. Geophys. 2003, 44, 953–959. [Google Scholar]
- Ciccotti, M.; Mulargia, F. Differences between static and dynamic elastic moduli of a typical seismogenic rock. Geophys. J. Int. 2004, 157, 474–477. [Google Scholar] [CrossRef]
- Davich, P.; Labuz, J.; Guzina, B.; Drescher, A. Small Strain and Resilient Modulus Testing of Granular Soils; Minnesota Department of Transportation, Research Services Section: Minneapolis, MN, USA, 2004; p. 117.
- Jones, R.; Dewhurst, D.; Hillis, R.; Mildren, S. Geomechanical fault characterization: Impact on quantitative fault seal risking. In Proceedings of the SPE/ISRM Rock Mechanics Conference, Irving, TX, USA, 20–23 October 2002. [Google Scholar]
- Cancelliere, M.; Viberti, D.; Verga, F. Assisted history matching for petroleum reservoirs in the social computing era. Am. J. Appl. Sci. 2013, 10, 901–916. [Google Scholar] [CrossRef]
- Spiteri, E.J.; Juanes, R.; Blunt, M.J.; Orr, F.M. A new model of trapping and relative permeability hysteresis for all wettability characteristics. SPE J. 2008, 13, 277–288. [Google Scholar] [CrossRef]
- Castelletto, N.; Ferronato, M.; Gambolati, G.; Janna, C.; Salce, I.; Teatini, P. Geomechanical effects of gas storage in depleted gas fields. In Proceedings of the 5th Asian Rock Mechanics Symposium (ARMS5), Tehran, Iran, 24–26 November 2008; pp. 1015–1022. [Google Scholar]
- Settari, A. Reservoir compaction. J. Pet. Technol. 2002, 54, 62–69. [Google Scholar] [CrossRef]
- Doornhof, D.; Kristiansen, T.G.; Nagel, N.B.; Pattillo, P.D.; Sayers, C. Compaction and subsidence. Schlumberger. Oilfield Rev. 2006, 18, 50–68. [Google Scholar]
- Verga, F.; Oreste, P.; Giglio, G.; Marzorati, D. Reservoir characterization for gas storage under deltapressure conditions: A case history. In Proceedings of the 66th EAGE Conference & Exhibition, Paris, France, 7–10 June 2004. [Google Scholar]
- Benetatos, C.; Rocca, V.; Sacchi, Q.; Verga, F. How to approach subsidence evaluation for marginal fields: A case history. Open Petr. Eng. J. 2015, 8, 214–234. [Google Scholar]
- Settari, A.; Sen, V. The role of geomechanics in integrated reservoir modeling. Lead. Edge (TLE) 2007, 26, 622–627. [Google Scholar] [CrossRef]
- Ibrahim, M.A.; Tek, M.R.; Katz, D.L. Threshold Pressure in Gas Storage; American Gas Association: Washington, DC, USA, 1971; ISBN 0318127245. [Google Scholar]
- Tek, M.R.; Wilkes, J.O.; Katz, D.L. New Concepts in Underground Storage of Natural Gas; American Gas Association: New York, NY, USA, 1966; p. 342. [Google Scholar]
- Ferretti, A.; Prati, C.; Rocca, F. Permanent scatterers in SAR interferometry. IEEE Trans. Geosci. Remote Sens. 2001, 39, 8–20. [Google Scholar] [CrossRef]
- Allaway, A.; Merrett, P.J.; Eyre, J.M.; Stead, D. The application of GPS in monitoring landslide movements. In Proceedings of the 8th IAEG Congress, Balkema, Rotterdam, 21–25 September 1998; pp. 1633–1640. [Google Scholar]
- Angeli, M.G.; Pasuto, A.; Silvano, S. A critical review of landslide monitoring experiences. Eng. Geol. 2000, 55, 133–147. [Google Scholar] [CrossRef]
- Coe, J.A.; Godt, J.W.; Ellis, W.L.; Savage, W.Z.; Savage, J.E.; Powers, P.S.; Varnes, D.J.; Tachker, P. Preliminary Interpretation of Seasonal Movement of the Slumgullion Landslide as Determined from GPS Observations, July 1998–July 1999; Open-File Report 00-102; U.S. Geological Survey: Reston, VA, USA, 2000; p. 25. ISBN 128887538X.
- Gili, J.A.; Corominas, J.; Rius, J. Using global positioning system techniques in landslide monitoring. Eng. Geol. 2000, 55, 167–192. [Google Scholar] [CrossRef]
- Keaton, J.R.; DeGraff, J.V. Surface observation and geologic mapping. In Landslides, Investigation and Mitigation; Turner, A.K., Schuster, R.L., Eds.; Transportation Research Board Report 247; National Academic Press: Washington, DC, USA, 1996; pp. 178–230. ISBN 030906208X. [Google Scholar]
- Mikkelsen, P.E. Field instrumentation. In Landslides, Investigation and Mitigation; Turner, A.K., Schuster, R.L., Eds.; Transportation Research Board Report 247; National Academic Press: Washington, DC, USA, 1996; pp. 278–3150. ISBN 030906208X. [Google Scholar]
- Carnec, C.; King, C.; Massonnet, D. Measurement of land subsidence by means of differential SAR interferometry. In Proceedings of the 5th International Symposium on Land Subsidence (FISOLS 95), The Hague, The Netherlands, 16–20 October 1995; pp. 139–148. [Google Scholar]
- Gabriel, A.K.; Goldstein, R.M.; Zebker, H.A. Mapping small elevation changes over large areas: Differential radar interferometry. J. Geophys. Res. 1989, 94, 9183–9191. [Google Scholar] [CrossRef]
- Massonnet, D.; Rossi, M.; Carmona, C.; Adragna, F.; Peltzer, G.; Feigl, K.; Rabaute, T. The displacement field of the Landers earthquake mapped by radar interferometry. Nature 1993, 364, 138–142. [Google Scholar] [CrossRef]
- Massonnet, D.; Briole, P.; Arnaud, A. Deflation of Mount Etna monitored by space radar interferometry. Nature 1995, 375, 567–570. [Google Scholar] [CrossRef]
- Zebker, H.; Rosen, P.; Goldstein, R.; Gabriel, A.; Werner, C. On the derivation of coseismic displacement fields using differential radar interferometry: The Landers earthquake. J. Geophys. Res. 1994, 99, 19617–19634. [Google Scholar] [CrossRef]
- Tarchi, D.; Casagli, N.; Fanti, R.; Leva, D.; Luzi, G.; Pasuto, A.; Pieraccini, M.; Silvano, S. Landslide monitoring by using ground-based SAR interferometry: An example of application to the Tessina landslide in Italy. Eng. Geol. 2003, 68, 15–30. [Google Scholar] [CrossRef]
- Perrone, A.; Zeni, G.; Piscitelli, S.; Pepe, A.; Loperte, A.; Lapenna, V.; Lanari, R. Joint analysis of SAR interferometry and electrical resistivity tomography surveys for investigating ground deformation: The case-study of Satriano di Lucania (Potenza, Italy). Eng. Geol. 2006, 88, 260–273. [Google Scholar] [CrossRef]
- Orlic, B. Some geomechanical aspects of geological CO2 sequestration. KSCE J. Civ. Eng. 2009, 13, 225–232. [Google Scholar] [CrossRef]
- Moroni, N.; Panciera, N.; Johnson, C.; LeRoy-Delage, S.; Bulte-Loyer, H.; Cantini, S.; Bellegia, E.; Illuminati, R. Overcoming the Weak Link in Cemented Hydraulic Isolation. In Proceedings of the SPE Annual Technical Conference and Exhibition, Anaheim, CA, USA, 11–14 November 2007. [Google Scholar]
- Oldenburg, C.M. Revisiting underground gas storage as a direct analogue for geologic carbon sequestration. Greenh. Gas Sci. Technol. 2018, 8, 4–6. [Google Scholar] [CrossRef]
- Wilson, M.; Monea, M. IEA GHG Weyburn CO2 Monitoring and Storage Project, Summary Report, 2000–2004. Petroleum. In Proceedings of the 7th International Conference on Greenhouse Gas Control Technologies (GHGT-7), Vancouver, BC, Canada, 5–9 September 2005; Volume III. [Google Scholar]
- Chadwick, A.; Arts, R.; Bernstone, C.; May, F.; Thibeau, S.; Zweigel, P. Best Practice for the Storage of CO2 in Saline Aquifers. Observations and Guidelines from the SACS and CO2STORE Projects; British Geological Survey: Nottingham, UK, 2008; p. 273. ISBN 9780852726105.
Figure 1.
Growth in global gas consumption (elaborated from Cedigaz [7] and updated @ March 2018 based on U.S. EIA public data [8]).

Figure 2.
Different types of Underground Gas Storage systems [9].
Figure 2.
Different types of Underground Gas Storage systems [9].

Figure 3.
Development of induced fractures and breakouts under the assumption of normal fault and maximum stress in the vertical direction [9].
Figure 3.
Development of induced fractures and breakouts under the assumption of normal fault and maximum stress in the vertical direction [9].

Figure 4.
Effective merge of the production history taking due account of withdrawal and injection switches.
Figure 4.
Effective merge of the production history taking due account of withdrawal and injection switches.

Figure 5.
Qualitative effect of gas composition on FVF.

Figure 6.
Case history showing of the effect of gas composition on the simulated bottomhole pressure history (WBP) compared to historical data (WBPH).
Figure 6.
Case history showing of the effect of gas composition on the simulated bottomhole pressure history (WBP) compared to historical data (WBPH).

Figure 7.
Qualitative effect of reservoir temperature on FVF.

Figure 8.
Case history showing the effect of reservoir temperature on the simulated bottomhole pressure history (WBP) compared to historical data (WBPH).
Figure 8.
Case history showing the effect of reservoir temperature on the simulated bottomhole pressure history (WBP) compared to historical data (WBPH).

Figure 9.
Case history showing the need for a new calibration of the reservoir model (a) to satisfactorily reproduce the pressure values recorded during storage cycles (b).
Figure 9.
Case history showing the need for a new calibration of the reservoir model (a) to satisfactorily reproduce the pressure values recorded during storage cycles (b).

Figure 10.
Rock volumetric deformation εv as a function of (a) pressure and (b) effective stress.

Figure 11.
Effect of the injection strategy on working gas in water drive storage fields. The injected gas rates are displayed with a blue line; pressure is shown in red for the case exemplifying a poor injection strategy (a) and green for the case exemplifying an optimized injection strategy (b).
Figure 11.
Effect of the injection strategy on working gas in water drive storage fields. The injected gas rates are displayed with a blue line; pressure is shown in red for the case exemplifying a poor injection strategy (a) and green for the case exemplifying an optimized injection strategy (b).

Figure 12.
Examples of working gas evolution over time: (a) Working gas is balanced and stabilized; (b) Working gas is balanced but not stabilized; (c) Working gas is stabilized but not balanced.
Figure 12.
Examples of working gas evolution over time: (a) Working gas is balanced and stabilized; (b) Working gas is balanced but not stabilized; (c) Working gas is stabilized but not balanced.


Figure 13.
Example of a geomechanical model in which the reservoir model (in colors) is embedded.

Figure 14.
Example of vertical displacement velocities (mm/year) recorded from InSAR.

Figure 15.
Example of moment tensor and local stress field analysis based on microseismic monitoring where dots indicate focal points.
Figure 15.
Example of moment tensor and local stress field analysis based on microseismic monitoring where dots indicate focal points.

© 2018 by the author. Licensee MDPI, Basel, Switzerland. This article is an open access article distributed under the terms and conditions of the Creative Commons Attribution (CC BY) license (http://creativecommons.org/licenses/by/4.0/).
Share and Cite
MDPI and ACS Style
Verga, F. What’s Conventional and What’s Special in a Reservoir Study for Underground Gas Storage. Energies 2018, 11, 1245. https://doi.org/10.3390/en11051245
AMA Style
Verga F. What’s Conventional and What’s Special in a Reservoir Study for Underground Gas Storage. Energies. 2018; 11(5):1245. https://doi.org/10.3390/en11051245
Chicago/Turabian StyleVerga, Francesca. 2018. "What’s Conventional and What’s Special in a Reservoir Study for Underground Gas Storage" Energies 11, no. 5: 1245. https://doi.org/10.3390/en11051245
Note that from the first issue of 2016, this journal uses article numbers instead of page numbers. See further details here.