Deformation Monitoring Using Sentinel-1 SAR Data †
by
 ,
,
Núria Devanthéry
1,*, 
Michele Crosetto
1,
Oriol Monserrat
1,
María Cuevas-González
1 and
Bruno Crippa
2 1
Centre Tecnològic de Telecomunicacions de Catalunya (CTTC/CERCA), 08860 Castelldefels, Spain
2
Department of Earth Sciences "Ardito Desio", University of Milan, 20122 Milano, Italy
*
Author to whom correspondence should be addressed.
†
Presented at the 2nd International Electronic Conference on Remote Sensing, 22 March–5 April 2018; Available online: https://sciforum.net/conference/ecrs-2.
Proceedings 2018, 2(7), 344; https://doi.org/10.3390/ecrs-2-05157
Published: 22 March 2018
(This article belongs to the Proceedings of The 2nd International Electronic Conference on Remote Sensing)
Abstract
:Satellite earth observation enables the monitoring of different types of natural hazards, contributing to the mitigation of their fatal consequences. In this paper, satellite Synthetic Aperture Radar (SAR) images are used to derive terrain deformation measurements. The images acquired with the ESA satellites Sentinel-1 are used. In order to fully exploit these images, two different approaches to Persistent Scatterer Interferometry (PSI) are used, depending on the characteristics of the study area and the available images. The main processing steps of the two methods, i.e.; the simplified and the full PSI approach, are described and applied over an area of 7500 km2 located in Catalonia (Spain). The deformation velocity map and deformation time series are analysed in the last section of the paper.
1. Introduction
Satellite observation is a key tool for the observation of the Earth, enabling, in particular, the mitigation of natural hazards’ consequences. It provides serveral advantages over other monitoring techniques: acquisition of data in inaccessible areas; extensive coverage, which allows the complete analysis of global phenomena; and provision long-term historical data for large areas, enabling the temporal analysis of the phenomena. Addtionally, it outperforms the generally more expensive and slow in situ data acquisition.
In this work, we use Synthetic Aperture Radar (SAR) images and Differential SAR Interferometry (DinSAR) technique to derive terrain deformation measurements. Previous works performed with the technique have been successfully carried out in the fields of geophysics, volcanology [1,2], seismology [3], landslide monitoring [4] and subsidence measurements [5]. In particular, an advanced approach to DinSAR, the Persistent Scatterer Interferometry (PSI) technique [6,7], is used. This technique uses large sets of SAR images acquired over the same area to measure the velocity of deformation of the terrain and the deformation time series (see [8] for a review of the technique).
A set of 36 SAR images acquired with the ESA satellites Sentinel-1 (S-1) are used in this study. S-1 acquires at C-band and brings important advantages with respect to other sensors: wide area coverage, with the Interferometric Wide Swath mode it acquires images covering 250 by 180 km; frequent revisit time of 6 days; and free of charge availability.
2. Methodology
The technique used in this study is an implementation of the PSI approach. In order to process the Sentinel-1 interferometric data, we use two complementary approaches, depending on the characteristics of the study area, the availability of the images, and the type of phenomenon to monitor. The two approaches are a simplified PSI method and a full PSI approach. These two approaches are described below.
2.1. Simplified PSI Approach
The simplified approach uses consecutive interferograms in order to fully exploit the increased coherence of 6-day temporal baseline interferograms. This approach is mainly used when working in non-urban areas, where the coherence decreases very fast in time. The procedure starts with a stack of N complex SAR images and N − 1 consecutive multi-look interferograms. The main steps are: (i) 2D phase unwrapping of the N − 1 multi-look interferograms, using the Minimum Cost Flow method [9,10]; (ii) Direct integration of the unwrapped interferometric phases, to obtain temporally ordered phases in correspondence to the image acquisition dates; (iii) Estimation and removal of the atmospheric phase component by means of a set of spatio-temporal filters [7,11]; (iv) Generation of the deformation time series and accumulated deformation map, using the atmosphere-free interferograms and transforming the phases into displacements; (v) Geocoding of the results.
2.2. Full PSI Approach
The full PSI approach gives the best results when working in high coherence areas. This approach requires a large set of N SAR images and a redundant network of M interferograms, where M >> N. Their main steps are: (i) Perform the so-called 2 + 1D phase unwrapping. First, a spatial 2D phase unwrapping using the Minimum Cost Flow method [9,10] is performed over the multi-looked interferograms. This is followed by a 1D phase unwrapping performed pixel wise over the M interferograms, which uses an iterative least squares procedure [12,13,14] that fully exploits the integer nature of the unwrapping errors. This last step is able to detect and correct the errors generated during the 2D phase unwrapping stage, and provides tools to control the quality of the derived time series [15]; (ii) Estimation of the atmospheric phase component (APS) and removal from the interferograms at full resolution. This is performed by means of a set of spatio-temporal filters; (iii) Deformation velocity and residual topographic error (RTE) estimation using the method of the periodogram; (iv) removal of the RTE phase component from the wrapped APS-free interferograms; (v) Generation of the final deformation time series by means of the final iteration of the 2 + 1D phase unwrapping. This involves a 2D phase unwrapping, followed by a 1D phase unwrapping; (vi) Geocoding of the results.
3. Results
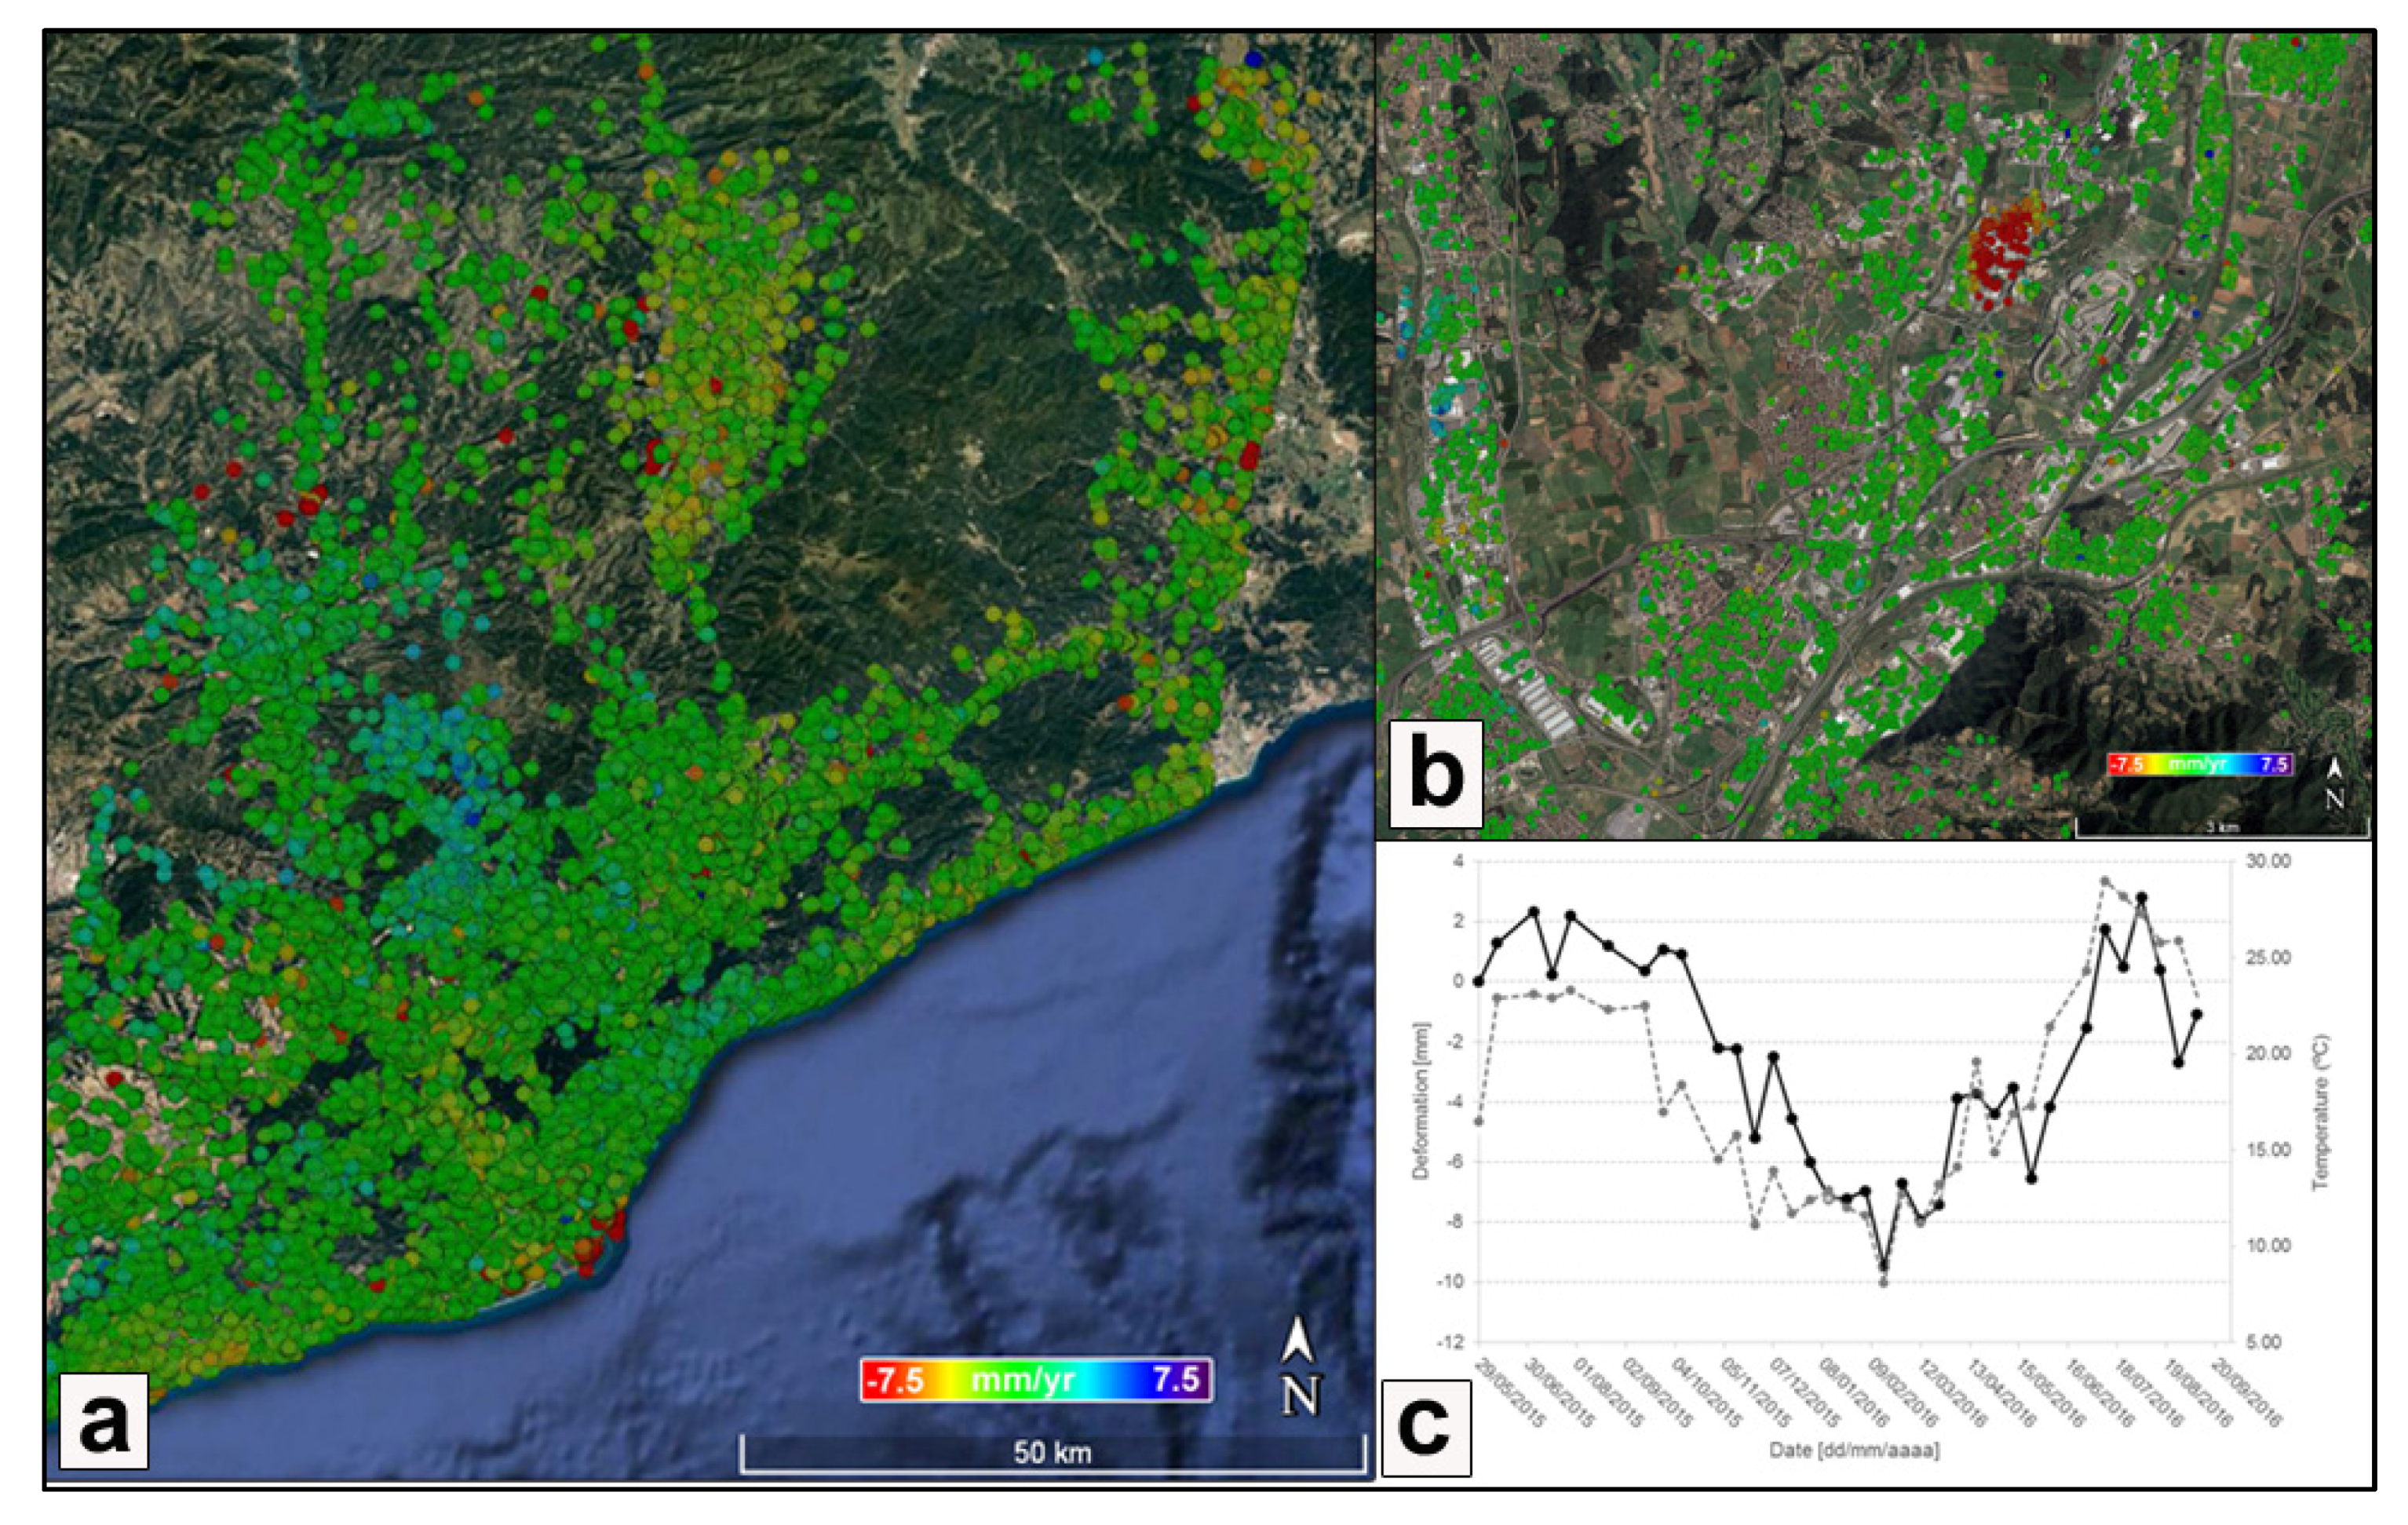
The approaches detailed in the previous section have been used to monitor the full region of Catalonia (Spain). The velocity of deformation and time series of deformation have been derived using 36 Sentinel-1A images acquired in the Interferometric Wide Swath Mode covering the period from March 2015 to September 2016. The temporal baseline is usually 12 days, while in some cases it is 24 and 36 days. Figure 1a show the velocity of deformation map derived over an area of about 7500 km2 using the full PSI approach and a redundant network of interferograms. The urban areas are covered with measurements, while in most cases, the vegetated and non-urban areas lack points due to the low coherence and hence the noise of these areas.
Figure 1a shows that most of the studied area is stable (green points). However, some interesting deformations where detected on this map. Figure 1b shows a subset in the metropolitan area of Barcelona. Two differentiated areas of deformation can be appreciated, which are probably related to water extraction phenomena. In red, there is a subsidence that reaches more than 15 mm/year, while in blue there is an uplift up to 5 mm/year.
Figure 1c shows the deformation time series of a point located over an industrial building in Barcelona (black line related to the left axis). It shows a periodical movement which is related to the temperature (grey dotted line, which refers to the right axis). This time series shows the high deformation sensitivity of the measurements.
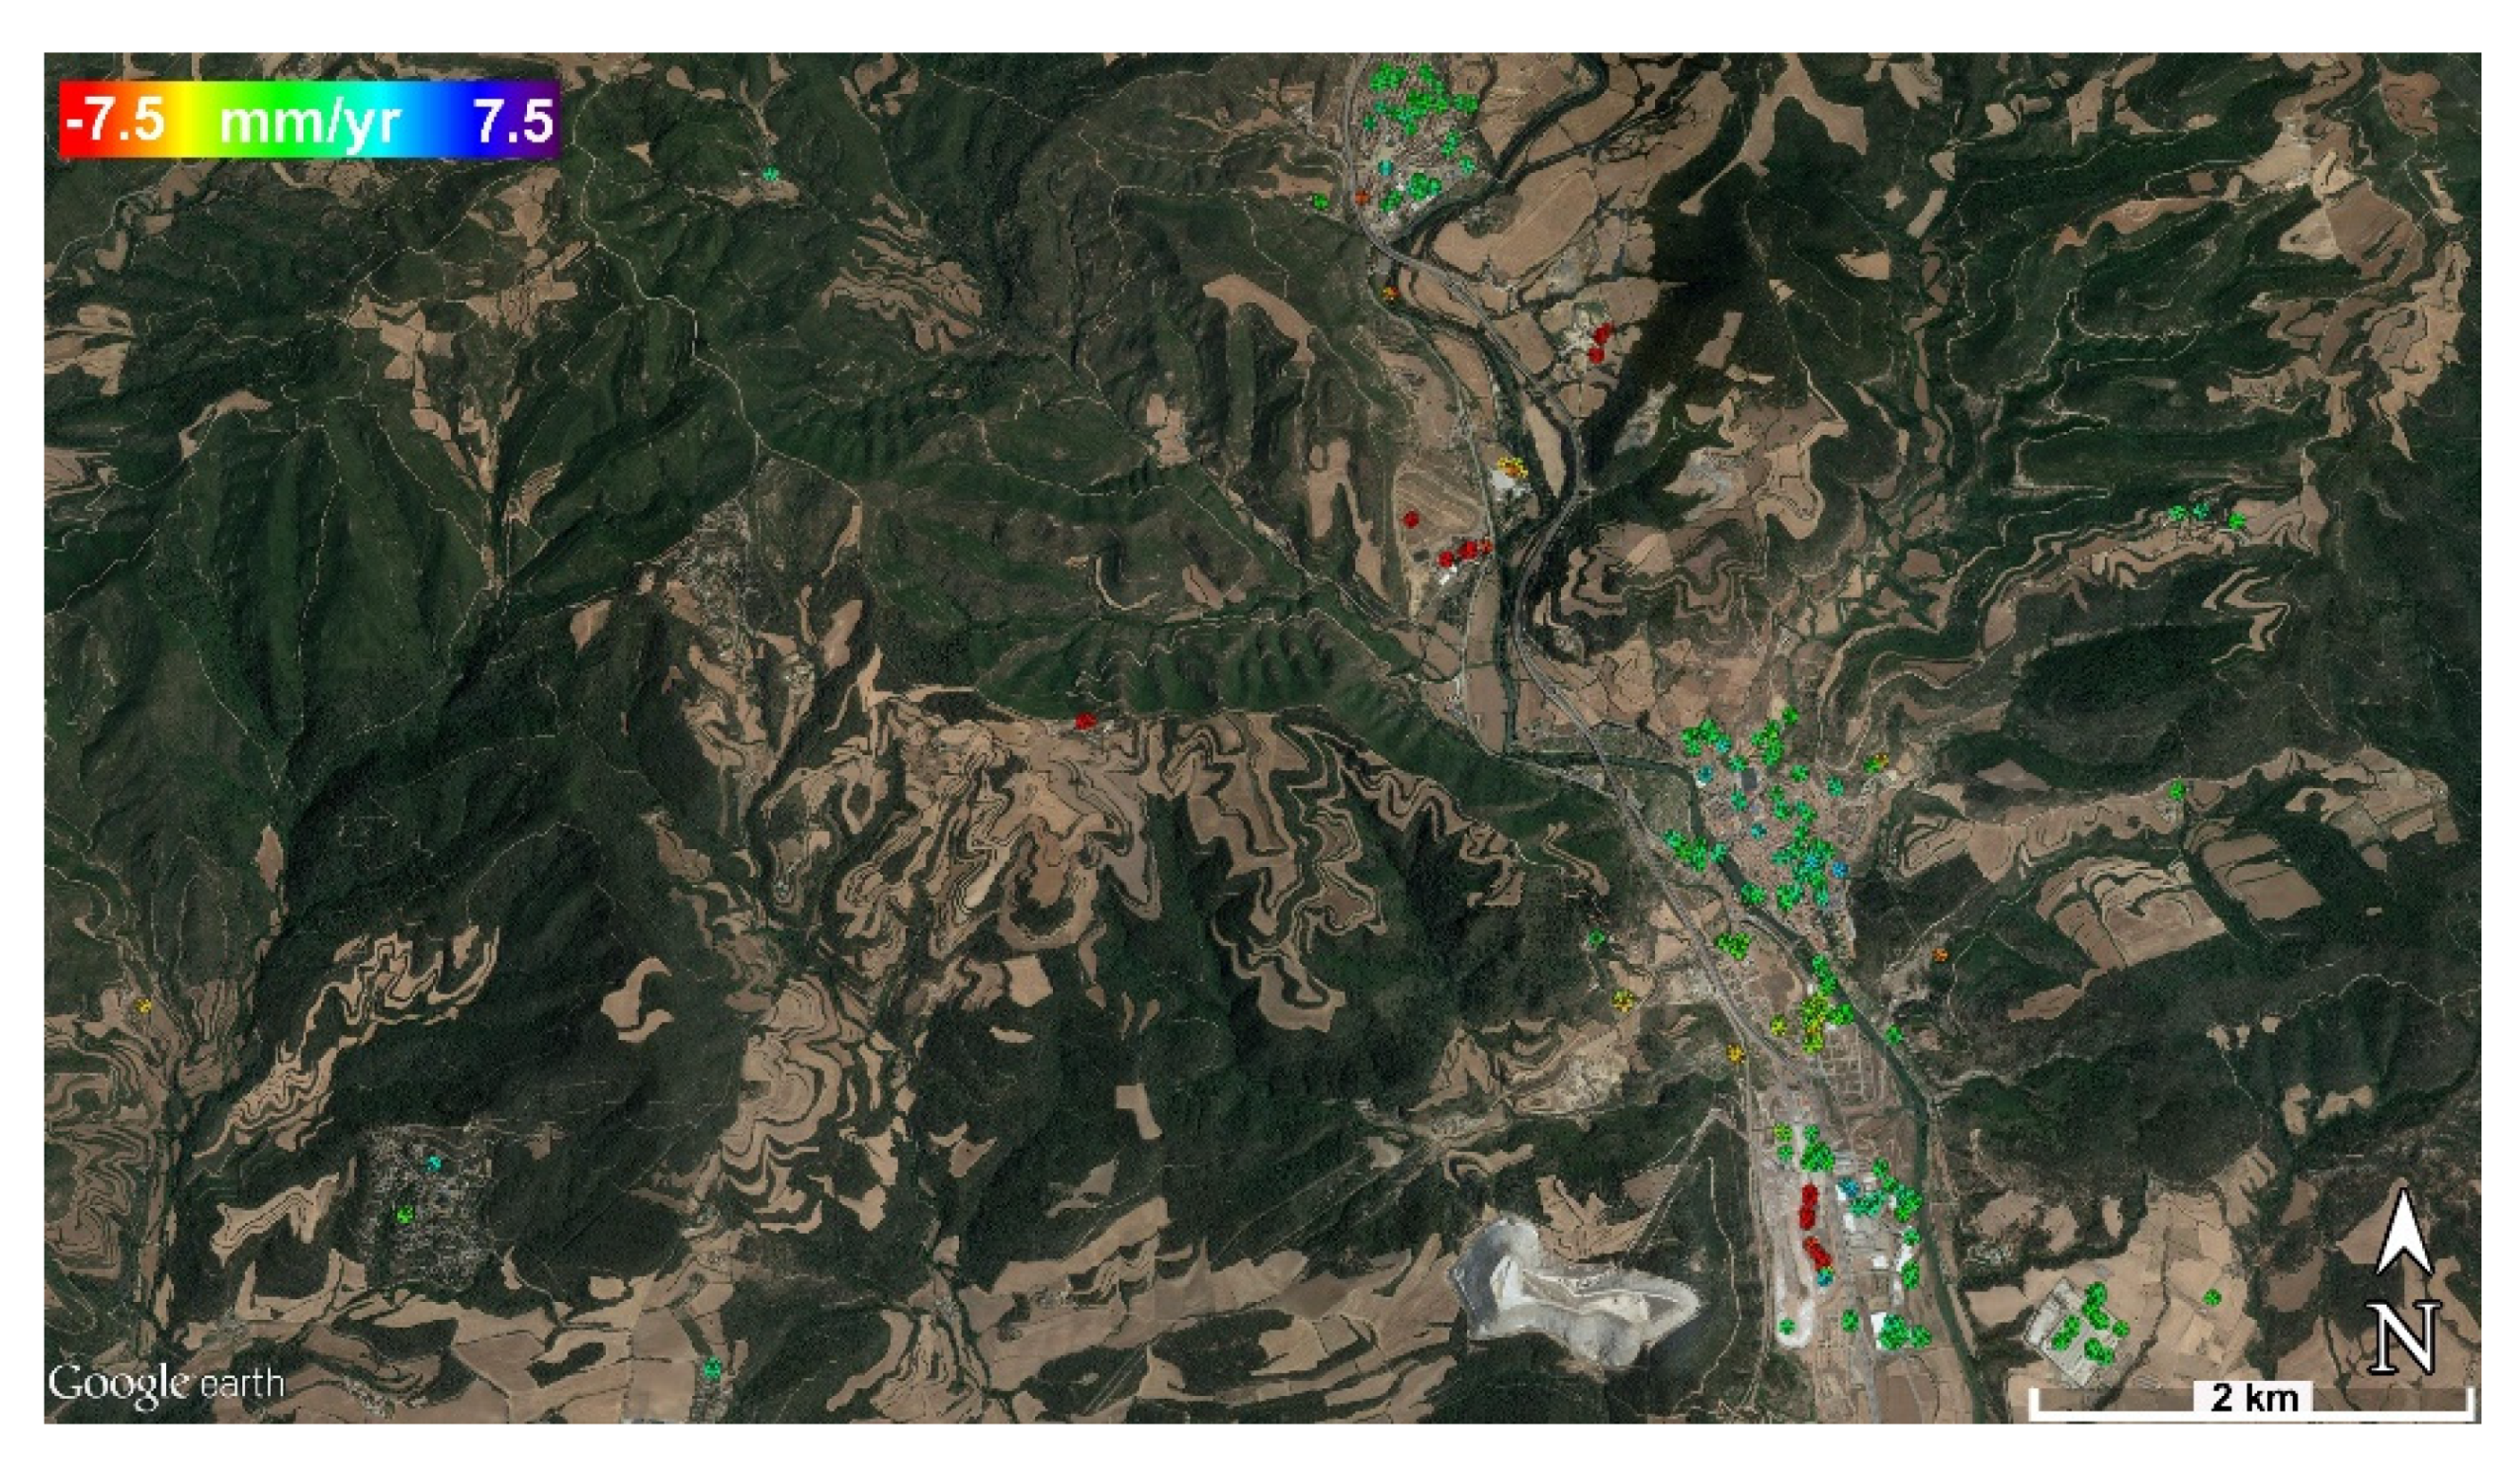
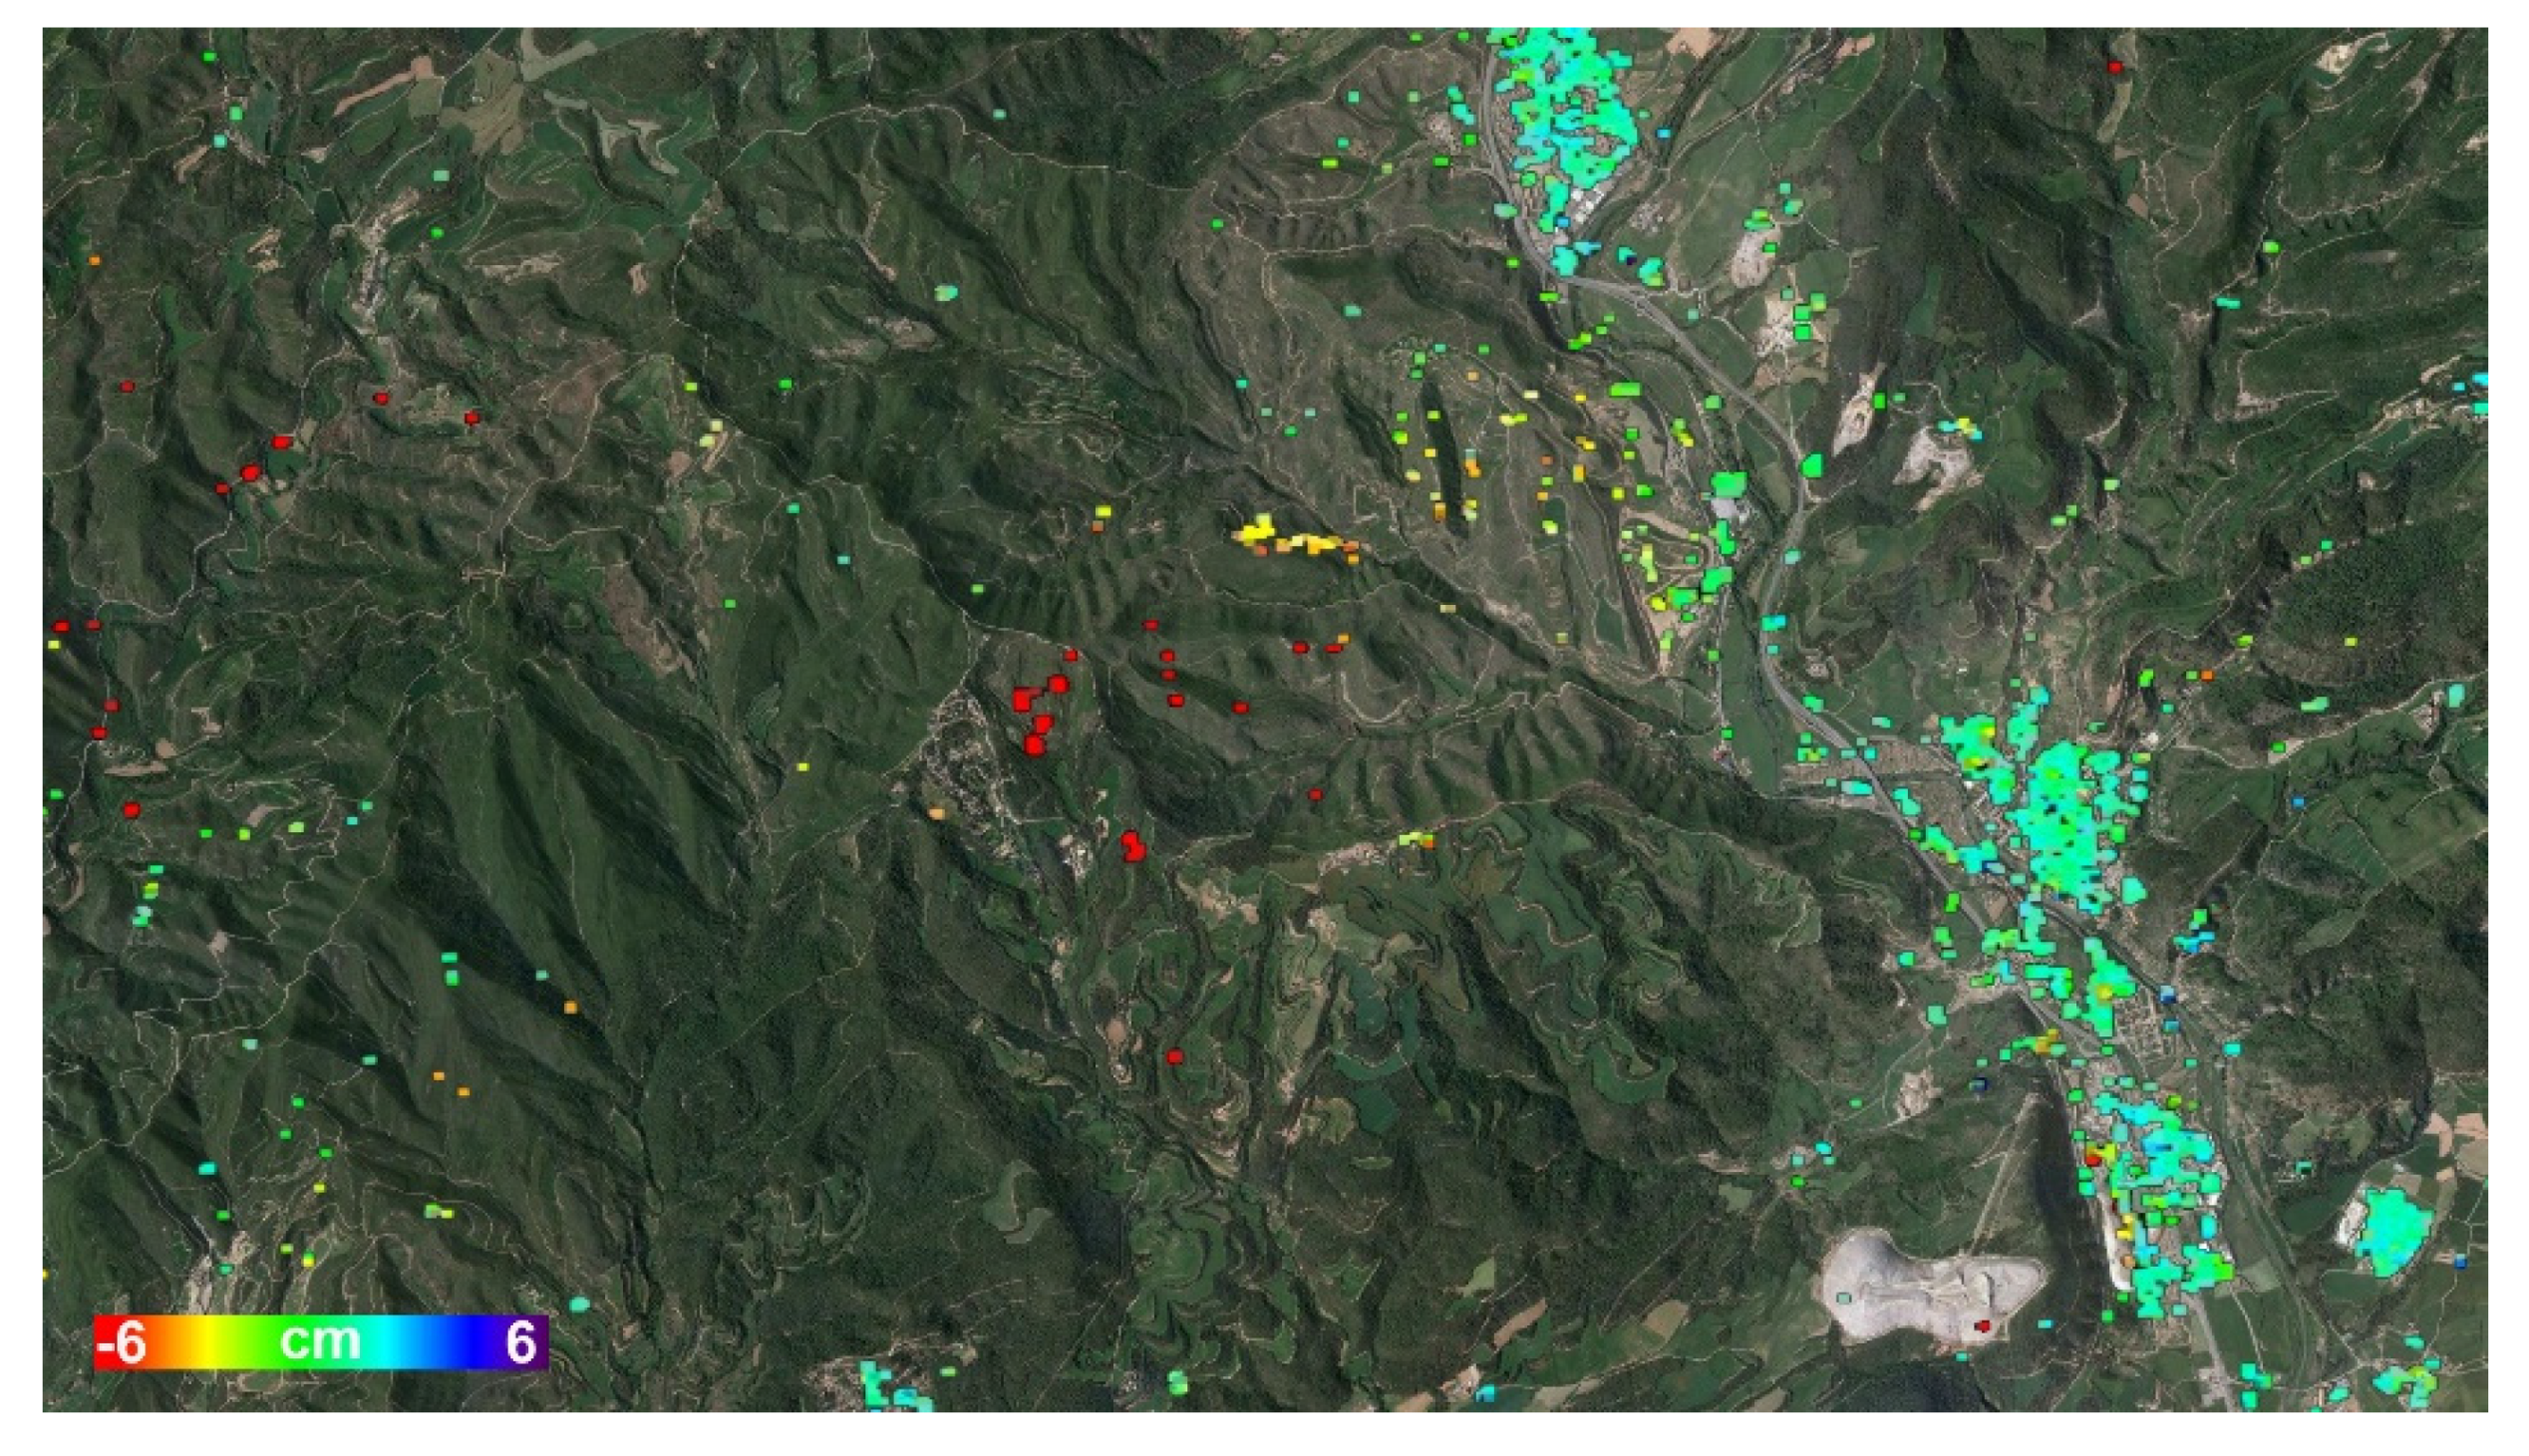
The best results are derived with the full PSI approach using redundancy of interferograms. However, in some areas, the density of points is not enough. In those cases, the simplified approach is used to take advantage of the high coherence of consecutive interferograms. Figure 2 and Figure 3 show the deformation measured over an area undergoing mining activities. Figure 2 shows the velocity of deformation with a maximum of 25 mm/year of subsidence (in red). Figure 3 is the accumulated deformation map derived using the simplified approach and 24 S-1 images, spanning the period from March 2015 to January 2016. In this case, the simplified approach allows obtaining a higher measurement density over the area of interest.
4. Conclusions
The deformation map over an area in Catalonia (Spain) has been derived using Sentinel-1 Synthetic Aperture radar (SAR) images. Two different approaches based on Differential SAR Interferometry (DInSAR) have been used: the complete PSI procedure, which uses redundancy of interferograms and whose key step is a 2 + 1D phase unwrapping which allows to detect and correct phase unwrapping errors, and the simplified approach, which uses consecutive interferograms in order to take advantage of the high coherence of 12 day interferograms. Some examples of measured deformations have been shown.
Author Contributions
Nuria Devanthery implemented some parts of the approach and performed the study. Michele Crosetto was in charge of the scientific and technical coordination. Oriol Monserrat implemented some key parts of the approach. Maria Cuevas-Gonzalez contributed to the processing and analysis of the data. Bruno Crippa was in charge of the algorithm development.
Acknowledgments
This work has been partially funded by the Spanish Ministry of Economy and Competitiveness through the DEMOS project “Deformation monitoring using Sentinel-1 data” (Ref: CGL2017-83704-P).
Conflicts of Interest
The authors declare no conflict of interest.
Abbreviations
The following abbreviations are used in this manuscript:
| SAR | Synthetic Aperture Radar |
| DinSAR | Differential Synthetic Aperture Radar Interferometry |
| PSI | Persistent Scaterer Interferometry |
| S-1 | Sentinel-1 |
| RTE | Residual topographic error |
| APS | Atmospheric Phase Screen |
References
- Antonielli, B.; Monserrat, O.; Bonini, M.; Righini, G.; Sani, F.; Luzi, G.; Feyzullayev, A.A.; Aliyev, C.S. Pre-eruptive ground deformation of Azerbaijan mud volcanoes detected through satellite radar interferometry (DInSAR). Tectonophysics 2014, 637, 163–177. [Google Scholar] [CrossRef]
- Massonnet, D.; Briole, P.; Arnaud, A. Deflation of Mount Etna monitored by spaceborne radar interferometry. Nature 1995, 375, 567–570. [Google Scholar] [CrossRef]
- Massonnet, D.; Rossi, M.; Carmona, C.; Adragna, F.; Peltzer, G.; Feigl, K.; Rabaute, T. The displacement field of the Landers earthquake mapped by radar interferometry. Nature 1993, 364, 138–142. [Google Scholar] [CrossRef]
- García-Davalillo, J.C.; Herrera, G.; Notti, D.; Strozzi, T.; Álvarez-Fernández, I. DInSAR analysis of ALOS PALSAR images for the assessment of very slow landslides: The Tena Valley case study. Landslides 2014, 11, 225–246. [Google Scholar] [CrossRef]
- Herrera, G.; Tomás, R.; López-Sánchez, J.M.; Delgado, J.; Mallorquí, J.J.; Duque, S.; Mulas, J. Advanced DInSAR analysis on mining areas: La Union case study (Murcia, SE Spain). Eng. Geol. 2007, 90, 148–159. [Google Scholar] [CrossRef]
- Ferretti, A.; Prati, C.; Rocca, F. Nonlinear subsidence rate estimation using permanent scatterers in differential SAR interferometry. IEEE TGRS 2000, 38, 2202–2212. [Google Scholar] [CrossRef]
- Ferretti, A.; Prati, C.; Rocca, F. Permanent scatterers in SAR interferometry. IEEE TGRS 2001, 39, 8–20. [Google Scholar] [CrossRef]
- Crosetto, M.; Monserrat, O.; Cuevas-González, M.; Devanthéry, N. Persistent Scatterer Interferometry: A review. ISPRS J. Photogramm. Remote Sens. 2016, 115, 78–89. [Google Scholar] [CrossRef]
- Costantini, M. A novel phase unwrapping method based on network programming. IEEE TGRS 1998, 36, 813–821. [Google Scholar] [CrossRef]
- Costantini, M.; Farina, A.; Zirilli, F. A fast phase unwrapping algorithm for SAR interferometry. IEEE TGRS 1999, 37, 452–460. [Google Scholar] [CrossRef]
- Berardino, P.; Fornaro, G.; Lanari, R.; Sansosti, E. A new algorithm for surface deformation monitoring based on small baseline differential SAR interferograms. IEEE TGRS 2002, 40, 2375–2383. [Google Scholar] [CrossRef]
- Baarda, W. A Testing Procedure for Use in Geodetic Networks; Kanaalweg 4 Rijkscommissie voor Geodesie: Delft, The Netherlands, 1968. [Google Scholar]
- Björck, Å. Numerical Methods for Least Square Problems; Siam: Philadelphia, PA, USA, 1996. [Google Scholar]
- Förstner, W. Reliability, gross error detection and self-calibration. ISPRS Commission III Tutorial on Statistical Concepts for Quality Control. ISPRS Int. Arch. Photogramm. 1986, 26, 1–34. [Google Scholar]
- Devanthéry, N.; Crosetto, M.; Monserrat, O.; Cuevas-González, M.; Crippa, B. An approach to Persistent Scatterer Interferometry. Remote Sens. 2014, 6, 6662–6679. [Google Scholar] [CrossRef]
Figure 1.
(a) Deformation velocity map derived using 36 Sentinel-1 images during the period March 2015 to September 2016, (b) Zoom of the velocity map over a subsidence in the metropolitan area of Barcelona, (c) Deformation time series associated to thermal dilation.
Figure 1.
(a) Deformation velocity map derived using 36 Sentinel-1 images during the period March 2015 to September 2016, (b) Zoom of the velocity map over a subsidence in the metropolitan area of Barcelona, (c) Deformation time series associated to thermal dilation.

Figure 2.
Velocity map over the period March 2015 to September 2016, derived using a full PSI approach .
Figure 2.
Velocity map over the period March 2015 to September 2016, derived using a full PSI approach .

Figure 3.
Accumulated deformation map using 24 Sentinel-1 images during the period March 2015 to January 2016, derived using a simplified PSI approach.
Figure 3.
Accumulated deformation map using 24 Sentinel-1 images during the period March 2015 to January 2016, derived using a simplified PSI approach.

Publisher’s Note: MDPI stays neutral with regard to jurisdictional claims in published maps and institutional affiliations. |
© 2018 by the authors. Licensee MDPI, Basel, Switzerland. This article is an open access article distributed under the terms and conditions of the Creative Commons Attribution (CC BY) license (https://creativecommons.org/licenses/by/4.0/).
Share and Cite
MDPI and ACS Style
Devanthéry, N.; Crosetto, M.; Monserrat, O.; Cuevas-González, M.; Crippa, B. Deformation Monitoring Using Sentinel-1 SAR Data. Proceedings 2018, 2, 344. https://doi.org/10.3390/ecrs-2-05157
AMA Style
Devanthéry N, Crosetto M, Monserrat O, Cuevas-González M, Crippa B. Deformation Monitoring Using Sentinel-1 SAR Data. Proceedings. 2018; 2(7):344. https://doi.org/10.3390/ecrs-2-05157
Chicago/Turabian StyleDevanthéry, Núria, Michele Crosetto, Oriol Monserrat, María Cuevas-González, and Bruno Crippa. 2018. "Deformation Monitoring Using Sentinel-1 SAR Data" Proceedings 2, no. 7: 344. https://doi.org/10.3390/ecrs-2-05157