
The Primacy of High B-Value 3T-DWI Radiomics in the Prediction of Clinically Significant Prostate Cancer

 , , , ,
Abstract
:1. Introduction
2. Materials and Methods
2.1. Patient Cohort
2.2. mpMRI Protocols
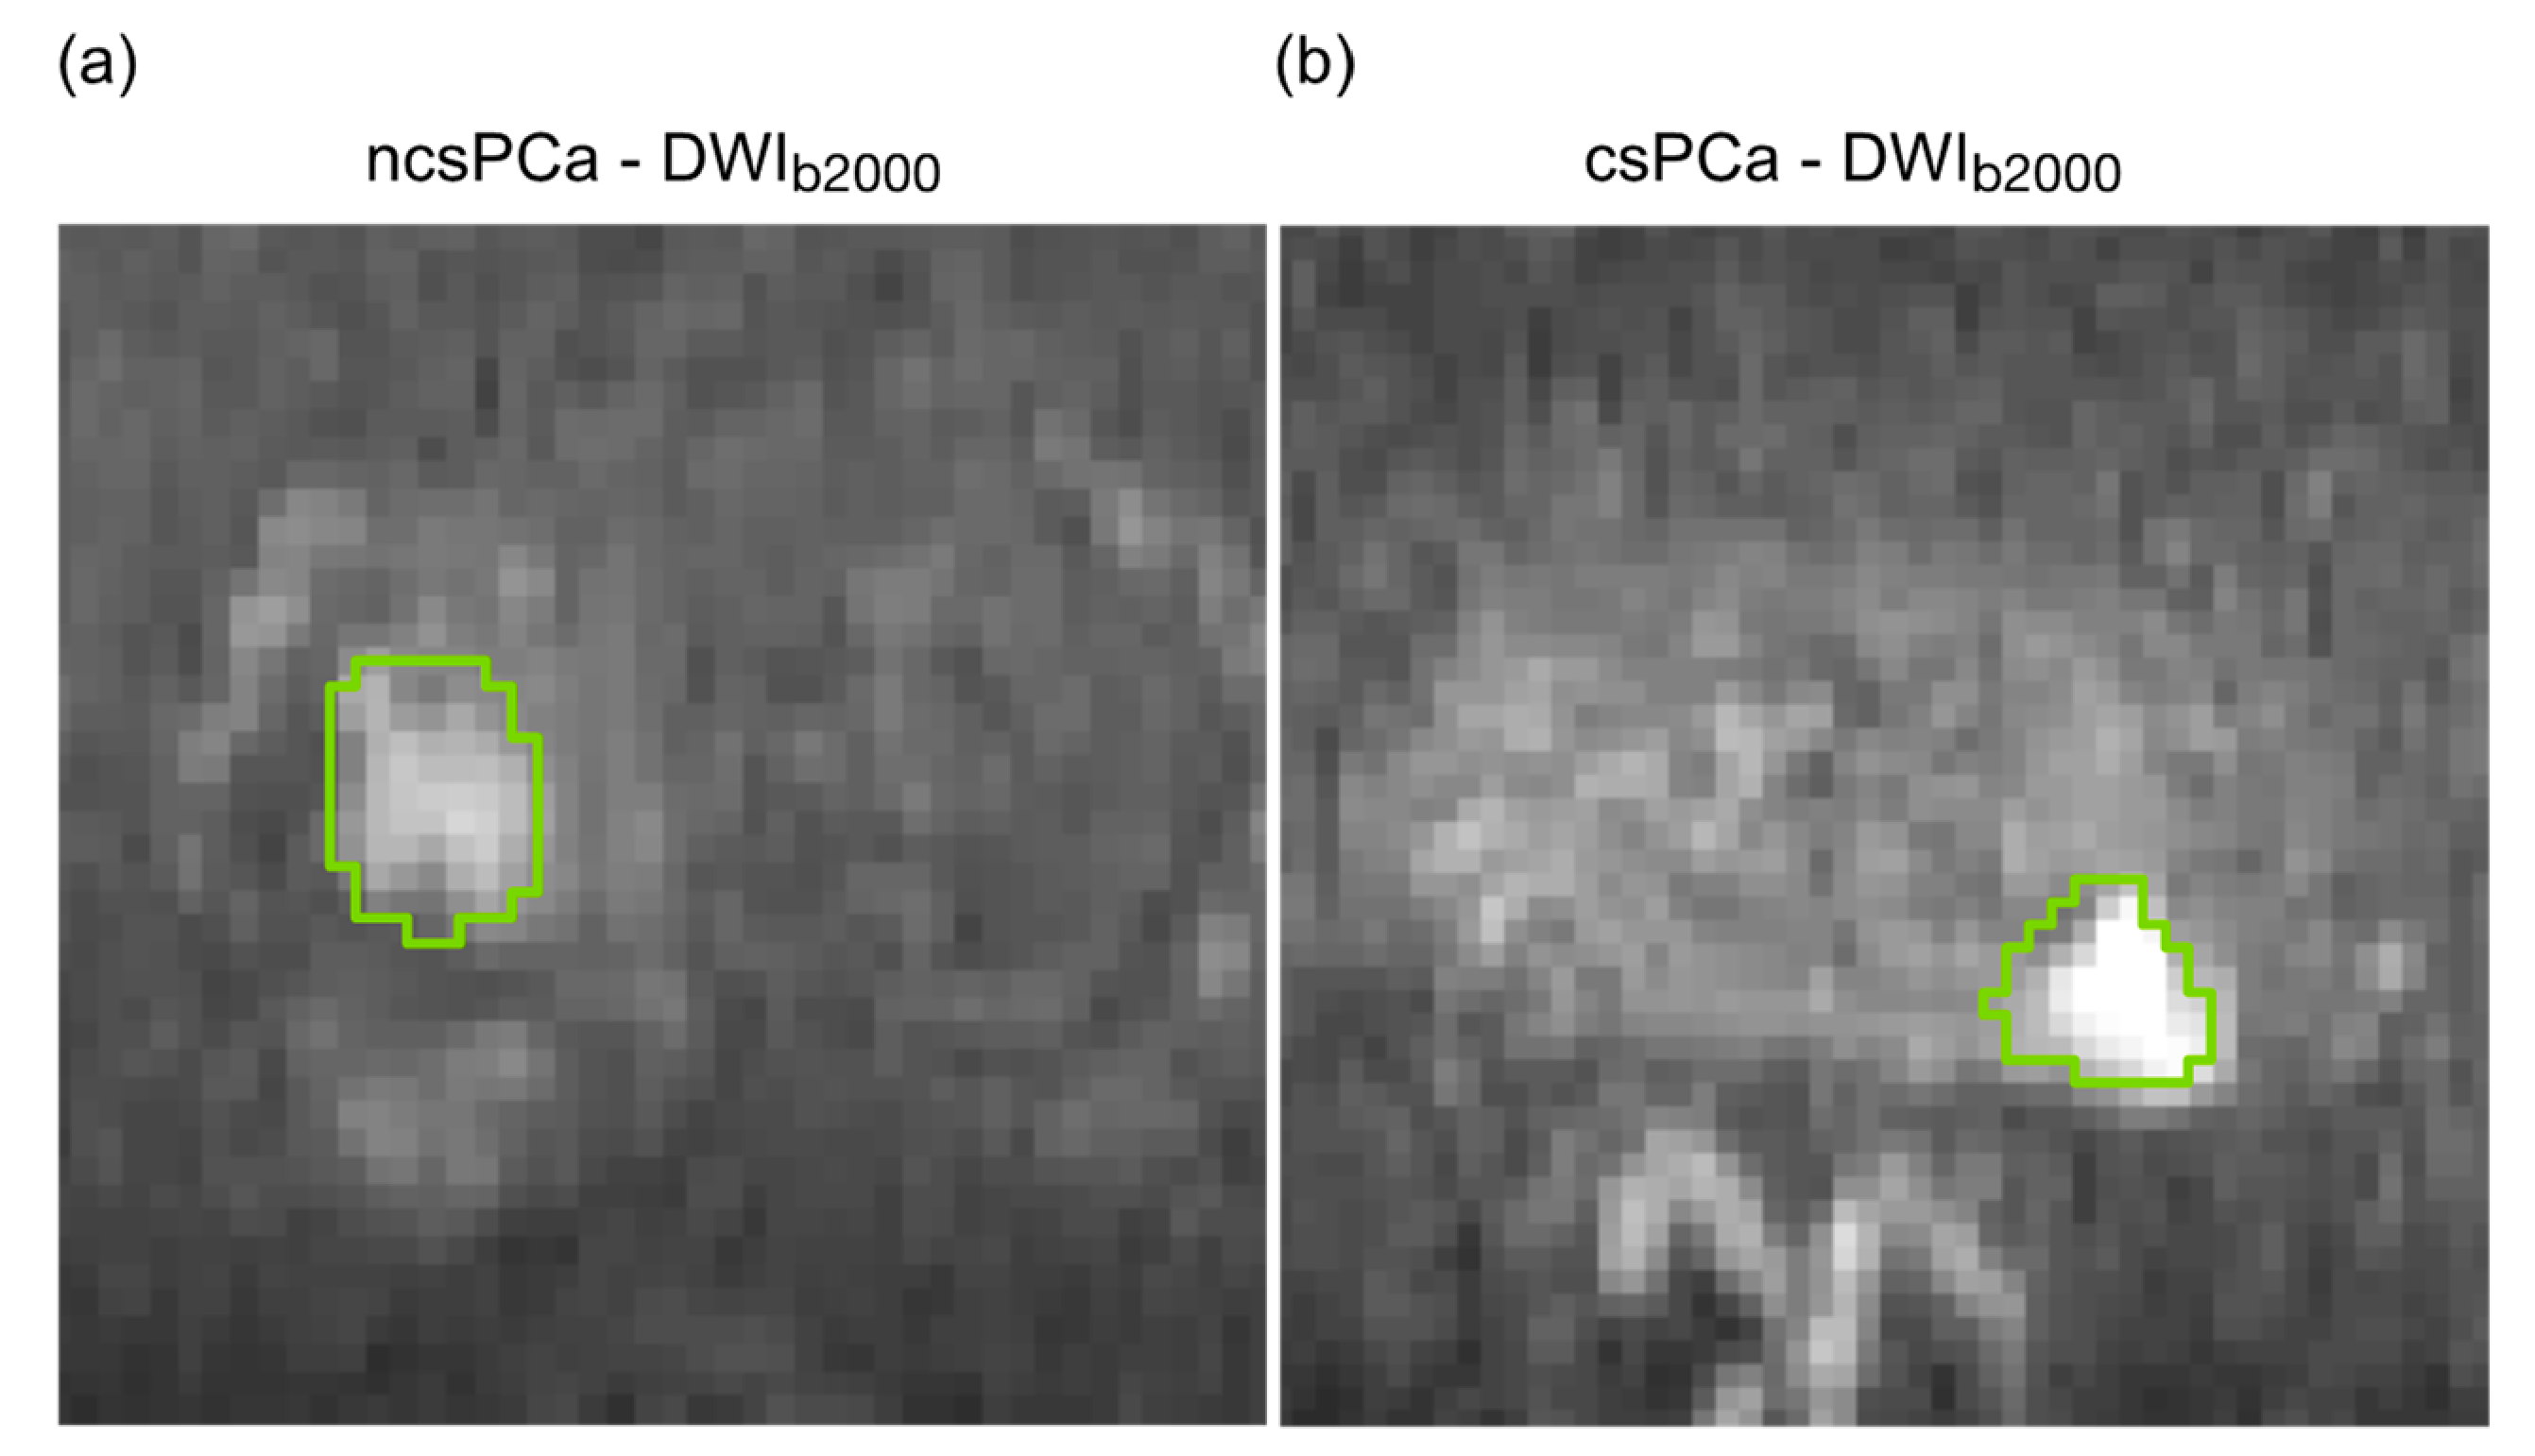
2.3. PCa Lesion Segmentation
2.4. Radiomic Feature Extraction
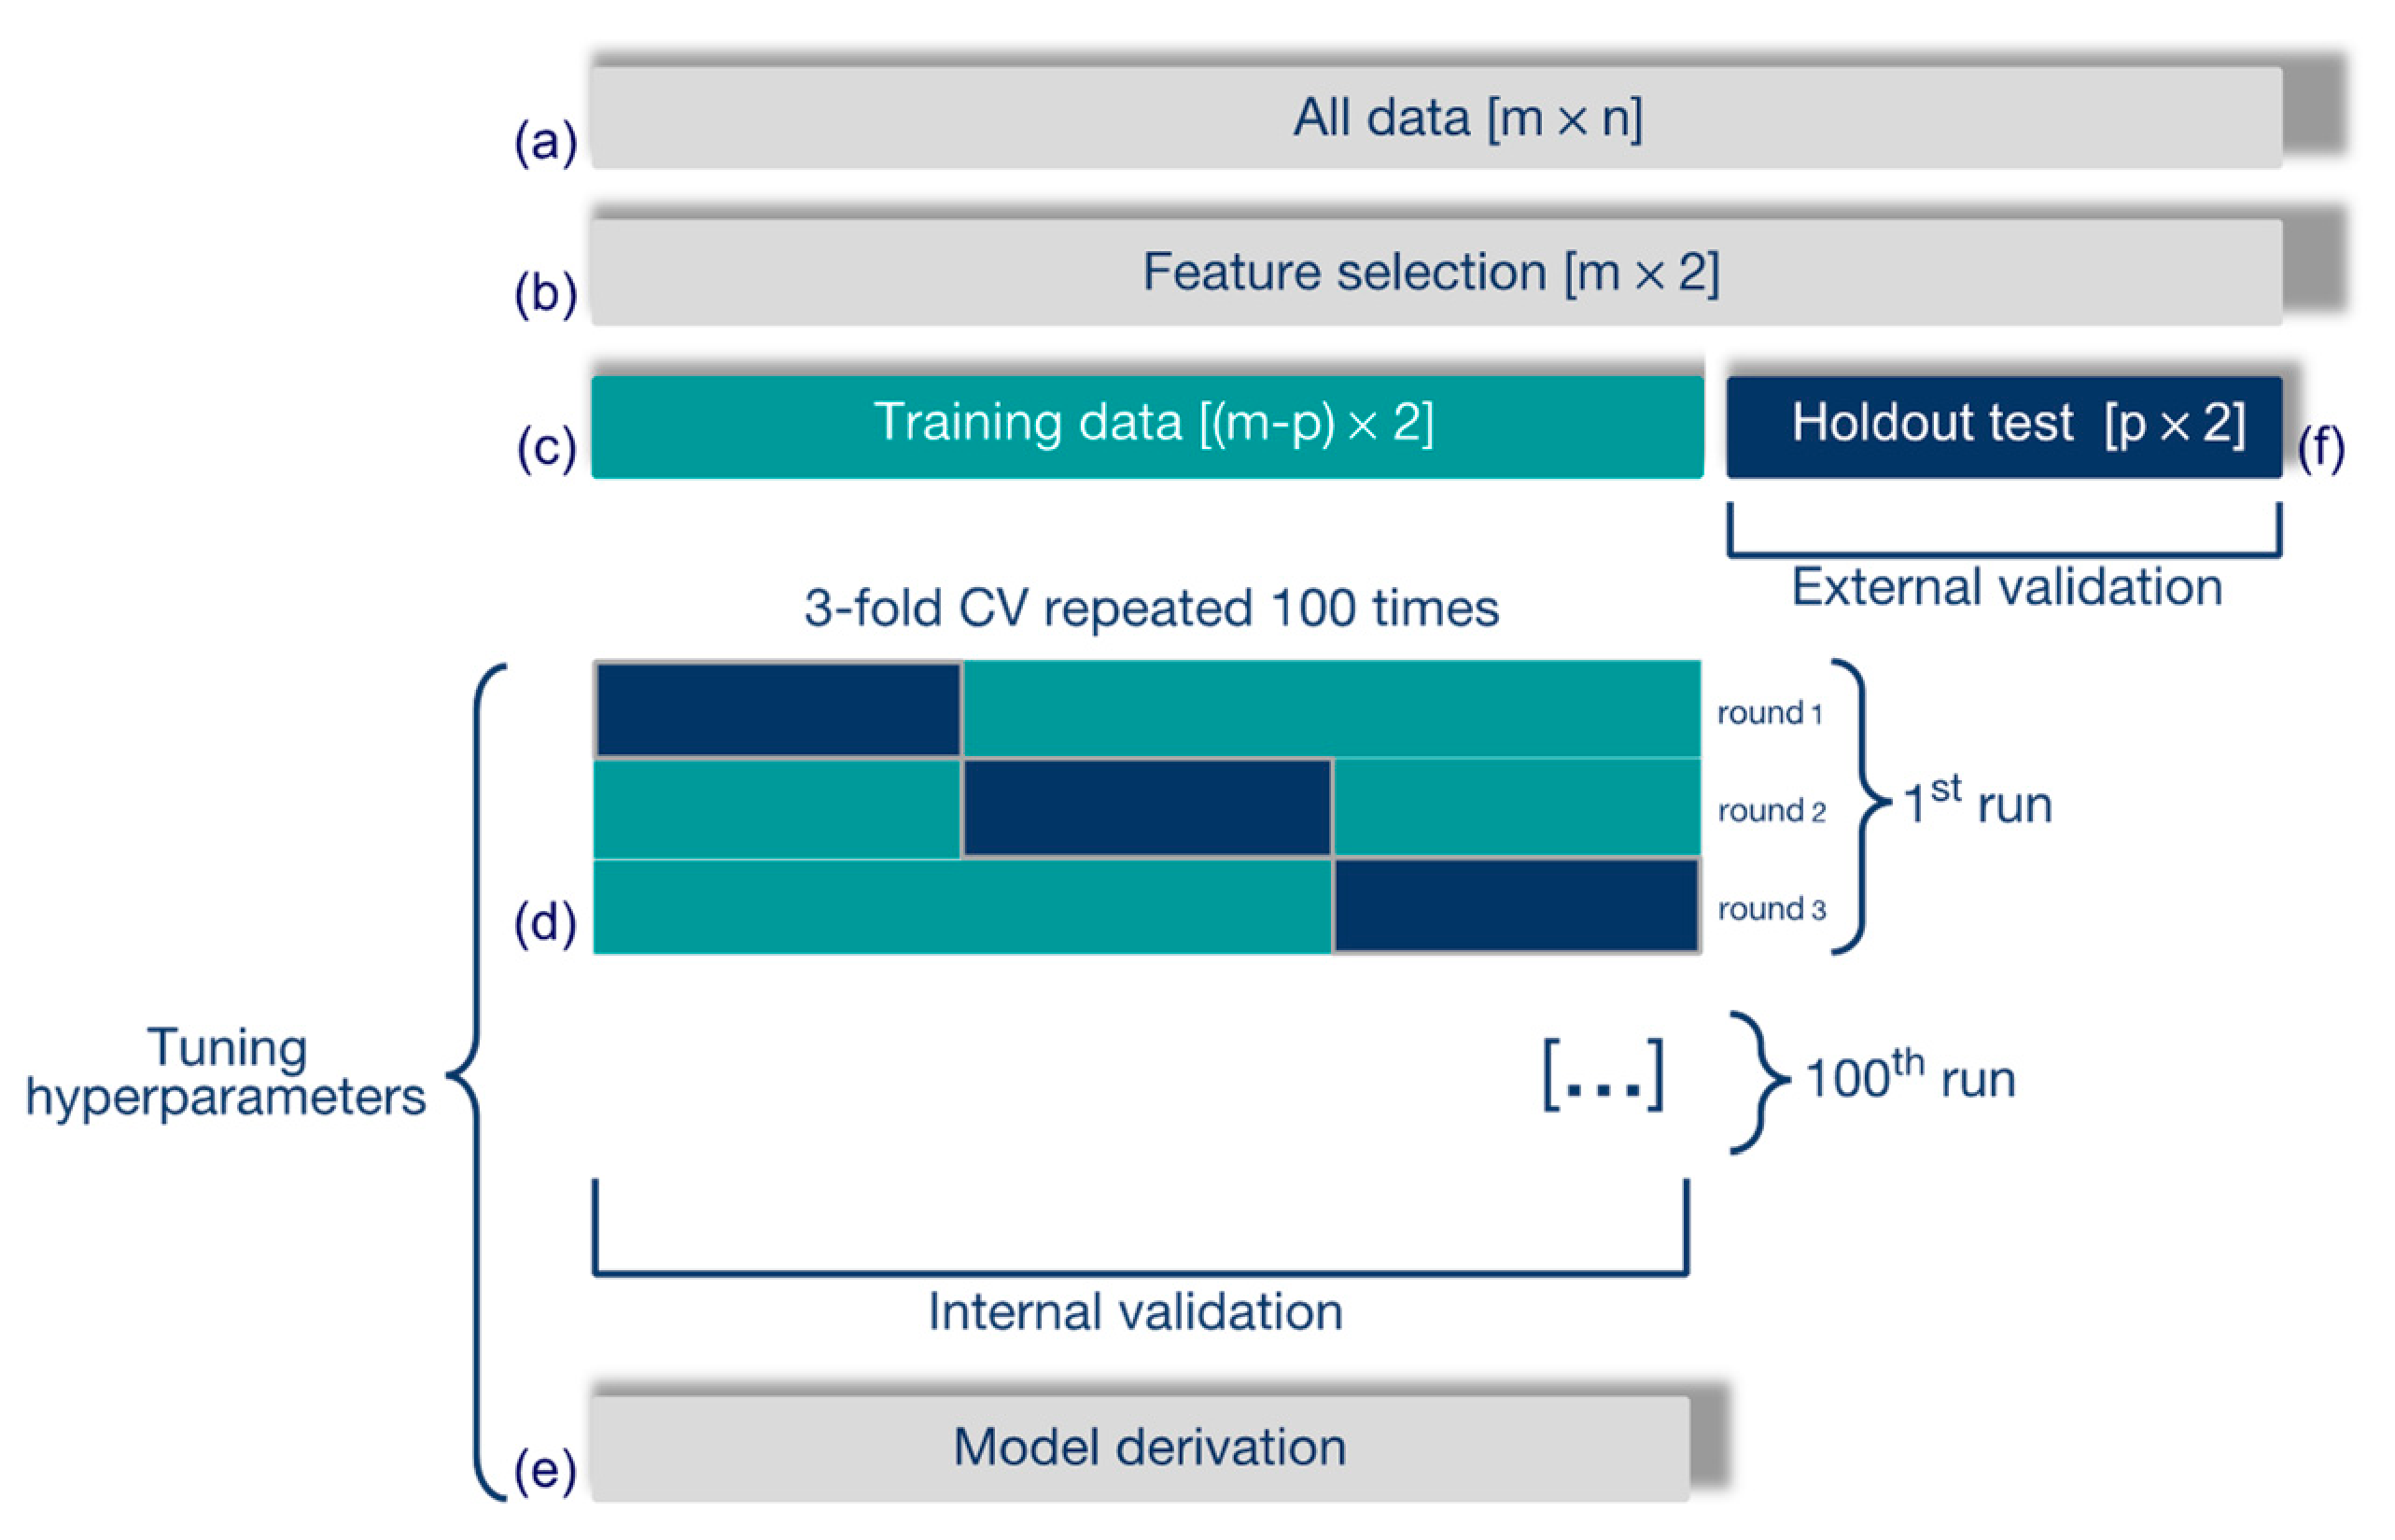
2.5. Predictive Model
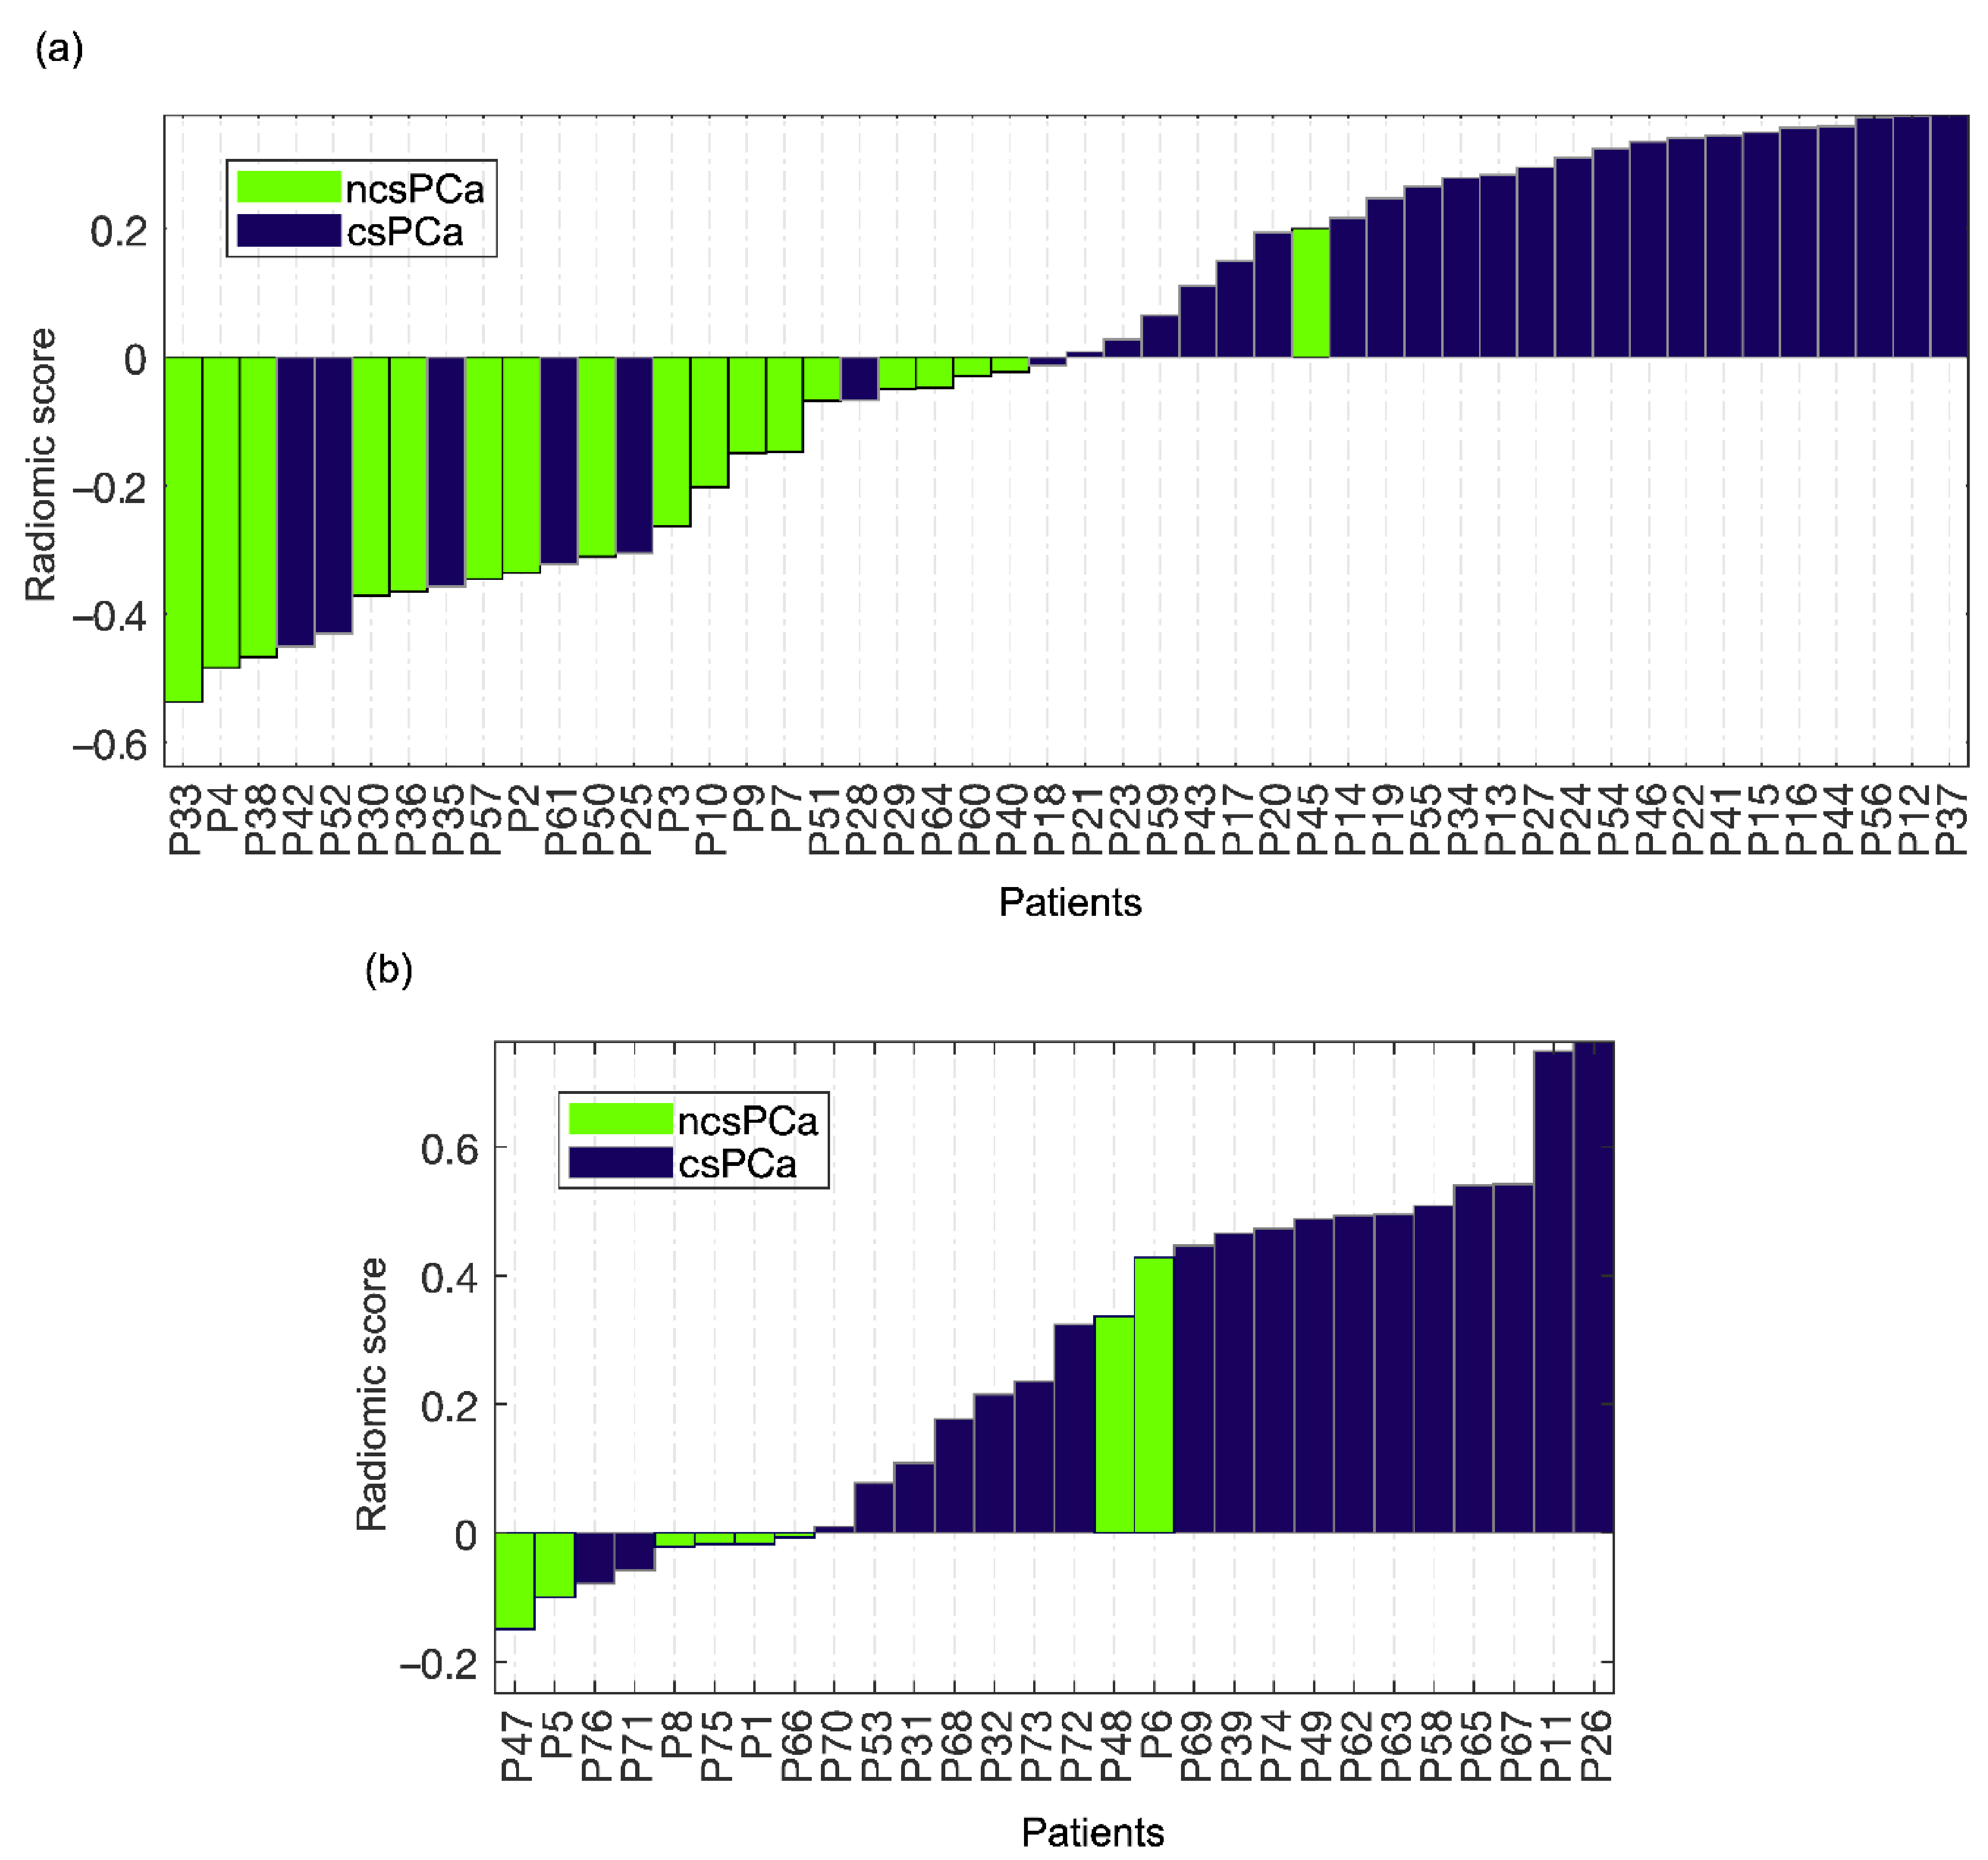
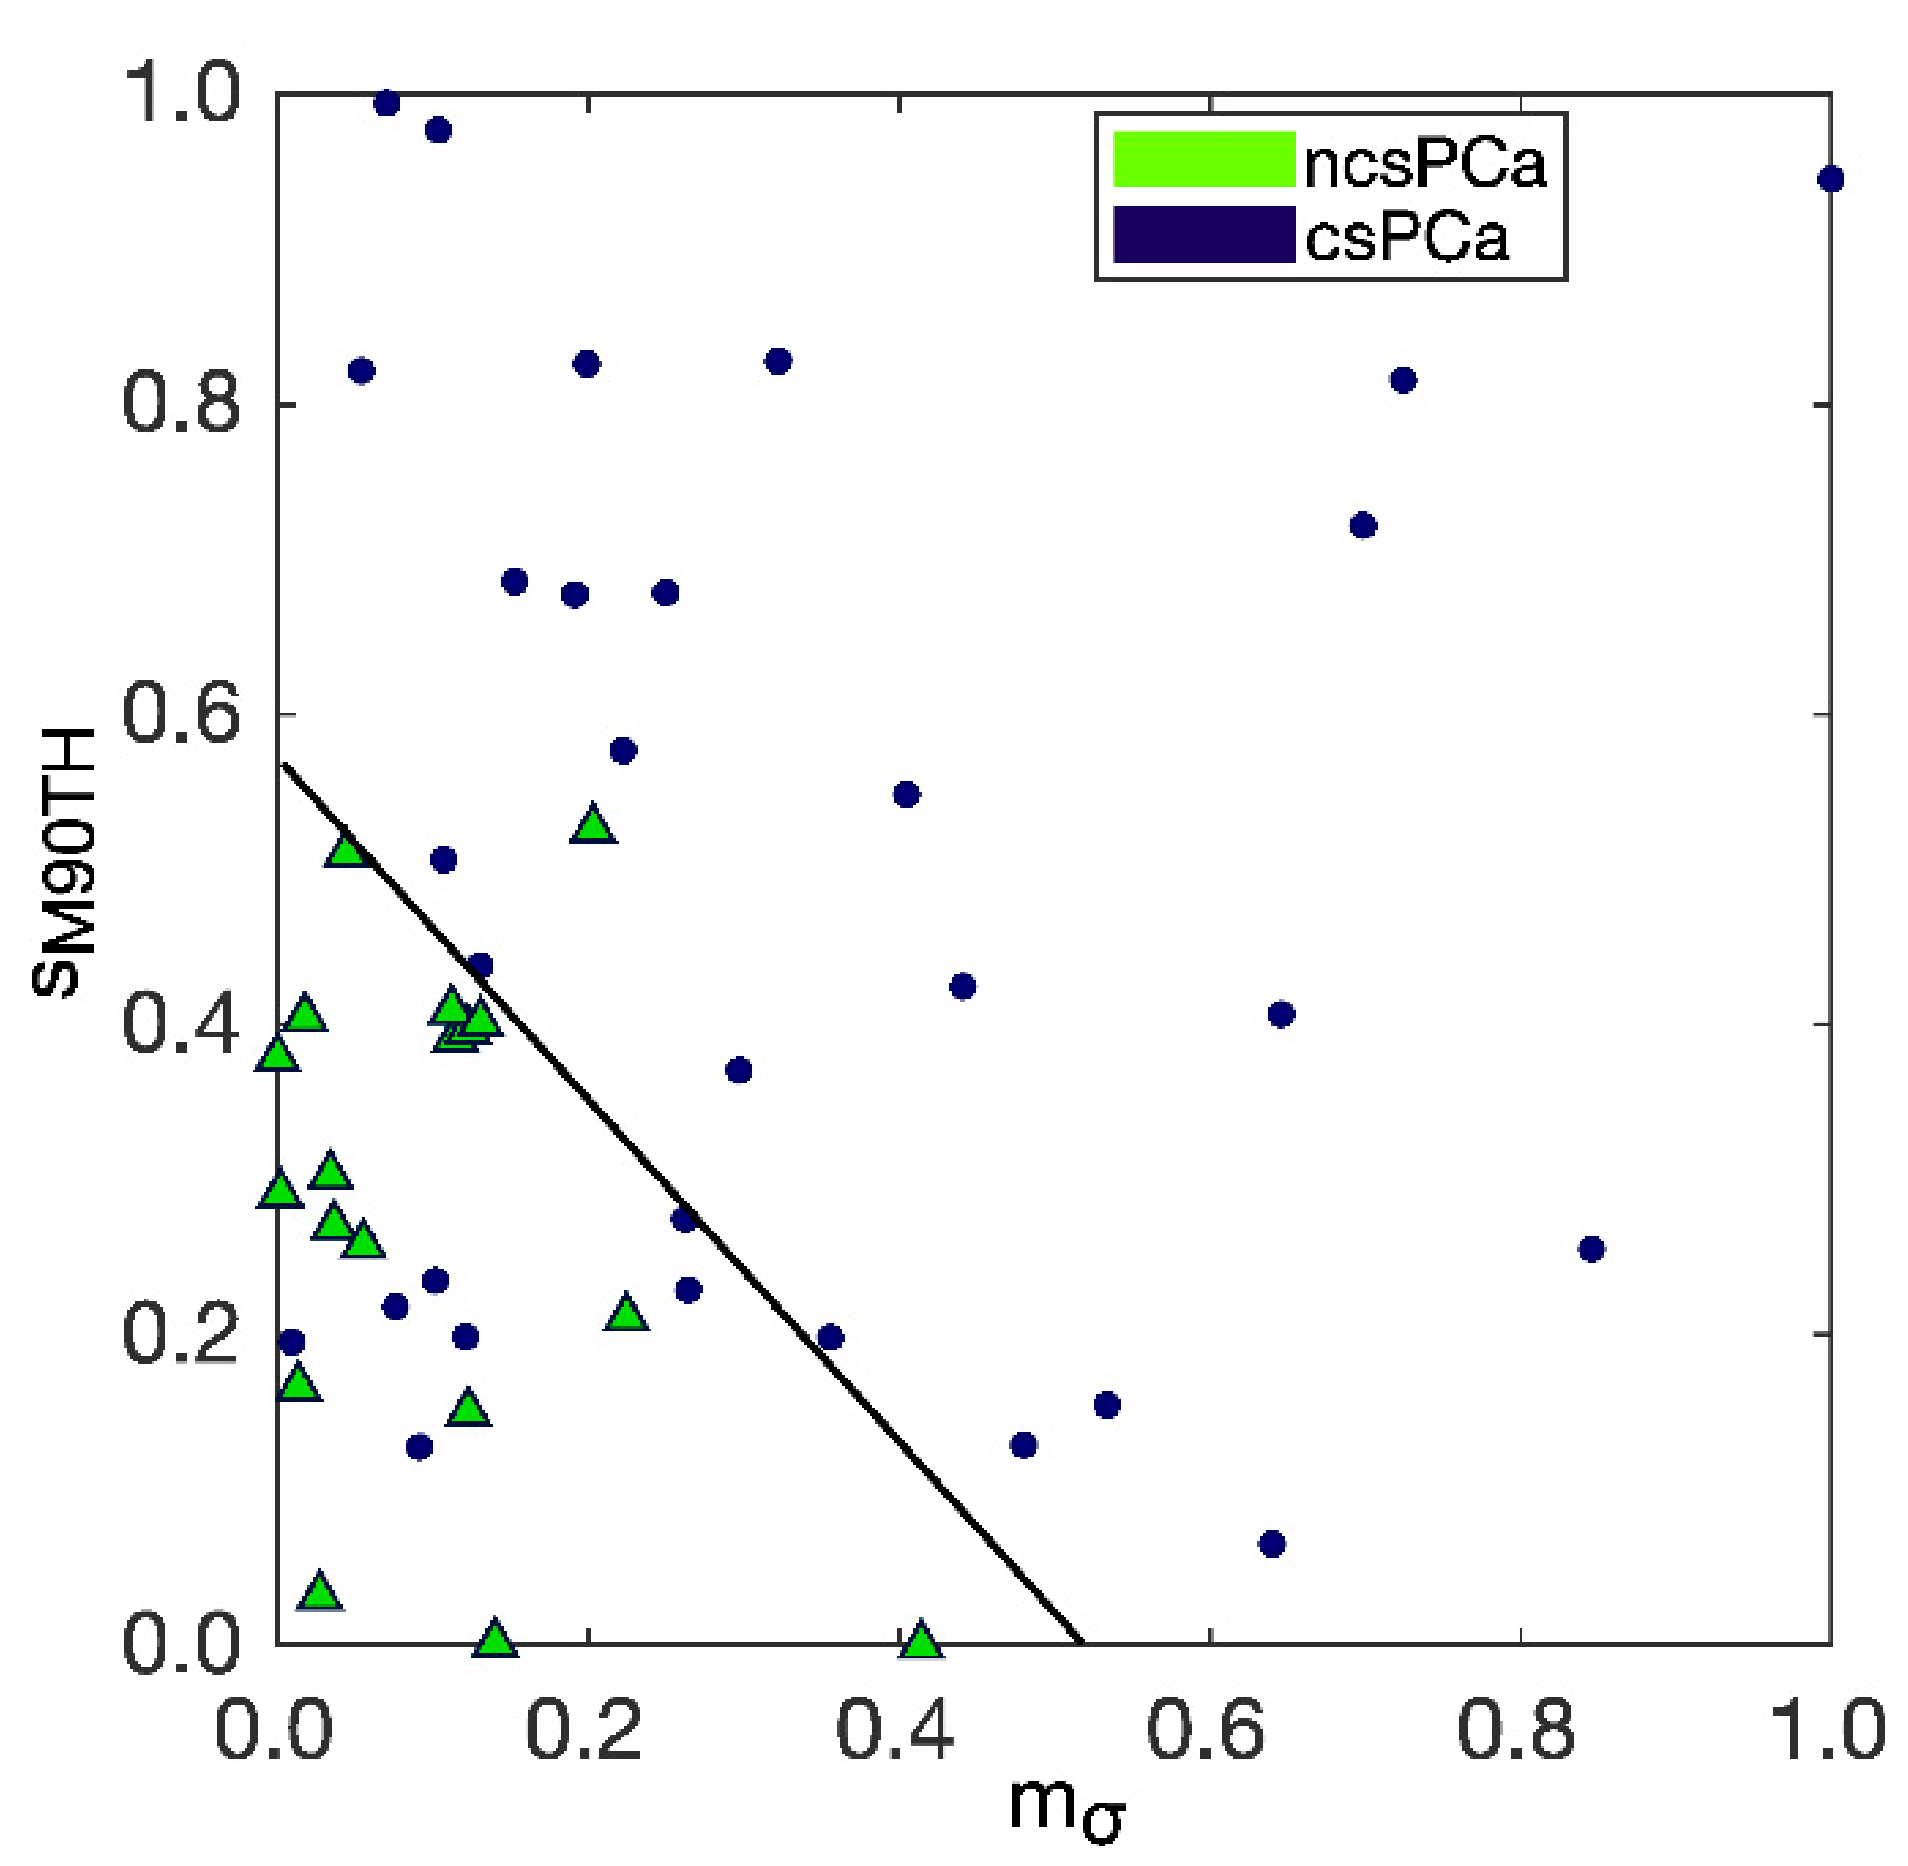
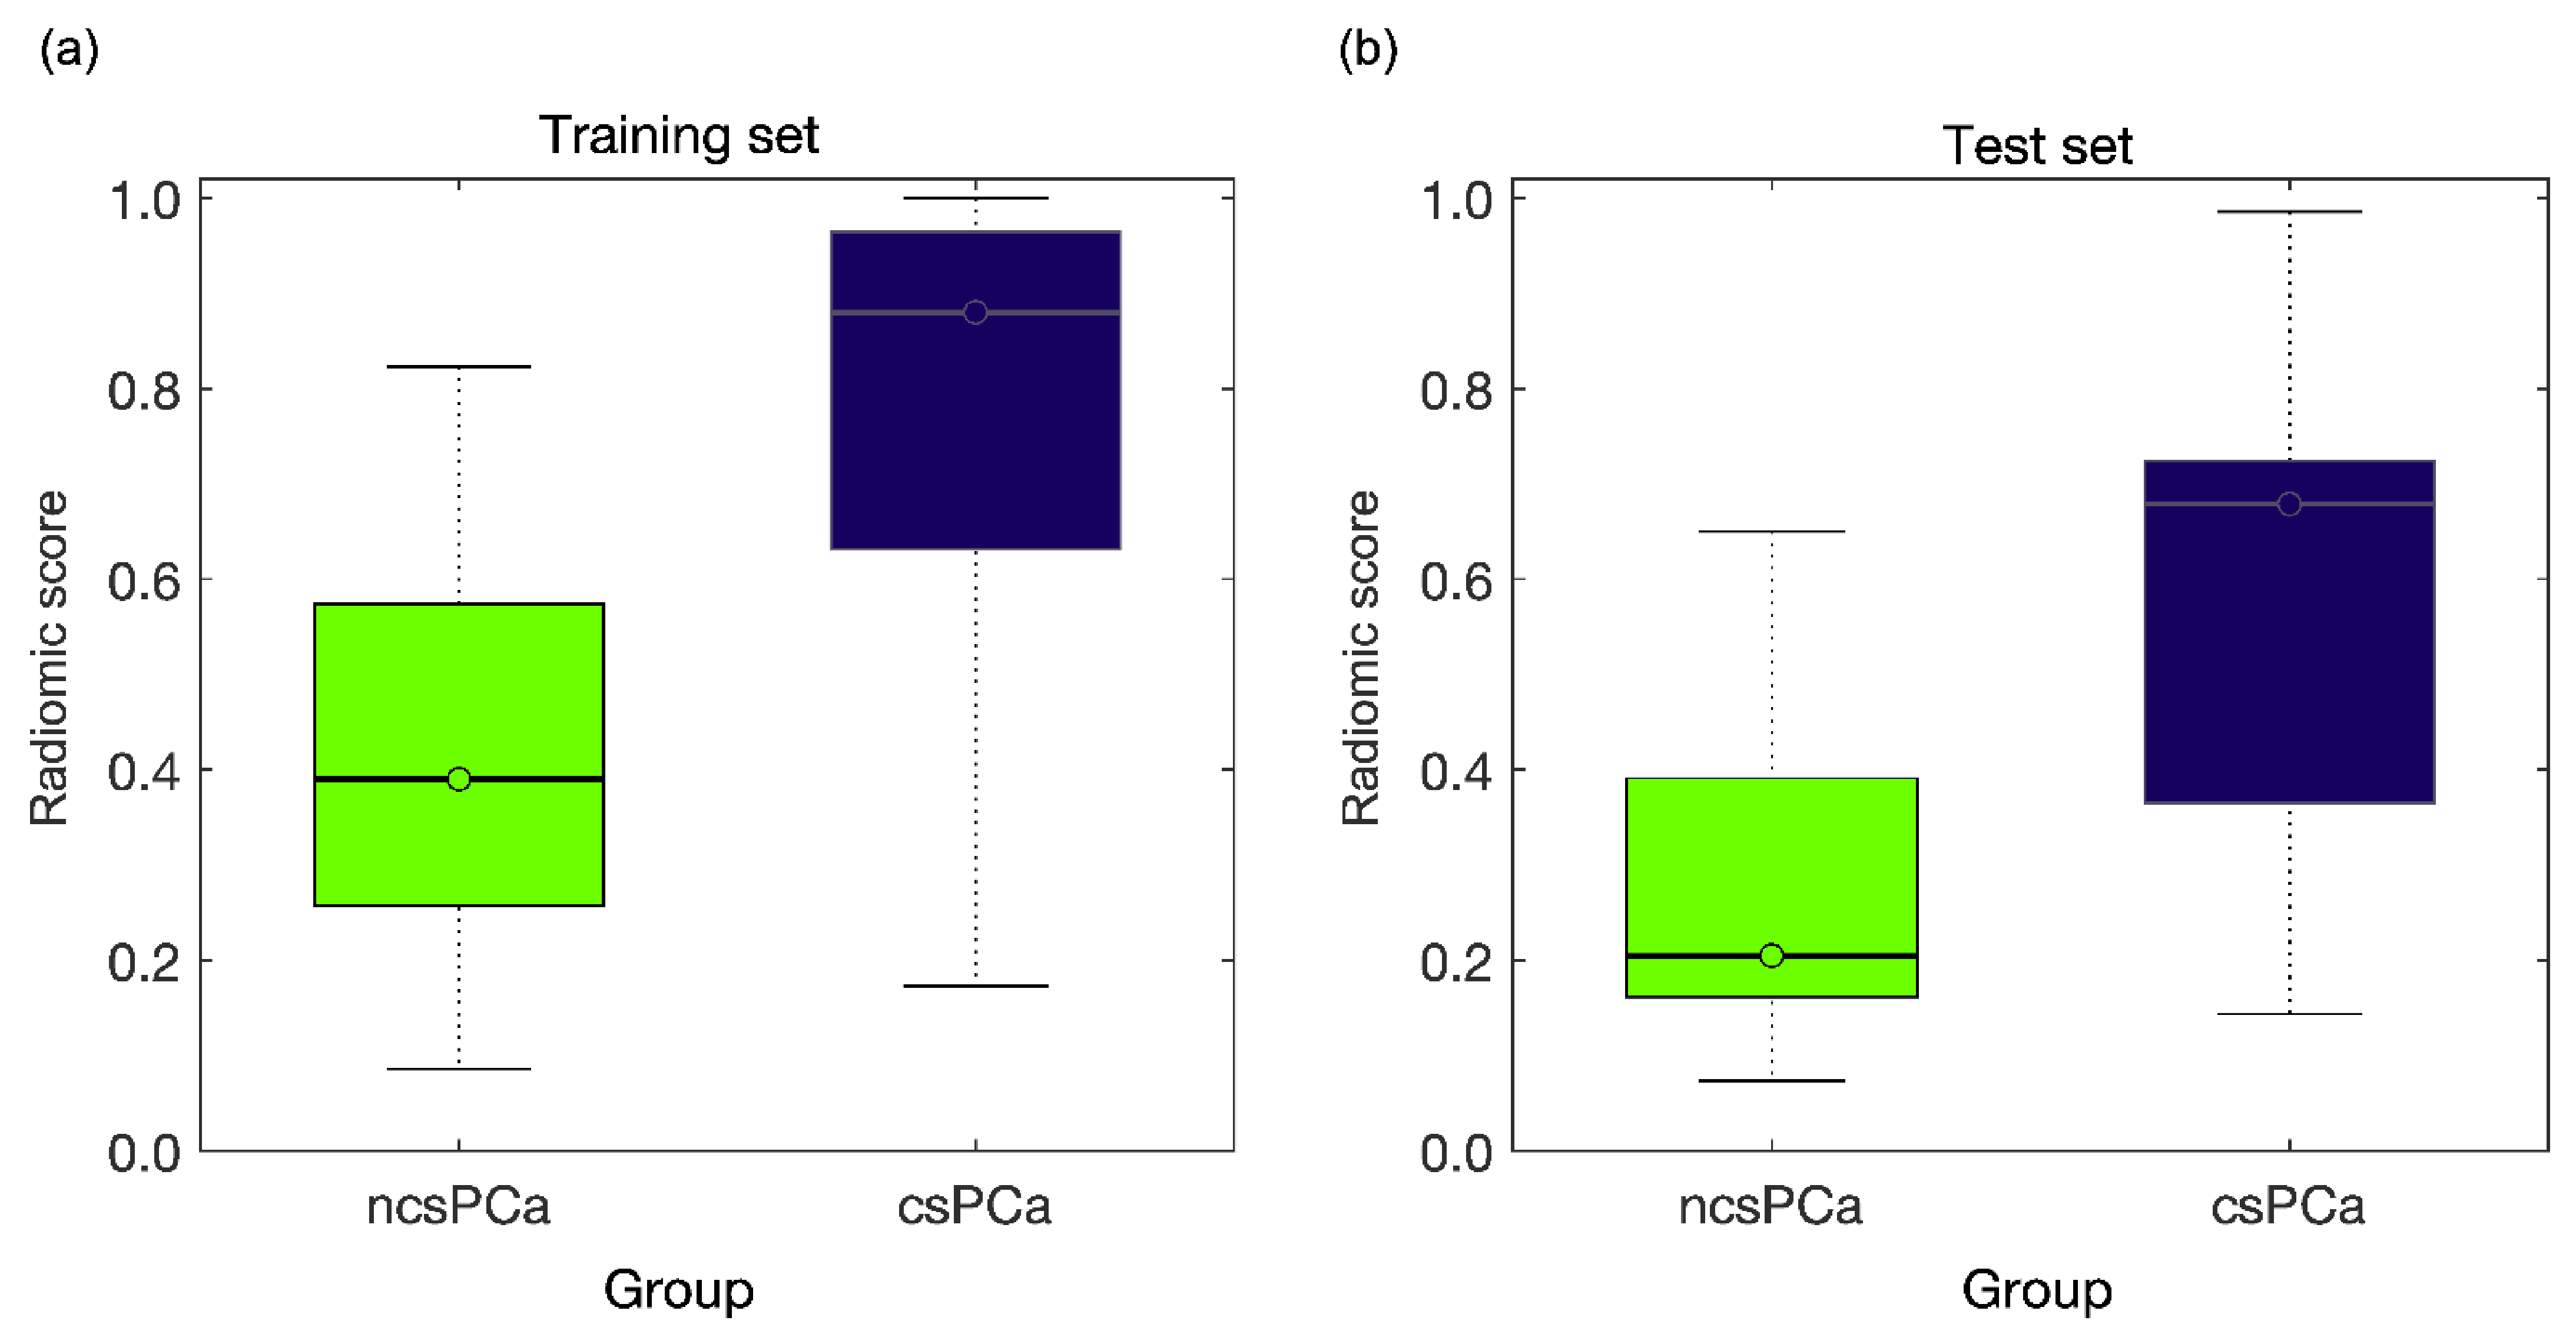
3. Results
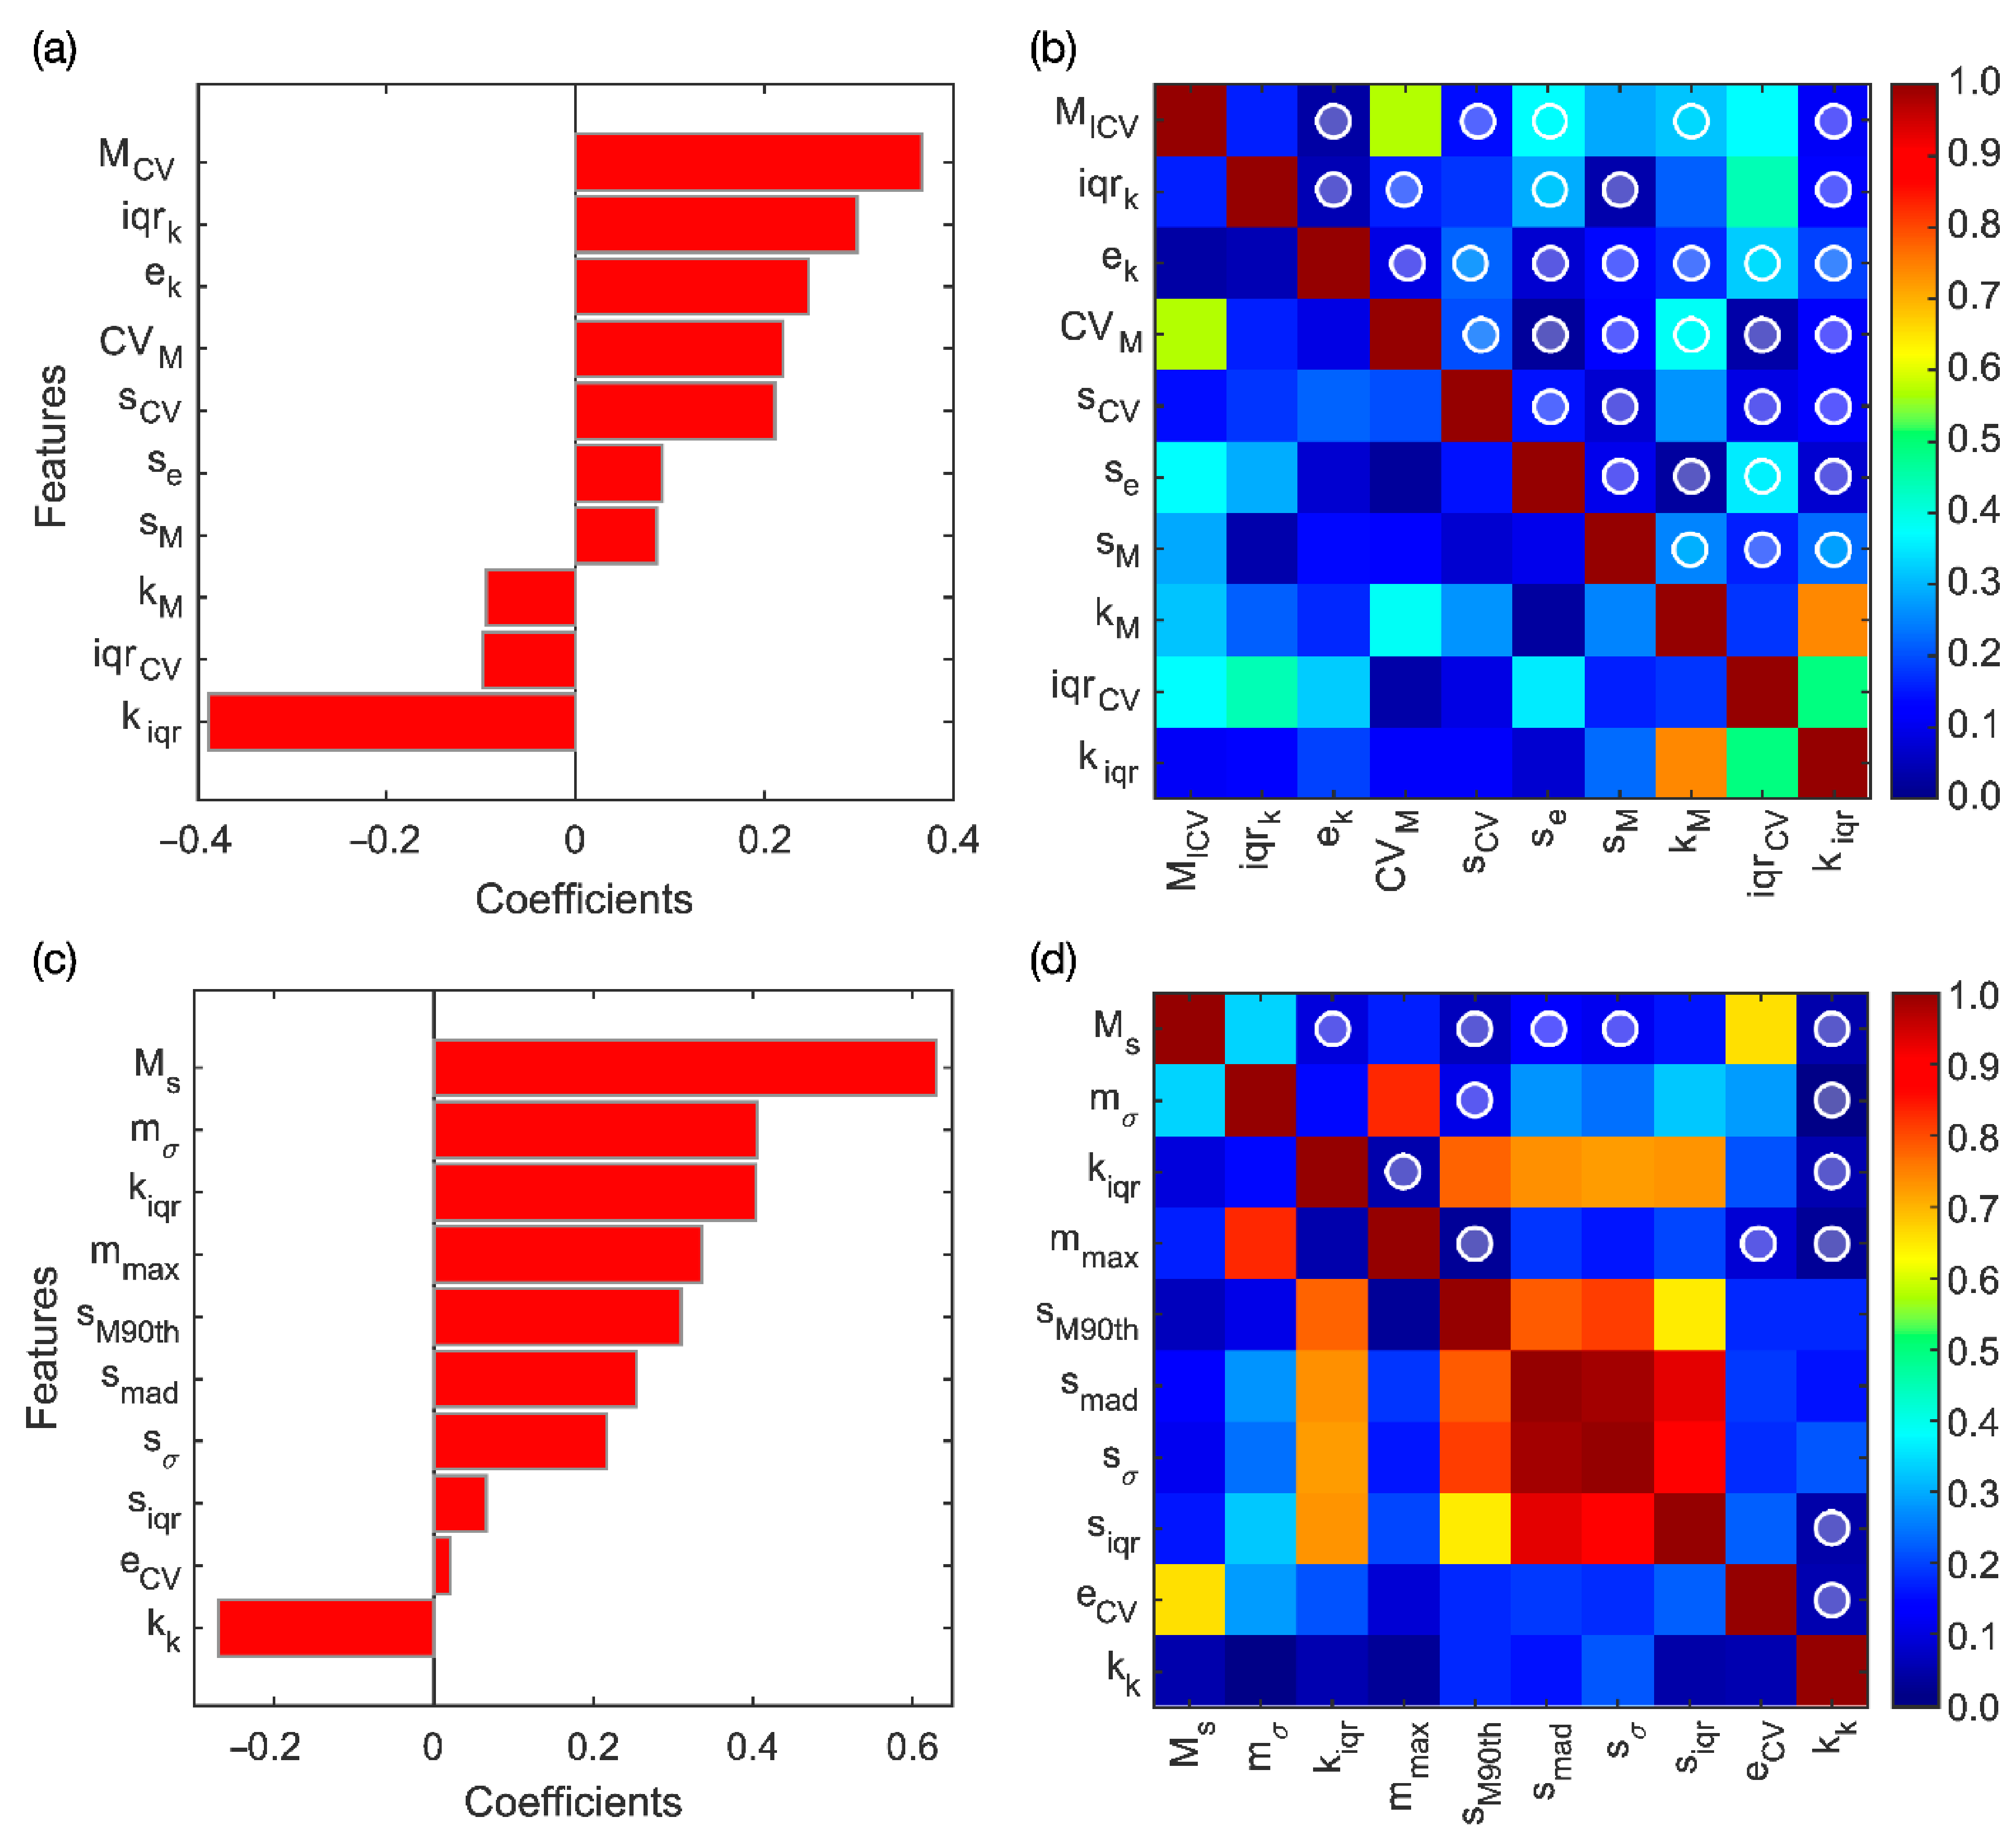
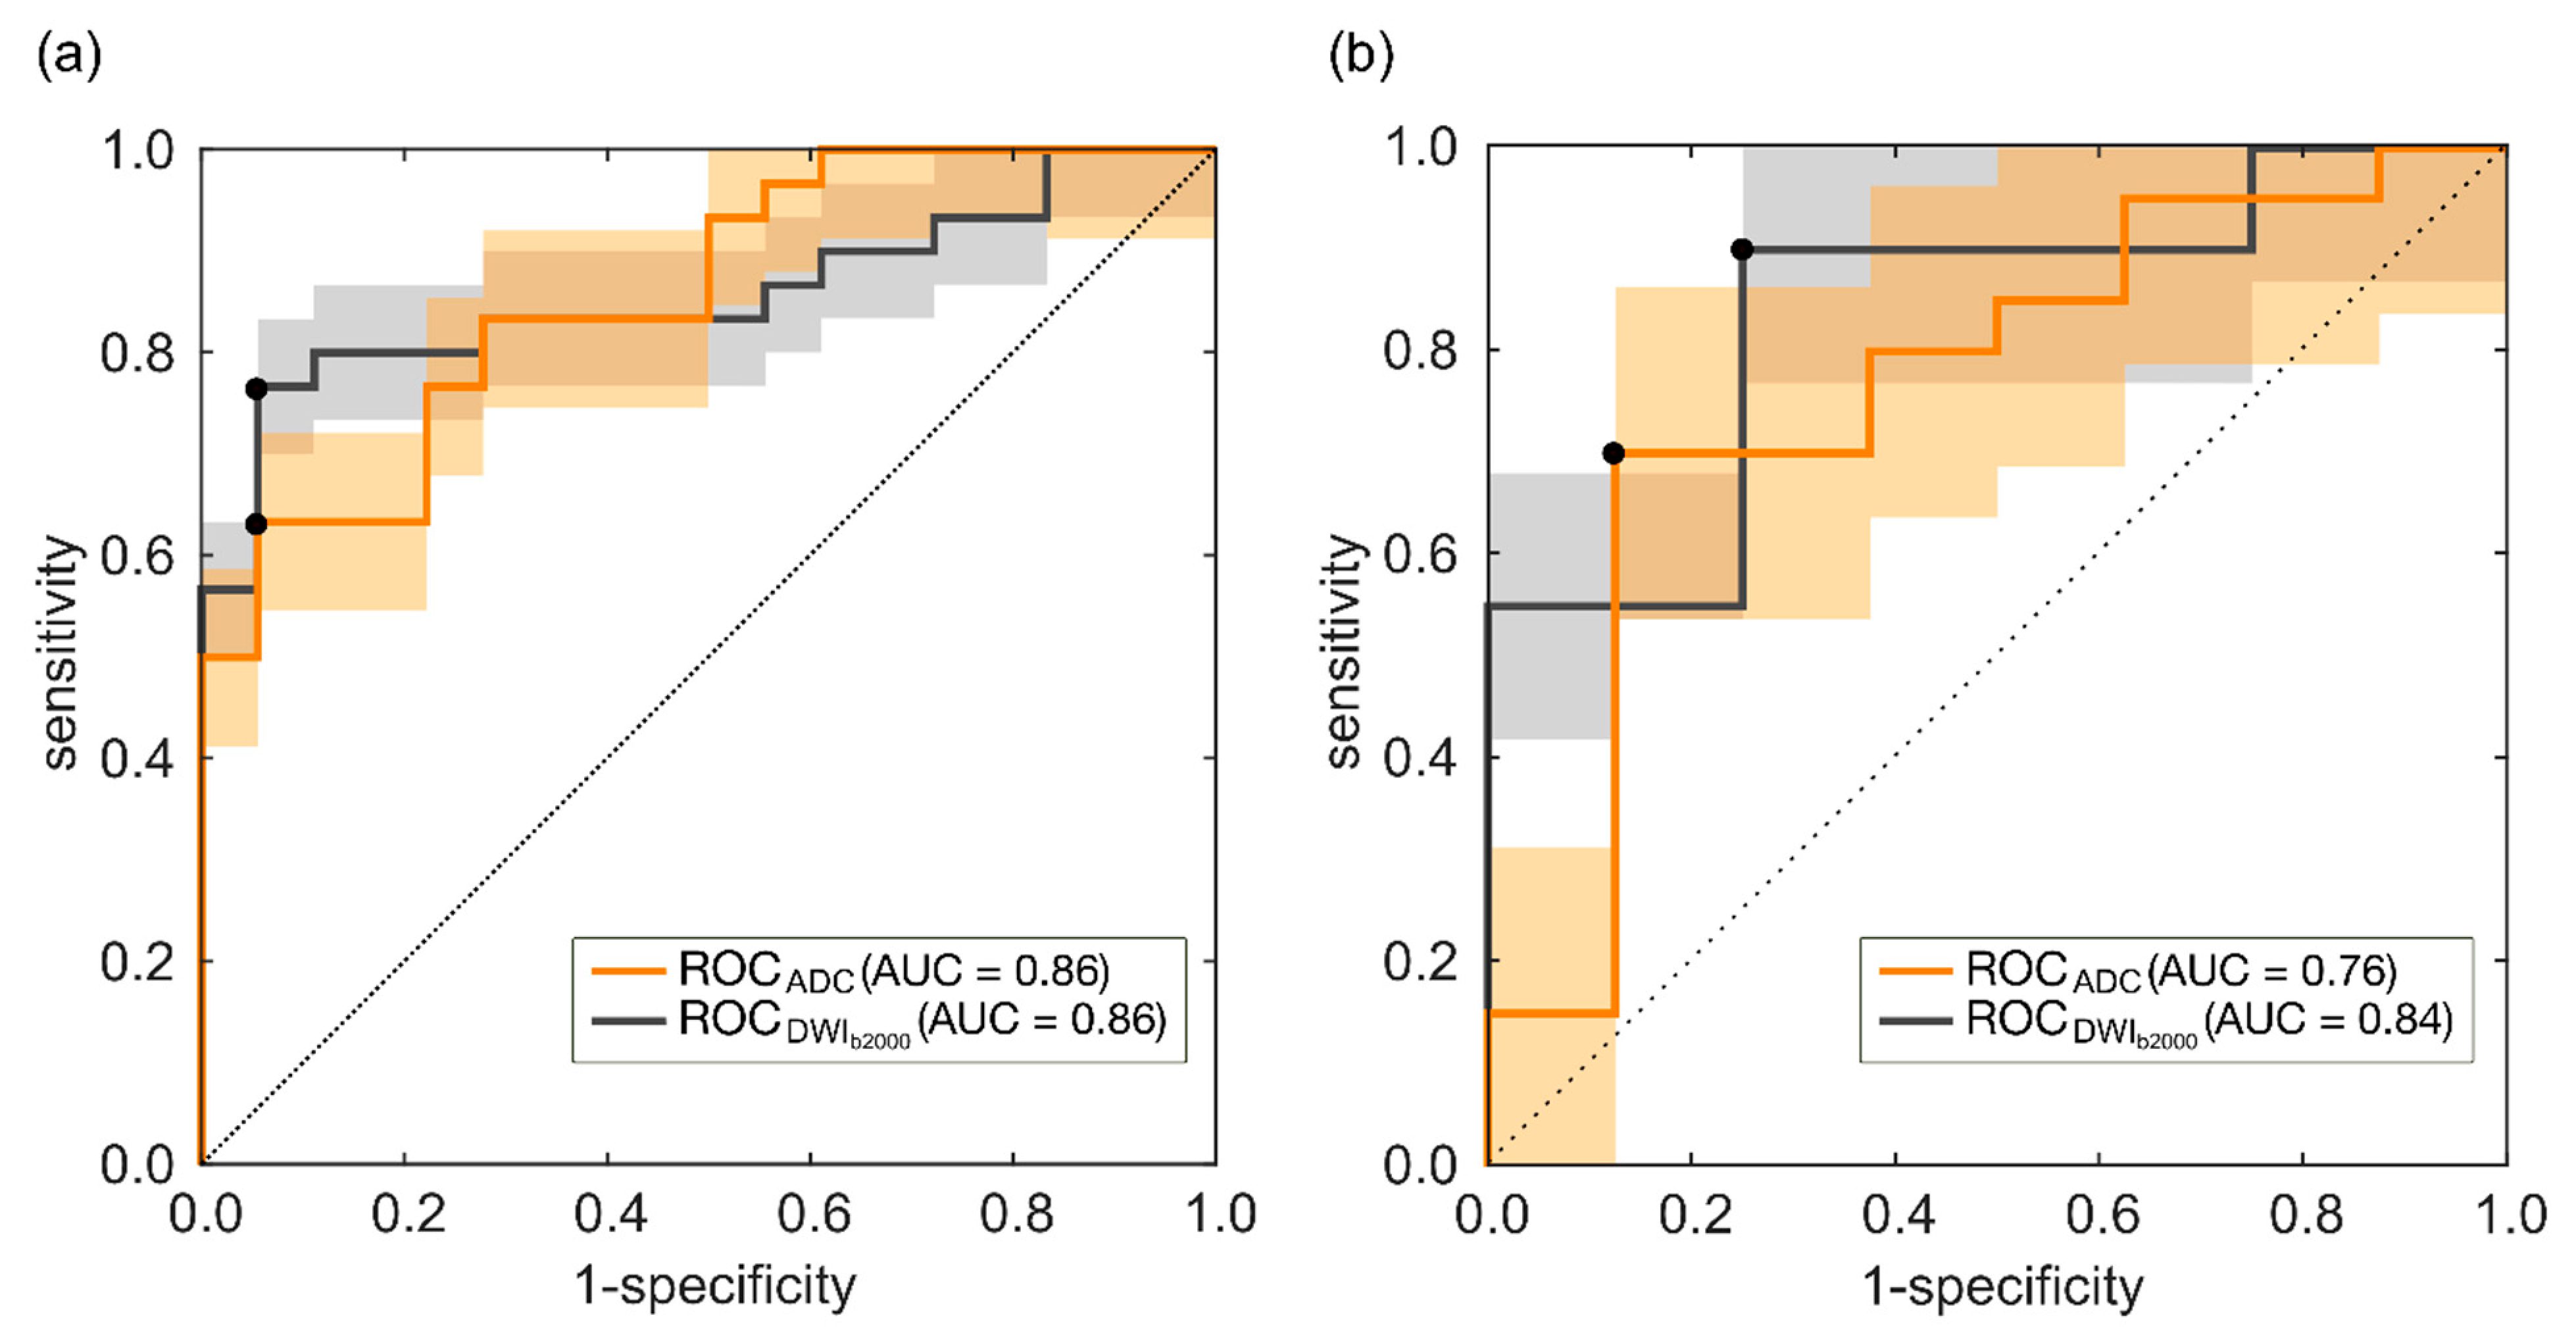
3.1. ADC Model
3.2. DWIb2000 Model
4. Discussion
5. Conclusions
Supplementary Materials
Author Contributions
Funding
Institutional Review Board Statement
Informed Consent Statement
Data Availability Statement
Conflicts of Interest
References
- Paschalis, A.; de Bono, J.S. Prostate Cancer 2020: The Times They Are a’Changing. Cancer Cell 2020, 38, 25–27. [Google Scholar] [CrossRef] [PubMed]
- McClintock, T.R.; Cone, E.B.; Marchese, M.; Chen, X.; Nguyen, P.L.; Sun, M.; Trinh, Q.-D. Prostate cancer management costs vary by disease stage at presentation. Prostate Cancer Prostatic Dis. 2020, 23, 564–566. [Google Scholar] [CrossRef]
- Matoso, A.; Epstein, J.I. Defining clinically significant prostate cancer on the basis of pathological findings. Histopathology 2018, 74, 135–145. [Google Scholar] [CrossRef] [PubMed] [Green Version]
- Turkbey, B.; Rosenkrantz, A.B.; Haider, M.A.; Padhani, A.R.; Villeirs, G.; Macura, K.J.; Tempany, C.M.; Choyke, P.L.; Cornud, F.; Margolis, D.J.; et al. Prostate Imaging Reporting and Data System Version 2.1: 2019 Update of Prostate Imaging Reporting and Data System Version 2. Eur. Urol. 2019, 76, 340–351. [Google Scholar] [CrossRef] [PubMed]
- Parker, C.; Castro, E.; Fizazi, K.; Heidenreich, A.; Ost, P.; Procopio, G.; Tombal, B.; Gillessen, S. Prostate cancer: ESMO Clinical Practice Guidelines for diagnosis, treatment and follow-up. Ann. Oncol. 2020, 31, 1119–1134. [Google Scholar] [CrossRef] [PubMed]
- Noureldin, M.; Eldred-Evans, D.; Khoo, C.C.; Winkler, M.; Sokhi, H.; Tam, H.; Ahmed, H.U. Review article: MRI-targeted biopsies for prostate cancer diagnosis and management. World J. Urol. 2021, 39, 57–63. [Google Scholar] [CrossRef] [PubMed]
- Epstein, J.I.; Feng, Z.; Trock, B.J.; Pierorazio, P.M. Upgrading and downgrading of prostate cancer from biopsy to radical prostatectomy: Incidence and predictive factors using the modified Gleason grading system and factoring in tertiary grades. Eur. Urol. 2012, 61, 1019–1024. [Google Scholar] [CrossRef] [PubMed] [Green Version]
- Berglund, R.K.; Masterson, T.A.; Vora, K.C.; Eggener, S.E.; Eastham, J.A.; Guillonneau, B.D. Pathological Upgrading and Up Staging with Immediate Repeat Biopsy in Patients Eligible for Active Surveillance. J. Urol. 2008, 180, 1964–1968. [Google Scholar] [CrossRef] [PubMed] [Green Version]
- Min, X.; Li, M.; Dong, D.; Feng, Z.; Zhang, P.; Ke, Z.; You, H.; Han, F.; Ma, H.; Tian, J.; et al. Multi-parametric MRI-based radiomics signature for discriminating between clinically significant and insignificant prostate cancer: Cross-validation of a machine learning method. Eur. J. Radiol. 2019, 115, 16–21. [Google Scholar] [CrossRef] [Green Version]
- Chatterjee, A.; Watson, G.; Myint, E.; Sved, P.; McEntee, M.; Bourne, R. Changes in Epithelium, Stroma, and Lumen Space Correlate More Strongly with Gleason Pattern and Are Stronger Predictors of Prostate ADC Changes than Cellularity Metrics. Radiology 2015, 277, 751–762. [Google Scholar] [CrossRef]
- Donners, R.; Blackledge, M.; Tunariu, N.; Messiou, C.; Merkle, E.M.; Koh, D.-M. Quantitative Whole-Body Diffusion-Weighted MR Imaging. Magn. Reson. Imaging Clin. N. Am. 2018, 26, 479–494. [Google Scholar] [CrossRef]
- Bajgiran, A.M.; Mirak, S.A.; Sung, K.; Sisk, A.E.; Reiter, R.E.; Raman, S.S. Apparent diffusion coefficient (ADC) ratio versus conventional ADC for detecting clinically significant prostate cancer with 3-T MRI. Am. J. Roentgenol. 2019, 213, W134–W142. [Google Scholar] [CrossRef]
- Hiremath, A.; Shiradkar, R.; Merisaari, H.; Prasanna, P.; Ettala, O.; Taimen, P.; Madabhushi, A. Test-retest repeatability of a deep learning architecture in detecting and segmenting clinically significant prostate cancer on apparent diffusion coefficient (ADC) maps. Eur. Radiol. 2021, 31, 379–391. [Google Scholar] [CrossRef]
- Barbieri, S.; Brönnimann, M.; Boxler, S.; Vermathen, P.; Thoeny, H.C. Differentiation of prostate cancer lesions with high and with low Gleason score by diffusion-weighted MRI. Eur. Radiol. 2017, 27, 1547–1555. [Google Scholar] [CrossRef]
- Fehr, D.; Veeraraghavan, H.; Wibmer, A.; Gondo, T.; Matsumoto, K.; Vargas, H.A.; Sala, E.; Hricak, H.; Deasy, J.O. Automatic classification of prostate cancer Gleason scores from multiparametric magnetic resonance images. Proc. Natl. Acad. Sci. USA 2015, 112, E6265–E6273. [Google Scholar] [CrossRef] [Green Version]
- Zhang, Y.; Chen, W.; Yue, X.; Shen, J.; Gao, C.; Pang, P.; Cui, F.; Xu, M. Development of a Novel, Multi-Parametric, MRI-Based Radiomic Nomogram for Differentiating Between Clinically Significant and Insignificant Prostate Cancer. Front. Oncol. 2020, 10, 888. [Google Scholar] [CrossRef]
- Bonekamp, D.; Kohl, S.; Wiesenfarth, M.; Schelb, P.; Radtke, J.P.; Götz, M.; Kickingereder, P.; Yaqubi, K.; Hitthaler, B.; Gählert, N.; et al. Radiomic Machine Learning for Characterization of Prostate Lesions with MRI: Comparison to ADC Values. Radiology 2018, 289, 128–137. [Google Scholar] [CrossRef]
- Manenti, G.; Nezzo, M.; Chegai, F.; Vasili, E.; Bonanno, E.; Simonetti, G. DWI of Prostate Cancer: Optimal b-Value in Clinical Practice. Prostate Cancer 2014, 2014, 1–9. [Google Scholar] [CrossRef] [Green Version]
- Agarwal, H.K.; Mertan, F.V.; Sankineni, S.; Bernardo, M.; Senegas, J.; Keupp, J.; Daar, D.; Merino, M.; Wood, B.J.; Pinto, P.A.; et al. Optimal high b-value for diffusion weighted MRI in diagnosing high risk prostate cancers in the peripheral zone. J. Magn. Reson. Imaging 2016, 45, 125–131. [Google Scholar] [CrossRef] [Green Version]
- Mottet, N.; Bellmunt, J.; Bolla, M.; Briers, E.; Cumberbatch, M.G.; De Santis, M.; Fossati, N.; Gross, T.; Henry, A.; Joniau, S.; et al. EAU-ESTRO-SIOG Guidelines on Prostate Cancer. Part 1: Screening, Diagnosis, and Local Treatment with Curative Intent. Eur. Urol. 2017, 71, 618–629. [Google Scholar] [CrossRef]
- Aliza 1.98.18, Aliza Medical Imaging & DICOM Viewer. Available online: https://www.aliza-dicom-viewer.com/ (accessed on 11 September 2020).
- Gibaldi, A.; Barone, D.; Gavelli, G.; Malavasi, S.; Bevilacqua, A. Effects of Guided Random Sampling of TCCs on Blood Flow Values in CT Perfusion Studies of Lung Tumors. Acad. Radiol. 2015, 22, 58–69. [Google Scholar] [CrossRef]
- Bevilacqua, A.; Barone, D.; Baiocco, S.; Gavelli, G. A novel approach for semi-quantitative assessment of reliability of blood flow values in DCE-CT perfusion. Biomed. Signal Process. Control. 2017, 31, 257–264. [Google Scholar] [CrossRef]
- Li, M.; Chen, F.; Kou, J. Candidate Vectors Selection for Training Support Vector Machines. In Proceedings of the Third International Conference on Natural Computation (ICNC 2007), Haikou, China, 24–27 August 2007; pp. 538–542. [Google Scholar]
- Vabalas, A.; Gowen, E.; Poliakoff, E.; Casson, A.J. Machine learning algorithm validation with a limited sample size. PLoS ONE 2019, 14, e0224365. [Google Scholar] [CrossRef]
- von Neumann, J. Model selection and overfitting. Nat. Methods 2016, 13, 703–704. [Google Scholar]
- Schulman, A.A.; Sze, C.; Tsivian, E.; Gupta, R.T.; Moul, J.W.; Polascik, T.J. The Contemporary Role of Multiparametric Magnetic Resonance Imaging in Active Surveillance for Prostate Cancer. Curr. Urol. Rep. 2017, 18, 52. [Google Scholar] [CrossRef]
- Rosario, D.J.; Lane, J.A.; Metcalfe, C.; Donovan, J.L.; Doble, A.; Goodwin, L.; Davis, M.; Catto, J.W.F.; Avery, K.; Neal, D.E.; et al. Short term outcomes of prostate biopsy in men tested for cancer by prostate specific antigen: Prospective evaluation within ProtecT study. BMJ 2012, 344, d7894. [Google Scholar] [CrossRef] [Green Version]
- Cristel, G.; Esposito, A.; Damascelli, A.; Briganti, A.; Ambrosi, A.; Brembilla, G.; Brunetti, L.; Antunes, S.; Freschi, M.; Montorsi, F.; et al. Can DCE-MRI reduce the number of PI-RADS v.2 false positive findings? Role of quantitative pharmacokinetic parameters in prostate lesions characterization. Eur. J. Radiol. 2019, 118, 51–57. [Google Scholar] [CrossRef]
- Rosenkrantz, A.B.; Hindman, N.; Lim, R.P.; Das, K.; Babb, J.S.; Mussi, T.C.; Taneja, S.S. Diffusion-weighted imaging of the prostate: Comparison of b1000 and b2000 image sets for index lesion detection. J. Magn. Reson. Imaging 2013, 38, 694–700. [Google Scholar] [CrossRef]
- Litjens, G.J.S.; Elliott, R.; Shih, N.N.C.; Feldman, M.D.; Kobus, T.; De Kaa, C.H.-V.; Barentsz, J.O.; Huisman, H.J.; Madabhushi, A. Computer-extracted Features Can Distinguish Noncancerous Confounding Disease from Prostatic Adenocarcinoma at Multiparametric MR Imaging. Radiology 2016, 278, 135–145. [Google Scholar] [CrossRef]
- Ahmed, H.U.; Bosaily, A.E.-S.; Brown, L.C.; Gabe, R.; Kaplan, R.; Parmar, M.K.; Collaco-Moraes, Y.; Ward, K.; Hindley, R.G.; Freeman, A.; et al. Diagnostic accuracy of multi-parametric MRI and TRUS biopsy in prostate cancer (PROMIS): A paired validating confirmatory study. Lancet 2017, 389, 815–822. [Google Scholar] [CrossRef] [Green Version]
- Loeb, S.; Bjurlin, M.A.; Nicholson, J.; Tammela, T.L.; Penson, D.F.; Carter, H.B.; Carroll, P.; Etzioni, R. Overdiagnosis and Overtreatment of Prostate Cancer. Eur. Urol. 2014, 65, 1046–1055. [Google Scholar] [CrossRef] [PubMed] [Green Version]
- Grant, K.B.; Agarwal, H.K.; Shih, J.H.; Bernardo, M.; Pang, Y.; Daar, D.; Merino, M.J.; Wood, B.J.; Pinto, P.A.; Choyke, P.L.; et al. Comparison of calculated and acquired high b value diffusion-weighted imaging in prostate cancer. Abdom. Imaging 2015, 40, 578–586. [Google Scholar] [CrossRef] [PubMed] [Green Version]


| Study Parameters | ncsPCa | csPCa |
|---|---|---|
| No. of patients | 26 | 50 |
| Mean ± SD | ||
| Age (years) | 65 ± 8.8 | 66 ± 6.8 |
| PSA (ng/mL) | 5.30 ± 2.97 | 7.80 ± 7.48 |
| Range | ||
| Age (years) | [42÷78] | [48÷79] |
| PSA (ng/mL) | [0.80÷12.20] | [0.38÷37.00] |
| Lesions’ location | ||
| PZ | 25 | 64 |
| TZ | - | 1 |
| CZ | 8 | 10 |
| PZ-TZ 1 | 2 | 1 |
| PZ-CZ 1 | 1 | 3 |
| AFS | - | 1 |
| No. of lesions per PiRADS score | ||
| PI-RADS 3 | 16 | 15 |
| PI-RADS 4 | 16 | 34 |
| PI-RADS 5 | 4 | 33 |
| No. of lesions per GS | ||
| GS 3 + 3 (ISUP 1) | 26 | |
| GS 3 + 4 (ISUP 2) | - | 22 |
| GS 4 + 3 (ISUP 3) | - | 14 |
| GS 4 + 4 (ISUP 4) | - | 8 |
| GS 4 + 5 (ISUP 5) | - | 4 |
| GS 5 + 5 (ISUP 5) | - | 2 |
| DWI Protocol | |
|---|---|
| Coil | Multicoil |
| TR 1 (ms) | [3000, 5804] |
| TE 1 (ms) | [80, 87] |
| No. of slices 1 | [24, 33] |
| Slice thickness (mm) | 3 |
| Slice gap (mm) | 3 |
| b values (s/mm2) | 0, 50, 100, 150, 200, 250, 800, 1500, 2000 |
| No. of gradients | 3 |
| Field of view 1 (mm2) | [160, 260] |
| Acquisition matrix 1 | [96, 176] |
| Pixel spacing 1 (mm) | [1.41, 1.67] |
| Year | Author | mpMRI Sequences | Features | AUC | SE | SP | I |
|---|---|---|---|---|---|---|---|
| 2015 | Fehr et al. [15] | T2w, ADC | 18 RFs | 0.83 | - | - | - |
| 2017 | Barbieri et al. [14] | ADC, IVIM | ADCmean (b[0–900]) | 0.79 | 0.85 | 0.74 | 0.59 |
| 2018 | Bonekamp et al. [17] | T2w, ADC | 10 RFs | 0.88 | 0.97 | 0.58 | 0.55 |
| 2019 | Cristel et al. [29] | DCE-MRI | Ktrans | 0.75 | 0.95 | 0.61 | 0.56 |
| 2019 | Min et al. [9] | T2w, ADC, DWIb1500 | 9 RFs | 0.82 | 0.84 | 0.73 | 0.57 |
| 2020 | Zhang et al. [16] | T2w, ADC, DWI | 10 RFs | 0.81 | 0.80 | 0.73 | 0.53 |
| 2020 | Hiremath et al. [13] | ADC | ADCmean (b[0–1300]) | 0.85 | 0.77 | 0.81 | 0.58 |
| 2021 | Our study | ADC | 2 RFs | 0.76 | 0.70 | 0.88 | 0.58 |
| 2021 | Our study | DWIb2000 | 2 RFs | 0.84 | 0.90 | 0.75 | 0.65 |
Publisher’s Note: MDPI stays neutral with regard to jurisdictional claims in published maps and institutional affiliations. |
© 2021 by the authors. Licensee MDPI, Basel, Switzerland. This article is an open access article distributed under the terms and conditions of the Creative Commons Attribution (CC BY) license (https://creativecommons.org/licenses/by/4.0/).
Share and Cite
Bevilacqua, A.; Mottola, M.; Ferroni, F.; Rossi, A.; Gavelli, G.; Barone, D. The Primacy of High B-Value 3T-DWI Radiomics in the Prediction of Clinically Significant Prostate Cancer. Diagnostics 2021, 11, 739. https://doi.org/10.3390/diagnostics11050739
Bevilacqua A, Mottola M, Ferroni F, Rossi A, Gavelli G, Barone D. The Primacy of High B-Value 3T-DWI Radiomics in the Prediction of Clinically Significant Prostate Cancer. Diagnostics. 2021; 11(5):739. https://doi.org/10.3390/diagnostics11050739
Chicago/Turabian StyleBevilacqua, Alessandro, Margherita Mottola, Fabio Ferroni, Alice Rossi, Giampaolo Gavelli, and Domenico Barone. 2021. "The Primacy of High B-Value 3T-DWI Radiomics in the Prediction of Clinically Significant Prostate Cancer" Diagnostics 11, no. 5: 739. https://doi.org/10.3390/diagnostics11050739