Analysis of 5G New Radio Uplink Signals on an Analogue-RoF System Based on DSP-Assisted Channel Aggregation


Department of Electronics and Telecommunications, Politecnico di Torino, C.so Duca degli Abruzzi 29, 10129 Torino, Italy
*
Author to whom correspondence should be addressed.
Appl. Sci. 2019, 9(1), 47; https://doi.org/10.3390/app9010047
Submission received: 16 October 2018
/
Revised: 13 December 2018
/
Accepted: 20 December 2018
/
Published: 24 December 2018
(This article belongs to the Special Issue Optical Communications and Networking Solutions for the Support of C-RAN in 5G Environments)
Abstract
:The 3rd Generation Partnership Project (3GPP) is in the process of developing 5th generation (5G) radio access technology, the so-called new radio (NR). The aim is to achieve the performance requirements forIMT-2020 radio interface technology. In this paper, we focus on the analysis of the transmission of 5G NR uplink physical channels, such as physical uplink shared channel (PUSCH) and physical uplink control channel (PUCCH), dedicated for data and control channels, respectively, as specified in the 3GPP standard, using digital signal processing (DSP)-assisted frequency division multiple access (FDMA) and time division multiple access (TDMA) channel aggregation techniques on an analogue radio-over-fiber (A-RoF) architecture. We verified that there is ~34% spectral efficiency gain and lower error vector magnitude (EVM) achieved using the TDMA technique.
1. Introduction
New technologies such as automated intelligence, autonomous vehicles, the Internet of Things (IoT), high quality Internet Protocol (IP) telephony, broadcasting televisions (TVs), and high-speed data communication, among others, are becoming a reality. These technologies require faster, high capacity, quality of service (QoS) guaranteed, reliable, and continuous inter-connectivity among users and devices [1,2]. To fulfill such demand, the 5th generation (5G) mobile communication system is underway to provide an unparalleled connected mobile society by the year 2020 [3]. This new mobile paradigm will thus require significant technology advancement in both wireless and optical access networks. The centralized/cloud radio access network (C-RAN) architecture is an emerging enabling technology introduced into 5G networks, and is supposed to provide reduced capital expenditure (CAPEX) and operational expenditure (OPEX), high spectral efficiency, and low energy consumption [4]. Fifth generation (5G) C-RAN is proposed to support 5G mobile technology and enhance the RAN performance by centralizing the base-band unit (BBU) pool to hundreds or thousands of remote radio heads (RRHs), which transparently forwarded the received signal waveforms to the BBU via optical fronthaul links. In this way, 5G C-RAN highly simplifies the functionalities of the RRHs. Fronthaul is a paramount constituent in 5G C-RAN architecture, usually categorized as digitized radio-over-fiber (D-RoF) and analogue radio-over-fiber (A-RoF). The common public radio interface (CPRI) is the most commonly used D-RoF interface in the current C-RAN architecture designed for long-term evolution-advanced (LTE-A) networks [5]. Because CPRI transmits in phase and quadrature phase (IQ) samples converted into bit streams over fiber links using a spectrally inefficient on–off keying format, it requires very large bandwidth. For example, transporting 8 × 8 multiple input-multiple output (MIMO ) 3-sector 8 × 100 MHz new radio (NR) waveforms requires a CPRI data rate of 147.456 Gb/s [6], which is impractical to implement in the 5G application. A-RoF is a fronthaul alternative used as a technique of aggregating massive NR waveforms on a single wavelength. As the bandwidth required in A-RoF for the fiber network depends directly on the wireless bandwidth, it mitigates the huge bandwidth requirement of CPRI. Moreover, it consumes a low amount of power and can be used in mm-wave frequency bands for 5G access networks. Therefore, A-RoF can be considered as a possible candidate for the future fronthaul network [6,7].
The key goal of this work is to analyze the A-RoF using digital signal processing (DSP)-based time division multiple access (TDMA) and frequency division multiple access (FDMA) channel aggregation techniques of multiple bandwidth uplink NR waveforms with respect to spectral efficiency and error vector magnitude (EVM) performance. To achieve this, we first simulated 5G NR uplink physical channels based on scalable subcarrier spacings (SCs) that corresponds to 50 MHz, 100 MHz, 200 MHz, and 400 MHz of bandwidth parts, each consisting of control physical uplink control channel (PUCCH) and data physical uplink shared channel (PUSCH), devoted for control and data transmission, respectively.
The paper is organized as follows: Section 2 provides a brief overview of uplink channels specified in 3rd Generation Partnership Project (3GPP) technical specification. Section 3 describes the DSP setup of the two aggregation (FDMA and TDMA) techniques over intensity modulation and direct detection (IM-DD) optical fronthauling link. In Section 4, we present the simulation results obtained from setup of Section 2. Section 5 concludes the work presented by summarizing the outcome.
2. NR Uplink Channels Overview
The 3GPP specifies the frame structure, physical resources, and bandwidth parts of NR signals [8,9]. In this work, we focus on the analysis of physical uplink channels that correspond to a set of resource element carrying information originating from a higher layer, such as PUCCH and PUSCH, generated using the conventional cyclic prefix orthogonal frequency division multiplexing (CP-OFDM) technique. Uplink transmission is organized into frames of 10 ms in duration, where each frame is subdivided into slots of 0.5 ms. We consider format #0 PUCCH modulated using quadrature phase shift keying (QPSK) modulation and having a length of two consecutive OFDM symbols per slot for the control information, and for PUSCH data part modulated using 64 QAM modulation format.
Unlike the LTE-A single 15 kHz subcarrier spacing (SCs) option, NR supports scalable SCs. The considered NR parameters for each type of SCs are summarized in Table 1.
3. System Setup
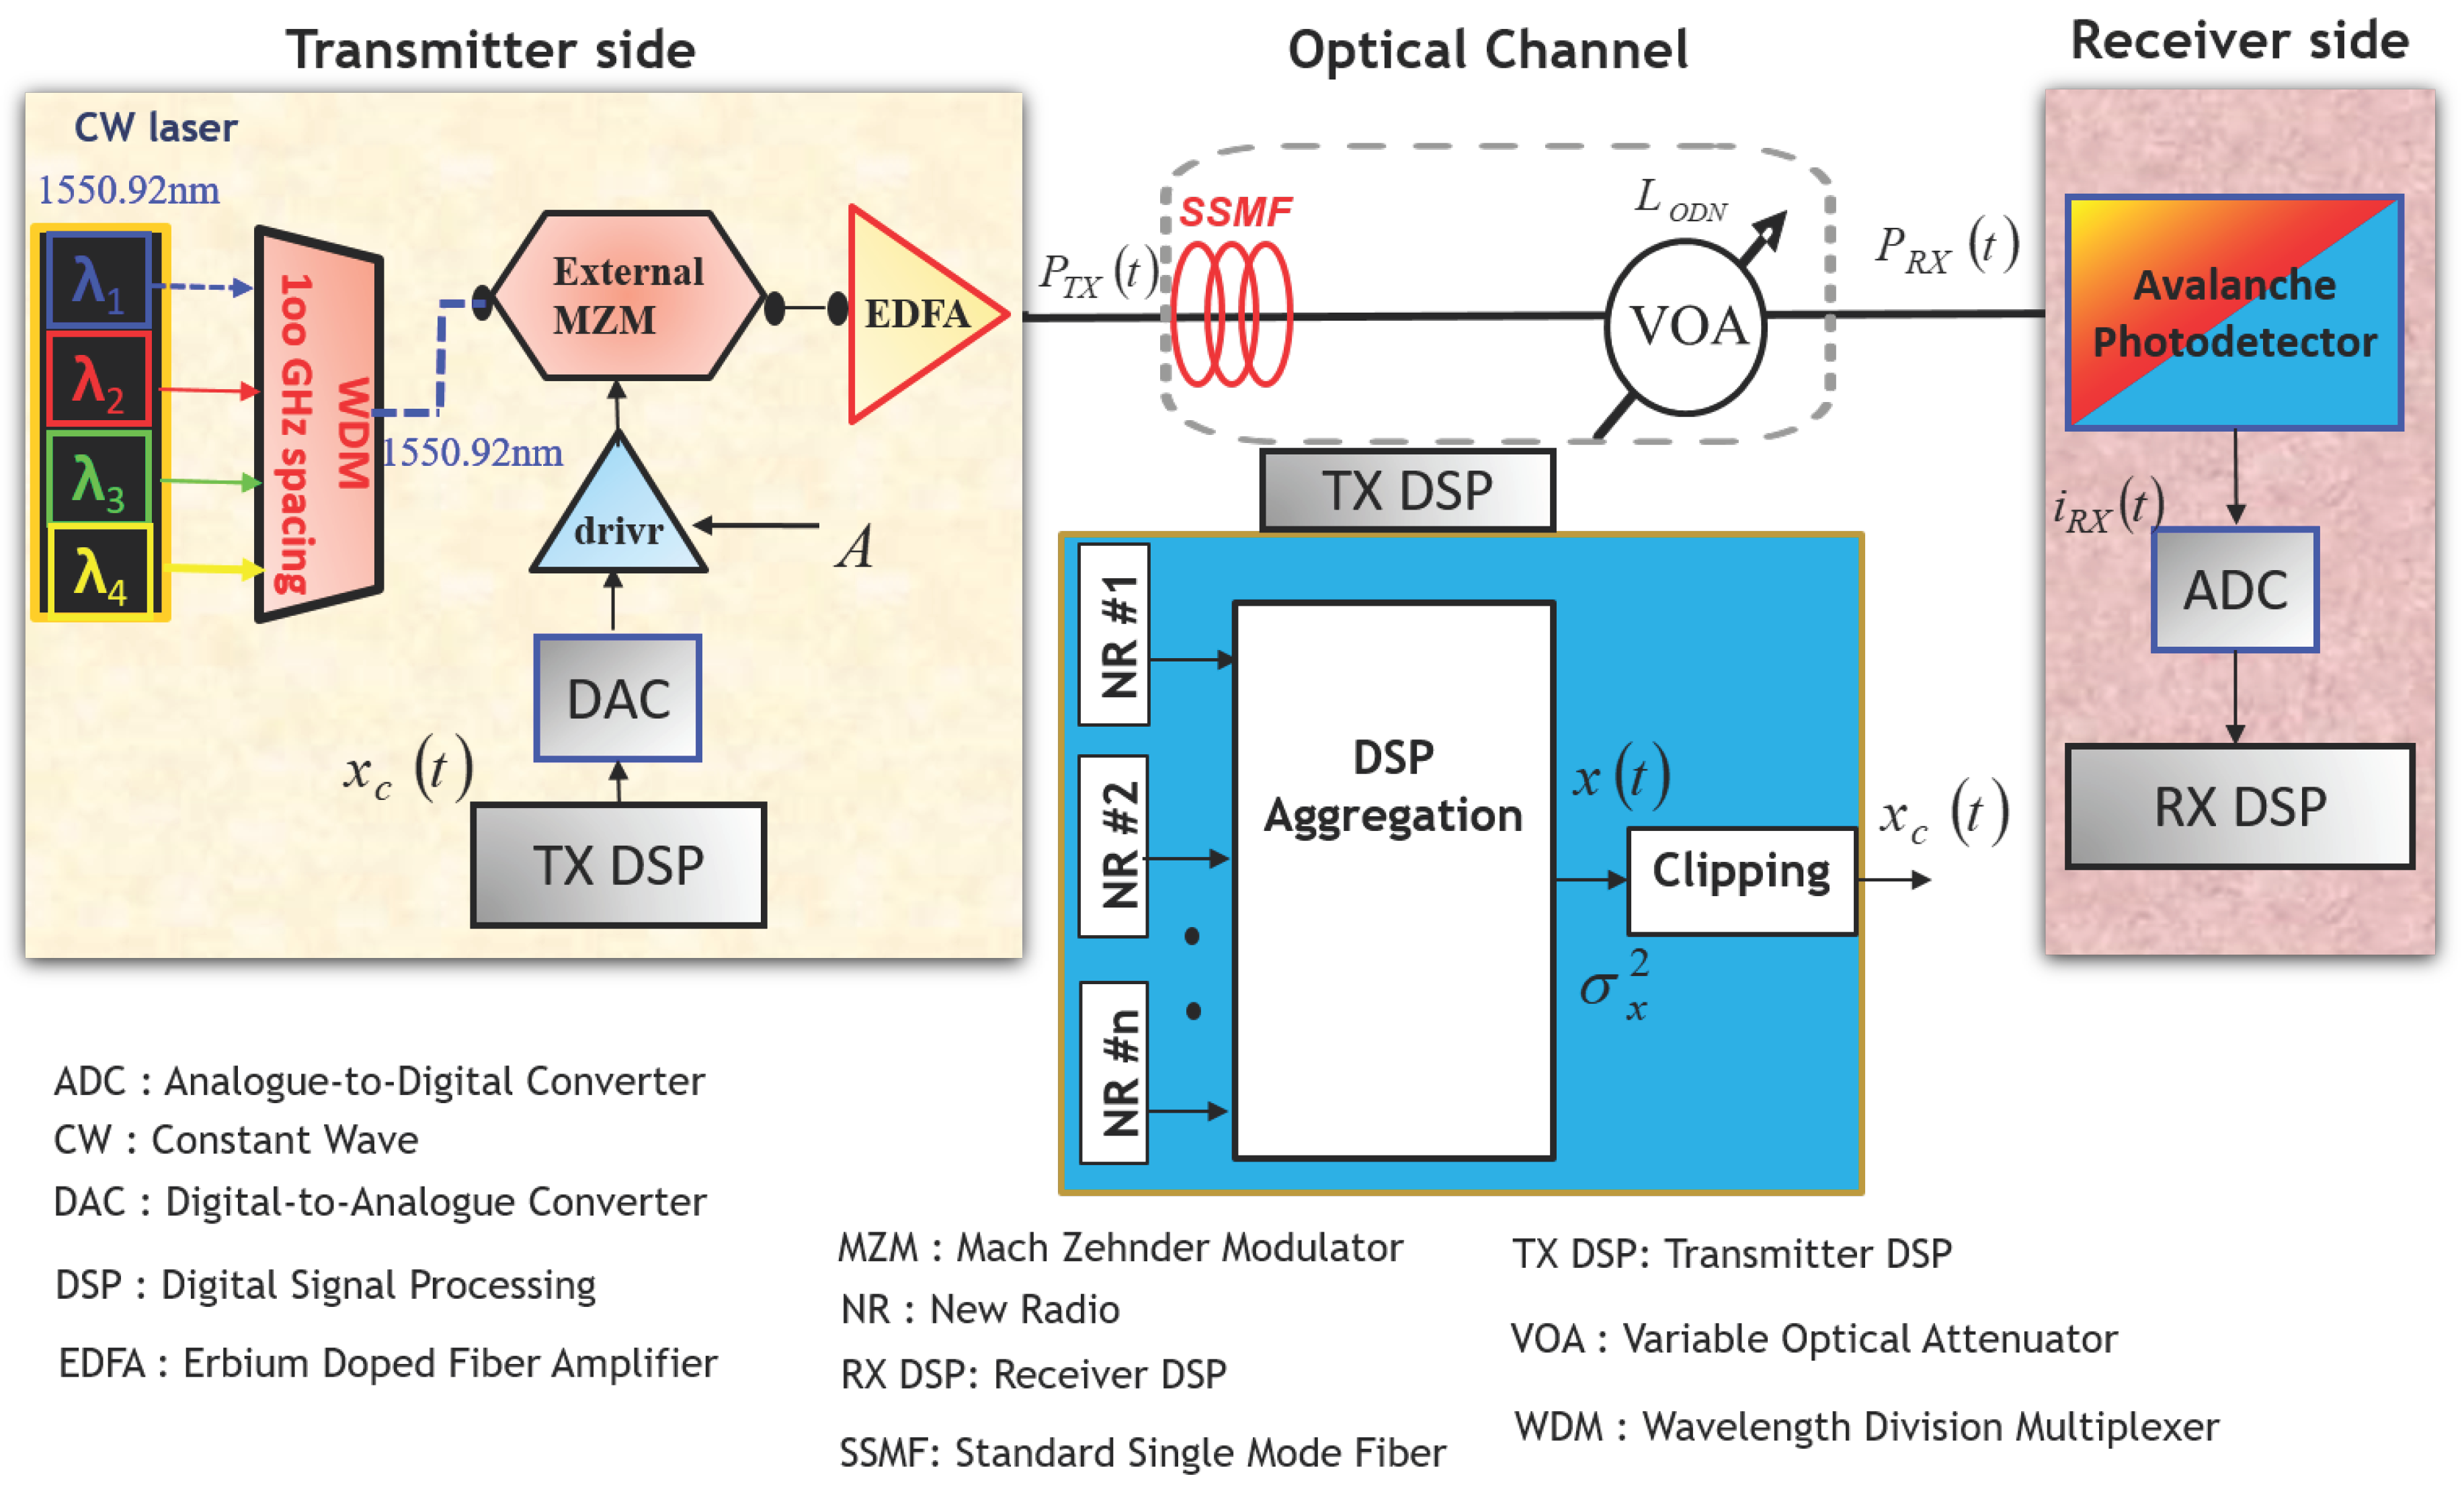
The IM-DD optical link used to elaborate the proposed A-RoF architecture that can be implemented in the dense wavelength multiplexed passive optical networks (wavelength division multiplexer (WDM)/passive optical network (PON)) infrastructure is shown in Figure 1. The emulated optoelectronics devices parameters are taken from the experimental demonstration reported in the work of [10]. At the transmitter side, the digital-to-analogue converter (DAC) is modelled with a sampling rate of 12-GSa/s and vertical resolution of 10 bits. It is used to convert the offline generated DSP waveforms in Matlab© based on either FDMA or TDMA aggregation schemes to analogue signal. The driver is used to drive the electrical analogue signal to the external Mach–Zehnder modulator (MZM) radio frequency (RF) input. The external MZM is modelled using the following parameters: extinction ratio (ER) = 27.8 dB, insertion loss (IL) = 1.8 dB, radio frequency (RF) electrode voltage = 3.0 V, direct current (DC) bias voltage = V, and modulation index M = 100 %. It is used to modulate the continuous wave (CW) optical carrier. The CW laser source is assumed to be phase and amplitude noiseless, and is capable of generating CW lasers at different wavelengths, spaced by 100 GHz. WDM is used to select the desired single wavelength, for instance, filter λ1 operating at a wavelength of 1550.92 nm. The instantaneous optical signal at the output of the external MZM is then amplified by the erbium doped fiber amplifier (EDFA), which is used to maintain the average transmitted output optical power to a fixed value. The optical channel is realized by considering the optical signal propagation into standard single mode fiber (SSMF), characterized by having a chromatic dispersion CD = 17 and length L = 25 km. The optical channel targeting low-cost optoelectronics, the overall electrical-to-electrical transfer function, has a pole at 5 GHz that is is emulated by a fourth order Bessel filter. A variable optical attenuator (VOA) is used to control the optical distribution network (ODN) loss of the link. At the receiver side, the avalanche photodetector (APD) that is typical of the next generation passive optical networks (NG-PON2) architecture is modelled by assuming that the noise contribution arises from Gaussian amplified shot noise, receiver electrical thermal noise in the receiver circuitry, and dark current noise, which are independent and identically distributed [11]. The analogue-to-digital converter (ADC) is modelled using eight quantization bits [12]. The transmitter (TX) and receiver (RX) digital signal processing (DSP) functionalities of FDMA and TDMA approaches are represented by the block diagrams shown in Figure 2 and Figure 3, respectively, and are described in the following subsection.
3.1. TX/RX DSP
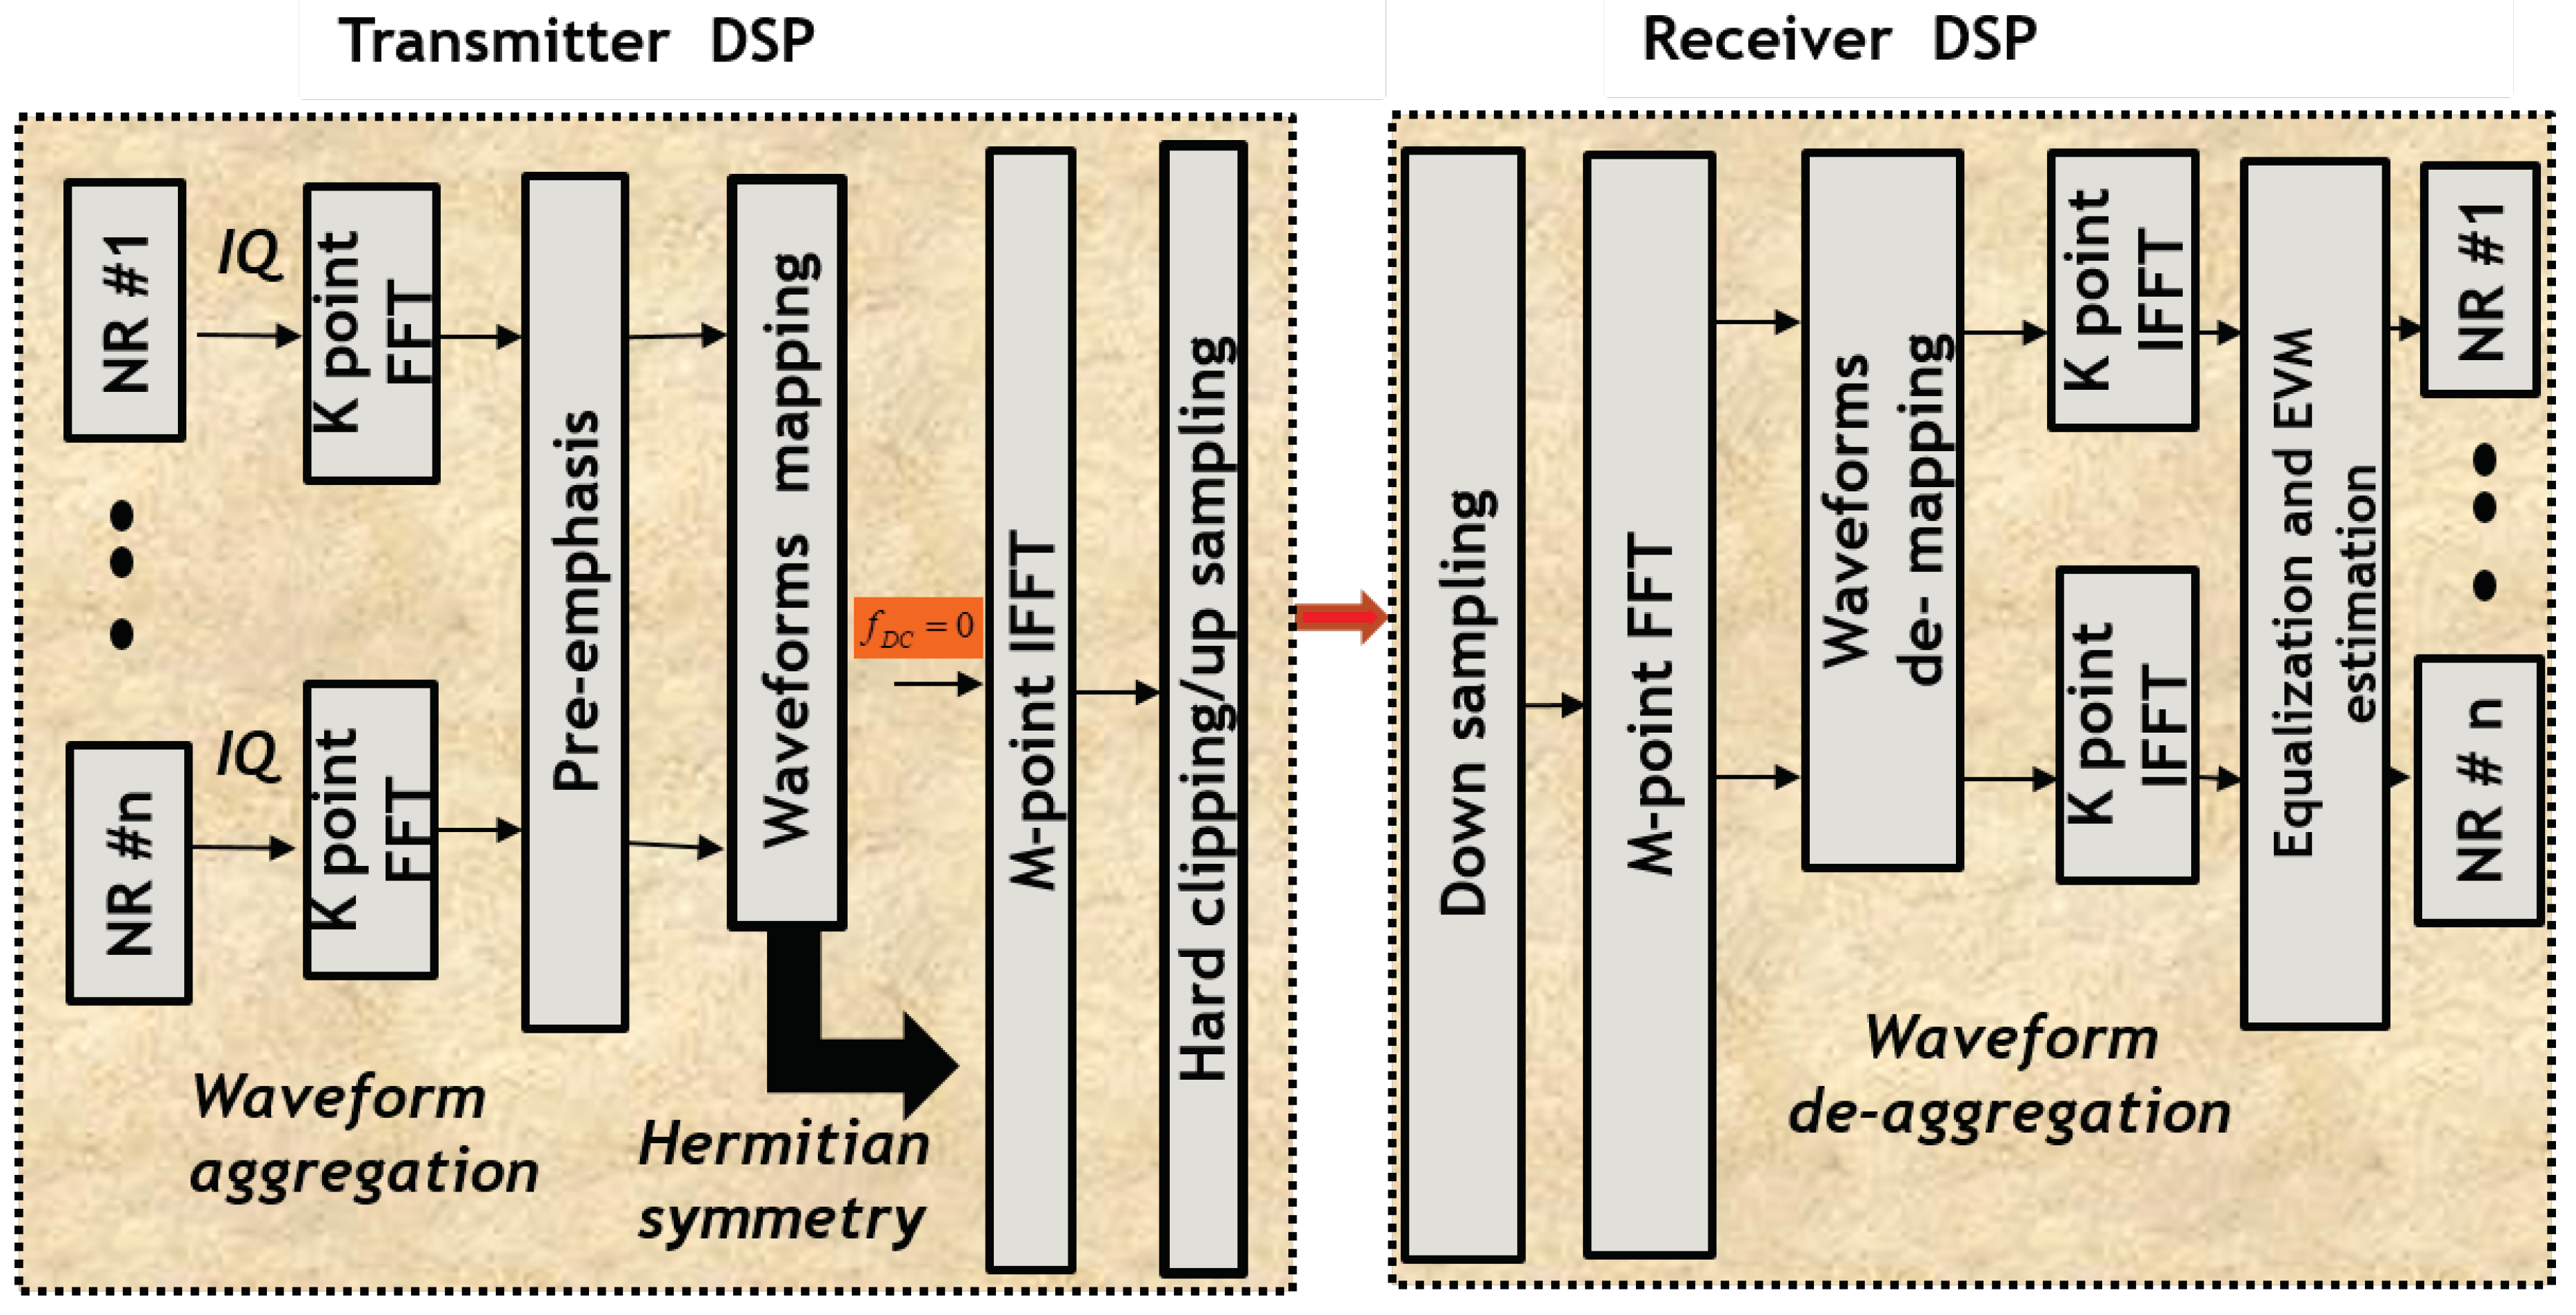
The TX and RX DSP blocks using FDMA and TDMA aggregation schemes are shown in Figure 2 and Figure 3, respectively. We implemented the generation of n NR uplink channels, each made by an OFDM modulation on 4096 point Fast Fourier Transform ( FFT )sampled at sampling rates for the different types of SCs described in Table 1. In all the cases, each channel is composed of PUCCH generated using QPSK modulation and a PUSCH part generated using 64 QAM modulation format. To fit the DAC sampling rate of 12 GSa/s from the transmitter DSP output of both aggregation techniques, the number of NR channels n to be aggregated varies depending on the type of SCs. For instance, in our scenario, n is 72, 36, 18, and 9 for SCs type 0, 1, 2, and 3, respectively.
3.1.1. FDMA TX/RX DSP
The offline DSP blocks of the FDMA-based waveform aggregation/deaggregation scheme used on the transmitter (TX) and receiver (RX) sides are shown in Figure 2. The K point FFT/IFFT(Inverse FFT) size is 16, 32, 64, and 128 for SCs type 0, 1, 2, and 3, respectively. At the transmitter side, a pre-emphasis/pre-compensation block is used to equalize the performance of the FDMA aggregated channels over frequency. The techniques used in the pre-emphasis method involve multiplying each waveform (channel) by an amplitude scaling factor (a set of globally optimized coefficients), which in turn de-emphasizes (minimizes) the channel’s power at a lower frequency and pre-emphasizes (maximizes) the channel’s power at the higher frequency end. Hence, the EVM along the whole set of channels is set to the same value. For a detailed study of frequency domain pre-emphasis, please refer to our previous investigation [13]. The waveforms are then mapped in the way of a Hermitian symmetry feed to the half point of the M point IFFT set to 4096 input, so that real valued output is clipped and upsampled in frequency to fit the DAC sampling rate [14]. At the receiver side, the received digital signal from the ADC output shown in Figure 1 is down sampled in frequency to the original aggregated channel’s sampling frequency. The de-aggregated channels after the K point IFFT are equalized using one tap equalization for the channel impairment compensation, and the average root-mean-square (RMS) error vector (EVM) is estimated as the difference between the ideal transmitted symbol and the received symbols after equalization as RMS. The EVM per channel is obtained as the average over all OFDM subcarriers.
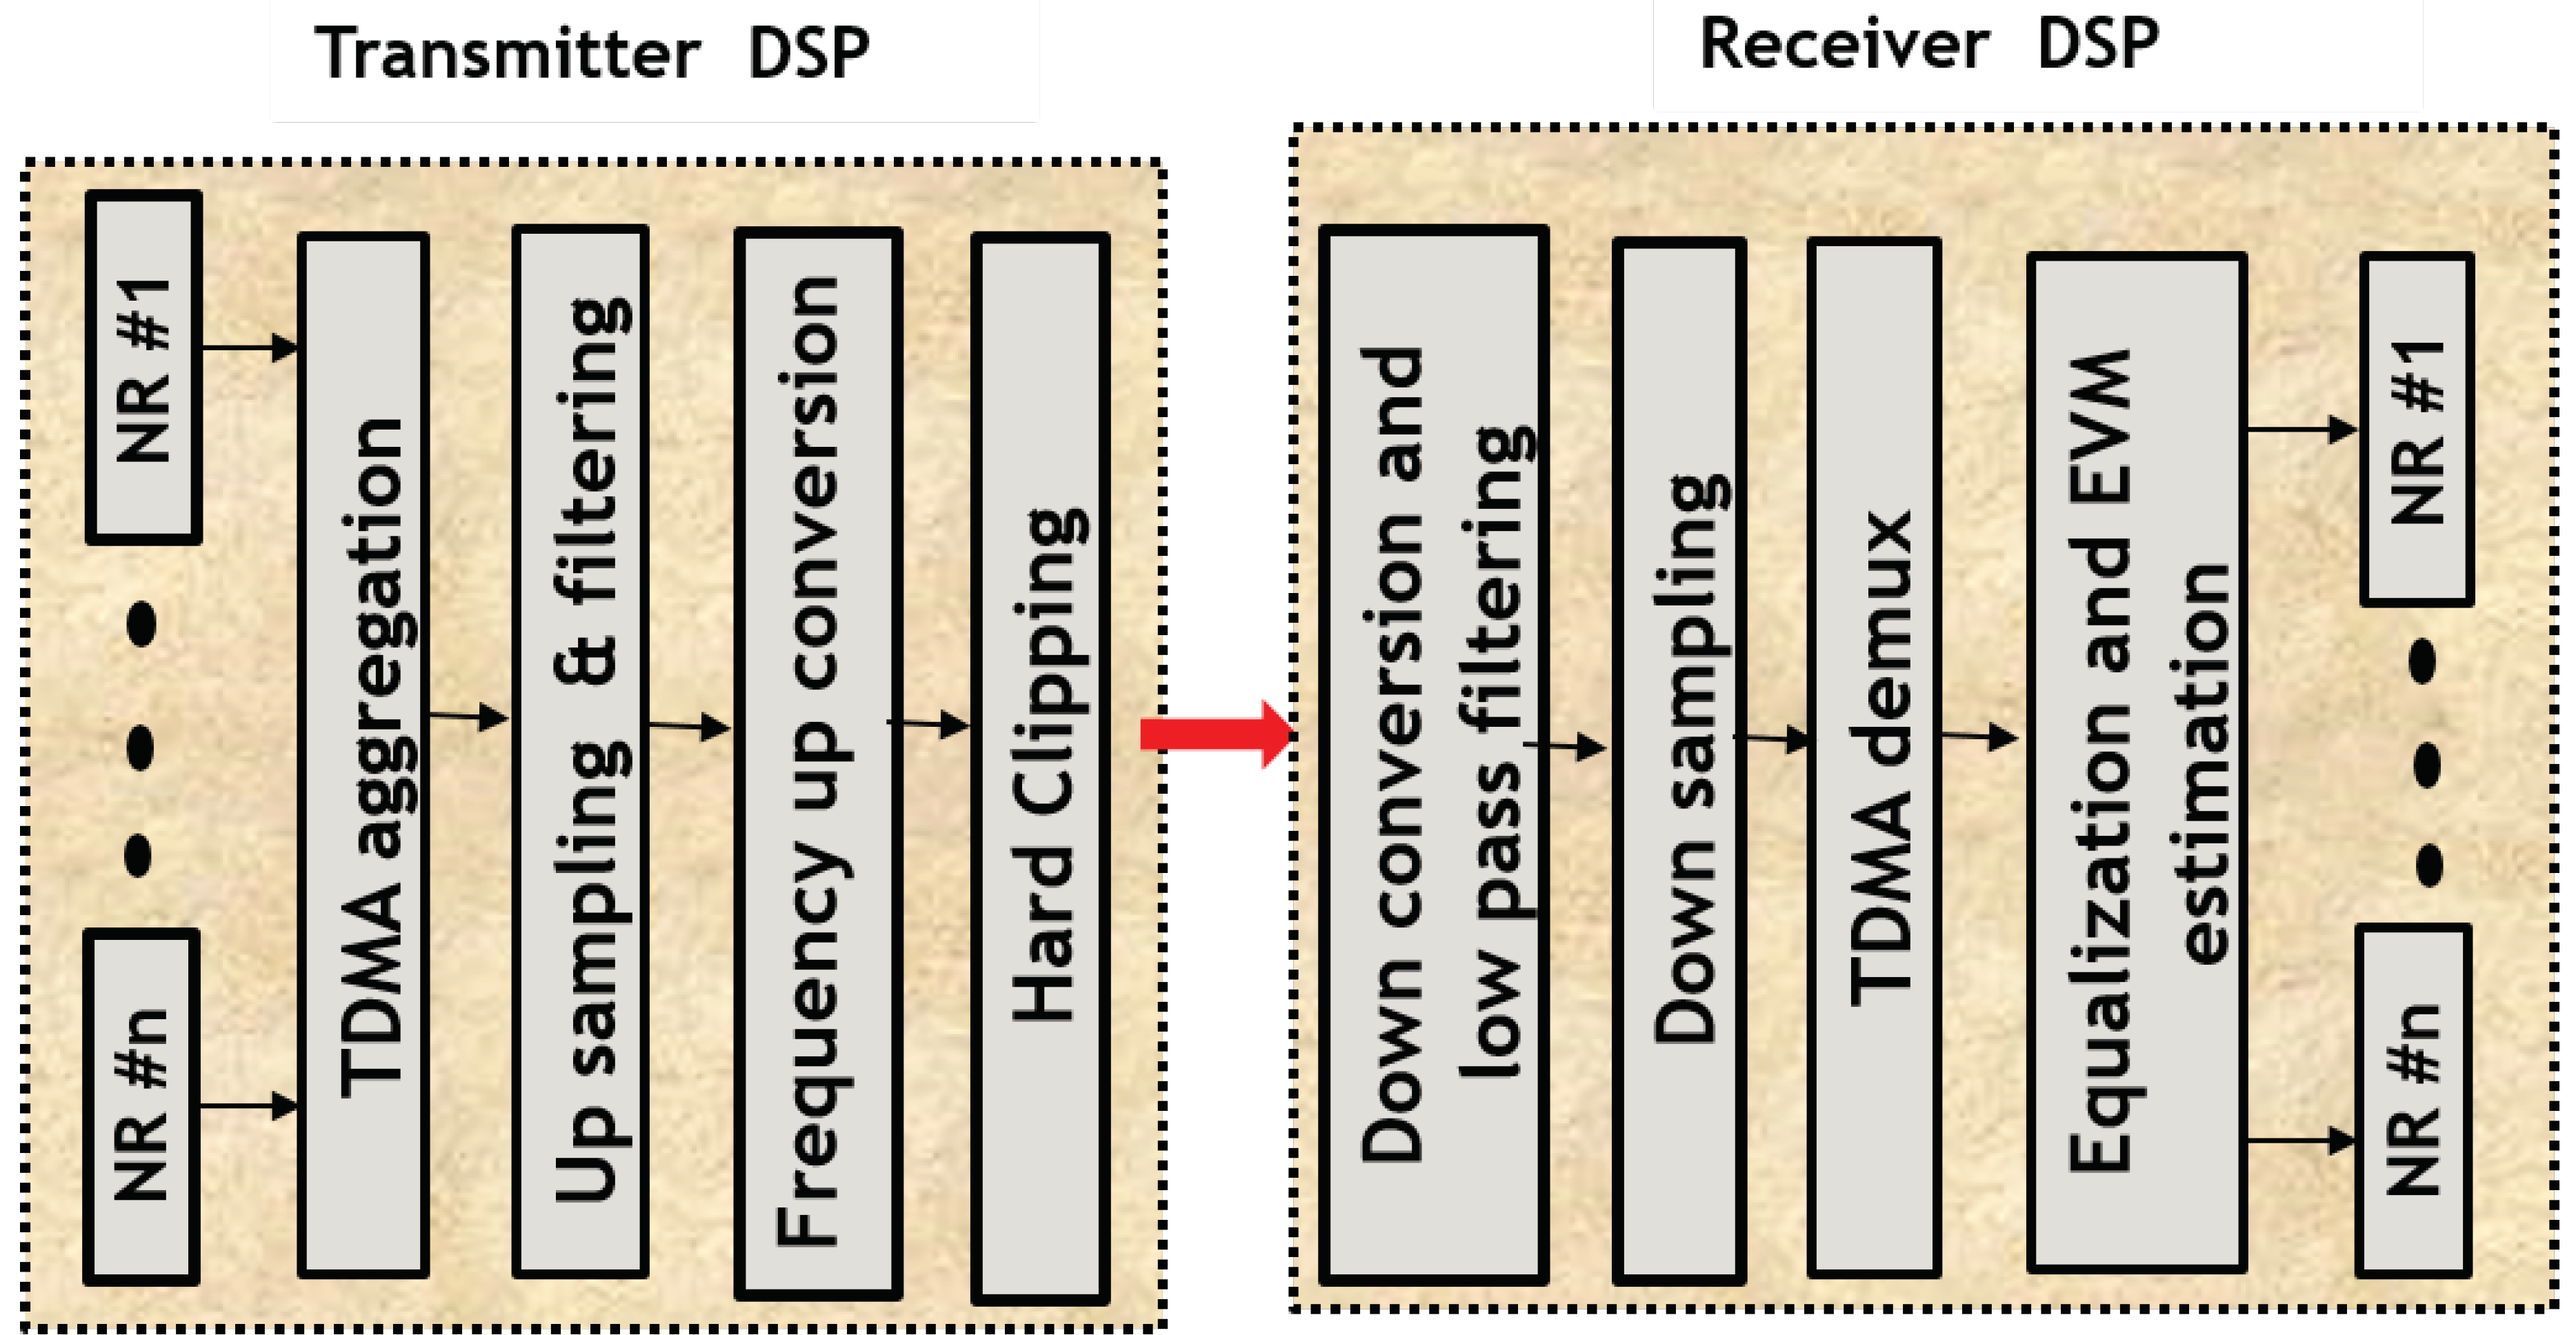
3.1.2. TDMA TX/RX DSP
The offline DSP blocks for the TDMA-based channel aggregation/de-aggregation are shown in Figure 3. At the transmitter DSP side, the complex NR channels are first aggregated by the time interleaving each time sample. The aggregated waveforms in the time domain are upsampled in frequency to the DAC sampling rate and filtered for image rejection. Frequency up conversion is used to obtain a real output signal from the complex baseband signal. The output signal is clipped to the desired clipping level. At the receiver side, the received digital signal from the ADC output shown in Figure 1 is down converted in frequency in order to recover the baseband complex signal, which is then filtered to prevent aliasing. The complex baseband signal is then down sampled in frequency to the original aggregated channels sampling frequency, which is then de-aggregated in time. The equalization and EVM estimation block is the same as the one used for the FDMA scheme shown in Figure 2 [15].
4. Results and Discussion
The performance of the 5G NR uplink channels, analyzed on the considered SCs types, is presented in the following subsections. The simulation results performed on the IM-DD A-RoF link based on FDMA and TDMA DSP aggregation techniques are evaluated with respect to spectral efficiency and error vector magnitude (EVM), which are the most commonly used parameters to evaluate the quality of radio links [16].
4.1. SC Type 0
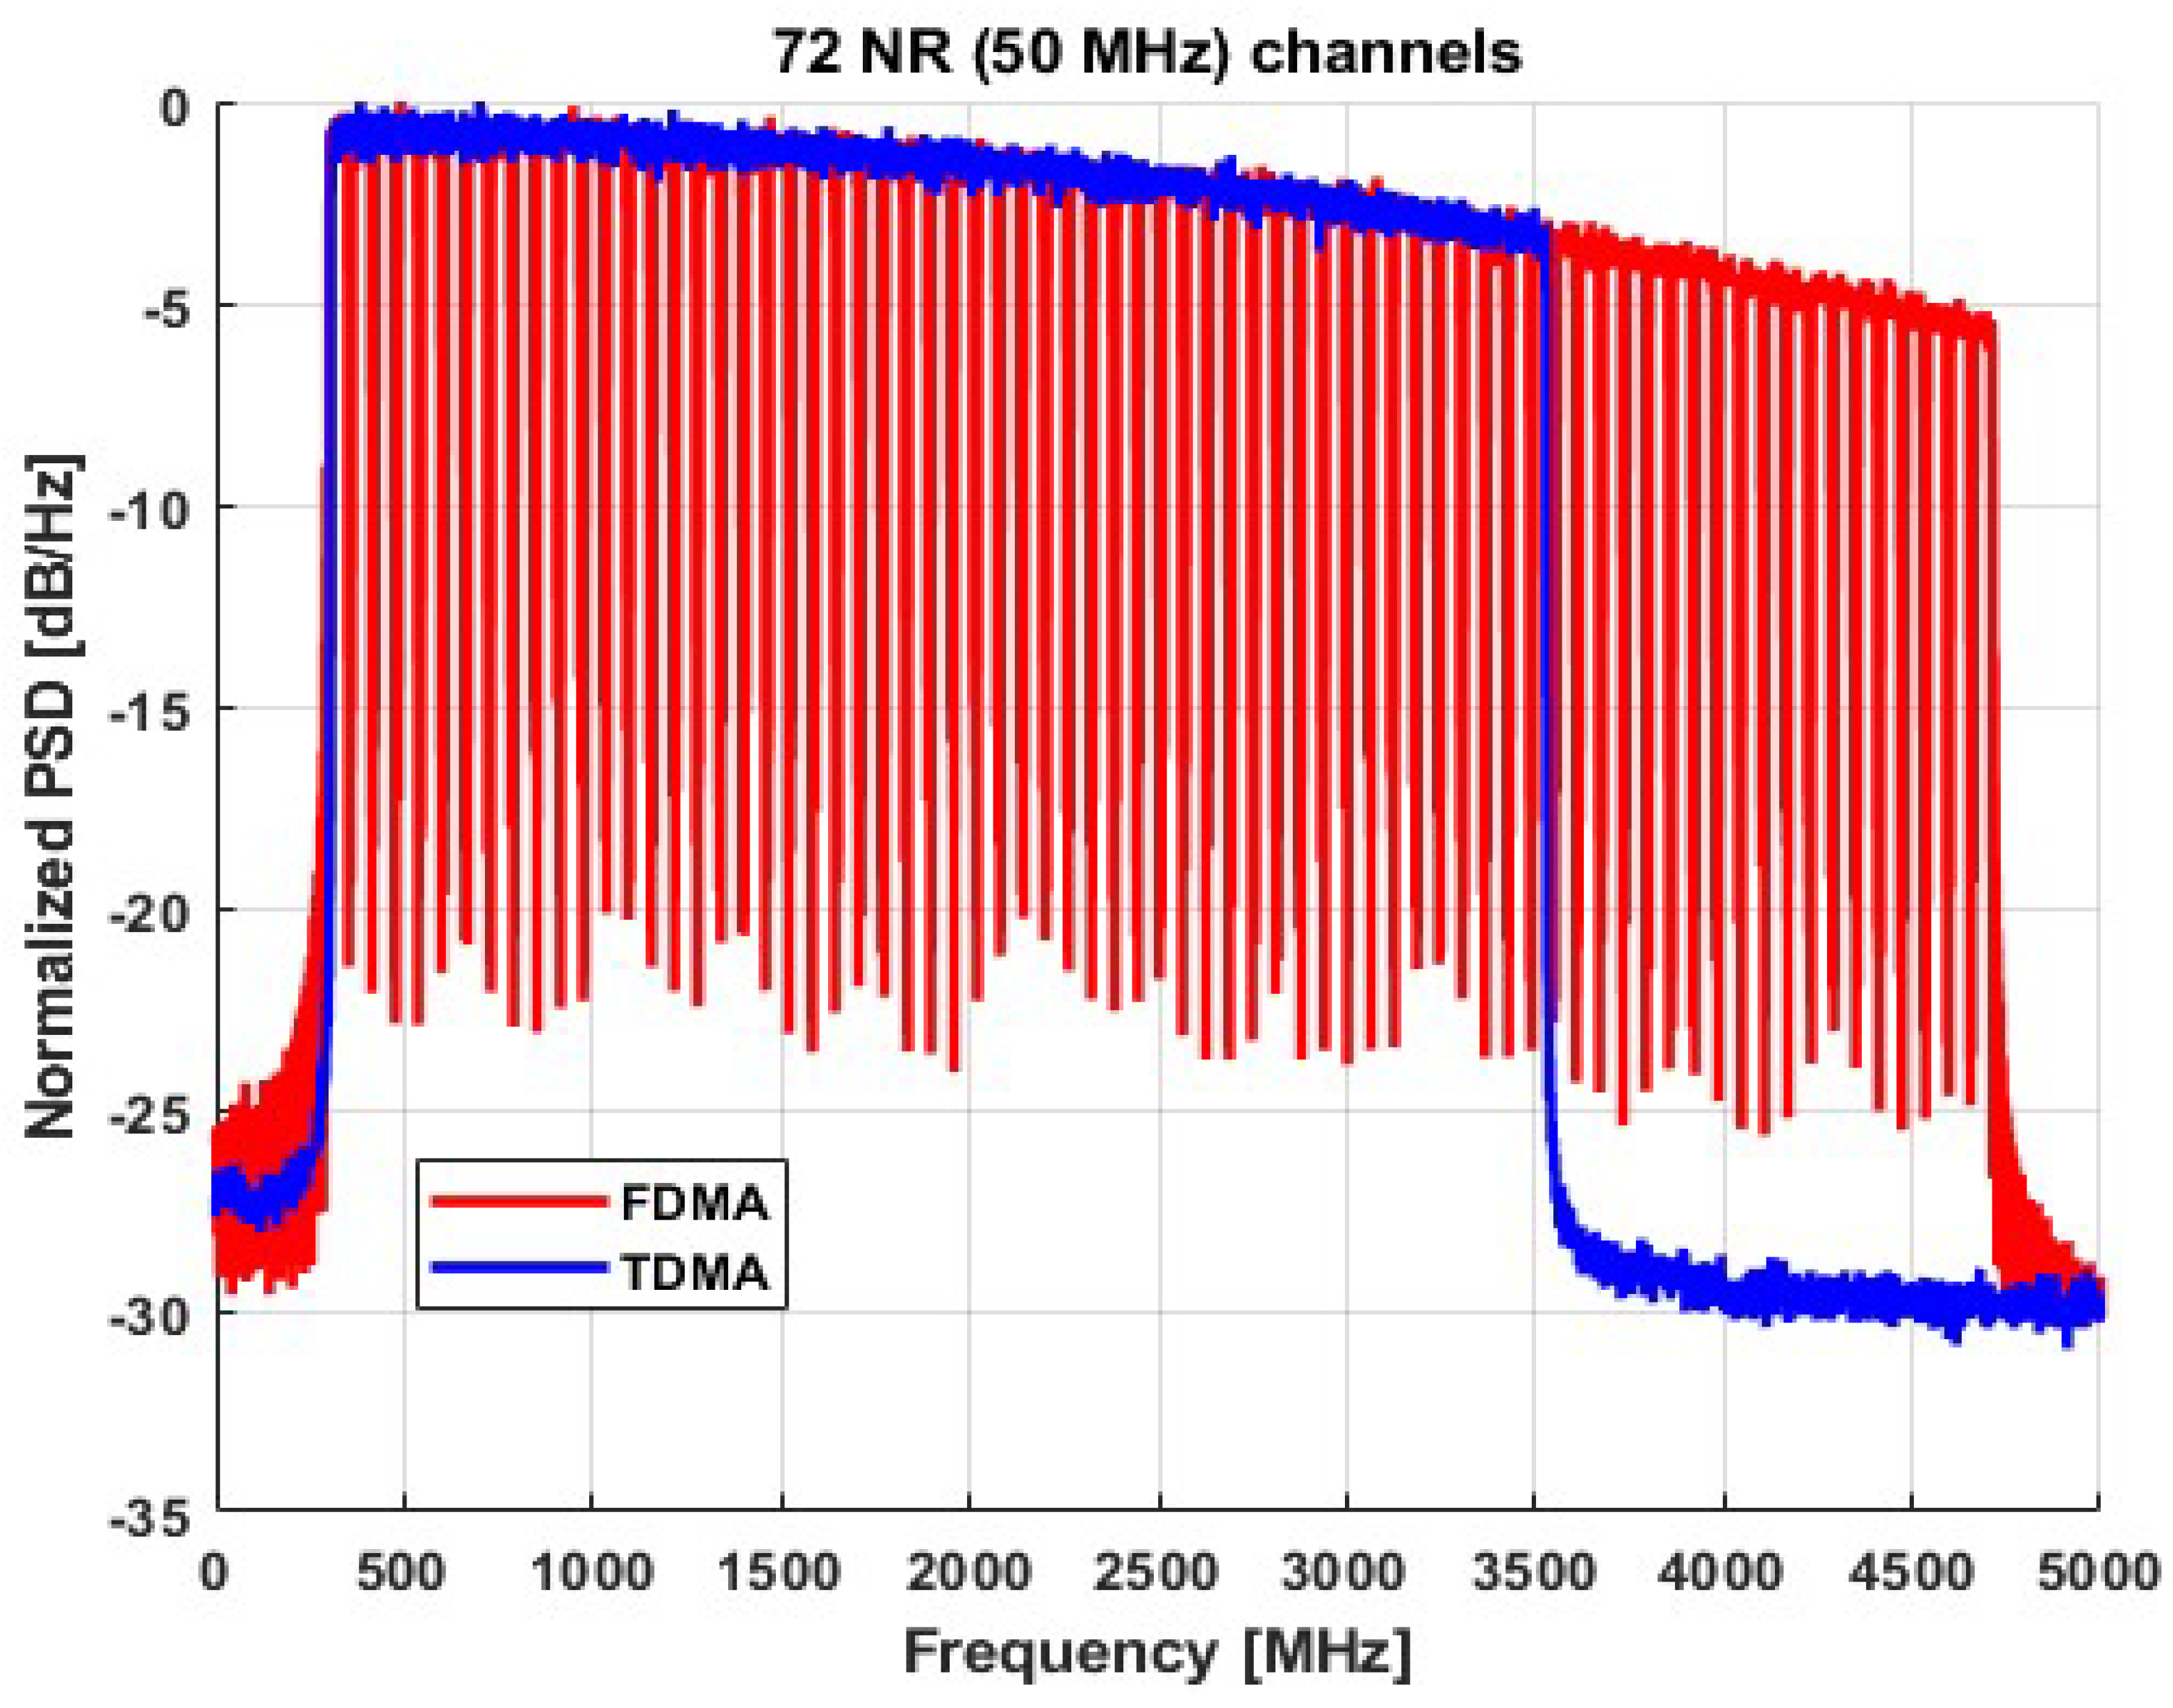
The electrical spectrum of SCs type 0 n = 72 NR (50 MHz) channels at the input of RX DSP obtained by FDMA and TDMA aggregation is shown in Figure 4. The red line is used for FDMA and the blue line is used for TDMA. The total bandwidth occupied by FDMA is obtained as n × 61.44 MHz = ~4700 MHz (including 300 MHz guard from DC), where 61.44 MHz is the sampling rate of each NR channel. Conversely, the total bandwidth occupied by TDMA aggregation is n × 50 MHz = ~3500 MHz, where 50 MHz is the bandwidth of each NR channel. For the same number of channel aggregation, TDMA saves ~1 GHz bandwidth when compared with FDMA. The spectral roll off towards higher frequency is due to the frequency response of the system. In the case of FDMA, the performance degradation of higher channels is pre-compensated by the pre-emphasis block shown in Figure 2.
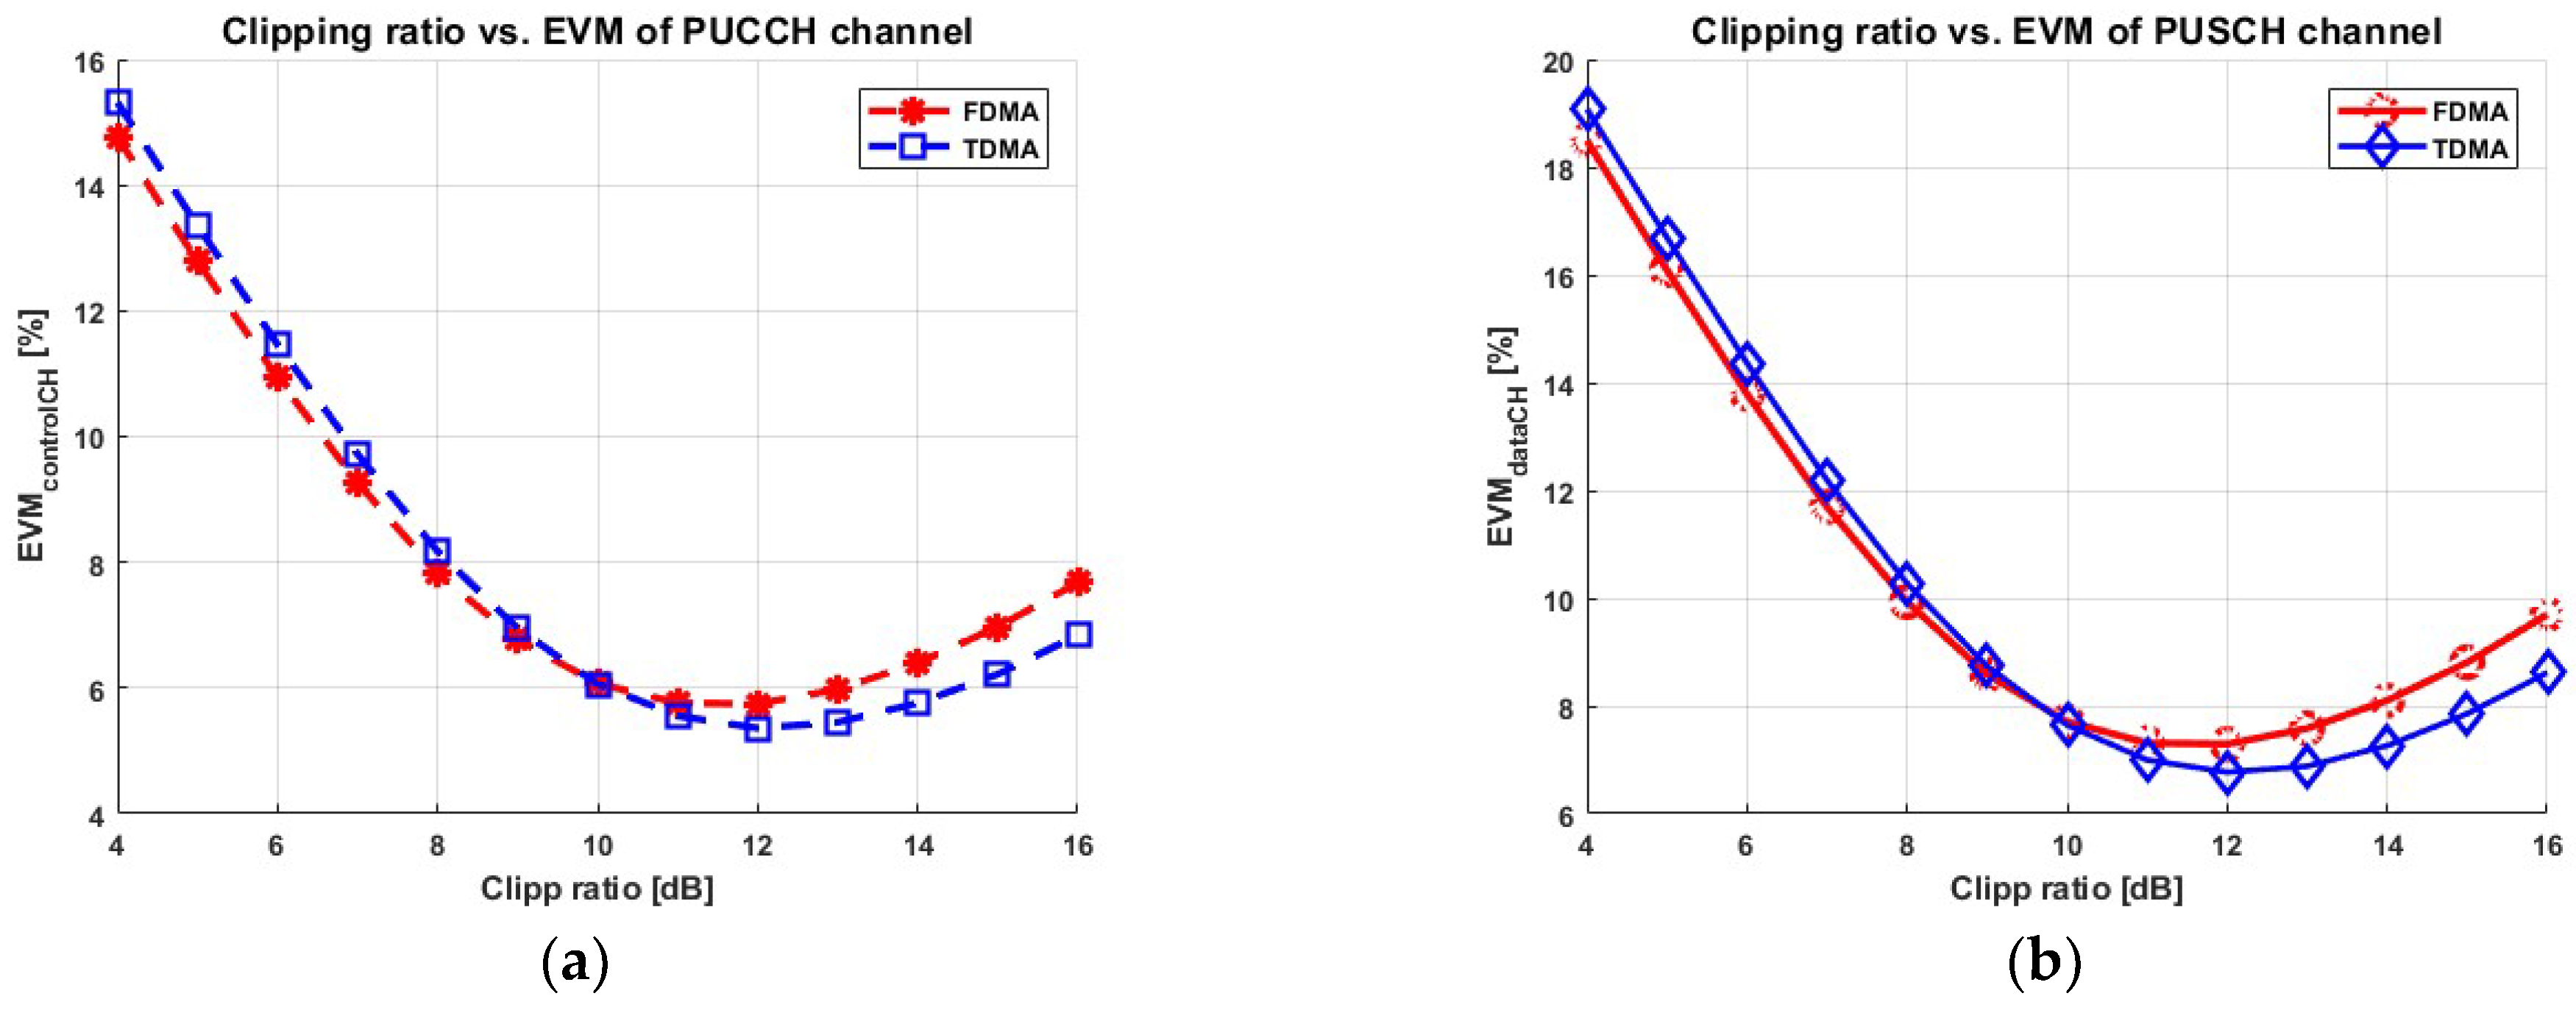
Before the analysis of the EVM performance of the system, we first optimize the signal clipping ratio. The clipping technique is implemented to reduce the high peak-to-average-power ratio (PAPR) associated with OFDM modulation. A small clipping ratio gives rise to a large clipping distortion, whereas large values of clipping ratio reduce clipping distortion, but generate a small signal, which is less resilient to the receiver noise. Therefore, there is an optimum clipping value. The clipping ratio versus EVM (computed as the mean value of the EVM of all channels) for both PUCCH and PUSCH obtained at 29 dB ODN loss (a typical target value for PON access networks) is shown in Figure 5a,b, respectively. The optimum clipping ratio for both signal types and DSP aggregation techniques is 12 dB.
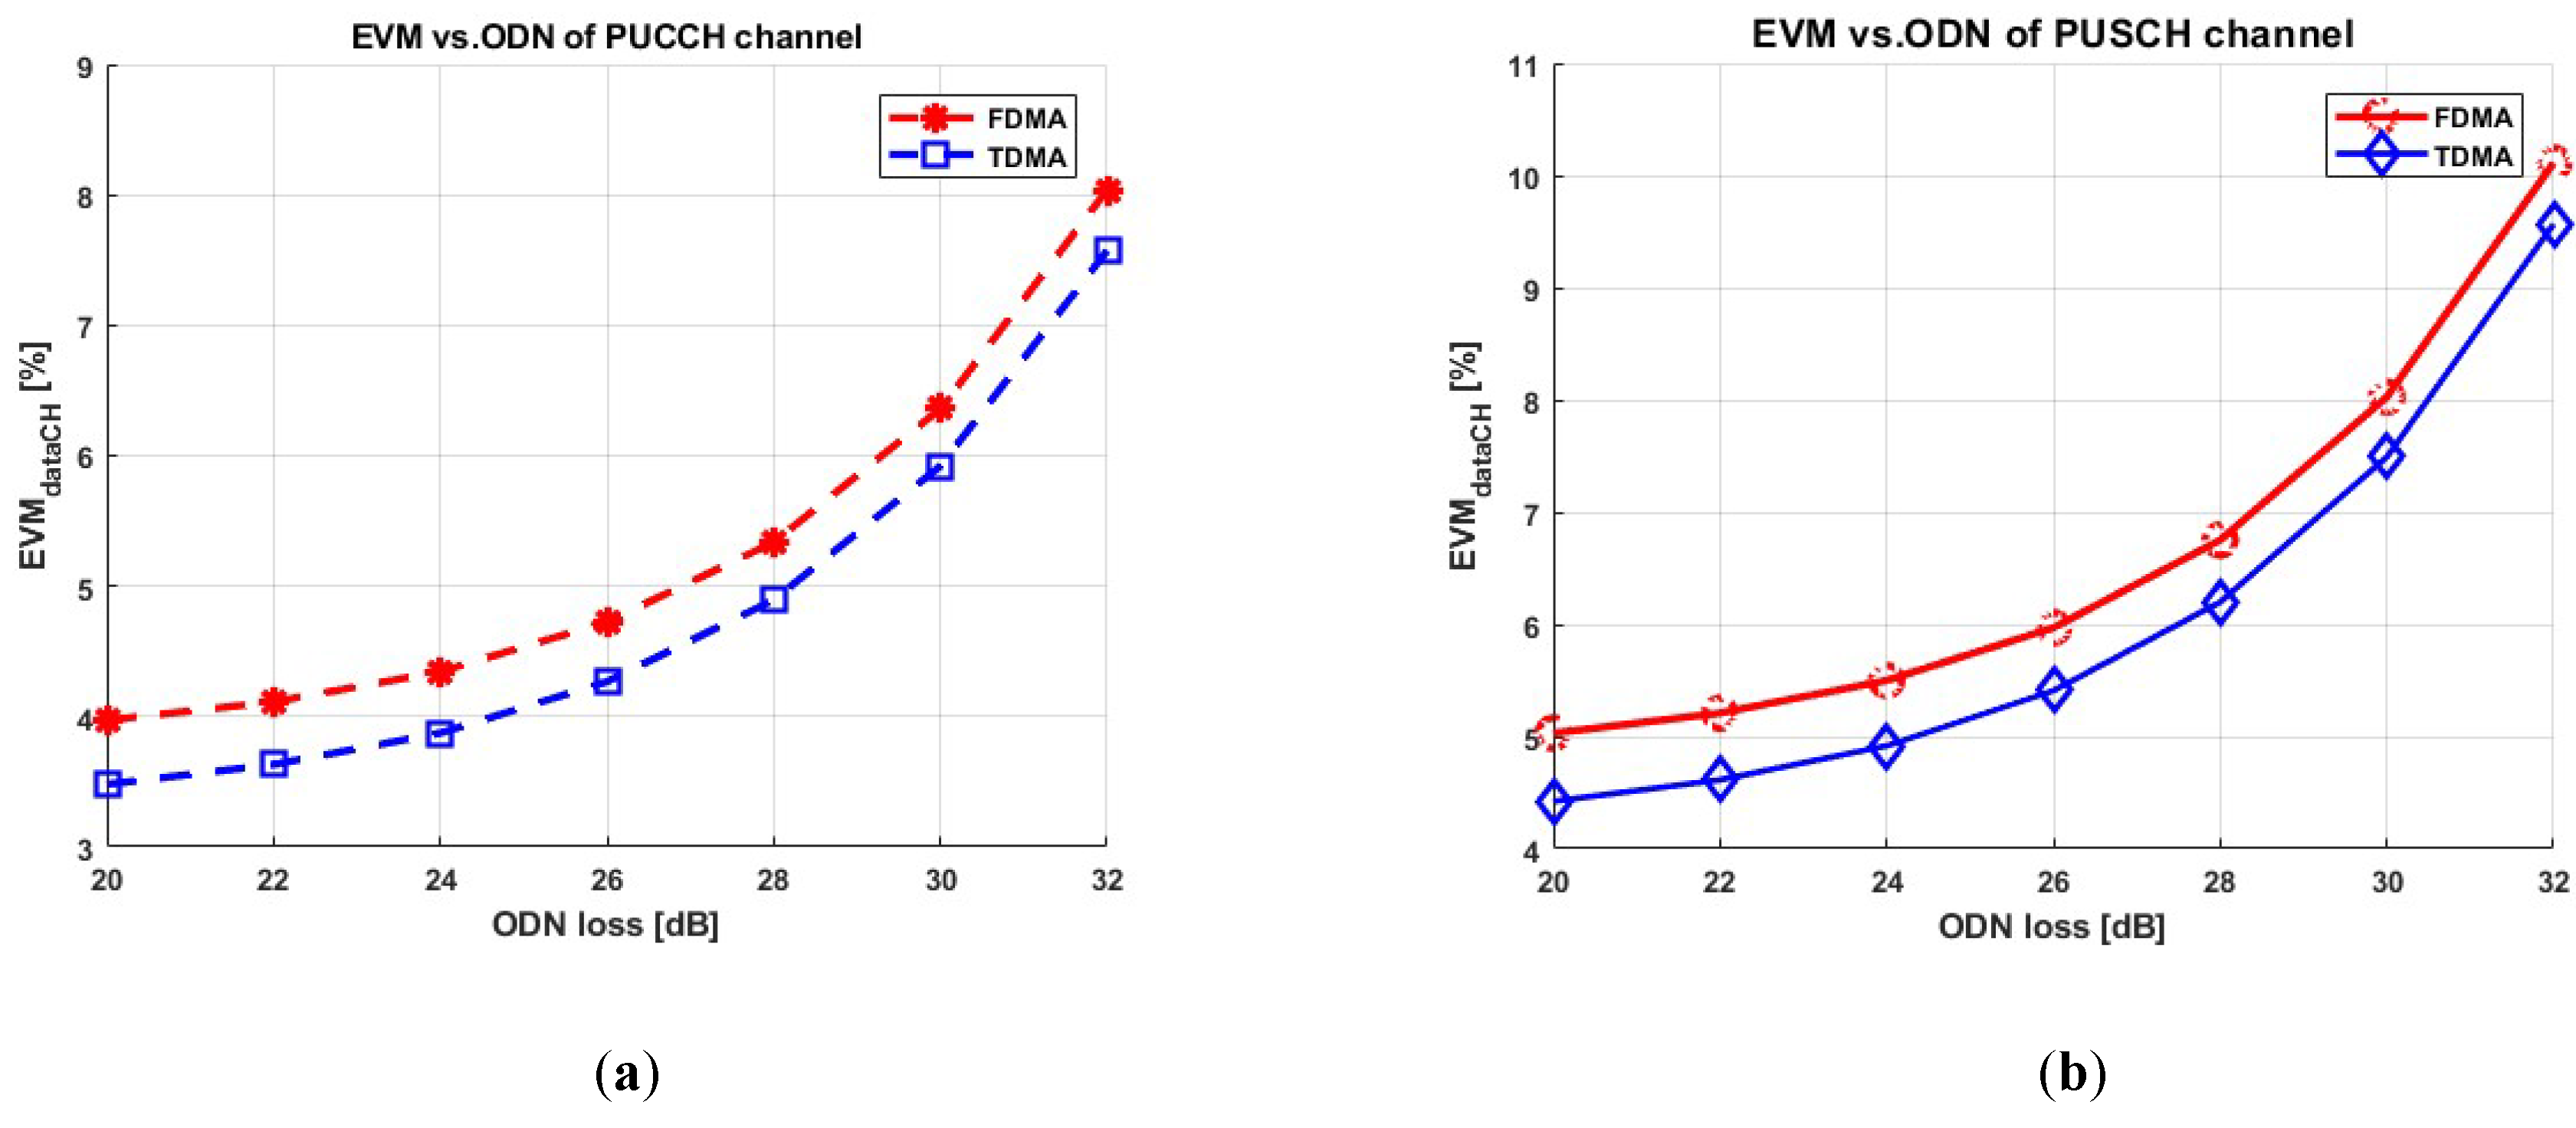
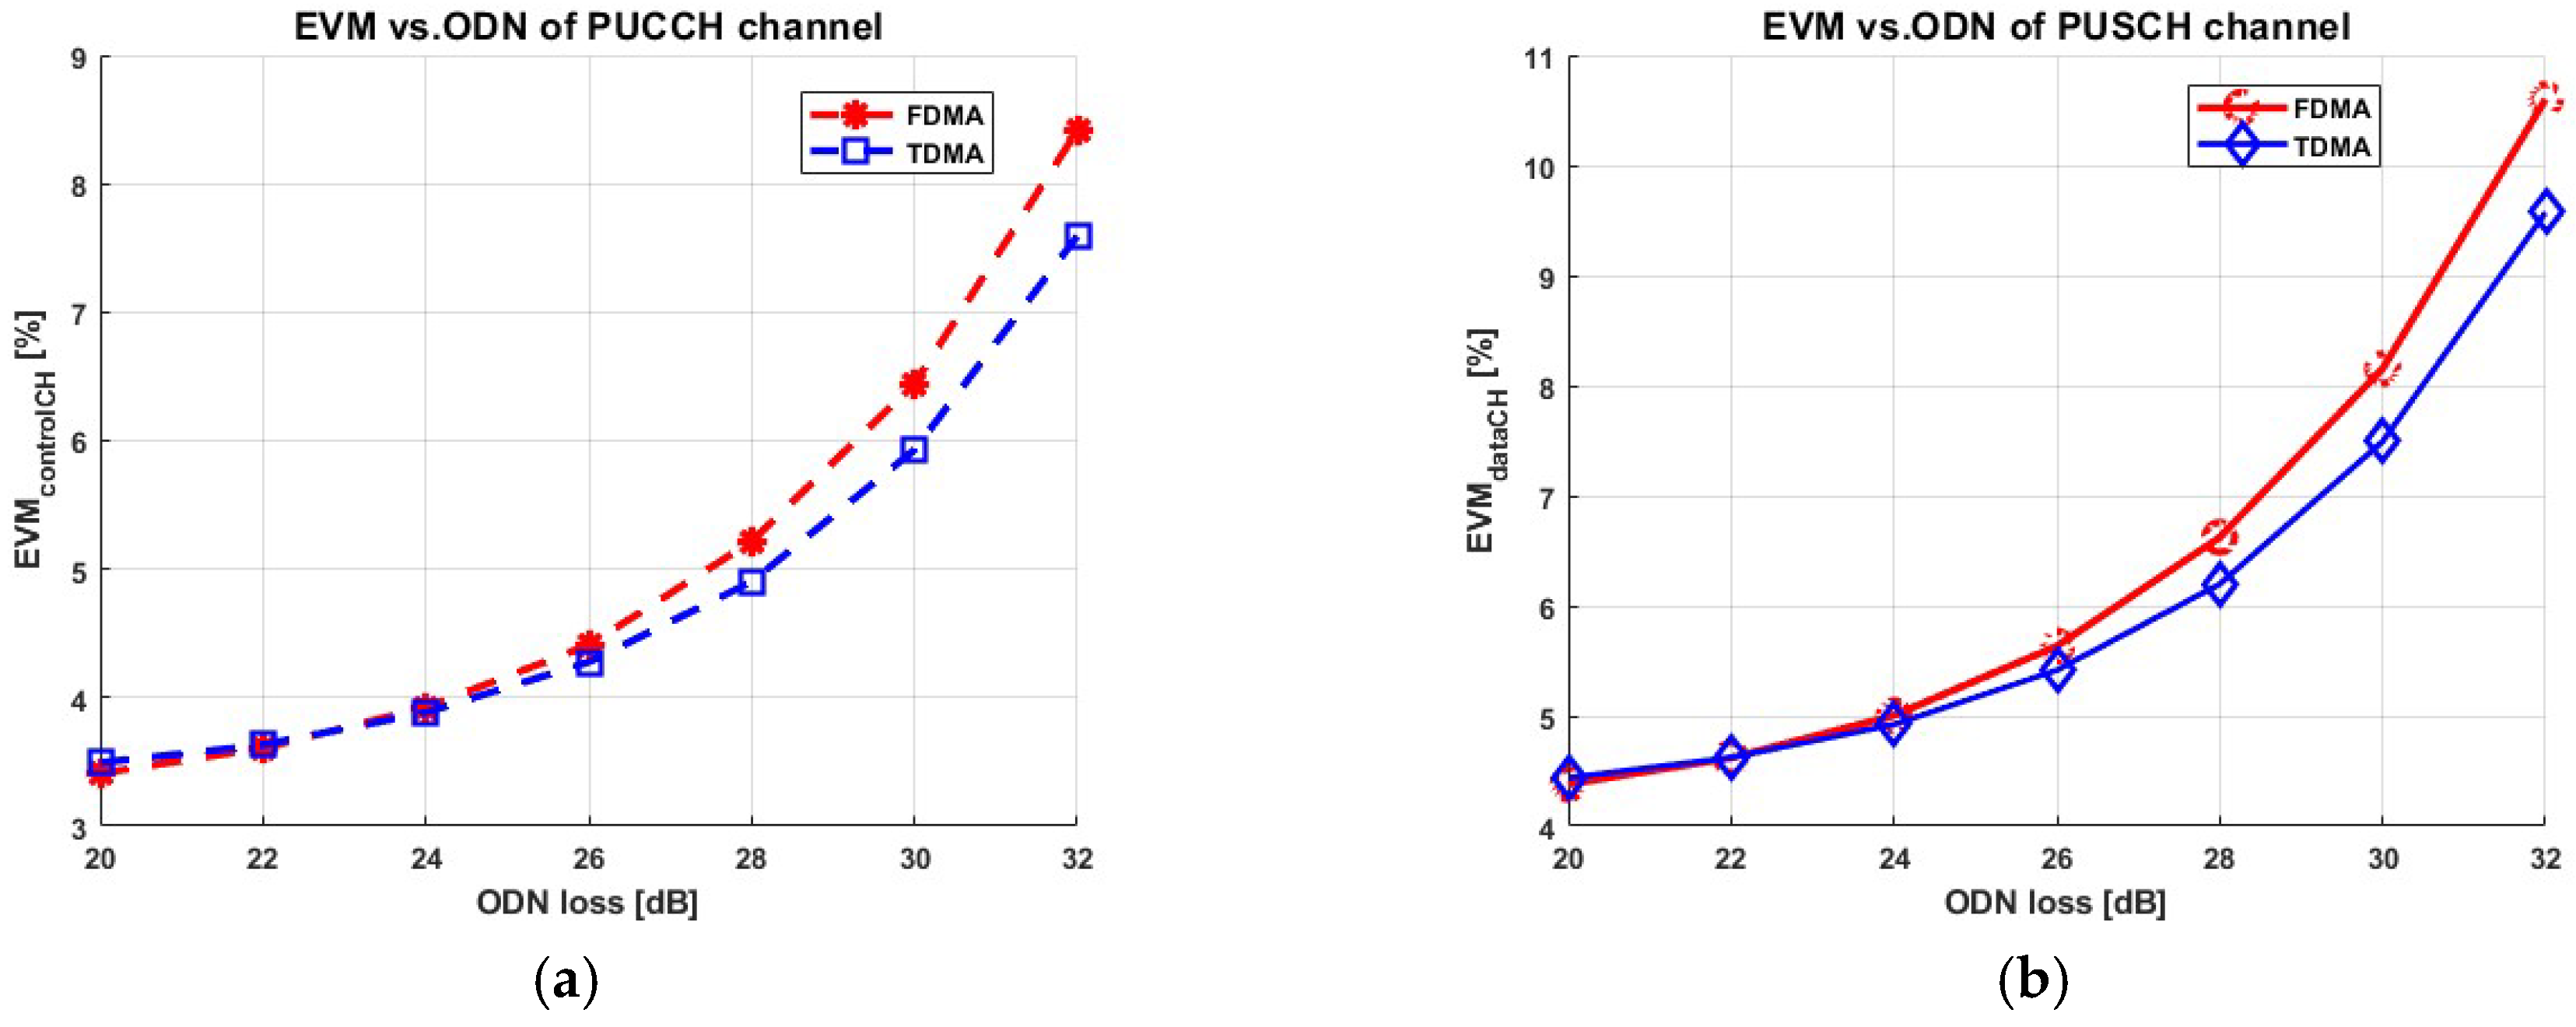
The EVM (mean) as a function of the ODN loss, evaluated at the optimum clipping for PUCCH and PUSCH, is then reported in Figure 6a,b, respectively. The mean EVM performance of the TDMA scheme is slightly better for both signal types (PUCCH and PUSCH). This is associated with TDMA’s spectral compactness when compared with FDMA, which is less affected by the optical channel response towards the higher channels.
4.2. SCs Type 1, 2, and 3
The same procedure reported in Section 4.1 was repeated for different type of SCs, the analysis is repeated while changing SCs and the number of channels adjusted to fit the DAC sampling rate of 12 GSa/s. The parameters and obtained results are summarized in Table 2.
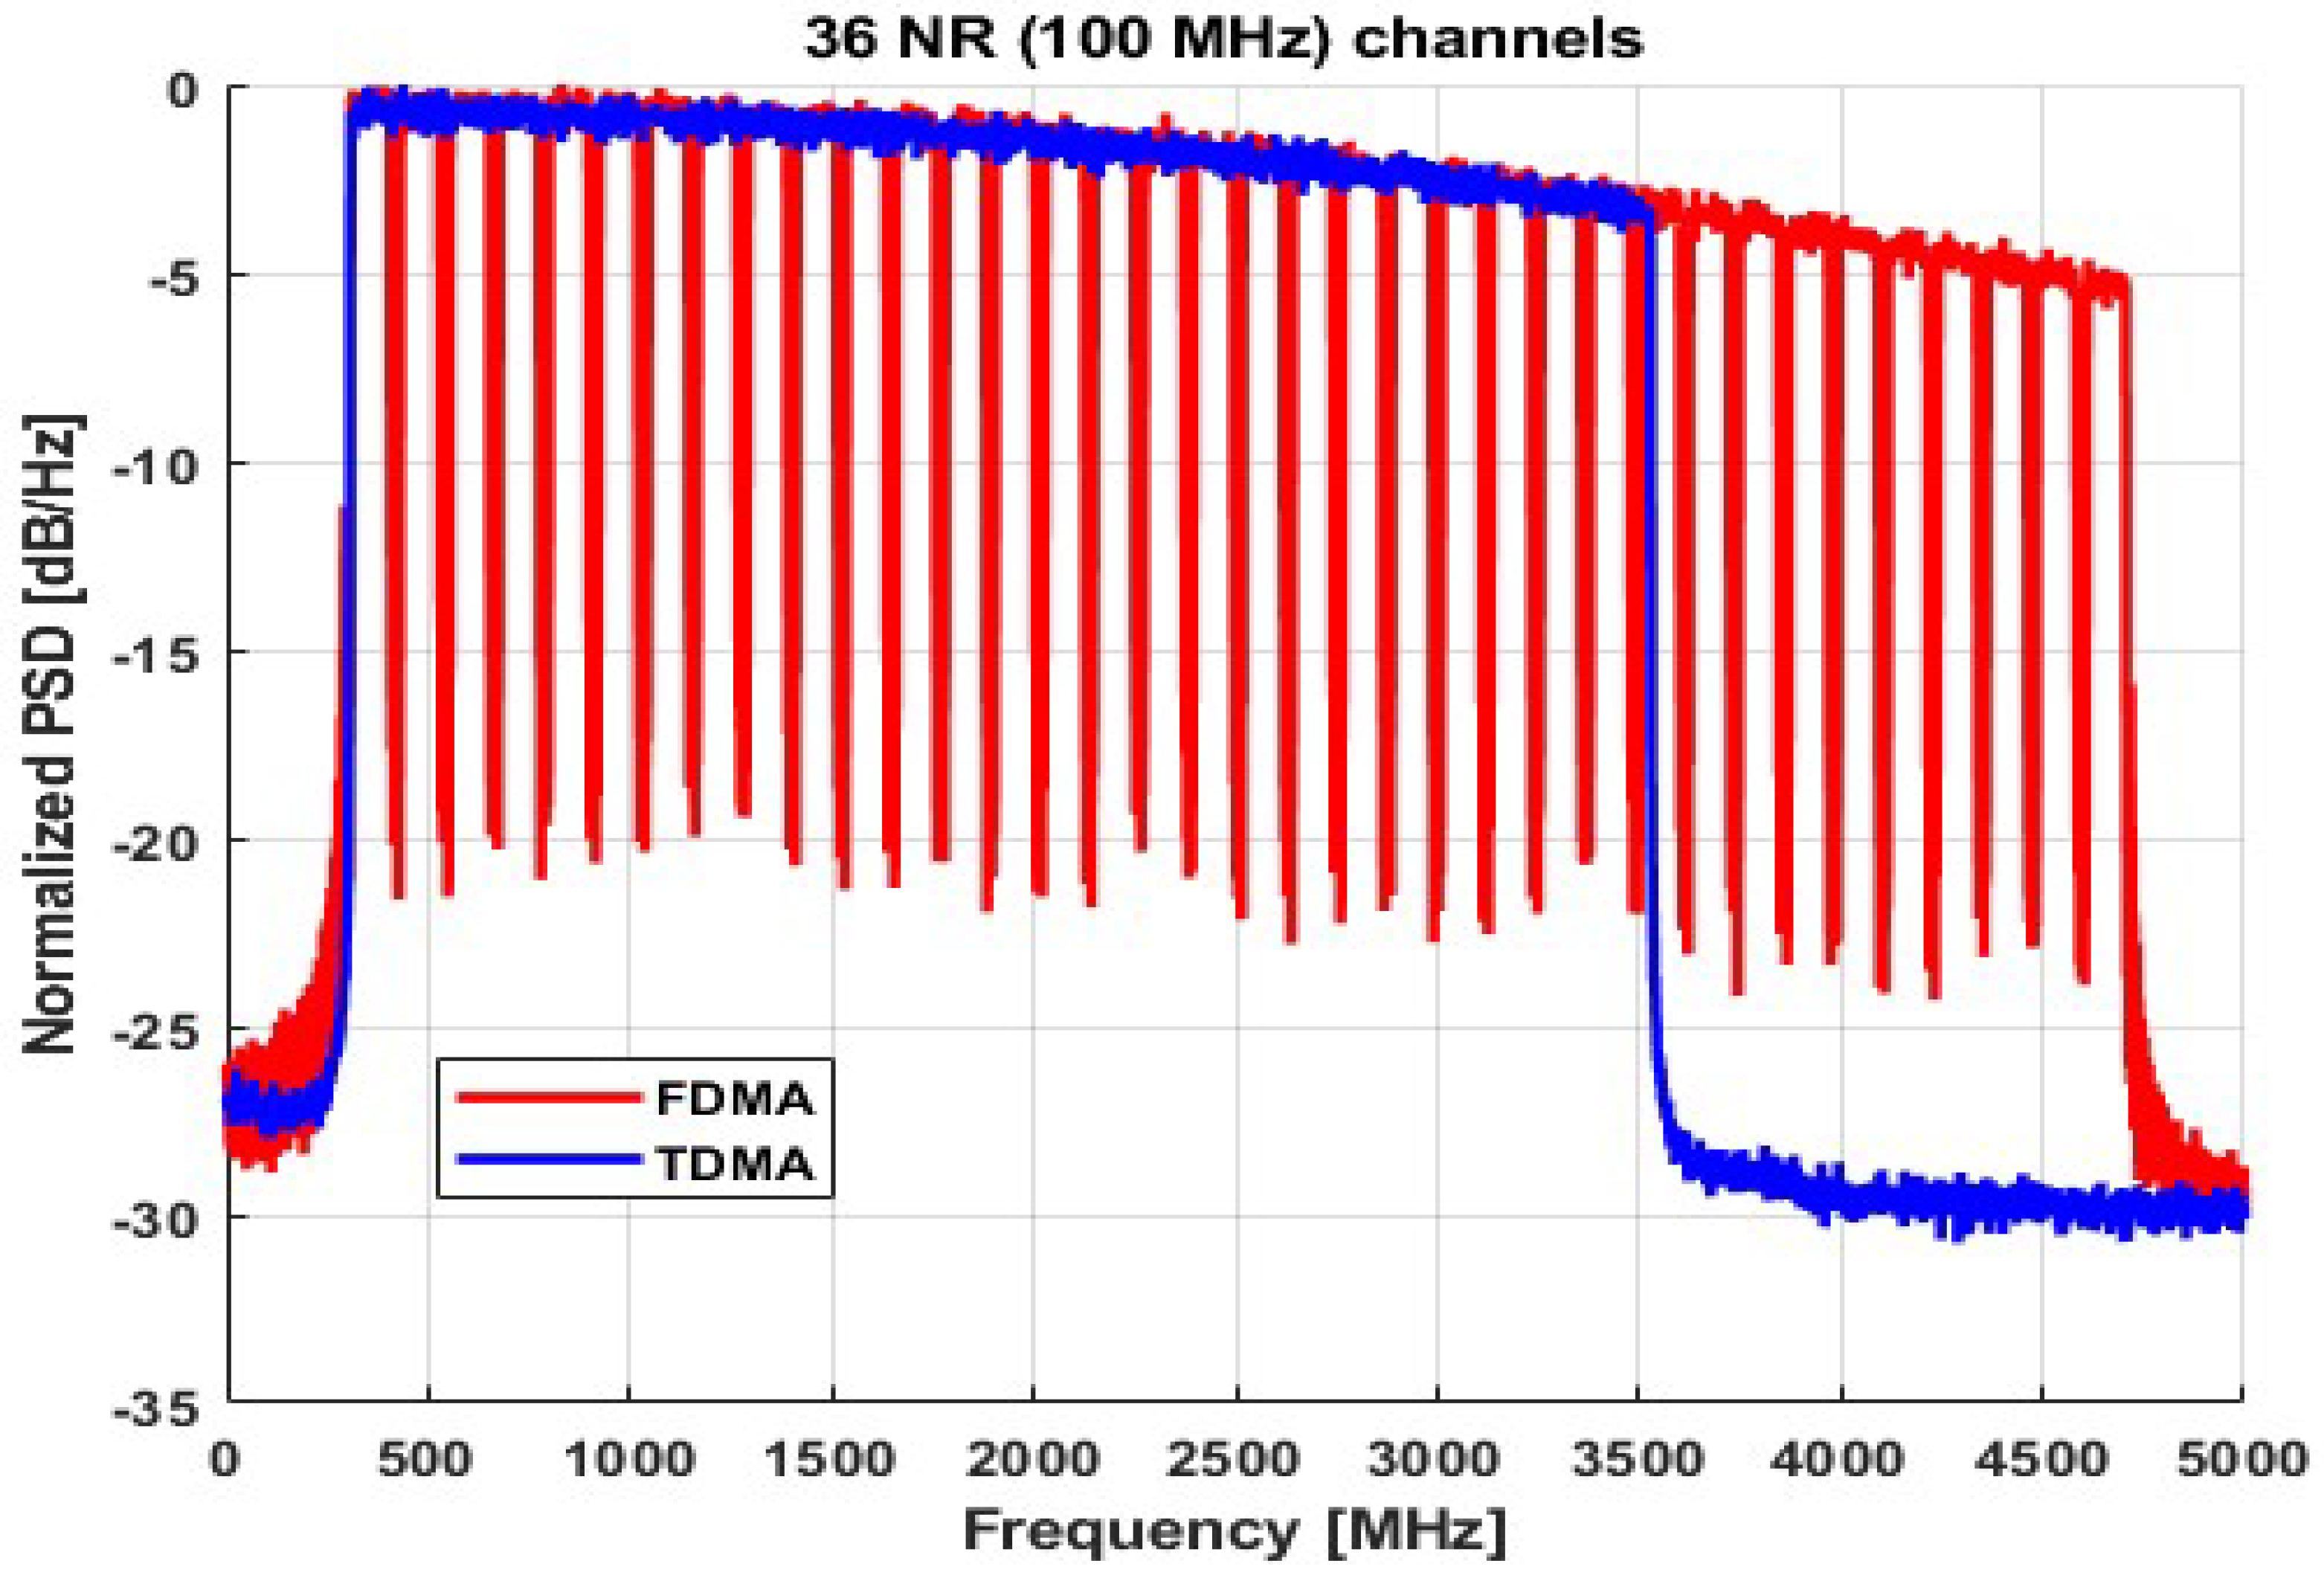
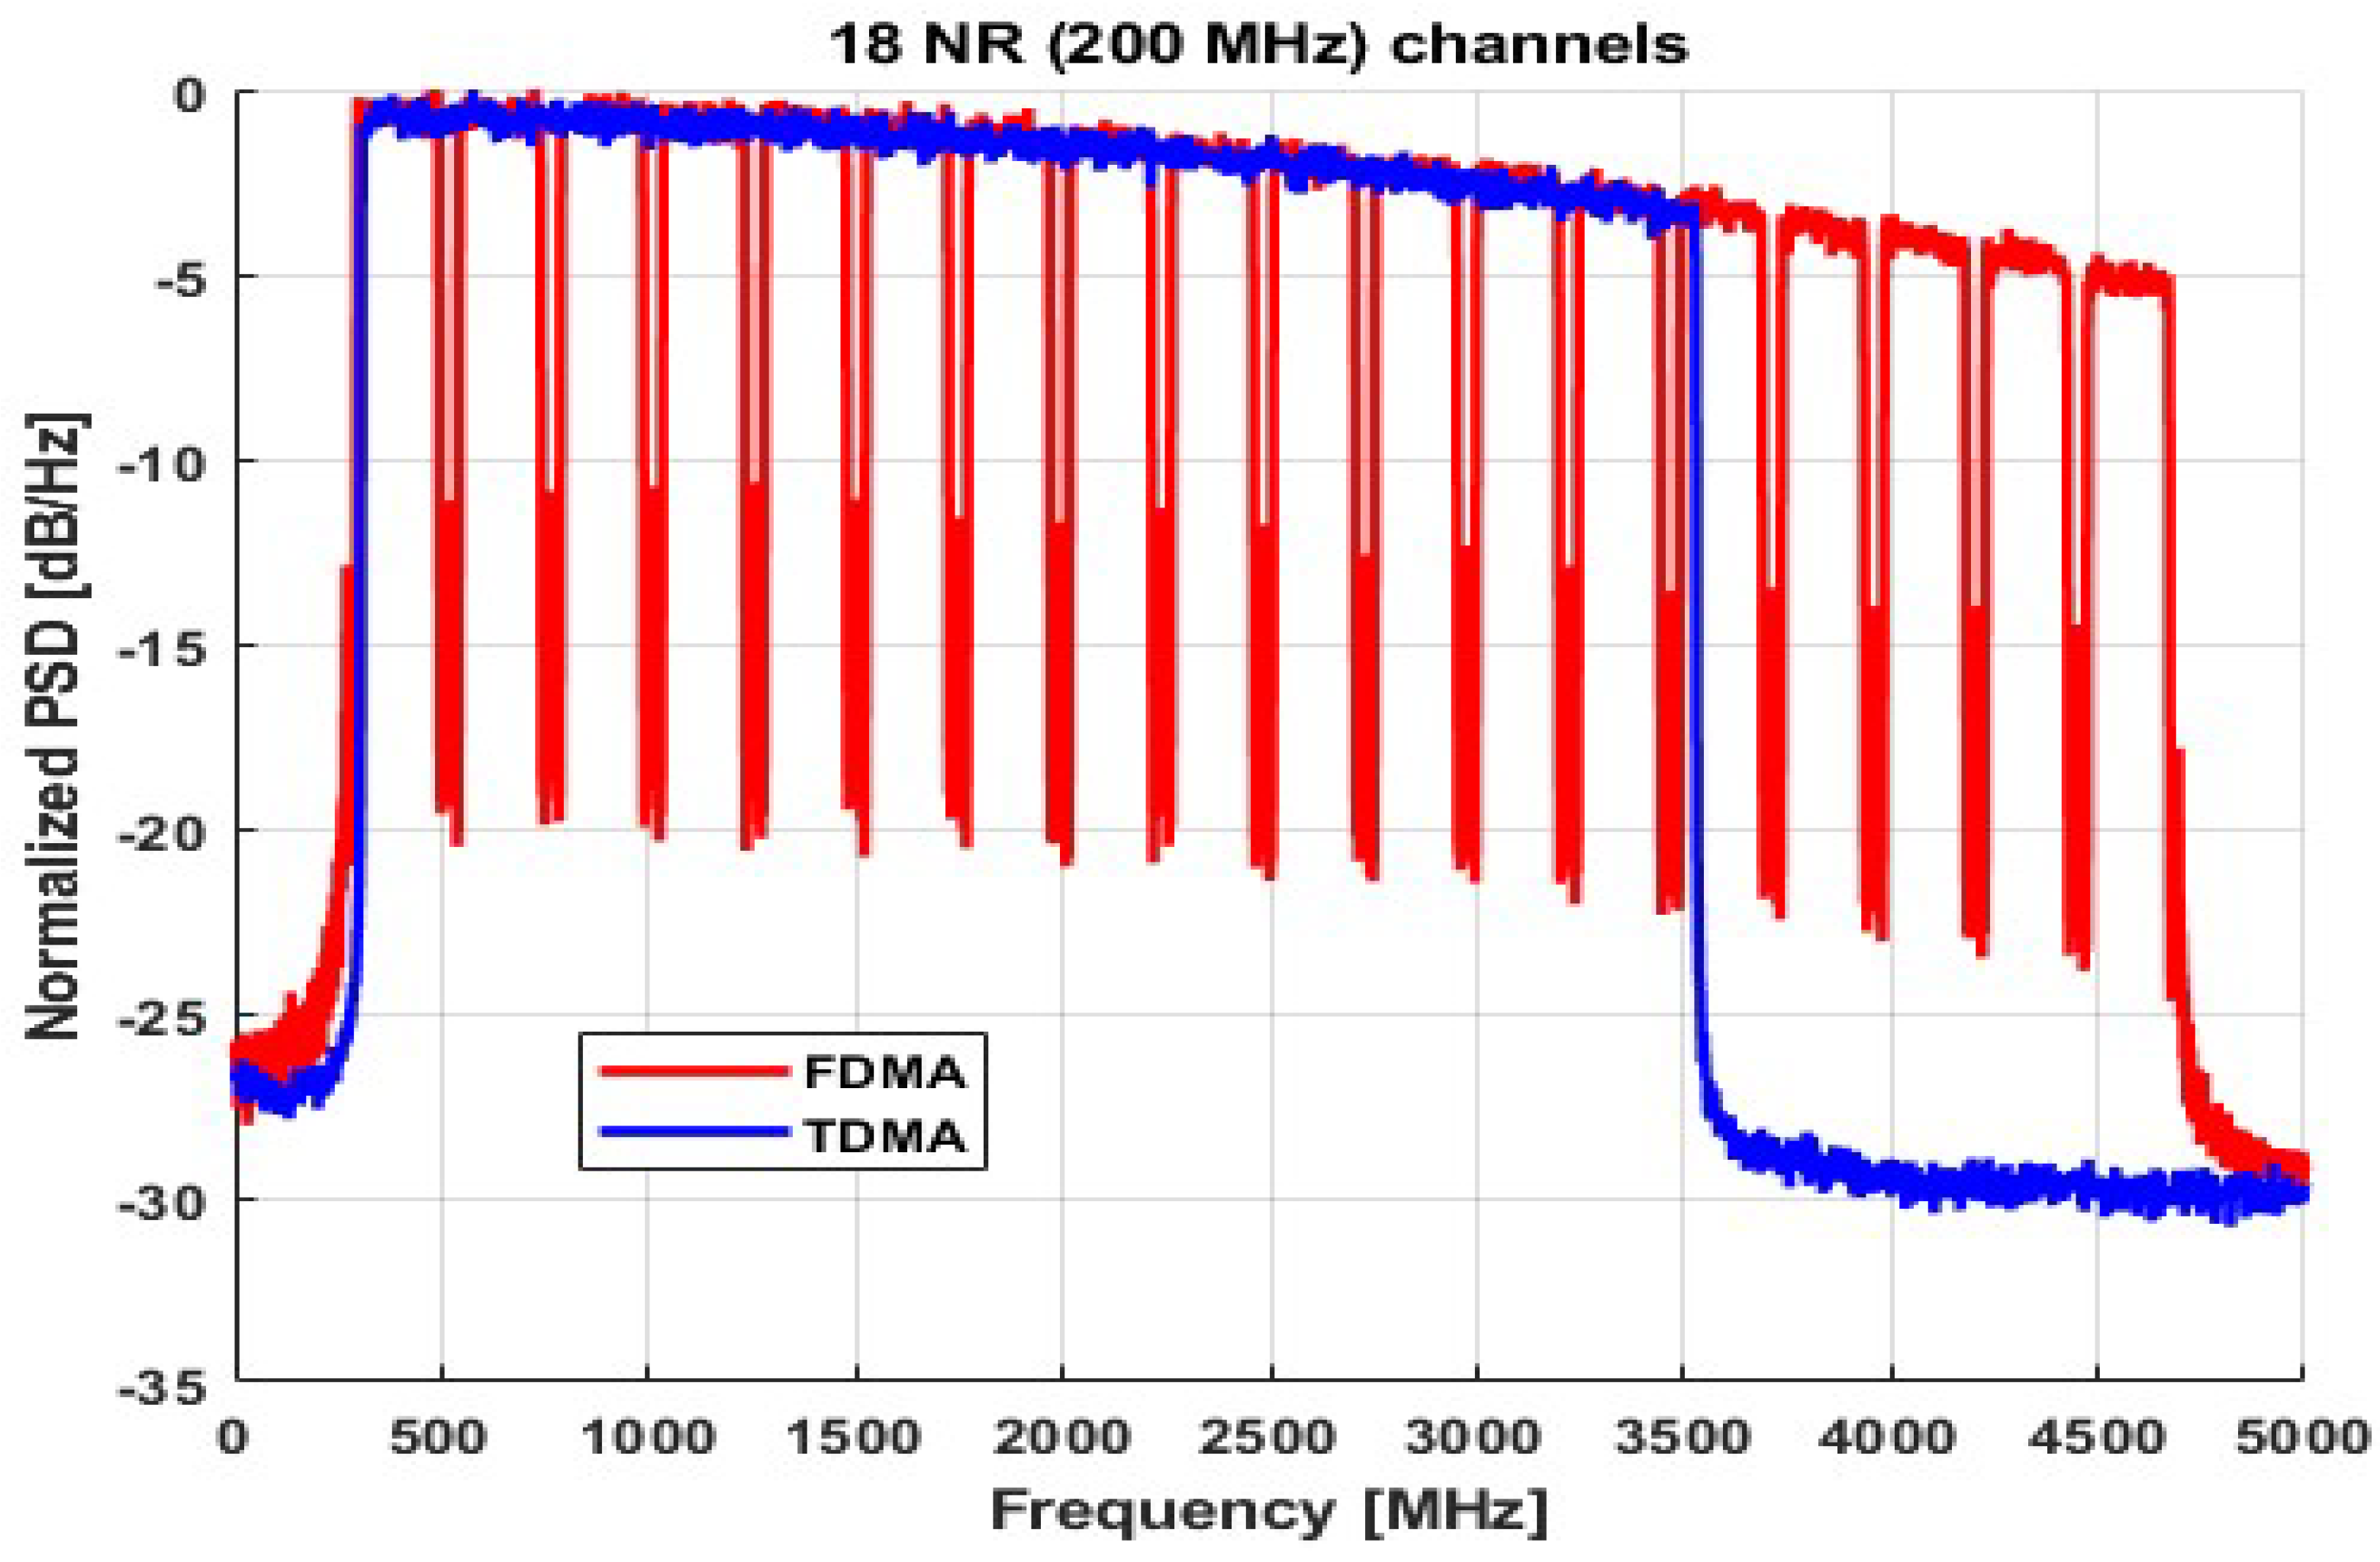
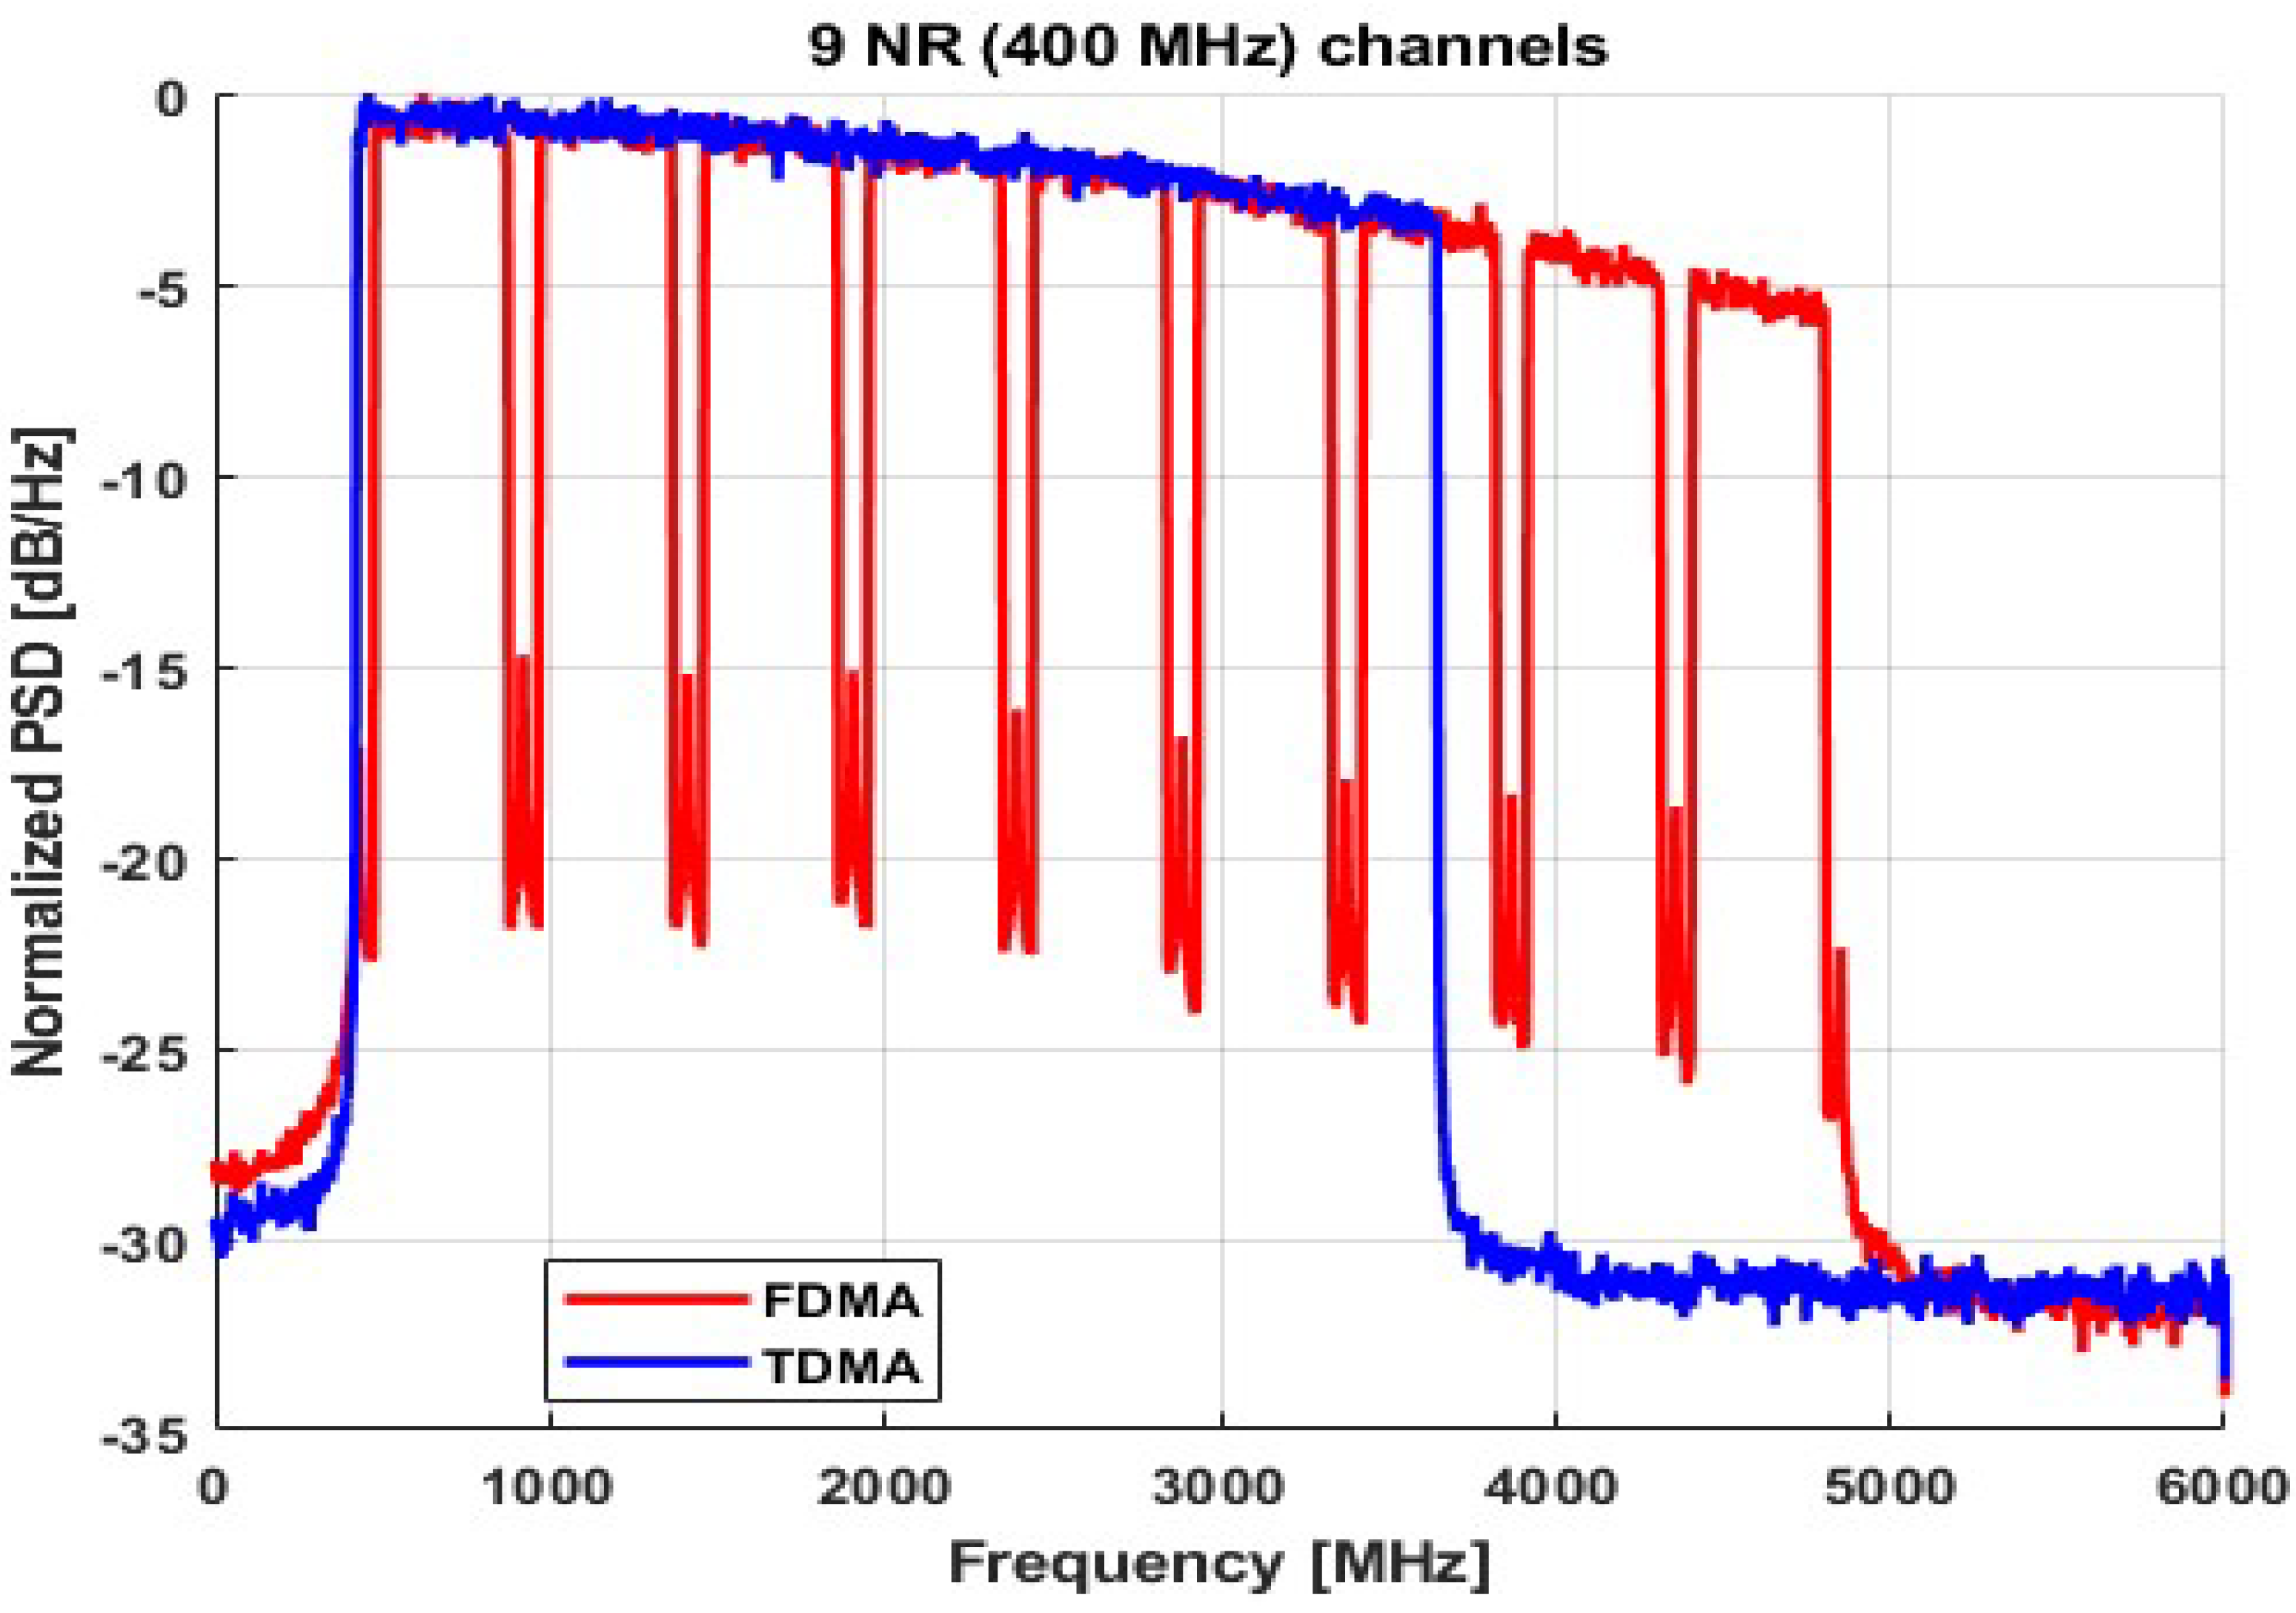
The electrical spectrum of SCs type 1 for n = 36, 2 for n = 18, and 3 for n = 9 NR channels at the input of RX DSP obtained by FDMA and TDMA aggregation is shown in Figure 7, Figure 8 and Figure 9, respectively. The red line is used for FDMA and the blue line is used for TDMA. The total bandwidth occupied by FDMA is obtained as n × sampling rate of each NR channel = ~4700 MHz (including 300 MHz guard from DC) for all SCs types. Instead, the total bandwidth occupied by TDMA is n × bandwidth (BW) of each NR channel = ~3600 MHz for all SCs types. Hence, TDMA saves ~1.1 GHz bandwidth when compared with FDMA for the same number of channel aggregation and SCs, as described in Table 2.
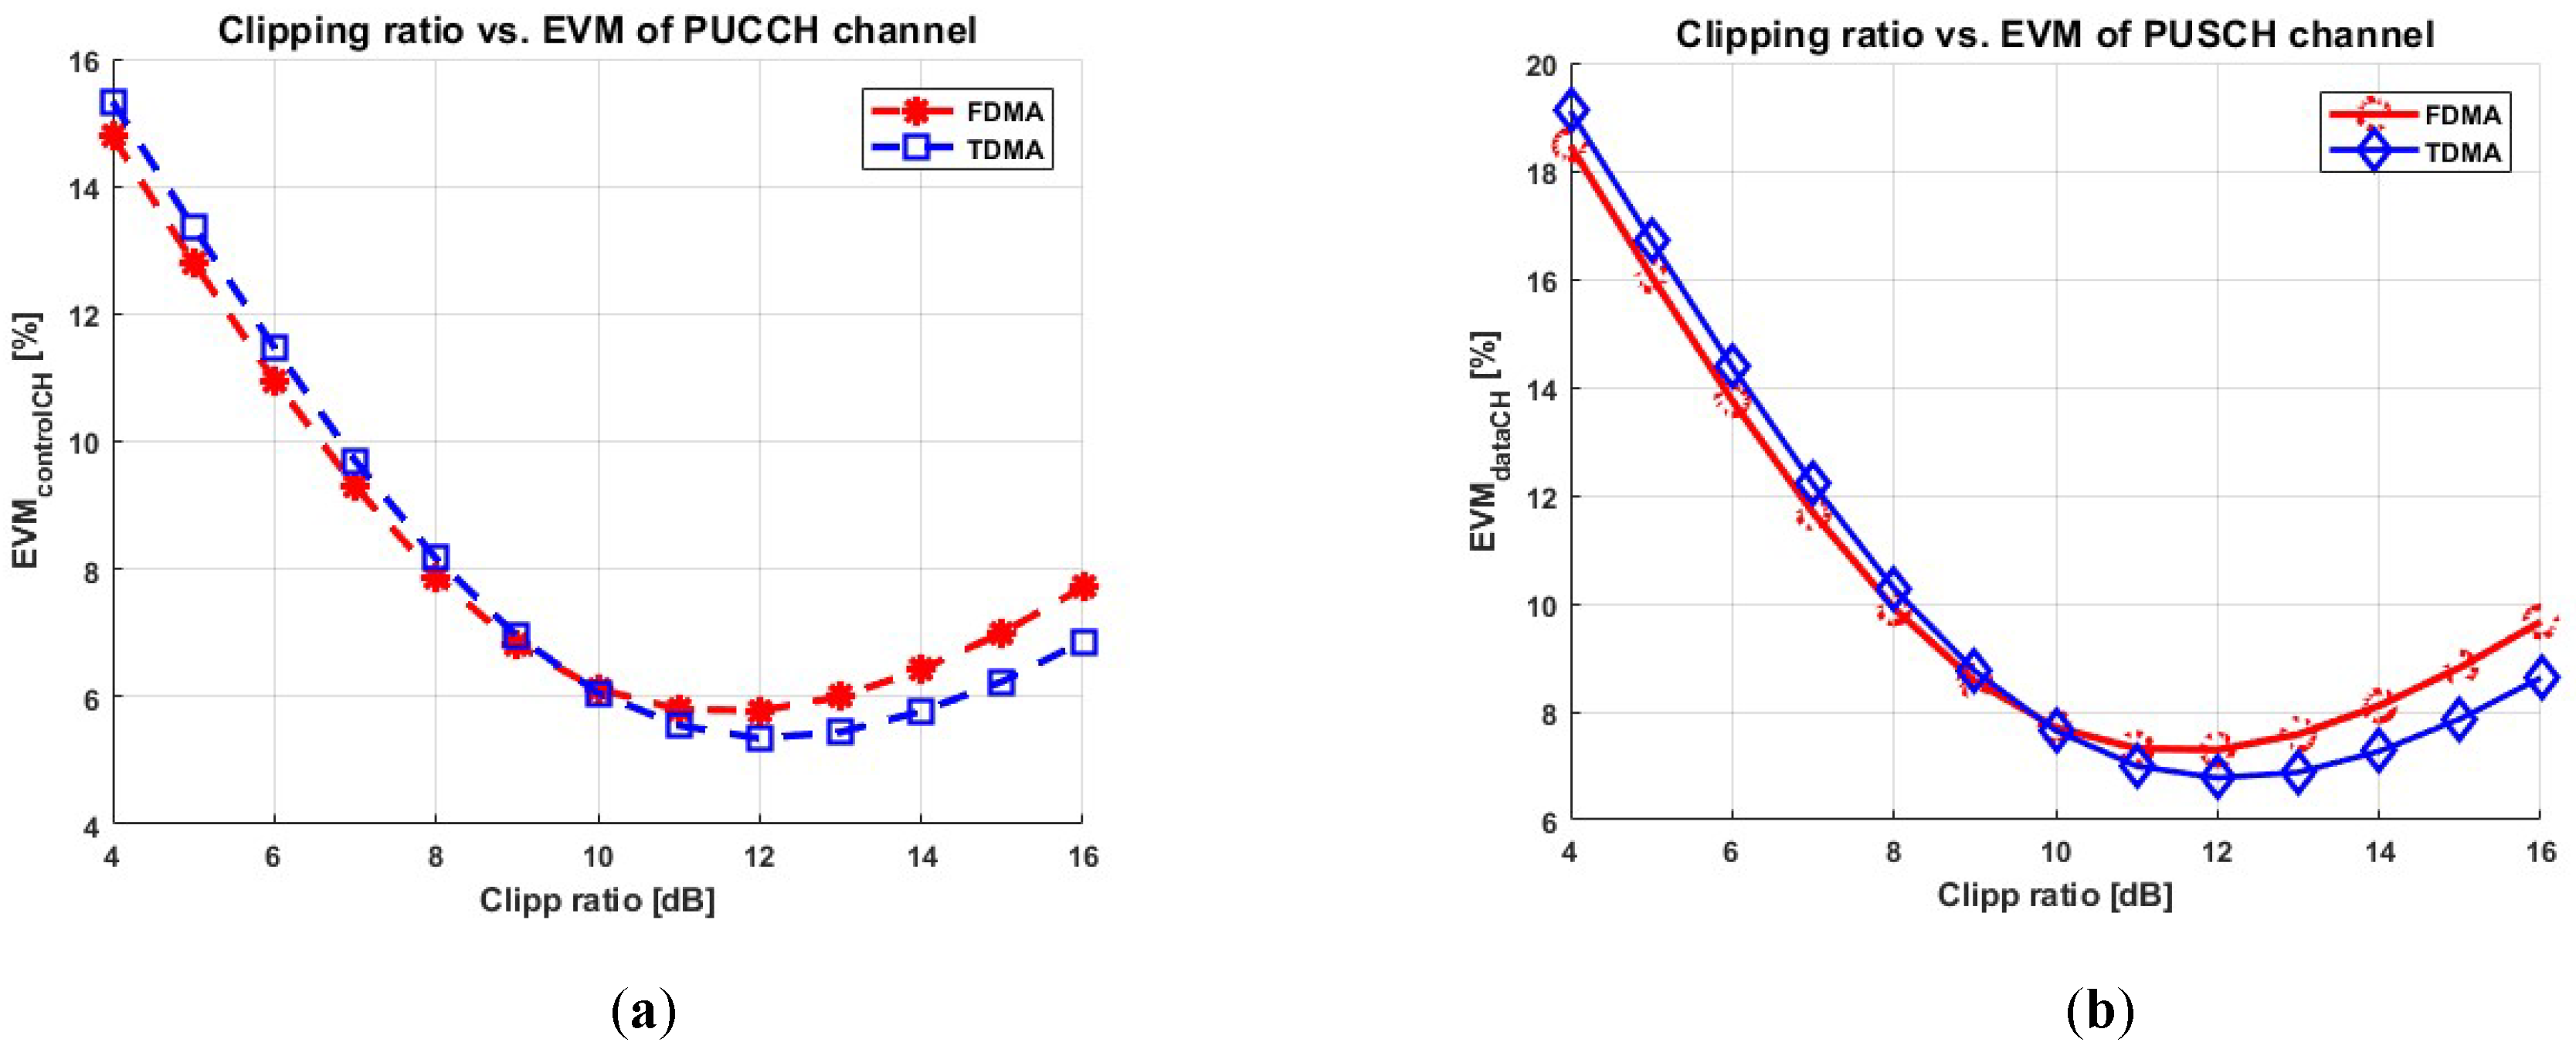
The clipping optimization for SCs type 1 for n = 36, 2 for n = 18, and 3 for n = 9 NR channels on both signal types (PUCCH and PUSCH) at 29 dB ODN loss is shown in Figure 10a,b, Figure 11a,b and Figure 12a,b, respectively. The optimum clipping ratios for both signal types, DSP aggregation techniques, and all SCs types are obtained as 12 dB, as described in Table 2.
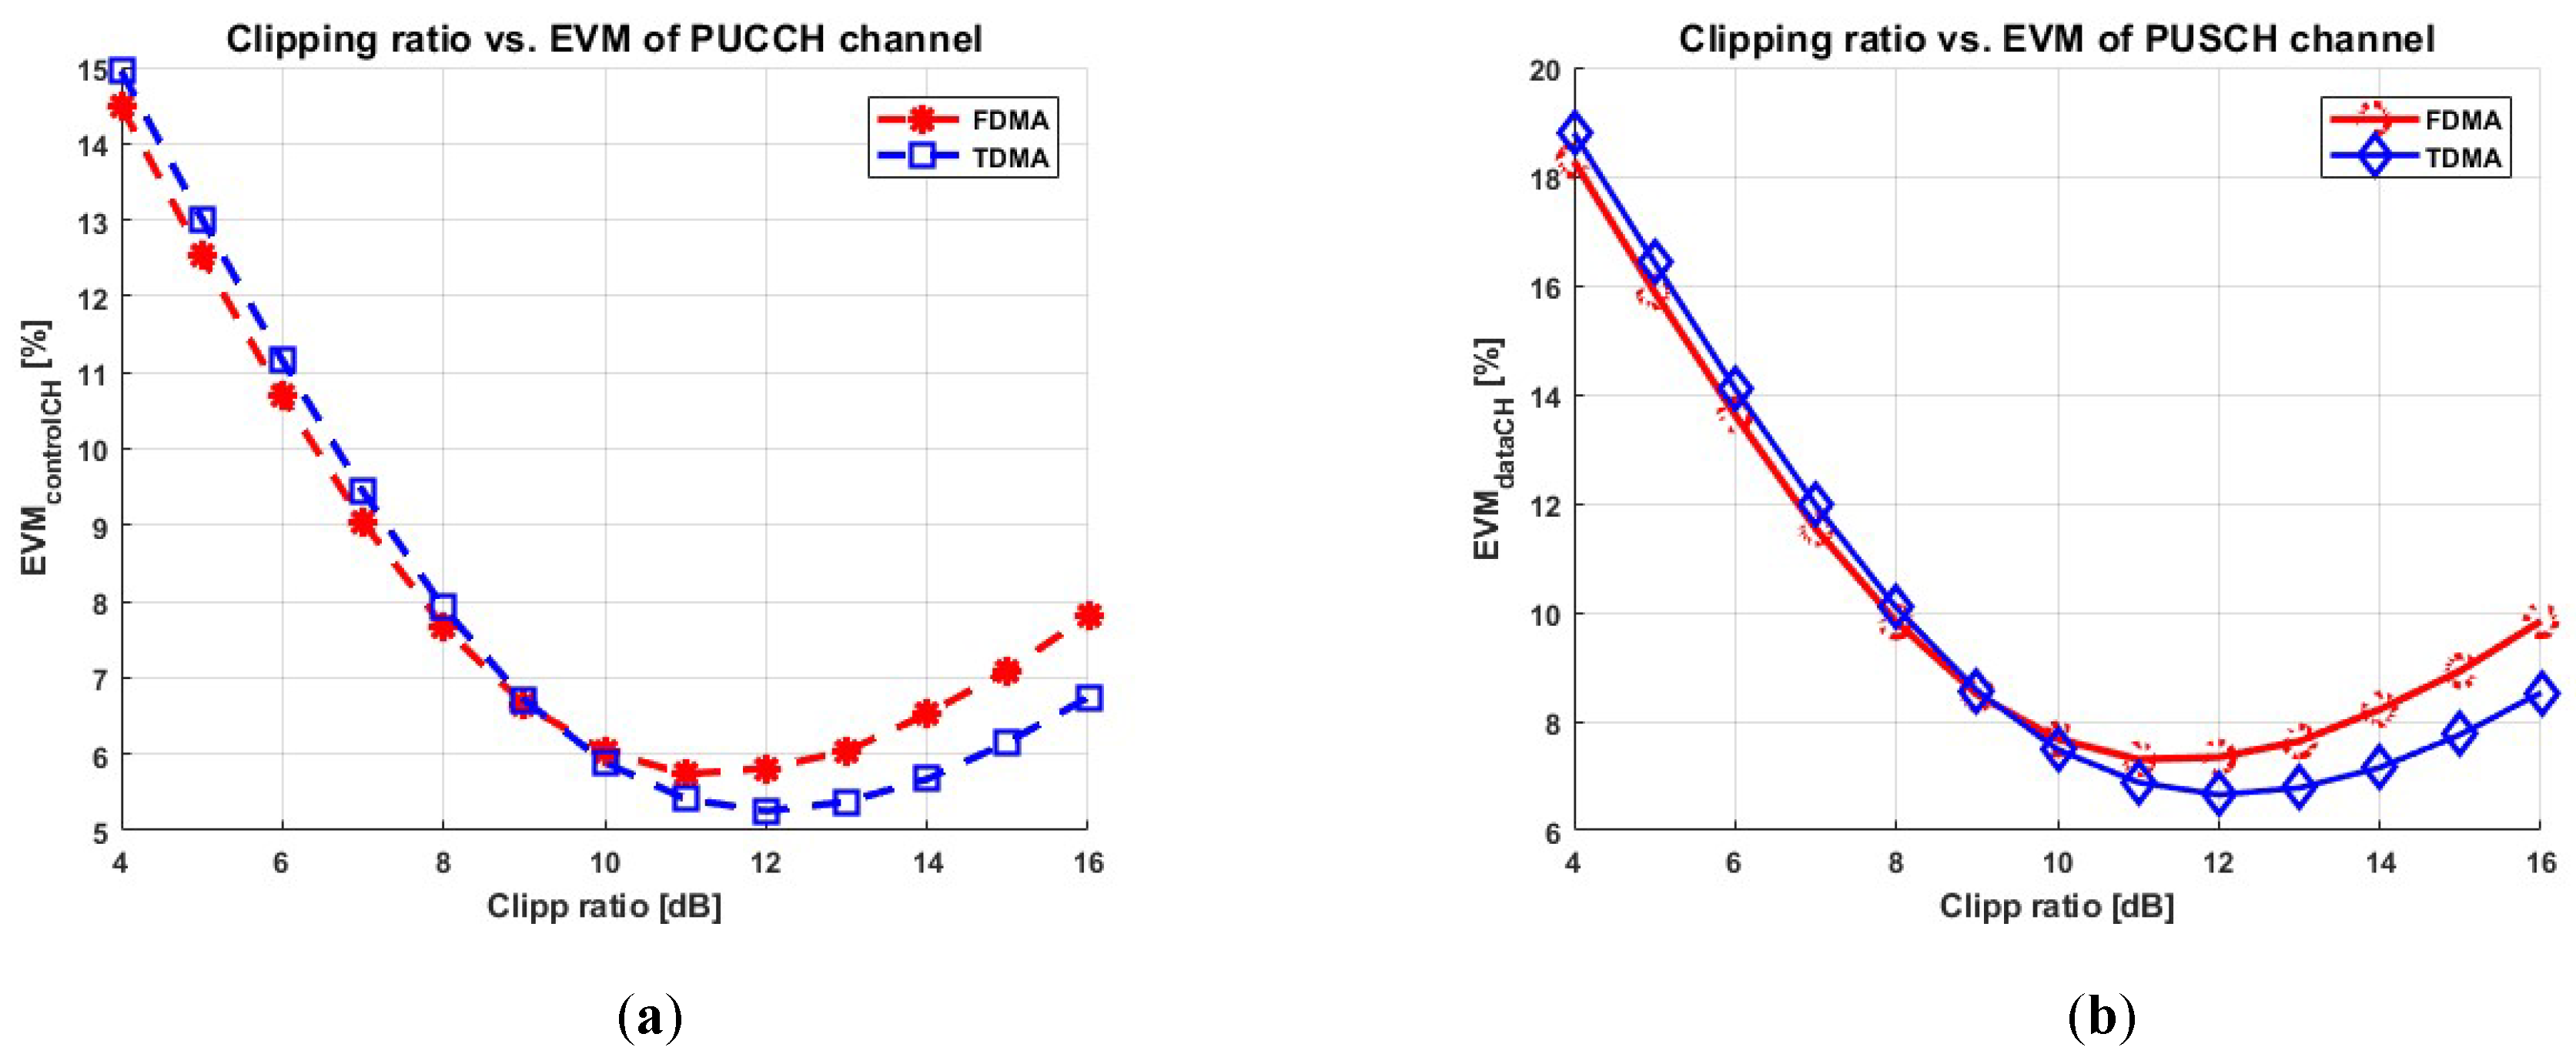
The EVM (mean) as a function of the ODN loss for SCs type 1 for n = 36, 2 for n = 18, and 3 for n = 9 NR channels evaluated at the optimum clipping for PUCCH and PUSCH is reported in Figure 13a,b, Figure 14a,b, and Figure 15a,b, respectively. The mean EVM performance of the TDMA scheme is slightly better at higher ODN loss for both signal types (PUCCH and PUSCH). This is associated with TDMA’s spectral compactness when compared with FDMA, which is less affected by the optical channel response towards the higher channels, and the maximum reach for each case is summarized in Table 2.
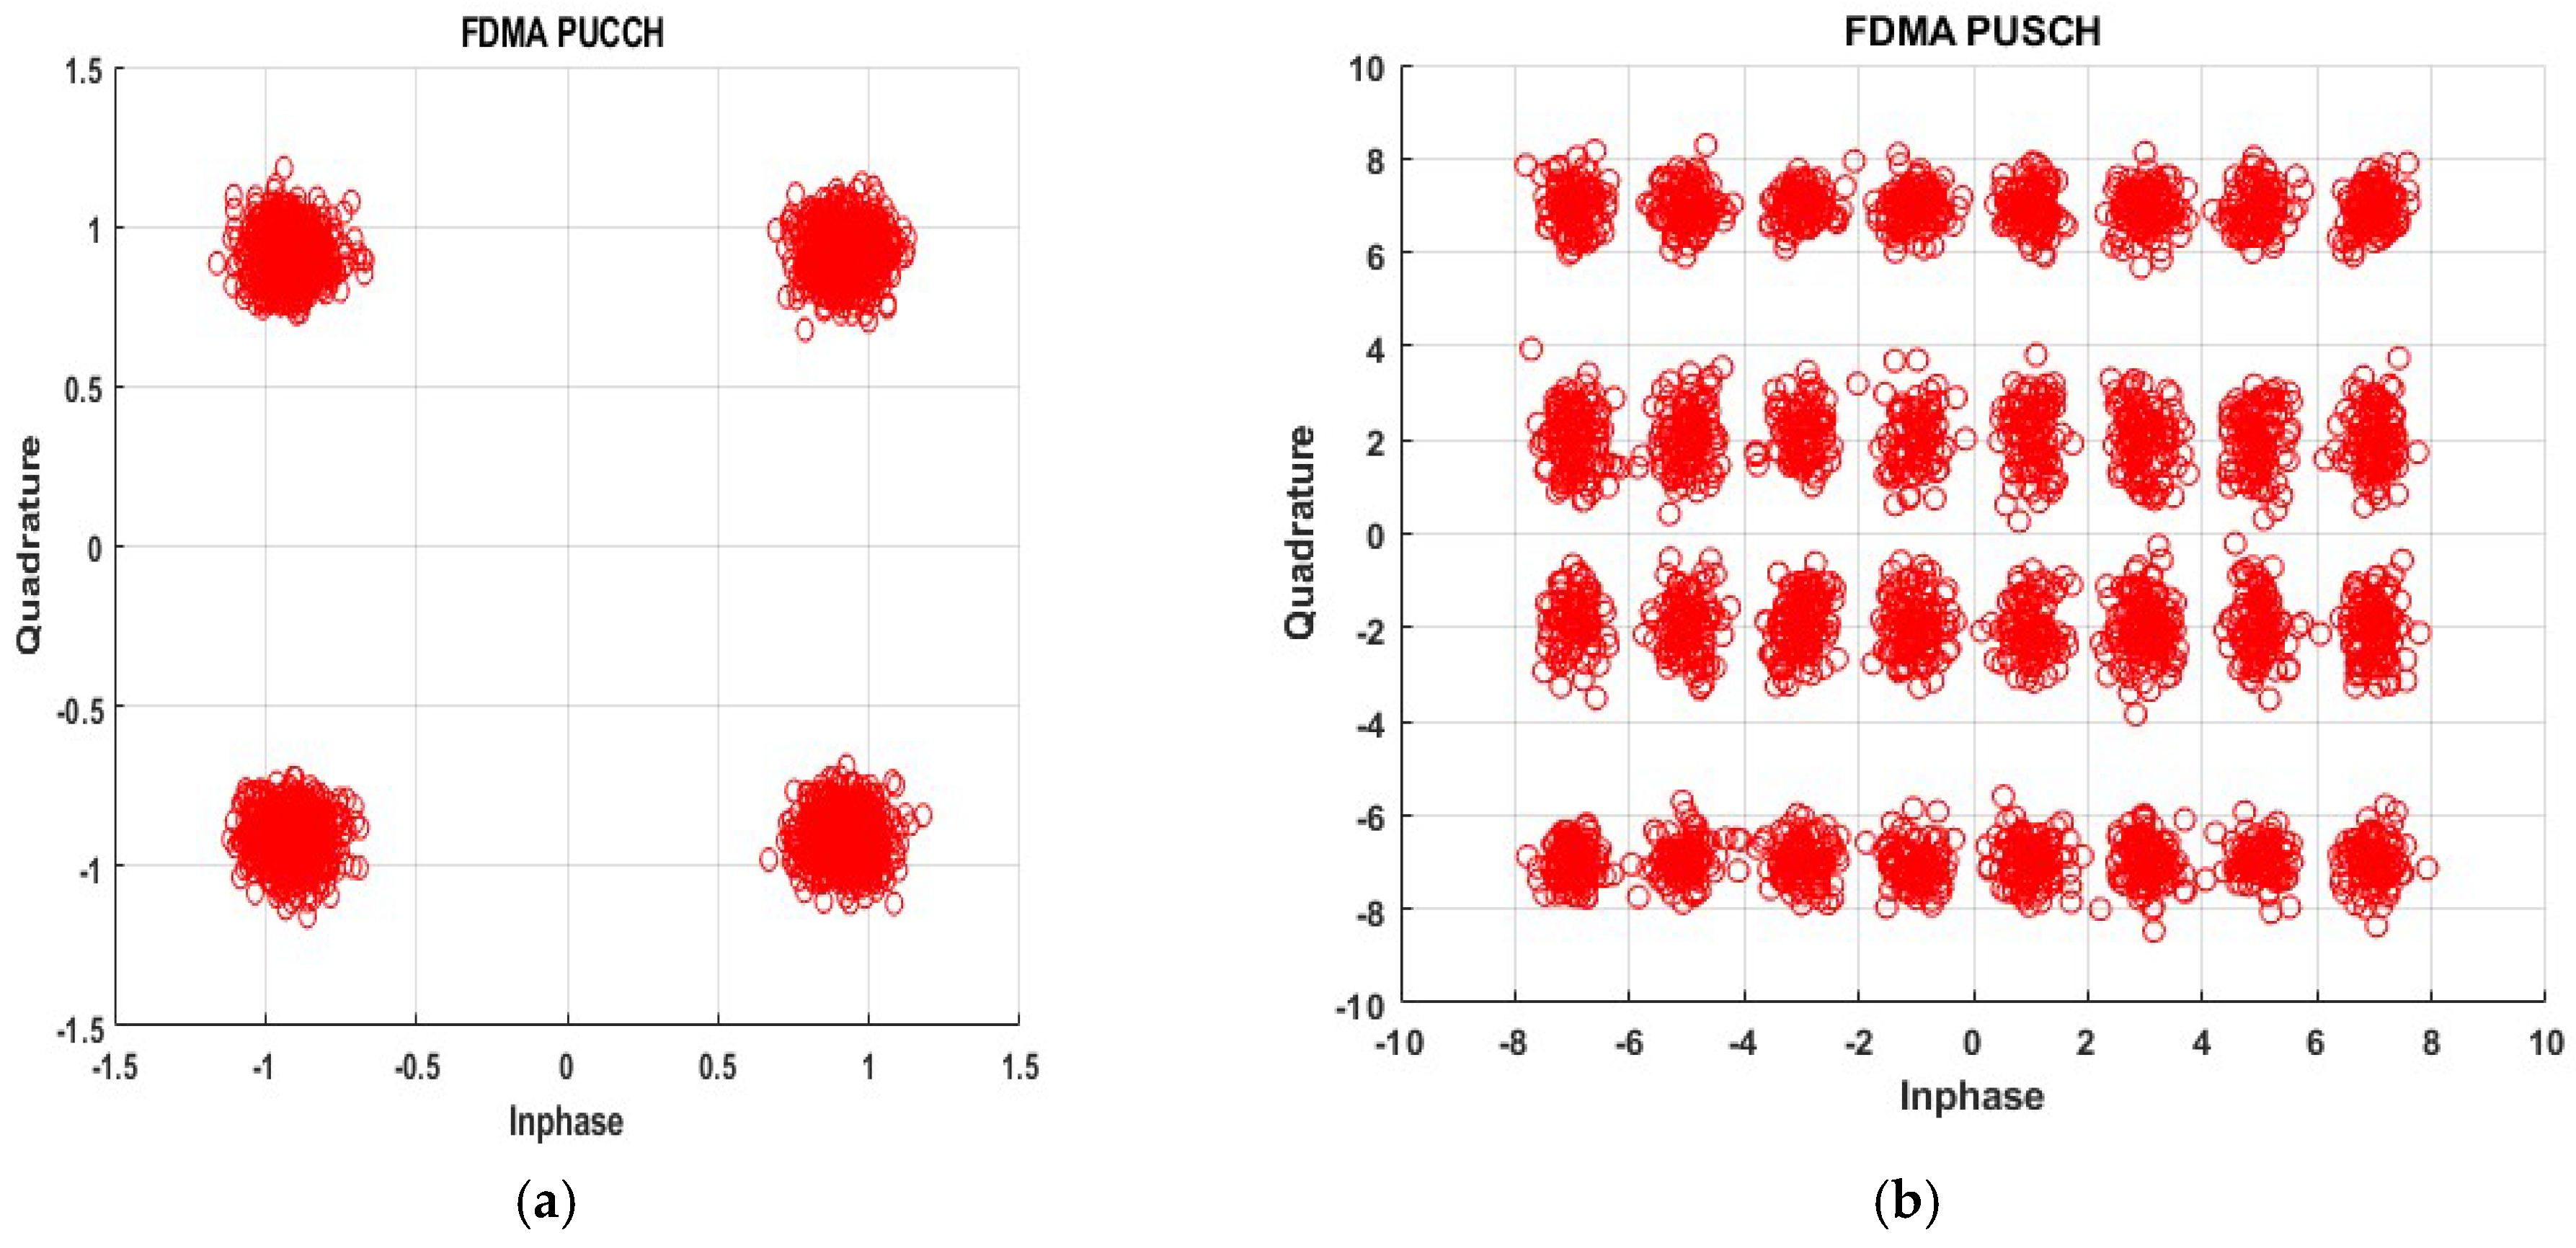
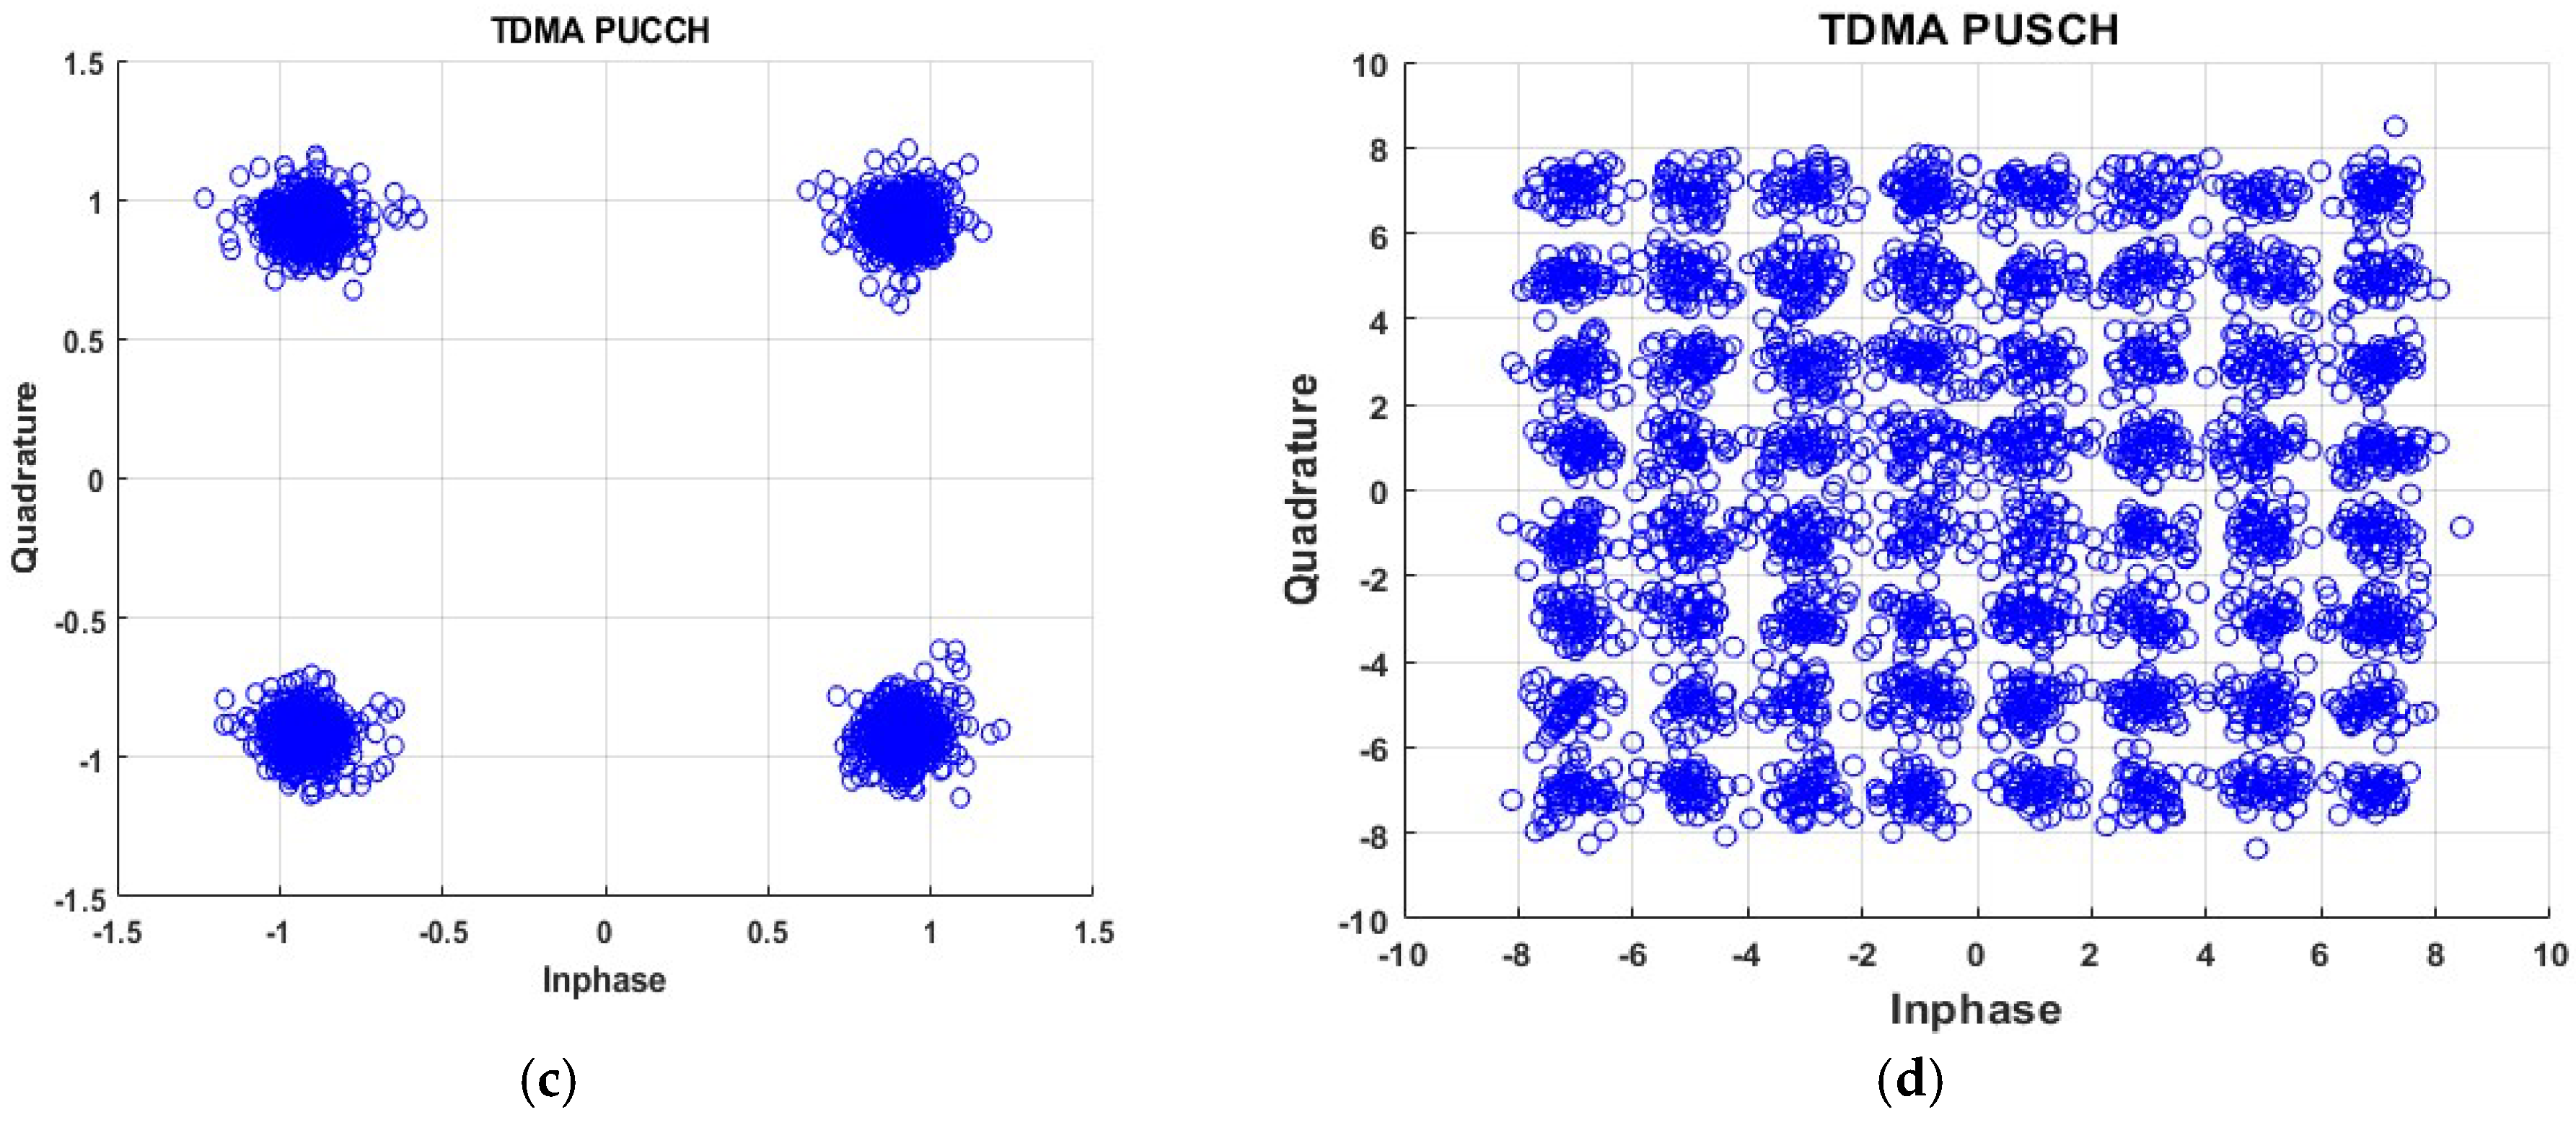
The decoded constellation after channel equalization on the ninth NR (400 MHz) SCs type 3 channel is shown in Figure 16. Figure 16a,b show the receive signal constellation of PUCCH at EVM = 6% and PUSCH at EVM = 7.5%, respectively, obtained using FDMA. Figure 16c,d show the receive signal constellation of PUCCH at EVM = 5.5% and PUSCH EVM = 6.5%, respectively, using TDMA 29 dB ODN loss.
5. Conclusions
The performance of uplink NR channels is studied for the scalable SCs types on an A-RoF link based on FDMA and TDMA DSP aggregation techniques. The TDMA approach saves approximately 1 GHz of bandwidth occupation when compared with FDMA, which also leads to a slight EVM performance gain. Hence, we conclude that TDMA is a good candidate for the upcoming next generation fronthaul solution.
Author Contributions
B.D.M. contributed to the statement of the research idea, performed the simulation analysis, and contributed to the research discussions and writing of the paper. P.T.-F. contributed to the research discussions, guidance of the research, and revision of the manuscript. R.G. contributed to the statement of the research idea, research discussions, guidance of the research, and revision of the manuscript.
Funding
This research received no external funding.
Acknowledgments
This work was carried out under the PhotoNext initiative at Politecnico di Torino (http://www.photonext.polito.it/).
Conflicts of Interest
The authors declare no conflict of interest.
References
- Jeon, J. NR Wide Bandwidth Operations. IEEE Commun. Mag. 2018, 56, 42–46. [Google Scholar] [CrossRef] [Green Version]
- Mello, D.A.A.; Barreto, A.N.; Barbosa, F.A.; Osorio, C.; Fiorani, M.; Monti, P. Spectrally Efficient Fronthaul Architectures for a Cost-Effective 5G C-RAN. In Proceedings of the ICTON, WC2.4, Trento, Italy, 10–14 July 2016. [Google Scholar]
- Boccardi, F.; Heath, R.W.; Lozano, A.; Marzetta, T.L.; Popovski, P. Five disruptive technology direction for 5G. IEEE Commun. Mag. 2014, 52, 74–80. [Google Scholar] [CrossRef]
- Chathuria, R.; Elian, W.; Ampalavanapillai, N.; Chamil, J.; Christina, L. 5G CRAN architecture: A comparison multiple optical fronthaul networks. In Proceedings of the International Conference on Optical Network Design and Modeling (ONDM), Budapest, Hungary, 15–17 May 2017. [Google Scholar]
- China Mobile Research Institute. C-RAN: The Road towards Green RAN. White Paper. 2013. Available online: https://www.ngmn.org (accessed on 12 March 2015).
- CPRI Specification V7.0. October 2015. Available online: http://www.cpri.info/downloads/CPRI_v_7_0_2015-10-09.pdf (accessed on 10 October 2018).
- Pizzinat, A.; Chanclou, P.; Saliou, F.; Diallo, T. Things You Should Know About Fronthaul. J. Lightwave Technol. 2015, 33, 1077–1083. [Google Scholar] [CrossRef]
- 3GPP. 3GPP TS 38.211 V15.2.0: NR; Physical channels and modulations (Release 15) Tech. rep. Jun. 2018.
- 3GPP. 3GPP TS 38.101-1 V1.0.0: NR; User Equipment (UE) radio transmission and reception; Part 1: Range 1 Standalone (Release 15). Tech. rep. Dec. 2017.
- Befekadu, M.; Straullu, S.; Abrate, S.; Gaudino, R. Experimental Optimization of DSP-Aggregated Front-hauling Transmission for up to 4 × 96 LTE radio waveforms. In Proceedings of the ECOC 2016 42th European Conference and Exhibition on Optical Communication, Düsseldorf, Germany, 18–22 September 2016. [Google Scholar]
- Hakim, N.Z.; Bahaa, E.; Saleh, A.; Teich, M.C. Signal-to-Noise Ratio for Lightwave systems Using Avalnche Photodiodes. J. Lightwave Technol. 1991, 9, 318–320. [Google Scholar] [CrossRef]
- Befekadu, M.; Straullu, S.; Torres-Ferrera, P.; Gaudino, R. DSP-assisted channel aggregationoptions for Next-Generation Mobile Fronthauling. In Proceedings of the 20th International Conference on Transparent Optical Networks (ICTON), Bucharest, Romania, 1–5 July 2018. [Google Scholar]
- Torres-Ferrera, P.; Straullu, S.; Abrate, S.; Gaudino, R. Upstream and downstream analysis of an optical fronthaul system based on DSP-assisted channel aggregation. J. Opt. Commun. Netw. JOCN 2015, 9, 1191–1201. [Google Scholar] [CrossRef]
- Liu, X.; Zeng, H.; Chand, N.; Effenberger, F. Efficient Mobile Fronthaul via DSP-Based Channel Aggregation. J. Lightwave Technol. 2015, 34, 1556–1564. [Google Scholar] [CrossRef]
- Zeng, X.L.; Miller, N.C.; Effenberger, F. CPRI-Compatible Efficient Mobile Fronthalul Transmission via Equalized TDMA achieving 256 Gb/s CPRI-Equvalent Data Rate in a Single 10 GHz-Bandwidth IM-DD channel. In Proceedings of the Optical Fiber Communications Conference and Exhibition (OFC), Anaheim, CA, USA, 20–24 March 2016. [Google Scholar]
- Schmogrow, R.; Nebandahl, B.; Winter, M.; Josten, A.; Hellerkuss, D.; Koeng, S.; Meyer, J.; Dreschmann, M.; Hueber, M.; Koos, C.; et al. Error Vector Magnitude as a Performance Measure for Advanced Modulation Formats. IEEE Photonics Technol. Lett. 2012, 24, 61–63. [Google Scholar] [CrossRef]
Figure 1.
Intensity modulation and direct detection (IM-DD) analogue radio-over-fiber (A-RoF) model. Transmitter side consisting of transmitter digital signal processing (TX DSP), digital-to-analogue converter (DAC), continuous wave (CW) laser, wavelength division multiplexer (WDM) electrical driver, and external Mach–Zehnder modulator (MZM). The optical channel consists of a standard single mode fiber (SMF) and variable optical attenuator (VOA). The receiver side consists of avalanche photodetector (APD), analogue-to-digital converter (ADC), and receiver digital signal processing (RX DSP). ODN—optical distribution network.

Figure 2.
Frequency division multiple access (FDMA) TX/RX DSP block scheme. NR—new radio.

Figure 3.
Time division multiple access (TDMA) TX/RX DSP block scheme.

Figure 4.
Power spectral density (PSD) of aggregated 72 NR (50 MHZ) SCs type 0 channels at the receiver DSP input obtained at 20 dB optical distribution network (ODN) loss.
Figure 4.
Power spectral density (PSD) of aggregated 72 NR (50 MHZ) SCs type 0 channels at the receiver DSP input obtained at 20 dB optical distribution network (ODN) loss.

Figure 5.
Clipping optimization for 72 NR (50 MHz) channels at 29 dB ODN loss. (a) Physical uplink control channel (PUCCH); (b) physical uplink shared channel (PUSCH). EVM—error vector magnitude.
Figure 5.
Clipping optimization for 72 NR (50 MHz) channels at 29 dB ODN loss. (a) Physical uplink control channel (PUCCH); (b) physical uplink shared channel (PUSCH). EVM—error vector magnitude.

Figure 6.
Mean EVM vs. ODN loss for 72 NR (50 MHz) channels at 12 dB clipping. (a) PUCCH; (b) PUSCH.
Figure 6.
Mean EVM vs. ODN loss for 72 NR (50 MHz) channels at 12 dB clipping. (a) PUCCH; (b) PUSCH.

Figure 7.
Power spectral density of aggregated 36 NR (100 MHz) SCs type 1 channels at the receiver DSP input obtained at 20 dB ODN loss.
Figure 7.
Power spectral density of aggregated 36 NR (100 MHz) SCs type 1 channels at the receiver DSP input obtained at 20 dB ODN loss.

Figure 8.
Power spectral density of aggregated 18 NR (200 MHz) SCs type 2 channels at the receiver DSP input obtained at 20 dB ODN loss.
Figure 8.
Power spectral density of aggregated 18 NR (200 MHz) SCs type 2 channels at the receiver DSP input obtained at 20 dB ODN loss.

Figure 9.
Power spectral density of aggregated 9 NR (400 MHz) SCs type 3 channels at the receiver DSP input obtained at 20 dB ODN loss.
Figure 9.
Power spectral density of aggregated 9 NR (400 MHz) SCs type 3 channels at the receiver DSP input obtained at 20 dB ODN loss.

Figure 10.
Clipping optimization for 36 NR (100 MHz) channels at 29 dB ODN loss. (a) PUCCH; (b) PUSCH.
Figure 10.
Clipping optimization for 36 NR (100 MHz) channels at 29 dB ODN loss. (a) PUCCH; (b) PUSCH.

Figure 11.
Clipping optimization for 18 NR (200 MHz) channels at 29 dB ODN loss. (a) PUCCH; (b) PUSCH.
Figure 11.
Clipping optimization for 18 NR (200 MHz) channels at 29 dB ODN loss. (a) PUCCH; (b) PUSCH.

Figure 12.
Clipping optimization for 9 NR (400 MHz) channels at 29 dB ODN loss. (a) PUCCH; (b) PUSCH.
Figure 12.
Clipping optimization for 9 NR (400 MHz) channels at 29 dB ODN loss. (a) PUCCH; (b) PUSCH.

Figure 13.
Mean EVM vs. ODN loss for 36 NR (100 MHz) channels at 12 dB clipping. (a) PUCCH; (b) PUSCH.
Figure 13.
Mean EVM vs. ODN loss for 36 NR (100 MHz) channels at 12 dB clipping. (a) PUCCH; (b) PUSCH.

Figure 14.
Mean EVM vs. ODN loss for 18 NR (200 MHz) channels at 12 dB clipping. (a) PUCCH; (b) PUSCH.
Figure 14.
Mean EVM vs. ODN loss for 18 NR (200 MHz) channels at 12 dB clipping. (a) PUCCH; (b) PUSCH.

Figure 15.
Mean EVM vs. ODN loss for 9 NR (400 MHz) channels at 12 dB clipping. (a) PUCCH; (b) PUSCH.
Figure 15.
Mean EVM vs. ODN loss for 9 NR (400 MHz) channels at 12 dB clipping. (a) PUCCH; (b) PUSCH.

Figure 16.
Decoded signal constellation of the ninth NR (400 MHz) channel at 29 dB ODN loss. (a) FDMA PUCCH; (b) FDMA PUSCH; (c) TDMA PUCCH; (d) TDMA PUSCH.
Figure 16.
Decoded signal constellation of the ninth NR (400 MHz) channel at 29 dB ODN loss. (a) FDMA PUCCH; (b) FDMA PUSCH; (c) TDMA PUCCH; (d) TDMA PUSCH.


Table 1.
New radio (NR) parameter based on type of spacings (SCs).
| SCs Type | SCs [KHz] | Cyclic Prefix symbols | Maximum bandwidth [MHz] | Sampling rate [MSa/s] |
|---|---|---|---|---|
| 0 | 15 | 144 | 50 | 61.44 |
| 1 | 30 | 144 | 100 | 122.88 |
| 2 | 60 | 144 | 200 | 245.76 |
| 3 | 120 | 144 | 400 | 491.52 |
Table 2.
Summary of parameters and results for different types of SCs. BW—bandwidth; TDMA—time division multiple access; FDMA—frequency division multiple access.
Table 2.
Summary of parameters and results for different types of SCs. BW—bandwidth; TDMA—time division multiple access; FDMA—frequency division multiple access.
| Parameters | Type 0 | Type 1 | Type 2 | Type 3 |
|---|---|---|---|---|
| n | 72 | 36 | 18 | 9 |
| BW of each NR channel (MHZ) | 50 | 100 | 200 | 400 |
| Sampling rate of each NR channel (MSa/s) | 61.44 | 122.88 | 245.76 | 491.52 |
| Total BW TDMA (GHz) | 3.6 | 3.6 | 3.6 | 3.6 |
| Total BW FDMA (GHZ) | 4.72 | 4.72 | 4.72 | 4.72 |
| BW TDMA − BW FDMA (GHz) | ~1.1 | ~1.1 | ~1.1 | ~1.1 |
| Optimum Clipping Ratio | 12 dB | 12 dB | 12 dB | 12 dB |
© 2018 by the authors. Licensee MDPI, Basel, Switzerland. This article is an open access article distributed under the terms and conditions of the Creative Commons Attribution (CC BY) license (http://creativecommons.org/licenses/by/4.0/).
Share and Cite
MDPI and ACS Style
Mengesha, B.D.; Torres-Ferrera, P.; Gaudino, R. Analysis of 5G New Radio Uplink Signals on an Analogue-RoF System Based on DSP-Assisted Channel Aggregation. Appl. Sci. 2019, 9, 47. https://doi.org/10.3390/app9010047
AMA Style
Mengesha BD, Torres-Ferrera P, Gaudino R. Analysis of 5G New Radio Uplink Signals on an Analogue-RoF System Based on DSP-Assisted Channel Aggregation. Applied Sciences. 2019; 9(1):47. https://doi.org/10.3390/app9010047
Chicago/Turabian StyleMengesha, Befekadu D., Pablo Torres-Ferrera, and Roberto Gaudino. 2019. "Analysis of 5G New Radio Uplink Signals on an Analogue-RoF System Based on DSP-Assisted Channel Aggregation" Applied Sciences 9, no. 1: 47. https://doi.org/10.3390/app9010047
Note that from the first issue of 2016, this journal uses article numbers instead of page numbers. See further details here.