Article

Material Characterization for Reliable Resin Transfer Molding Process Simulation

1
University of Bologna, Department of Industrial Engineering, Via Fontanelle 40, 47121 Forlì (FC), Italy
2
ESI Italia, Viale Angelo Masini, 36, 40126 Bologna (BO), Italy
*
Authors to whom correspondence should be addressed.
Appl. Sci. 2020, 10(5), 1814; https://doi.org/10.3390/app10051814
Submission received: 11 February 2020 / Revised: 28 February 2020 / Accepted: 3 March 2020 / Published: 6 March 2020
(This article belongs to the Special Issue Composite Materials in Design Processes)

Abstract

:
Resin transfer molding (RTM) technologies are widely used in automotive, marine, and aerospace applications. The need to evaluate the impact of design and production critical choices, also in terms of final costs, leads to the wider use of numerical simulation in the preliminary phase of component development. The main issue for accurate RTM analysis is the reliable characterization of the involved materials. The aim of this paper is to present a validated methodology for material characterization to be implemented and introduce data elaboration in the ESI PAM-RTM software. Experimental campaigns for reinforcement permeabilities and resin viscosity measurement are presented and discussed. Finally, the obtained data are implemented in the software and then compared to experimental results in order to validate the described methodology.

1. Introduction

Fiber-reinforced composite materials are widely used in several lightweight applications in the nautical, aerospace, and automotive sectors due to high strength-to-density ratios. More extensive applications are limited by materials and technology costs. Even if the cost of carbon and glass fibers follows a decreasing trend, the manufacturing costs will still be almost constant if conventional high-performance technologies are used (i.e., autoclave manufacturing). Moreover, several composite technologies cannot provide a component cost reduction by increasing the production volume. To achieve a reliable component cost reduction, new out-of-autoclave technologies (like infusion technologies, prepreg compression technologies, or short-fiber compound processing) have been recently optimized for industrial use.
Among the others, resin transfer molding (also known as light RTM), and its variants vacuum-assisted resin infusion (VARI) and high-pressure resin transfer molding (HP-RTM), are promising technologies for producing complex components with high performance at a higher volume rate. Moreover, these processes are economically advantageous with respect to the others, such as autoclave curing of pre-impregnated layers, due to cheaper materials and shorter processing times.
RTM technologies consist of placing a dry three-dimensional preform into a mold cavity and injecting resin-hardener mixture into the closed mold. The injection pressure (assisted by a vacuum for VARI or high pressure in HP-RTM processing), together with fiber permeability, is able to produce components with 50% and higher fiber volume fraction, thus providing excellent mechanical properties [1,2,3]. Nevertheless, in the light RTM process, the low flow rate of resin and low injection pressure result in a long resin injection time, thus hampering the use of fast-cure resins and, consequently, the overall productivity. As a consequence, the light RTM process is mainly limited to the low-volume manufacturing capability and, only to a minor extent, to slightly lower mechanical properties related to the lower fiber volume fraction. High-volume manufacturing with RTM is possible only if the process cycle time is significantly reduced. VARI and HP-RTM variants are improvements in this direction. Due to the differential pressure between inlet and outlet flows (VARI) or to higher flow rates (HP-RTM), together with the choice of adequate resin and hardener, production time can be reduced. A critical point of RTM technologies is the assurance of a full impregnation of the component, which is influenced by reinforcement types, the number of layers, resin viscosity, position of resin injection (ports), and vacuum extraction (vents). As molds can reach very high manufacturing costs when wide components are involved or when metal molds are required, tools supporting the design and critical process selection are needed in order to reduce uncertainties already in the preliminary phase of component development.
In this direction, Finite Element Method (FEM) software has been developed in the last few years to assist in component design and processing, predicting issues such as resin-rich areas, air bubbles, dry spots, zones of high porosity, etc., and for optimization of mold geometry and process parameters, such as port and vent locations [4,5,6,7]. In the case of critical molds, therefore, it is advantageous to perform a preliminary study by means of numerical simulation in order to avoid expensive experimental setups and prototypes.
In this context, the ESI group developed a PAM-RTM module, which can solve liquid resin infusion processes, like light and high-pressure RTM, compression resin transfer molding (C-RTM), and VARI. ESI’s approach, resulting from several years of collaboration with academics [8,9,10], consists of a finite element solver based on the coupling of resin flow (governed by Darcy’s law) and the preform behavior (considered as a porous medium undergoing deformations). Thus, the solver can provide the filling time and properties (thicknesses, fiber volume contents, geometry) of the final product [11].
However, accurate information on the material properties is needed for reliable simulations of the RTM process: in particular, reinforcement permeabilities and resin viscosity. Several works in the literature are available for the experimental determination of the permeability of RTM reinforcements [12]. Most of them evaluate the in-plane permeability [13,14], concluding that radial flow (liquid injected from transverse direction at well-defined locations to evaluate 2D permeability) and linear flow (liquid injected from one end of the composite preform to evaluate 1D permeability) experiments give consistent results. The through-the-thickness permeability is more complex to determine [15,16,17,18,19,20,21] and is usually neglected because of the small thicknesses of the preforms.
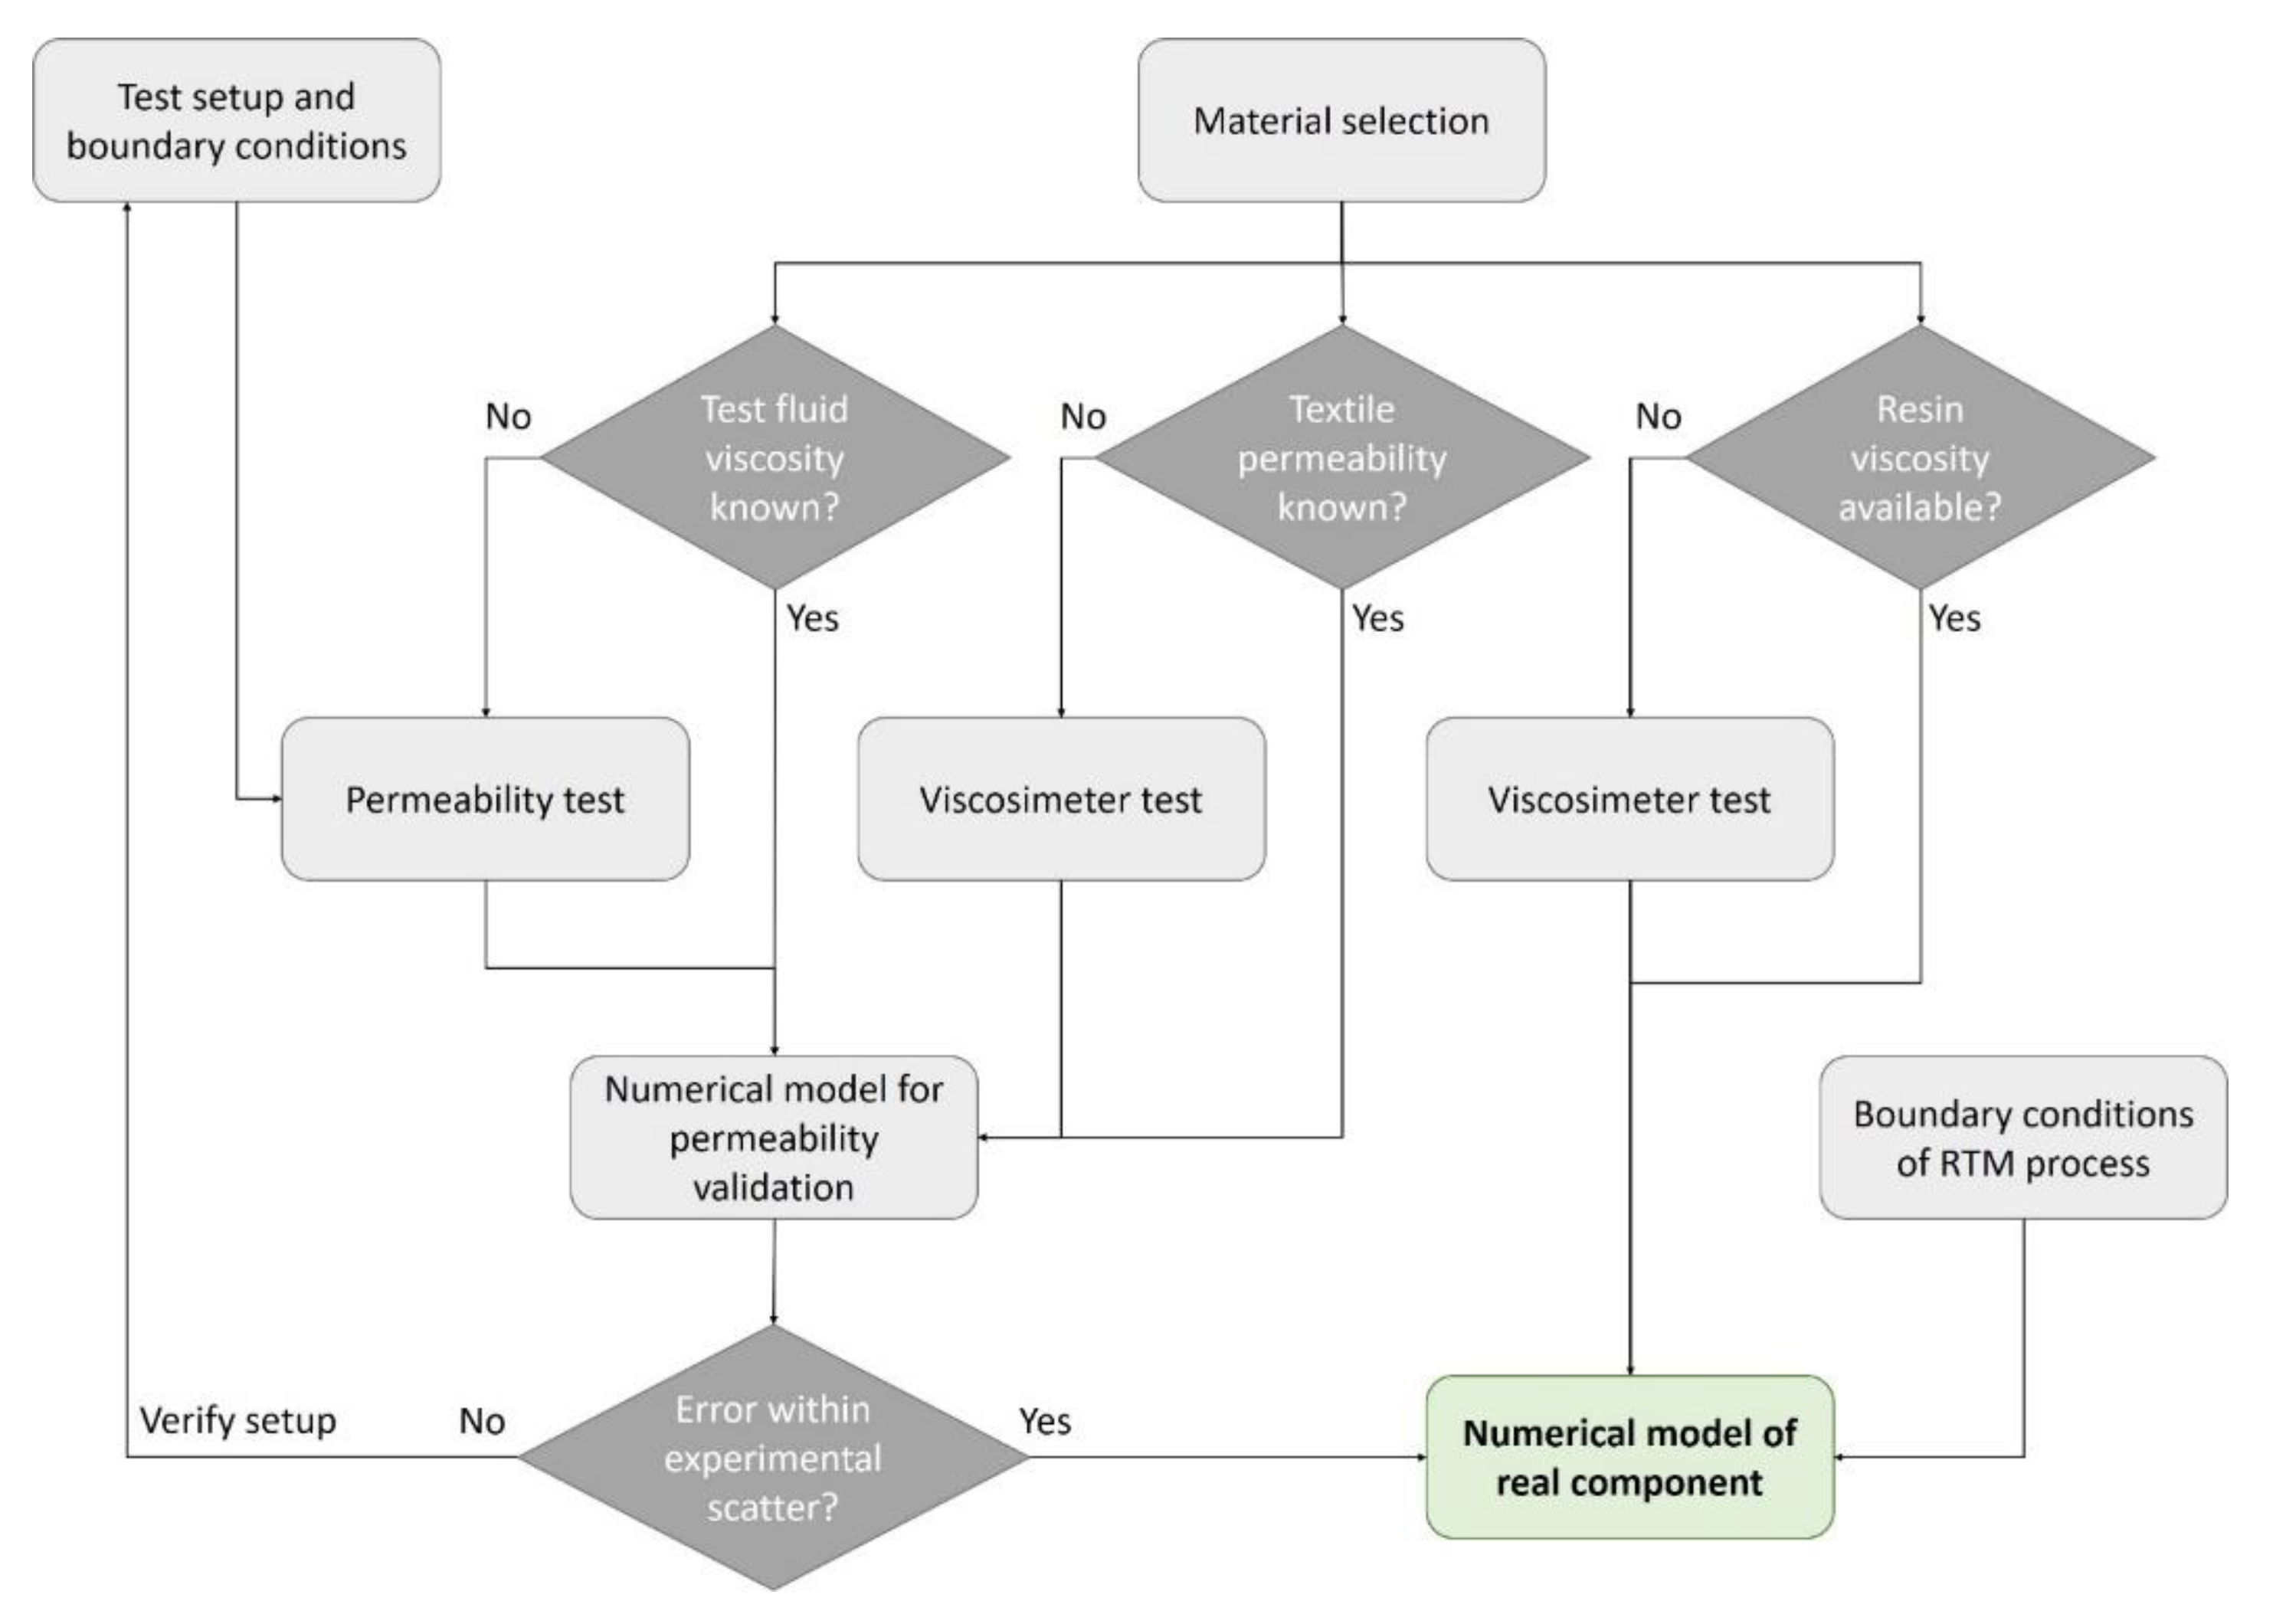
Therefore, a well-defined procedure for the experimental determination of the permeability tensor of fiber textiles and resin viscosity has been formulated in this paper in order to provide a reliable method to simulate RTM production of industrial components using PAM-RTM software. The key steps, from material characterization to numerical simulations, are illustrated by referring to the production of a real component in order to compare to a real-life test case. The permeabilities of four different types of textile reinforcements (three carbon fibers and one glass fiber) were experimentally measured. Moreover, the viscosity of a synthetic oil (15W40, used in glass textile permeability tests) and orthophthalic resin (Lavesan LERPOL 666/S RAL 9010) was tested. Permeability tests were modelled in the case of carbon fiber reinforcement tests, while in the case of glass fibers (GFRP), a naval component was reproduced. The analyzed GFRP part represents coverage for an aft-peak, placed aft-ward the cockpit, and it belongs to a series of pieces that are mounted on a 15.85 m (52 ft) cruising sailing yacht. This choice was sustained by the wider experience and higher amount of available data that RTM technology shows in marine industry compared to automotive, where production information represents more sensible data.

2. Materials and Methods

2.1. Test Material

The naval component was made of a polyester resin reinforced by glass fibers. In particular, the following materials were used:
-
a stitched glass fiber textile, i.e., SAERTEX SAERcore Max BX600/PP18/450, made of a layer of 600 g/m2 E-glass biaxial fibers [+/−45° orientation] and a 450 g/m2 chopped strand mat stitched by means of a 18 g/m2 PP (polypropylene flow media layer). The nominal thickness of the dry textile was 3.2 mm.
-
orthophthalic resin Lavesan LERPOL 666/S RAL 9010. The resin was diluted with 2% of styrene and added with 1% of catalyst (CUROX M-303 methyl ethyl ketone peroxide) prior to injection into the mold.
-
an ultralight foam made of polyurethane, polyethylene, and polyisocyanurate, i.e., SAERTEX Saerfoam. Good resin flow through the core thickness was achieved by 1 mm diameter holes within the foam, spaced 20 mm from one another. The holes were filled with glass fibers to increase shear and compression resistance. The nominal thickness of the foam was 10 mm.
The nominal properties of the resin are reported in Table 1. Accurate characterization of the flow properties of the resin is vital for manufacturing control, as well as for numerical modelling of the process. To this end, experimental tests were conducted to assess the resin viscosity and the fiber volume fraction and permeability of the textile.
Moreover, in order to provide references respect to other fibres and styles, carbon fiber reinforcement textiles were tested in permeability tests. These materials are a unidirectional fiber 12K T700 300 g/m2, a triaxial fiber (30/90/−30) 24K T700 300 g/m2, and a Twill 2×2 fabric 12K T700 630 g/m2.

2.2. Methods Used for Material Properties Characterization

Resin viscosity was measured by using a Thermo Scientific Brookfield Haake 7 plus viscosimeter. Four values of the rotational speed were used for testing, i.e., 20, 30, 50, and 100 rpm, considering both room and production temperature. The viscosity of the oil employed for the permeability tests was also measured by using the same apparatus.
The textile permeability was assessed by means of unsaturated linear flow tests. Assuming that the textile reinforcement in an RTM component is a porous medium through which the fluid flows, the resin flow can be estimated by Darcy’s law:
V = K μ P ,
where V is the velocity of the flowing resin, P is the applied pressure gradient, μ is the dynamic viscosity of the resin, and K is the permeability tensor. Using a coordinate system aligned to the principal directions of the fiber reinforcement, the permeability tensor can be expressed in the following diagonal form:
K = [ K 1 0 0 0 K 2 0 0 0 K 3 ] .
Thus, measurements of only three distinct scalar coefficients is required, which can be done according to existing procedures reported in the literature [13,14,15,16,17,18,19,20,21]. A further simplification is possible: as the thickness of the reinforcement is small compared to its length and width, the problem can be assumed to be 2D. This leaves only the two planar components of permeability, i.e., K 1 and K 2 , to be determined. The principal directions of the reinforcement, with respect to which the components of permeability are found, are also found from the experimental tests.
By applying a given pressure gradient, an unsaturated fluid flow is obtained. In the case of a mono-dimensional, i.e., linear, unsaturated flow, Darcy’s equation can be expressed as
d x d t = K x x Δ P μ ε x ( t ) ,
where x ( t ) is the position of the flow front at time t , P is the pressure difference between the inlet and outlet, ε = 1 V f is the void ratio (portion of volume not occupied by the fibres), and K x x is the component of the permeability matrix along the direction of the flow. With the initial conditions x ( t = 0 )   = 0 , the solution of Equation (3) reads:
x i 2 2 = K x x Δ P t i μ ε ,
which allows one to measure the permeability K x x , provided the position of the flow front is tracked throughout the test.
In order to identify the principal directions and the corresponding components of the permeability matrix using linear injection experiments, tests in three planar directions were performed, i.e., 0, 45, and 90° orientations. The principal directions were then found by [22,23]
K 1 = K exp 0 α 1 α 2 α 1 α 2 cos ( 2 β ) ,
K 2 = K exp 90 α 1 + α 2 α 1 + α 2 cos ( 2 β ) ,
β = 0.5 tan 1 ( α 1 α 2 α 1 2 α 2 2 α 2 K exp 45 ) ,
where the parameters α 1 and α 2 are defined as
α 1 = K exp 0 + K exp 90 2 ,
α 2 = K exp 0 K exp 90 2 .

2.3. Experimental Setup

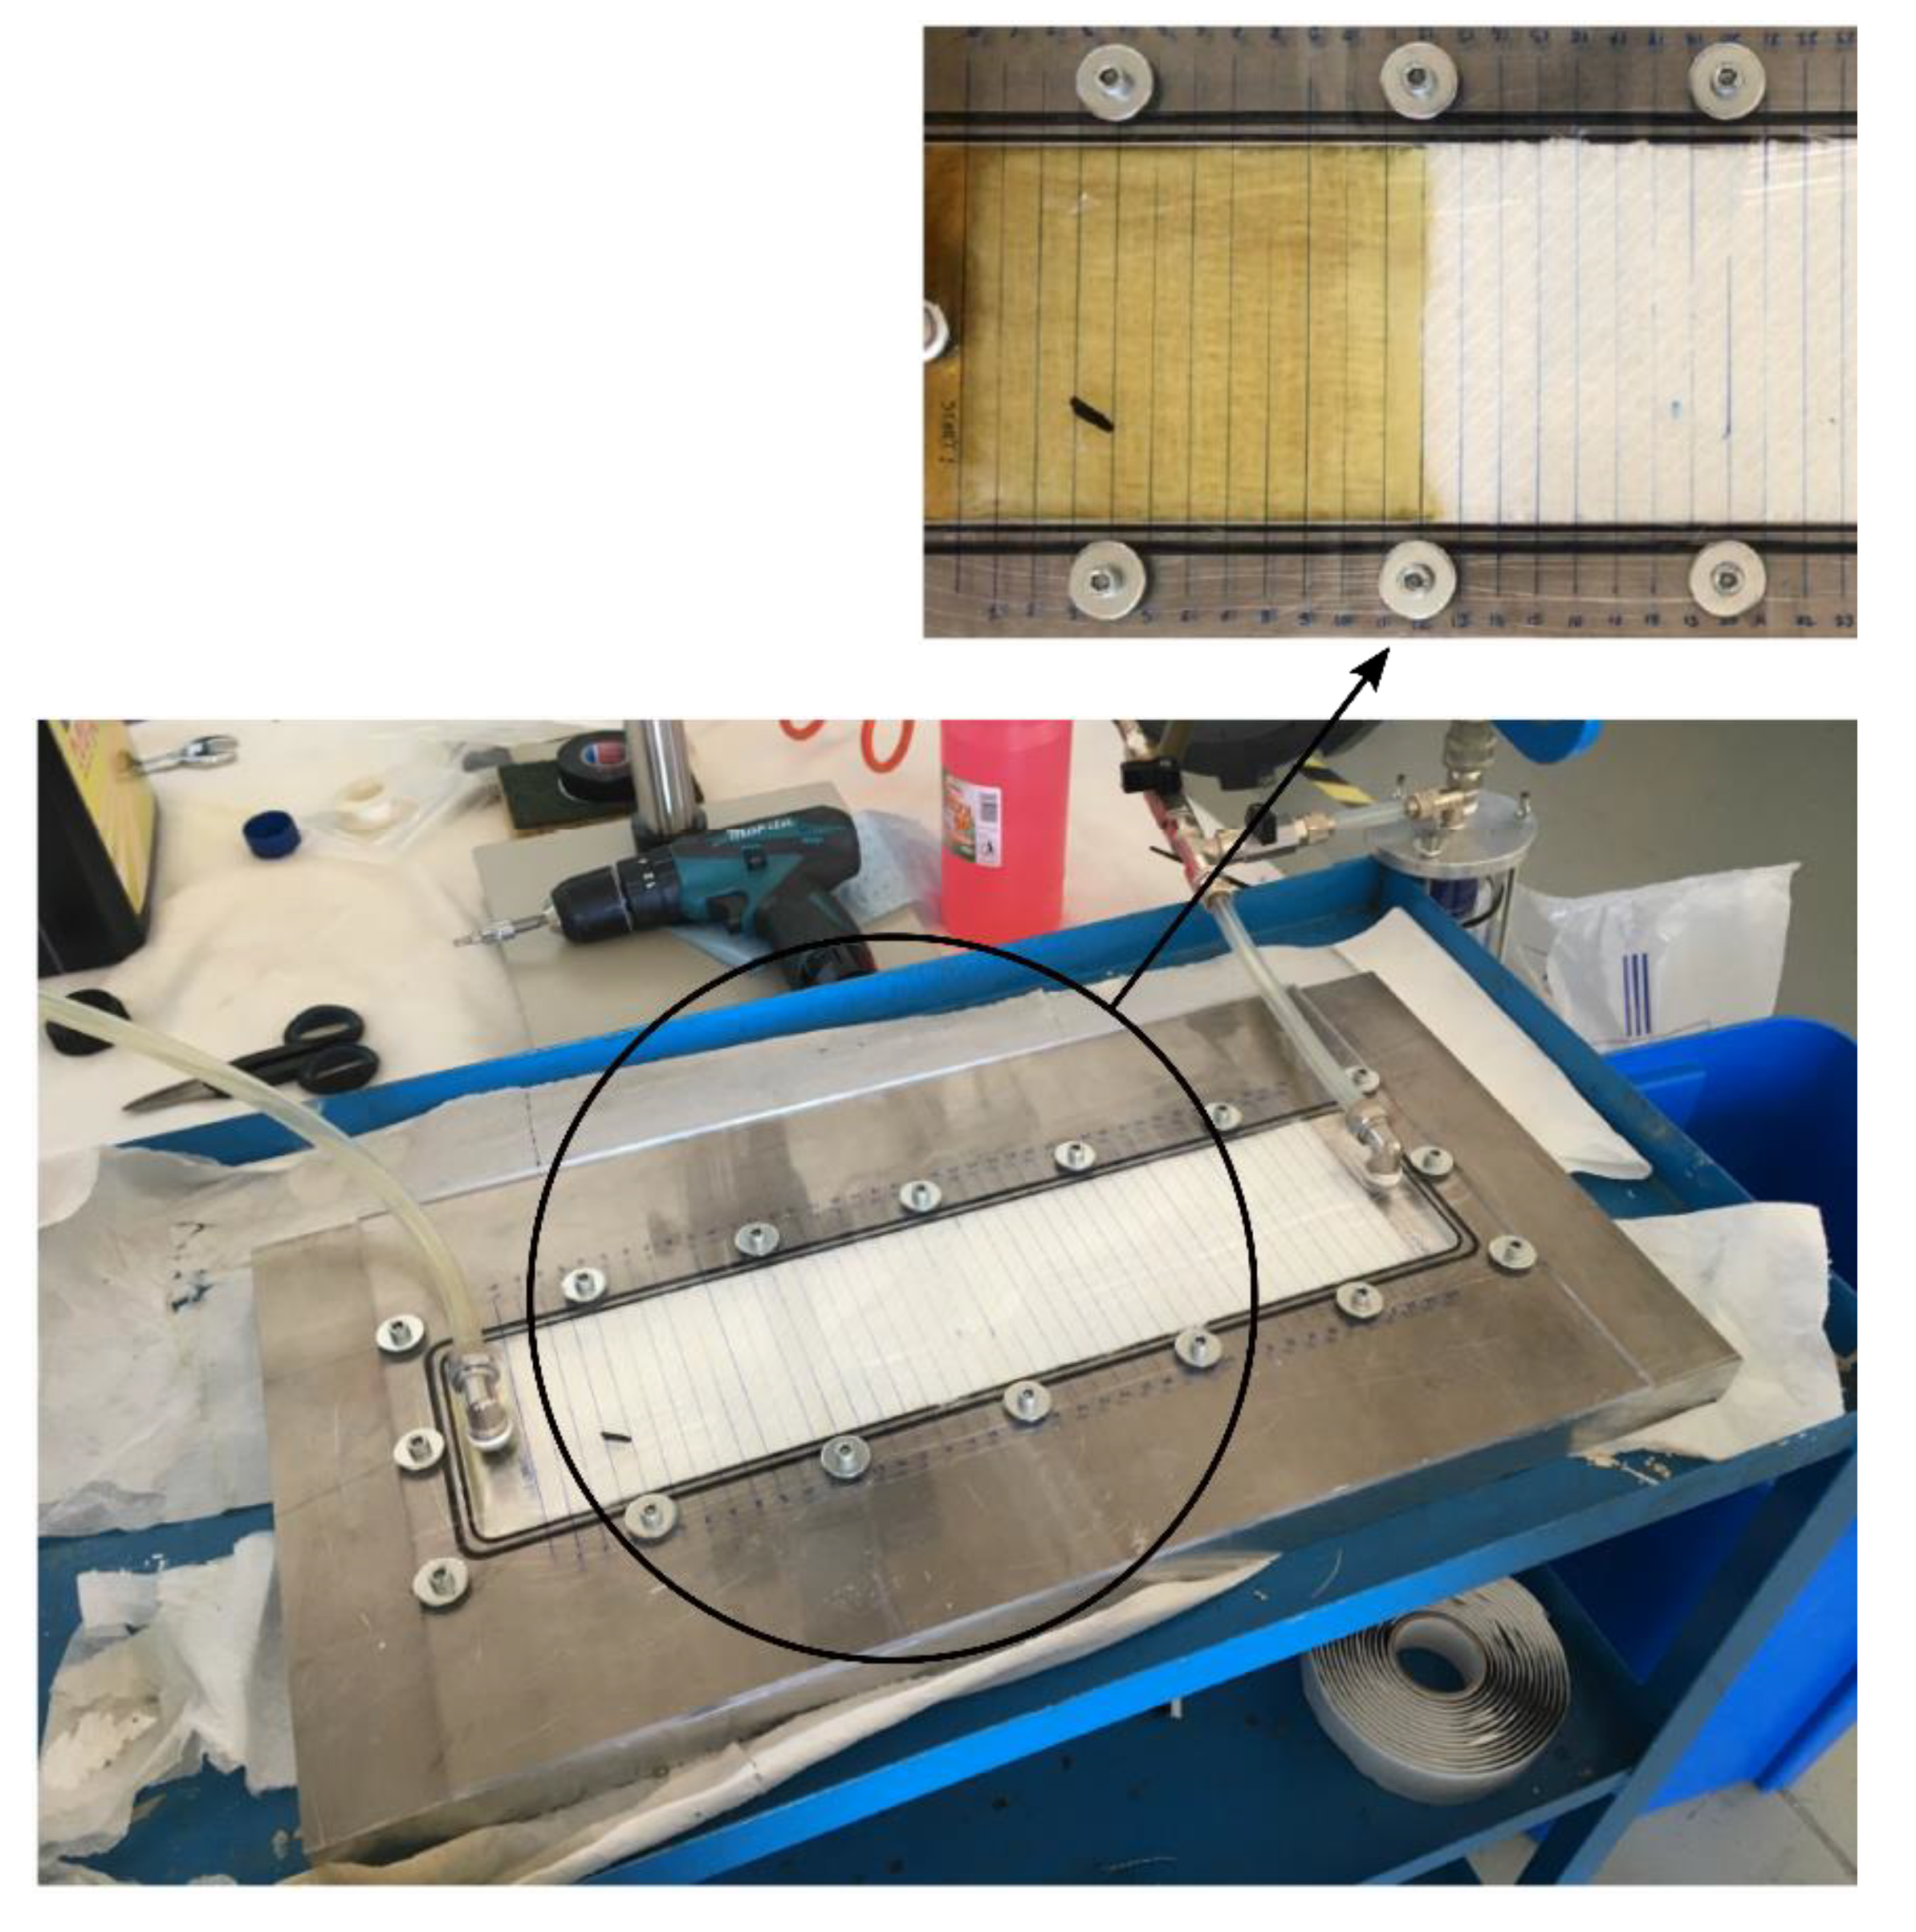
The permeability tests were performed on a 1D linear flow test bench. Two different molds were used to test glass and carbon reinforcements (test bench used for glass fibers is shown in Figure 1).
In order to obtain accurate and reproducible results, permeability tests should be carried out with non-reactive fluids: synthetic oil 15W40 and water were used instead of the resin to measure the textile permeability of glass fiber and carbon fiber, respectively. The oil was selected for its controlled viscosity profile over a broad range of temperature, while water is an option in the case of shortage of textiles to be tested (giving the possibility of reuse). The mold cavity had a size of 440 × 100 × 6 mm [16,23,24,25,26]. A free length of 20 mm was left at the inlet and outlet on the two sides of the specimen, in order to initiate a stable flow front and prevent potentially dangerous migrations of the fluid to the vacuum apparatus. Thus, a buffer volume was created, which works additionally as a device to reduce pressure fluctuations at the vent. A Plexiglass cover was positioned on top of the mold and fixed using a set of screws; a sealing rubber assured contact between the two mold halves and avoided leakages. Inlet and outlet ports were connected to the top plate for ease of construction.
The mold cavity thickness was chosen in accordance with literature investigations [23,24] and should be considered as an optimum that minimizes two adverse effects. On the one hand, capillarity at the boundaries becomes significant in shallower cavities, resulting in an incorrect reading of the fluid flow; on the other hand, the thickness effects cannot be neglected if thicker cavities are used, thus invalidating the assumption of planar flow.
An adequate stack of textiles should be used to fill the cavity and realize the same fiber volume content as that on the part to be manufactured. Care must be taken when cutting the textiles to avoid wrinkles or voids at the edges of the mold cavity, as these would affect the planar fluid flow. Three repetitions were taken for each direction, i.e., 0°, 45°, and 90° orientations, for a total of 9 trials, for each material. A camera was used to monitor the injection process, and time was measured with a chronometer.

2.4. Numerical Model

A numerical model was developed to simulate the resin infusion process. This consists of modelling the flow of the resin through a porous medium, i.e., the textile. Neglecting the capillarity forces of attraction or repulsion acting at the flow front (as they are deemed sufficiently small in front of the pressure field in RTM), the flow is governed by Darcy’s law, e.g., Equation (1). Thus, considering the resin as an incompressible fluid and combining it with Darcy’s law result in Richard’s equation:
( 1 μ K P ) = 0 .
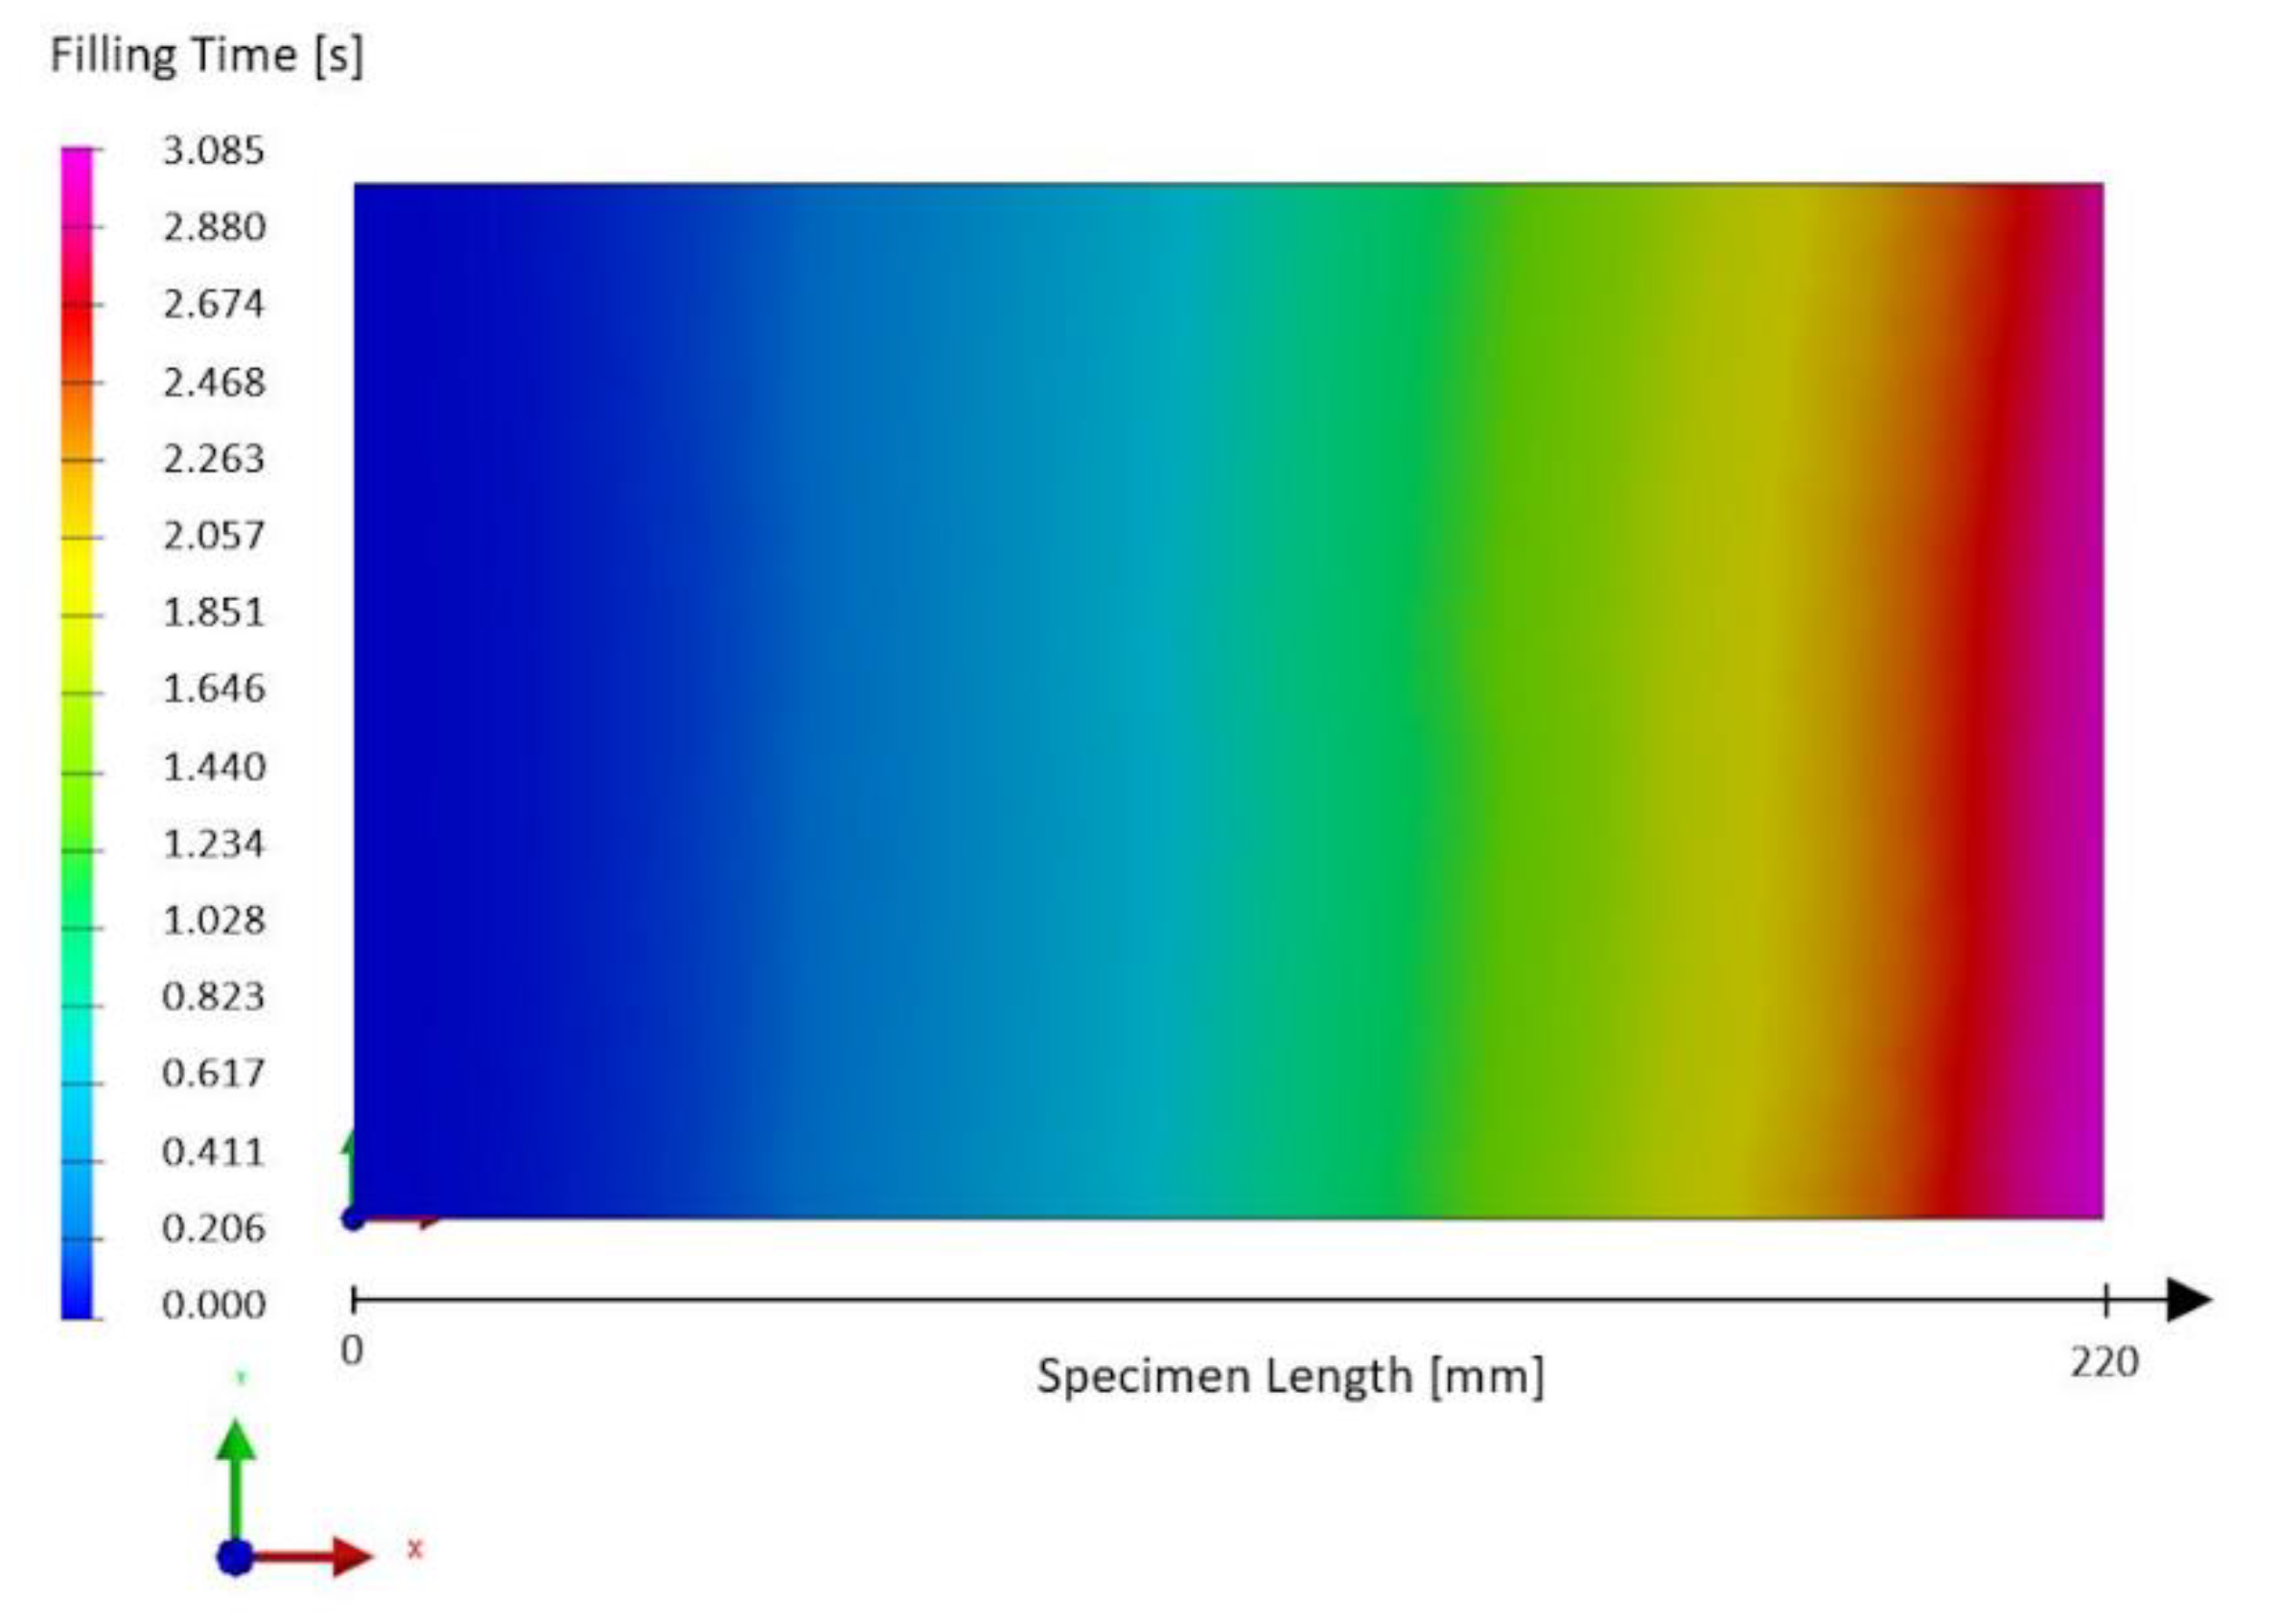
Equation (10) was solved in the software PAM-RTM using the non-conforming finite element method. Two numerical models were developed: The first one simulates the permeability tests of the carbon textile reinforcements, and the second one simulates the infusion process of the entire fiberglass component. The model of the textile permeability test was made up of 52652 3D tetrahedral elements.
The pressure difference applied between the inlet and outlet was equal to 40 kPa.
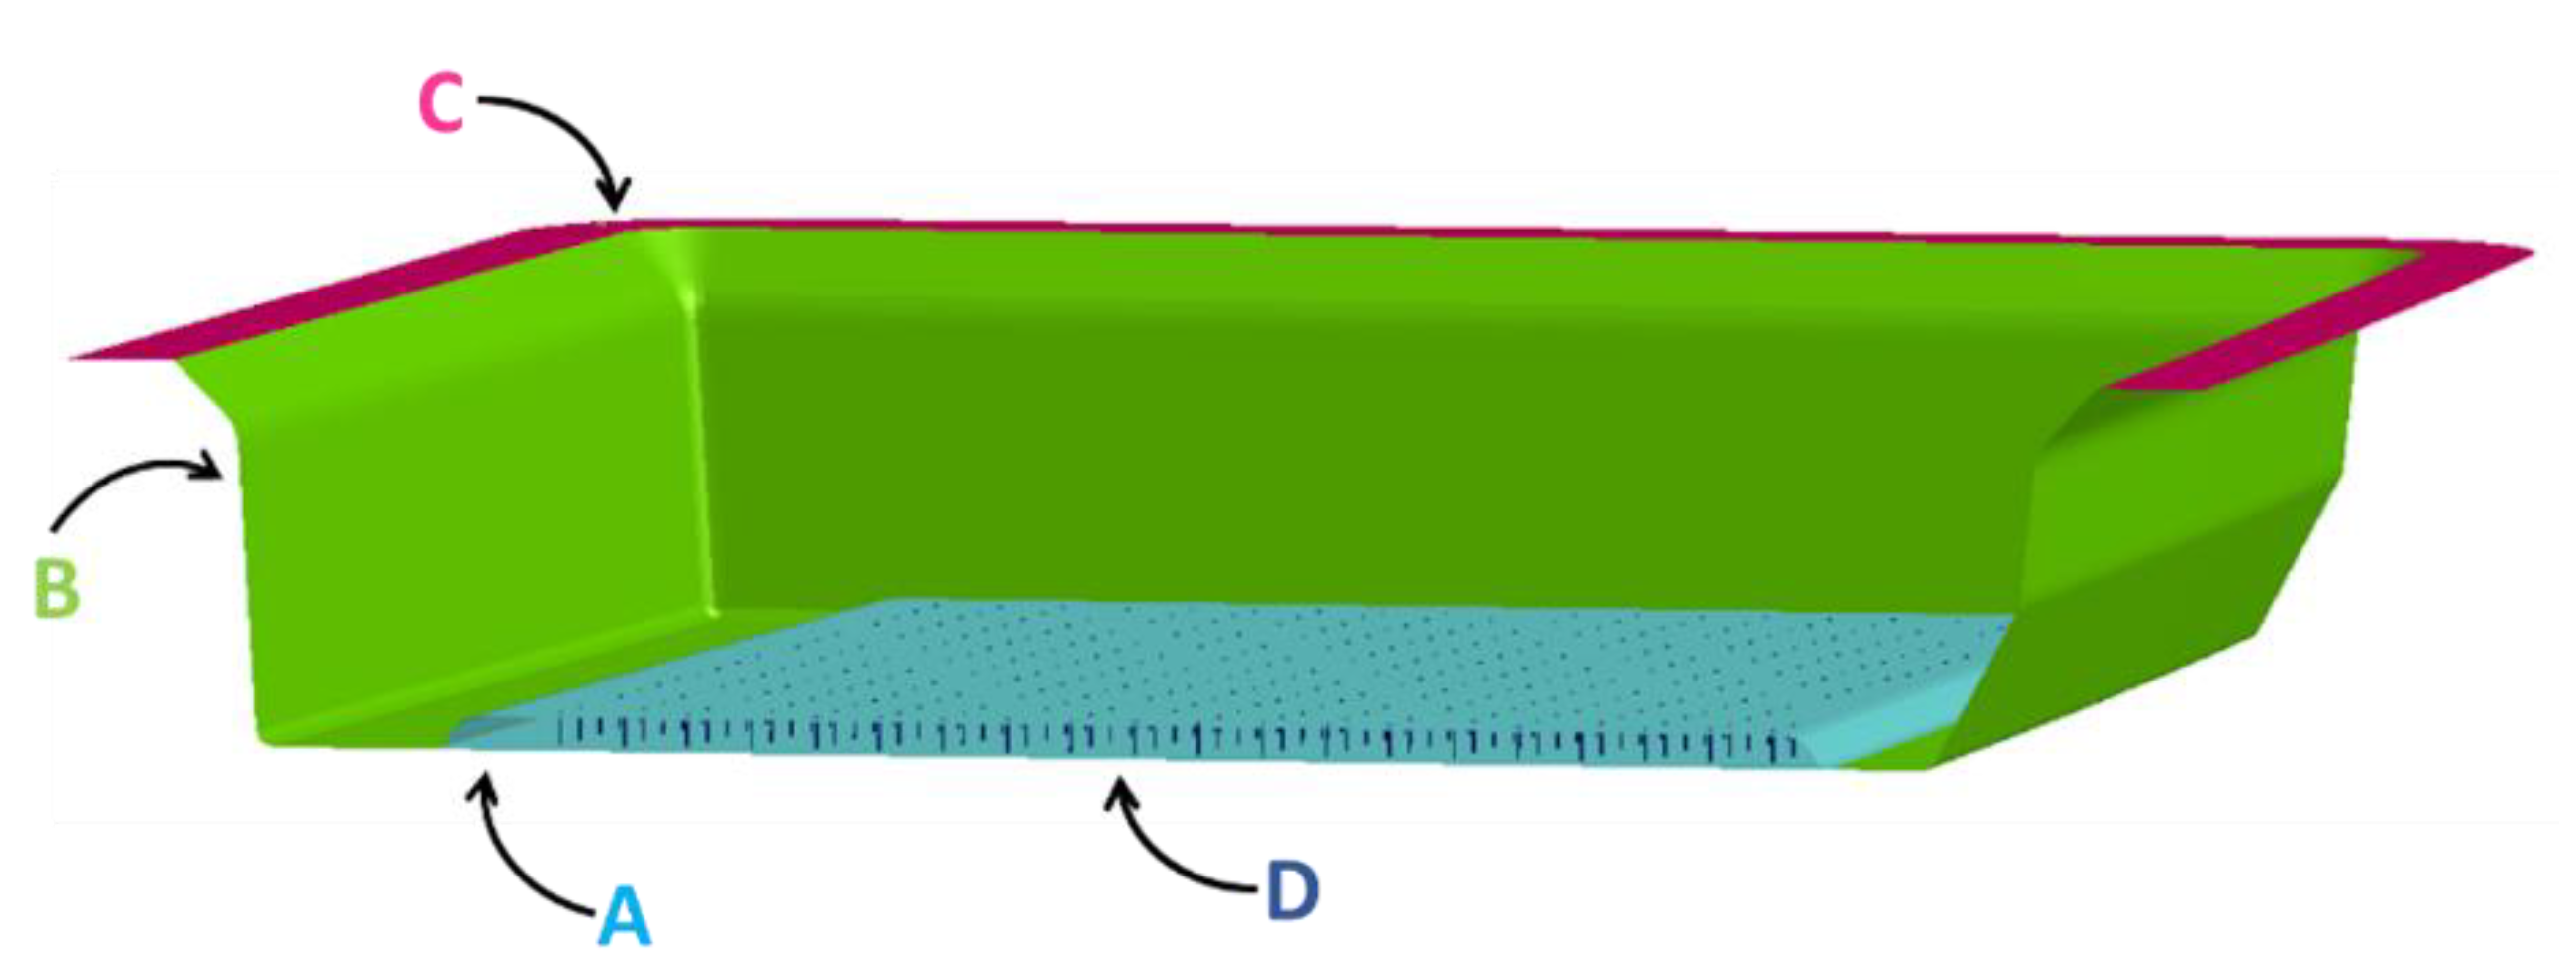
The fiberglass component was modelled with a 2D model in order to diminish the computational cost. A schematic of the model is shown in Figure 2. Four distinct regions can be identified: areas A and B are made of glass fiber textile layers, with one and two textile layers, respectively; region C consists of an empty rectangular channel that is filled by the resin at the beginning of the infusion process; region D is the foam core area. The injection valve is positioned in region C, while the vacuum valve is placed in the middle of D.
The material properties input into the model are given in Table 2. A total of 223,927 triangular elements were used to mesh the body; the core included 862 holes and required a fine mesh with an element size of approximately 2 mm. The empty channel permeability value (1.25 × 10⁻⁷ m2) was used for the permeability of the holes, neglecting the contribution of the glass fibers filling. A sensitivity study was run to substantiate this assumption: by varying the hole permeability between 10−3 and 10−7 m2, the filling time changed by less than 2%. This shows that the permeability of the holes has little influence on the filling time of the entire component.
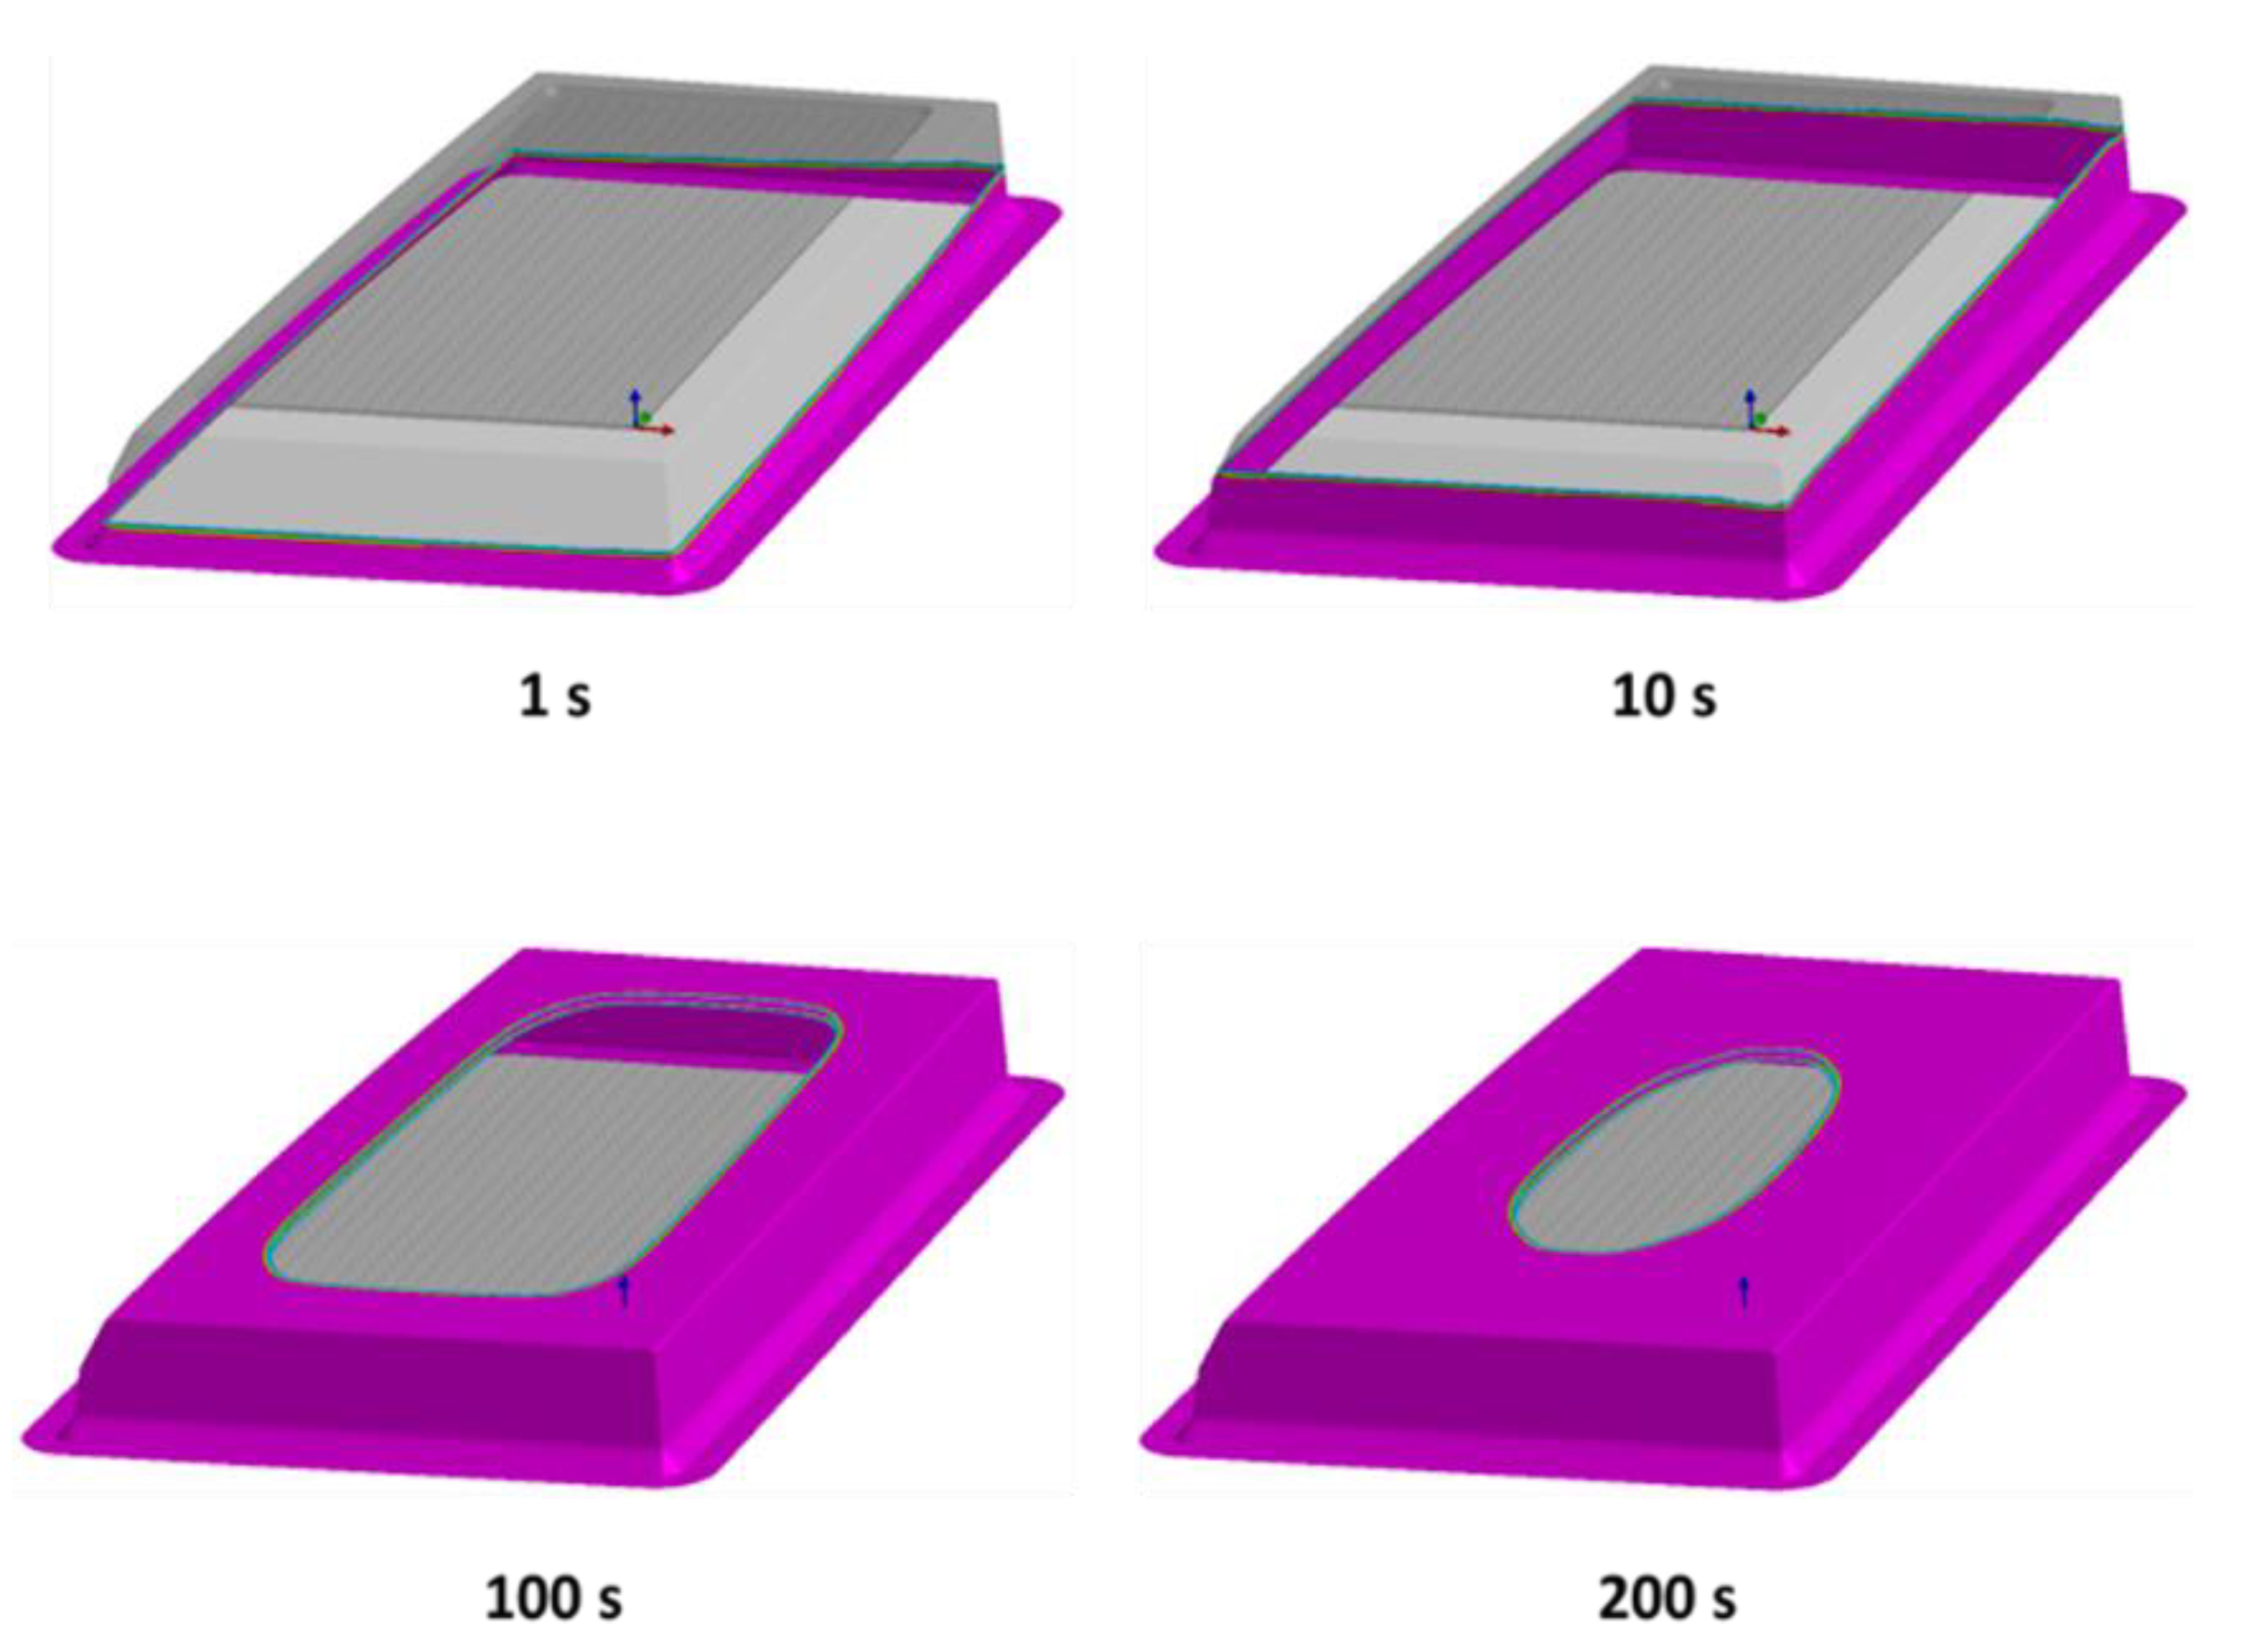
A pressure of 101.3 kPa was applied at the injection valve, while the pressure at the vent, i.e., in the middle of region D, was set equal to 5 kPa.

3. Results and Discussion

3.1. Material Characterization Tests

The values of the resin and test oil viscosity measured in the experimental tests are given in Table 3. Clearly, as the room and production temperatures are almost equal, the resin viscosity is almost unaffected by these temperature changes.
Table 4 shows the results of the permeability tests, grouped according to their orientation. As visible from the table, the scatter in the data is limited: for every orientation, the results are within a 5% error range.
By using Equations (5)–(7), the principal textile permeabilities can be computed. This gives the values collected in Table 5.
Knowing the values of the principal permeabilities and their corresponding orientation, it is possible to compute the effective permeability K e f f   along a general direction θ , which is defined as
K e f f = K 1 K 2 K 1 sin ( θ ) K 2 cos ( θ ) .
This allows one to visualize the flow distribution in the given layup as a function of the orientation angle θ . For the tested glass textile layup, the resulting effective permeability is plotted in Figure 3. Effective permeability of the fiberglass textile plotted as a function of the orientation angle θ.
As for the carbon fiber reinforcements, the permeability of the three different carbon fiber reinforcements was tested, i.e., (ply A) unidirectional fiber 12K T700 300 g/m2, (ply B) triaxial fiber (30/90/−30) 24K T700 300 g/m2, and (ply C) Twill 2 × 2 fabric 12K T700 630 g/m2.
Three tests were performed for each textile. Data obtained are listed in Table 6 and Table 7:
Data show that the permeabilities of the selected carbon fiber textile styles are at least one order of magnitude lower than those of glass fiber. The achievement was expected as the glass fiber textile comprises a multi-layer of 600 g/m2 E-glass biaxial fibers [+/−45° orientation] and a 450 g/m2 chopped strand mat stitched by means of a 18 g/m2 PP for enhancing permeability characteristics. In addition, it is shown that anisotropic permeability occurs even in balanced textiles where no apparent preferential direction is expected. Under deeper analysis, the ratio between major and minor in-plane permeability spans between 1.2 for the glass textile and 2.0 for carbon triaxial fiber (ply B) and 1.3 for the carbon 2 × 2 twill. These results indicate that proper characterization of the textile permeability is crucial in the design phase of an infusion process, as the filling path and time can be significantly affected by the fabric configuration and layup.

3.2. Numerical Models and Experimental Comparison

The average filling time measured in the carbon textiles permeability tests is reported in Table 8, together with values computed by the numerical model. Comparison between the experimental and numerical results shows a limited difference within experimental data scatter. For better visualization of the numerical data, they are also plotted in Figure 4. as a contour map. Clearly, the points located further from the injection valve, i.e., the right-most point in the figure, have the highest filling time.
For the fiberglass component, the filling time calculated in the simulation is equal to 304.3 s and the resin flow is uniform in the entire component. Figure 5 shows the position of the flow front at four time instants, while a contour plot of the filling time is given in Figure 6.
As visible in Figure 5, the resin flows through all the empty borders in less than 1 s. After that, the flow front uniformly follows the vertical faces and the flow eventually forms a circular shape around the vacuum valve.
Therefore, the analysis of the flow pattern in the numerical simulation shows that the injection and vent valves are in good positions to assure an adequate filling path of this simple component.
The filling time of the real component was measured to be 303 s. A comparison of this value to that predicted by the numerical model shows an error of 0.44%.
Moreover, by analyzing the component pulled out of the mold after resin polymerization (Figure 7), there was an absence of holes, bubbles, or other defects. This shows that, also in the real condition, valve locations and pressure settings are adequate in order to obtain a good structure.
Therefore, comparing the numerical and experimental results shows a good correspondence in all analyzed cases. This highlights the reliability of the methodology discussed in this paper. In fact, it has been proved that the RTM process simulation, by means of the PAM-RTM software, could give reliable results for optimization of the injection strategy in complex components, provided that realistic values are input to the model. To this end, accurate material characterization is needed, which must take into account the dependence of the material properties on the specific experimental conditions (e.g., temperature). Moreover, the results presented are in good accordance with other studies where good correspondence between RTM (as well as VARI and C-RTM) modelling and experimental results was obtained [1,2,3,27,28]. In summary, a workflow explaining the phases and procedures for the characterization of the materials and then to simulate the RTM process, as followed in this paper, is reported in Figure 8.

4. Conclusions

In this paper, the procedure for implementing reliable inputs in the simulation of an RTM-based process is presented and discussed. The experimental setup for textiles permeability characterization is described, as well as the procedure for retrieving local and global permeability. Four different types of textiles (three carbon fiber styles and one glass fiber multilayer textile) have been characterized in order to provide to readers reference data for different types and styles of textiles. The permeabilities of the carbon fiber textiles were found to be one order of magnitude lower than that of glass fiber, whereas fiber alignment had a less relevant influence. Moreover, tests show that anisotropic permeability occurs even in balanced textiles where no apparent preferential direction is expected. The characterization of the viscosity of the orthophthalic resin Lavesan LERPOL 666/S and of the synthetic oil 15W40 showed comparable values at room temperature.
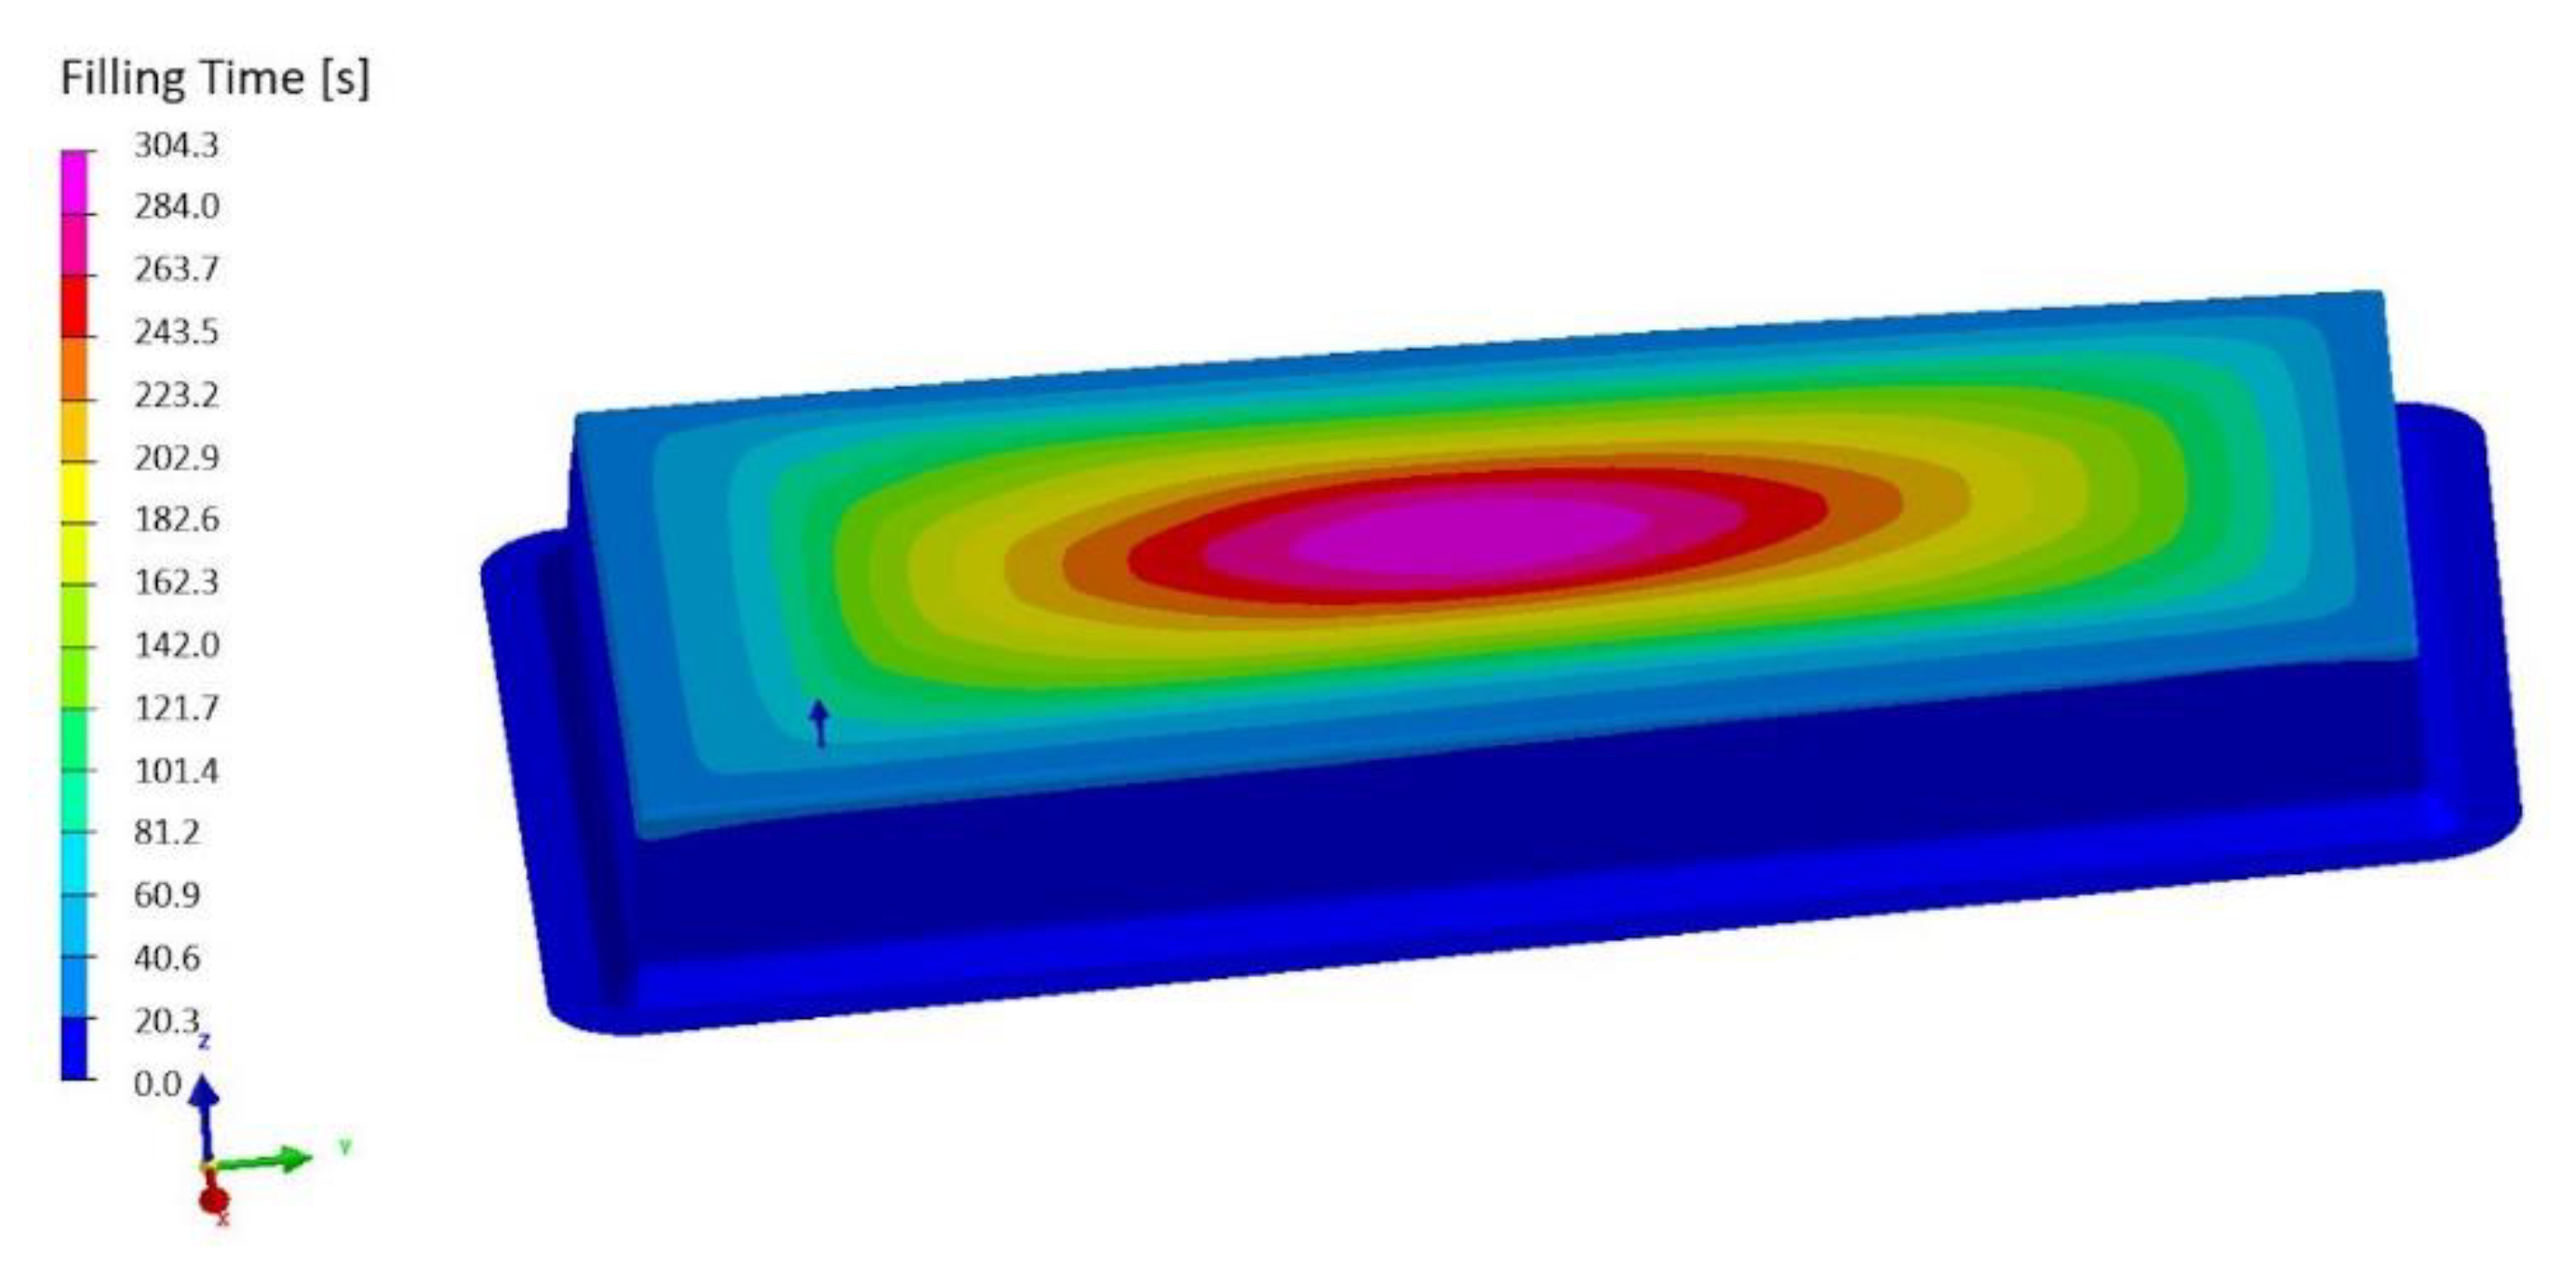
ESI PAM-RTM software was used to perform RTM simulations. As a first step, simulation of permeability characterization in the different directions was performed by means of 3D models. Filling time results showed an average good correspondence with experimental data (3.6% average error). As a second step, the resin infiltration of a 15.85 m (52 ft) sailing yacht component, comprised of stitched glass fibers around a perforated core, was implemented in a 2D model. Output data including filling flow and time proved consistent (0.44% error in filling time) with data acquired in industrial environment, validating the procedure proposed in this paper.

Author Contributions

Conceptualization, L.D. and F.R.; methodology, L.D.; software, M.P.F., L.G. and M.G.; validation, M.P.F., E.T. and N.Z.; formal analysis, M.P.F. and F.R.; investigation, F.R.; data curation, L.D.; writing—original draft preparation, M.P.F.; writing—review and editing, N.Z and E.T. All authors have read and agreed to the published version of the manuscript.

Funding

This research received no external funding.

Acknowledgments

The authors thank Corset&Co Srl for the naval component production.

Conflicts of Interest

The authors declare no conflict of interest

References

  1. Poodts, E.; Minak, G.; Mazzocchetti, L.; Giorgini, L. Fabrication, process simulation and testing of a thick CFRP component using the RTM process. Compos. Part B Eng. 2014, 56, 673–680. [Google Scholar] [CrossRef]
  2. Rondina, F.; Taddia, S.; Mazzocchetti, L.; Donati, L.; Minak, G.; Rosenberg, P.; Bedeschi, A.; Dolcini, E. Development of full carbon wheels for sport cars with high-volume technology. Compos. Struct. 2018, 192, 368–378. [Google Scholar] [CrossRef]
  3. Poodts, E.; Minak, G.; Dolcini, E.; Donati, L. FE analysis and production experience of a sandwich structure component manufactured by means of vacuum assisted resin infusion process. Compos. Part B Eng. 2013, 53, 179–186. [Google Scholar] [CrossRef]
  4. Young, W.B.; Rupel, K.; Han, K.; Lee, L.J.; Liou, M.J. Analysis of resin injection molding in molds with preplaced fiber mats. II: Numerical simulation and experiments of mold filling. Polym. Compos. 1991, 12, 30–38. [Google Scholar]
  5. Liu, B.; Bickerton, S.; Advani, S.G. Modelling and simulation of resin transfer moulding (RTM)—Gate control, venting and dry spot prediction. Compos. Part A Appl. Sci. Manuf. 1996, 27, 135–141. [Google Scholar] [CrossRef]
  6. Trochu, F.; Ruiz, E.; Achim, V.; Soukane, S. Advanced numerical simulation of liquid composite molding for process analysis and optimization. In Proceedings of the Composites Part A: Applied Science and Manufacturing; Elsevier Ltd.: Amsterdam, The Netherlands, 2006; Volume 37, pp. 890–902. [Google Scholar]
  7. Grössing, H.; Stadlmajer, N.; Fauster, E.; Fleischmann, M.; Schledjewski, R. Flow front advancement during composite processing: Predictions from numerical filling simulation tools in comparison with real-world experiments. Polym. Compos. 2016, 37, 2782–2793. [Google Scholar] [CrossRef]
  8. Dereims, A.; Drapier, S.; Bergheau, J.M.; De Luca, P. 3D robust iterative coupling of Stokes, Darcy and solid mechanics for low permeability media undergoing finite strains. Finite Elem. Anal. Des. 2015, 94, 1–15. [Google Scholar] [CrossRef]
  9. Celle, P.; Drapier, S.; Bergheau, J.M. Numerical modelling of liquid infusion into fibrous media undergoing compaction. Eur. J. Mech. A Solids 2008, 27, 647–661. [Google Scholar] [CrossRef] [Green Version]
  10. Imbert, M. High Speed Reactive Resin Transfer Moulding (RTM) Process Simulation for Mass Production of Automotive Structural Parts. SAE Int. J. Mater. Manuf. 2015, 8, 503–515. [Google Scholar] [CrossRef]
  11. Dereims, A.; Chatel, S.; Marquette, P.; Dufort, L. Accurate Liquid Resin Infusion simulation through a Fluid-Solid coupled approach | ESI Group. In Proceedings of the SAMPE., Seattle, WA, USA, 22–25 May 2017. [Google Scholar]
  12. Naik, N.K.; Sirisha, M.; Inani, A. Permeability characterization of polymer matrix composites by RTM/VARTM. Prog. Aerosp. Sci. 2014, 65, 22–40. [Google Scholar] [CrossRef]
  13. Lundström, T.S.; Stenberg, R.; Bergström, R.; Partanen, H.; Birkeland, P.A. In-plane permeability measurements: A nordic round-robin study. Compos. Part A Appl. Sci. Manuf. 2000, 31, 29–43. [Google Scholar] [CrossRef]
  14. Weitzenböck, J.R.; Shenoi, R.A.; Wilson, P.A. Radial flow permeability measurement. Part A: Theory. Compos. Part A Appl. Sci. Manuf. 1999, 30, 781–796. [Google Scholar] [CrossRef]
  15. Weitzenböck, J.R.; Shenoi, R.A.; Wilson, P.A. Measurement of three-dimensional permeability. Compos. Part A Appl. Sci. Manuf. 1998, 29, 159–169. [Google Scholar] [CrossRef]
  16. Bodaghi, M.; Lomov, S.V.; Simacek, P.; Correia, N.C.; Advani, S.G. On the variability of permeability induced by reinforcement distortions and dual scale flow in liquid composite moulding: A review. Compos. Part A Appl. Sci. Manuf. 2019, 120, 188–210. [Google Scholar] [CrossRef]
  17. Sharma, S.; Siginer, D.A. Permeability measurement methods in porous media of fiber reinforced composites. Appl. Mech. Rev. 2010, 63, 1–19. [Google Scholar] [CrossRef]
  18. Ince, M.E. Air permeability characterization of glass fiber nonwoven fabric for liquid composite molding applications. In Proceedings of the IOP Conference Series: Materials Science and Engineering; Institute of Physics Publishing: Bristol, UK, 2018; Volume 459. [Google Scholar]
  19. Ya’Acob, A.M.; Razali, D.A.; Anwar, U.A.; Radhi, A.H.; Ishak, A.A.; Minhat, M.; Mohd Aris, K.D.; Johari, M.K.; Casey, T. Preliminary Study on GF/Carbon/Epoxy Composite Permeability in Designing Close Compartment Processing. In Proceedings of the IOP Conference Series: Materials Science and Engineering; Institute of Physics Publishing: Bristol, UK, 2018; Volume 370. [Google Scholar]
  20. Kim, J.I.; Hwang, Y.T.; Choi, K.H.; Kim, H.J.; Kim, H.S. Prediction of the vacuum assisted resin transfer molding (VARTM) process considering the directional permeability of sheared woven fabric. Compos. Struct. 2019, 211, 236–243. [Google Scholar] [CrossRef]
  21. Becker, D.; Mitschang, P. Measurement System for On-Line Compaction Monitoring of Textile Reaction to Out-of-Plane Impregnation. Adv. Compos. Lett. 2014, 23. [Google Scholar] [CrossRef] [Green Version]
  22. Demaría, C.; Ruiz, E.; Trochu, F. In-plane anisotropic permeability characterization of deformed woven fabrics by unidirectional injection. Part I: Experimental results. Polym. Compos. 2007, 28, 797–811. [Google Scholar]
  23. Arbter, R.; Beraud, J.M.; Binetruy, C.; Bizet, L.; Bréard, J.; Comas-Cardona, S.; Demaria, C.; Endruweit, A.; Ermanni, P.; Gommer, F.; et al. Experimental determination of the permeability of textiles: A benchmark exercise. Compos. Part A Appl. Sci. Manuf. 2011, 42, 1157–1168. [Google Scholar] [CrossRef]
  24. Vernet, N.; Ruiz, E.; Advani, S.; Alms, J.B.; Aubert, M.; Barburski, M.; Barari, B.; Beraud, J.M.; Berg, D.C.; Correia, N.; et al. Experimental determination of the permeability of engineering textiles: Benchmark II. Compos. Part A Appl. Sci. Manuf. 2014, 61, 172–184. [Google Scholar] [CrossRef] [Green Version]
  25. Ferland, P.; Guittard, D.; Trochu, F. Concurrent methods for permeability measurement in resin transfer molding. Polym. Compos. 1996, 17, 149–158. [Google Scholar] [CrossRef]
  26. Lundström, T.S.; Gebart, B.R.; Sandlund, E. In-plane permeability measurements on fiber reinforcements by the multi-cavity parallel flow technique. Polym. Compos. 1999, 20, 146–154. [Google Scholar] [CrossRef]
  27. Dereims, A.; Zhao, S.; Yu, H.; Pasupuleti, P.; Doroudian, M.; Rodgers, W.; Aitharaju, V. Compression Resin Transfer Molding (C-RTM) Simulation Using a Coupled Fluid-solid Approach | ESI Group. In Proceedings of the American Society for Composites 32nd Technical Conference, West Lafayette, IN, USA, 23–25 October 2017. [Google Scholar]
  28. Marquette, P.; Dereims, A.; Ogawa, T.; Kobayashi, M. Numerical Methods For 3D Compressive RTM Simulations | ESI Group. In Proceedings of the ECCM17, Munich, Germany, 26–30 June 2016. [Google Scholar]
Figure 1. Linear flow test bench used for measurement of glass textile permeability. The oil flow front is clearly visible in the detailed view.
Applsci 10 01814 g001
Figure 2. Numerical model description.
Applsci 10 01814 g002
Figure 3. Effective permeability of the fiberglass textile plotted as a function of the orientation angle θ .
Applsci 10 01814 g003
Figure 4. Contour map of the filling time computed numerically: example of case Ply C 0° (color scale in s).
Applsci 10 01814 g004
Figure 5. Visualization of the flow front calculated by the numerical model.
Applsci 10 01814 g005
Figure 6. Contour plot of the filling time computed by the numerical model.
Applsci 10 01814 g006
Figure 7. Fiberglass component manufacturing: (a) Dry material before resin infusion, (b) finished part.
Applsci 10 01814 g007
Figure 8. Workflow to model the resin transfer molding (RTM) process of a real component.
Applsci 10 01814 g008
Table 1. Resin properties.
ProprietyTesting StandardValue
Absolute density at 25 °CISO 1675/751.06 g/mL
Brookfield Viscosity at 25 °CMA 041 LCP300 ± 50 cPs
Gel time at 25 °CMA 120-LR6′00″ ± 1′30″
Exothermic peakMA 120-LR178 ± 2 °C
Table 2. Material data of the fiberglass component model.
Zone K 1   [ m 2 ] K 2   [ m 2 ] β [deg]Thickness [mm]Fiber Content
A2.530 × 10–92.074 × 10–9353.20.328
B2.530 × 10–92.074 × 10–9356.40.328
C (edges and injection area)14.2 × 10–614.2 × 10⁻⁶-7 (edges)
1 (injection area)
0
D (core Holes)1.25 × 10–71.25 × 10–7-10
Table 3. Resin and test oil viscosity as measured in experimental tests.
Orthophthalic ResinTest Oil
Rotational Speed [rpm]μ at 26.6 °C [cPs]μ at 31 °C [cPs]μ at 26.6 °C [cPs]μ at 31 °C [cPs]
20196199181152
30200199182151
50209203187154
100233226203175
Mean Value μ210207188158
Table 4. Glass textile permeability measured in the tests.
Permeability K e x p 0   [ 10 9   m 2 ] K e x p 45   [ 10 9   m 2 ] K e x p 90   [ 10 9   m 2 ]
Trial 12.4002.1192.126
Trial 22.3362.1272.285
Trial 32.3352.0062.207
Mean Value2.3572.0842.206
St. Deviation0.0300.0550.065
Table 5. Principal permeabilities of the glass textile.
K 1   [ 10 9   m 2 ] K 2   [ 10 9   m 2 ] β [deg]
Principal permeability2.5302.074−35
Table 6. Local permeability of the carbon textile.
Plies Type K e x p 0   [ 10 9   m 2 ] K e x p 90   [ 10 9   m 2 ] K e x p 45   [ 10 9   m 2 ]
AMean value0.100.060.04
St. Deviation0.0080.0030.004
BMean value0.050.070.10
St. Deviation0.0080.0060.016
CMean value0.180.160.14
St. Deviation0.0270.0100.002
Table 7. Principal permeability of the carbon textile.
Plies Type K 1   [ 10 9   m 2 ] K 2   [ 10 9   m 2 ] β [deg]
A0.10 0.04 5.6
B0.10 0.05 85.0
C0.18 0.14 0.7
Table 8. Carbon textile reinforcement permeability experimental and numerical filling time results.
Ply A 0°Ply A 90°Ply B 0°Ply B 90°Ply C 0°Ply C 90°
Exp. [s]Mean value 2.56.92.75.03.011.0
St. Dev. 0.20.70.50.90.31.6
Num. [s] 2.77.52.95.43.19.5

