Article

Analysis of the Similarity between in Silico Ideotypes and Phenotypic Profiles to Support Cultivar Recommendation—A Case Study on Phaseolus vulgaris L.

Cassandra Lab, Department of Environmental Science and Policy, Università degli Studi di Milano, via Celoria 2, 20133 Milan, Italy
*
Authors to whom correspondence should be addressed.
Study conducted when the author was working at the University of Milan.
Agronomy 2020, 10(11), 1733; https://doi.org/10.3390/agronomy10111733
Submission received: 23 September 2020 / Revised: 2 November 2020 / Accepted: 4 November 2020 / Published: 7 November 2020

Abstract

:
Cultivar recommendation is a key factor in cropping system management. Classical approaches based on comparative multi-environmental trials can hardly explore the agro-climatic and management heterogeneity farmers may have to face. Moreover, they struggle to keep up with the number of genotypes commercially released each year. We propose a new approach based on the integration of in silico ideotyping and functional trait profiling, with the common bean (Phaseoulus vulgaris L.) in Northern Italy as a case study. Statistical distributions for six functional traits (light extinction coefficient, radiation use efficiency, thermal time to first pod and maturity, seed weight, plant height) were derived for 24 bean varieties. The analysis of soil, climate and management in the study area led us to define 21 homogeneous contexts, for which ideotypes were identified using the crop model STICS (Simulateur mulTIdisciplinaire pour les Cultures Standard), the E-FAST (Extended Fourier Amplitude Sensitivity Test) sensitivity analysis method, and the distributions of functional traits. For each context, the 24 cultivars were ranked according to the similarity (weighted Euclidean distance) with the ideotype. Context-specific ideotypes mainly differed for phenological adaptation to specific combinations of climate and management (sowing time) factors, and this reflected in the cultivar recommendation for the different contexts. Feedbacks from bean technicians in the study area confirmed the reliability of the results and, in turn, of the proposed methodology.

1. Introduction

Crop performance is the result of the complex interactions between genotypic factors and the agronomic and environmental context in which the crop is grown. Understanding the genotype (G) by environment (E) and by management (M) interactions (G × E × M, [1]) is thus crucial for cultivar recommendation, as it allows exploring the opportunities or disadvantages of different genotypes in a specific cultivation area [2].
Multi-environmental trials (METs), where the performances of promising genotypes are evaluated in different environments [3], represent one of the main tools to account for phenotypic plasticity within cultivar recommendations [4]. In fact, the analysis of crop responses across the target population of environments (TPE, i.e., the set of environmental and agronomic conditions in which the varieties produced by a breeding program will be grown [5]) allows us to identify the best genotypes for a given agro-environmental context [6].
Although METs can provide sound information about the genotype potential in the TPEs, their effectiveness is often limited by the amount of data needed to actually capture the effects of the variability in the environmental and management factors of the target area [7,8], which may raise the cost of field trials to unsustainable levels. As a result, METs can be biased by non-representative sampling of the TPEs [9], which may decrease the predictive capability for environments and cropping systems not—or insufficiently—represented in the field testing phase [10].
Given their capability to reproduce genotype growth and development as a response to environmental and management factors [11], a variety of modelling approaches have been developed to better understand G × E × M interactions in multi-site field trials and to increase the effectiveness of the way environments are sampled within METs. Crop models have been used to broadly characterize cropping systems in terms of water-deficit patterns, by identifying drought intensity, seasonal dynamics and frequency of occurrence over long time series and large areas [9,12,13], ultimately to support germplasm testing strategies. Model-based approaches to directly assist variety evaluations have also been proposed [4], which use data collected in national-scale METs for cultivar-specific model calibration. The model was then used to reproduce phenotypic plasticity over the entire target area, thus amplifying the range of agro-climatic conditions explored while testing the varieties. The use of crop models to analyze G × E × M interactions also expanded towards the definition of context-specific ideotypes [14,15], which can be defined as an ideal combination of functional traits [16] expected to perform in a desired manner within a given agro-climatic context. Plant morphological and physiological traits can be codified as model parameters, which can be used to evaluate the impact of varying one or more plant traits on crop growth and development in a wide range of soil, climate, and management conditions, even including entire production areas [17].
In those terms, model-based ideotyping and cultivar recommendation share the goal of identifying a plant type able to reach specific productive goals in a given agro-climatic context, leading to the hypothesis that the use of in-silico ideotyping techniques could allow a more comprehensive evaluation of G × E × M interactions while supporting cultivar recommendations [18].
To test this hypothesis, we focused on the common bean (Phaseolus vulgaris L.) as a case study, for its importance as a major source of dietary protein in both less developed and developing countries, and for its soil-enriching role in cropping systems [19]. Among the major food crops, beans show one of the highest levels of variation in growth habits, seed characteristics and adaptation capabilities [20,21], which turn into a huge number of accessions available worldwide (almost 40,000 in the sole International Centre for Tropical Agriculture—CIAT—gene bank https://www.genebanks.org/resources/crops/beans/). From a long-term perspective, this germplasm diversity represents a precious resource for genetic improvement targeting higher yields and resistance/tolerance to biotic and abiotic stressors [22]. In the short term, this makes cultivar choice a key step to take full advantage of the large variability in cultivar features, ultimately to obtain high and stable yields in any given cultivation environment [23].
The objectives of this study were (i) developing a new methodology for supporting cultivar recommendation based on the similarity between in silico ideotypes and functional trait profiles of available varieties and (ii) testing the methodology on a real case study. The approach developed is generic, and is thus easily transferable to other crops and traits.
The crop model STICS (Simulateur mulTIdisciplinaire pour les Cultures Standard) [24,25] was used as a simulation engine, this being—according to the authors’ knowledge—the first time this model has been tested for the common bean (Phaseouls vulgaris L.).

2. Materials and Methods

2.1. Characterization of the Study Area

The Emilia-Romagna region (Northern Italy) was selected as a study area, given its primary role in terms of national bean production and harvested areas. The region is characterized by intensive agricultural production systems and by a marked variability in terms of environmental conditions, due to the presence of coastal zones in the eastern part of the region and of the Appennini mountains in the south-west side (Figure 1).
Different contexts were identified in the study area, according to the variability in soil, climate and management conditions, this being the first step to derive a reliable system to support cultivar recommendations [26]. For the zoning process, only the areas with an altitude lower than 500 m a.s.l. were considered, given that horticulture is performed only in the flat areas of the region.
The soil texture map of Emilia-Romagna was retrieved from the regional geological service (https://geo.regione.emilia-romagna.it/geocatalogo/), and three soil classes (fine: clay content >35% and sand content <65%; coarse: clay content <17.5% and sand content >65%; medium: all remaining soils [27]) were adopted to derive zones homogeneous in terms of soil properties (Figure 2a).
Variability in management factors was accounted for by considering two sowing dates, representative of the main sowing periods adopted by farmers for dry bean production: 15th April for early sowings and 15th May for late sowings (early and late sowings hereafter). No differences across the region in terms of water and nitrogen management were considered, the crop being always fully irrigated and with N requirements satisfied by about 50 kg N ha−1 provided as urea (standard practices in the area) in addition to the N made available by symbiotic fixation.
Daily weather data from 2009 to 2018 were retrieved from the high-resolution (5 km × 5 km) gridded climate dataset available at the Regional Agency for Prevention, Environment and Energy of the Emilia-Romagna website (ARPAE), which is based on 60 weather stations for temperature and 254 for rainfall [28]. Overall, the study area consists of 679 cells of 5 km × 5 km. For each of them, global solar radiation (RAD, MJ m−2 d−1) and reference evapotranspiration (ET0, mm d−1) were derived by using the approaches reported by [29,30].
For each combination of climate cell × sowing date, the Synthetic AgroMeteorological indicator (SAM; −1 to +1; Equation (1); [31]) was calculated as:
S A M   =   R a i n   E T 0 R a i n + E T 0
where Rain is the 10-year average cumulated rainfall (mm) in the 100 days after sowing (average duration of the cropping season for bean in Northern Italy) and ET0 is the ET0 calculated over the same period.
Four classes were used to cluster the variability observed in the SAM indicator, leading to the identification of three and four climate subzones for early and late sowings, respectively (Figure 2b).
The intersection of the climate and soil zonations led to the identification of 21 homogeneous contexts (Figure 2c; Table S1), resulting from nine combinations of soil and climate classes for early sowings, and twelve combinations for the late ones.

2.2. Calibration of the Crop Model

The crop model STICS [24,25,32] was selected for the study, given its proven reliability for the simulation of legume species [33,34] and its high level of plasticity [35]. Model plasticity, which can be defined as “the model aptitude to change the sensitivity to parameters while changing the conditions explored” [36], is indeed a desirable model feature when G × E × M interactions need to be explored.
STICS is a generic soil-crop model, reproducing crop growth and development with a daily time step and simultaneously estimating the carbon (C), nitrogen (N), and water balances in the soil–crop system. It accounts for both determinate and indeterminate growth habits, the latter reproduced by considering the trophic interactions between multiple cohorts of fruits. Biomass accumulation is reproduced with a net photosynthesis approach based on radiation use efficiency, as modulated by the effect of temperature, water stress, N availability, excess of radiation, and concentration of CO2 in the atmosphere. Canopy light harvesting depends on leaf area index (LAI) and on the light extinction coefficient (Lambert-Beer’s approach), with fruit pods also contributing to light interception. Crop development is reproduced based on thermal time accumulation, computed as a function of daily mean crop temperature and parameters representing base, optimum, and critical temperatures, and modulated by the effect of vernalization requirements, photoperiod response and water stress. LAI dynamics are simulated by considering development stage and the crop response to temperature, plant density, water and nitrogen stress. A complete description of the model algorithms is available in the seminal literature and in the model documentation [24,25].
In order to adapt the model to the bean varieties used in the study area, parameters were calibrated using data collected in dedicated field experiments carried out between 2016 and 2018 at five sites. The two common bean cultivars Etna and Taylor’s horticultural (hereafter referred to as Taylor’s) were grown, given they are among the most widely cultivated in the study area. Etna was sown on 11 April 2017 in Guardamiglio (45.13° N, 9.64° E, 49 m a.s.l.), on 20 April 2017 in Castelvetro Piacentino (45.08° N, 9.96° E, 39 m a.s.l.), and on 8 May 2018 in Cadriano (44.55° N, 11.41° E, 32 m a.s.l.), whereas Taylor’s was sown on 26 April 2016 in Jolanda di Savoia (44.88° N, 11.97° E, −1 m a.s.l.), on 12 April 2017 in Gossolengo (45.01° N, 9.62° E, 86 m a.s.l.), and on 8 May 2018 in Cadriano. Soil texture was clay-loam in Guardamiglio and Castelvetro Piacentino, clay in Jolanda di Savoia, and silty-clay-loam in Cadriano and Gossolengo (USDA classification), with soil organic carbon ranging from 1.3% (Cadriano) to 5% (Jolanda di Savoia). Field management was allowed to keep the crop weed-, disease- and pest-free, with an optimal water and nutrient supply.
In the three field experiments carried out in 2017, phenology was recorded by using the BBCH scale for bean [37], and dry aboveground biomass (AGB, t ha−1), leaf area index (LAI, -), specific leaf area (SLA, m2 kg−1), canopy height (cm), and the number of leaves and pods per plant were measured at three random points in the field in four sampling events, i.e., at the beginning of flowering (BBCH 60), the beginning of pod development (BBCH 71), the beginning of ripening (BBCH 81), and at maturity (BBCH 89). For AGB, twenty plants for each point were sampled and dried until a constant weight was found. Dry biomass of pods and, at maturity, of seeds was also measured. LAI was estimated by using the PocketLAI smart-app [38], with five measurement replicates at each point. SLA was derived by digitalizing sampled leaves from three random plants and calculating the leaf area to dry leaf mass ratio. In the 2016 field experiment (Jolanda di Savoia), the same sampling scheme as described above was adopted but LAI was not measured. In the experiment in Cadriano, LAI and AGB were measured for both Etna and Taylor’s in two moments, at inflorescence emergence (BBCH 51) and at the start of pod development (BBCH 69). At maturity, dry grain yield was measured.
The STICS parametrization for bean was developed by using a trial-and-error approach, targeting the highest agreement between observed and simulated values for phenology, LAI, aboveground biomass, pod biomass, and yield. For both calibration and validation, model performance was evaluated by using five indices of agreement: mean absolute error (MAE [39]; from 0 to + ∞, optimum: 0); relative root mean square error (RRMSE [40]; from 0 to + ∞, optimum: 0); Nash and Sutcliffe modelling efficiency (EF [41]; from −∞ to 1, optimum: 1); coefficient of residual Mass (CRM [42]; −∞ to +∞, optimum: 0; positive in case of underestimation and vice versa); and coefficient of determination (R2; from 0 to 1, optimum: 1) of the linear regression between observed and simulated data.

2.3. Determination of Functional Trait Values

Twenty-four bean genotypes—including 5 commercial cultivars and 19 new varieties (Table S2)—were evaluated in a dedicated field experiment carried out in Cadriano (44.55° N, 11.41° E) in 2018. Plants were sown on 8 May in 3 m × 7 m plots with a density of 30 plants m−2 and grown under optimal conditions (no limiting factors other than radiation and temperature). The genotypes—all with a determinate growth habit and not sensitive to photoperiod—can be regarded as a representative of the borlotto beans cultivated in Italy, since they cover most of the harvested area for this crop.
Six functional traits were considered related to phenological development (thermal time to begin pod development and thermal time to reach maturity), canopy structure (light extinction coefficient and plant height), photosynthetic efficiency (radiation use efficiency), and yield formation (maximum seed weight).
Dates of phenological stages were recorded at complete emergence (BBCH 10), beginning of pod development (BBCH 69), and full ripening (BBCH 89), and they were then used to derive the thermal time requirements to begin pod development and maturity, using 7 °C as base temperature.
The light extinction coefficient was estimated at first pod appearance by using the smart app PocketPlant3D [43]. PocketPlant3D allows obtaining a 3D distribution of the angles of photosynthetic tissues, which is used to estimate the light extinction coefficient according to Campbell [44]. The 3D scanning was performed on five plants per plot. At the same time, crop height was measured by averaging five measurements per plot.
Radiation use efficiency (g MJ−1, Equation (2)) was estimated according to Paleari et al. [45] in the time interval between complete canopy closure and the beginning of pod development, in order to avoid uncertainty in RUE estimation due to either incomplete soil coverage or leaf senescence:
R U E = A G B 0.5 · R A D · ( 1 e ( k · L A I ) ) · 1 T l i m
where AGB is the total aboveground biomass increase (g m−2) in the time interval Δt estimated from the dry biomass measured on five plants per plot at BBCH 51 (flower buds visible) and BBCH 69 (first pod appearance); 0.5 is a conversion factor to derive photosynthetic active radiation (PAR) from global solar radiation; RAD is the cumulated global solar radiation (MJ m−²) during Δt; k is the extinction coefficient for solar radiation estimated for each cultivar; LAI is the mean leaf area index measured during the time interval Δt using the smart app PocketLAI [38]; Tlim is the mean thermal limitation to net photosynthesis during Δt, which was estimated as a function of cardinal temperatures (trapezoid response curve parameterized with 7 °C, 28 °C, 32 °C, and 42 °C) and mean daily air temperature [25].
At maturity, 50 plants per plot were sampled for yield determination, and seed weight was derived as the average weight of a random sample of 100 dry seeds.
The Grubbs [46] test was applied to detect the presence of outliers for all measurements.
Once the values of the six functional traits for the 24 varieties were determined, their normality was checked using the Shapiro–Wilk test [47], and distribution parameters (mean and standard deviation) were derived for each trait.

2.4. Ideotype Design and Cultivar Recommendation

The distributions of trait values were used to derive ideotypes specific for each of the 21 simulation contexts (homogeneous for soil, climate, and management) using the methodology proposed by Paleari et al. [14]. Under the assumption of a close relationship between model parameters and plant traits (Table 1), this approach makes use of crop modelling and sensitivity analysis (SA) techniques to identify the combination of functional trait values (i.e., the ideotype) that maximizes the value of a given objective function (e.g., yield or resources use efficiency).
In this study, the variance-based global SA method Extended Fourier Amplitude Sensitivity Test (E-FAST [48]) was used to explore the parameter hyperspace. The number of combinations was set to 1494 according to Confalonieri et al. [49] This method allows quantifying the fraction of model output variance due to changes in the values of input factors—in this case model parameters—in terms of first and total order effects, the latter including the effect of interactions among parameters. The output variable used for the computation of SA metrics is the composite index (Yindex, Equation (3)) proposed by Ravasi et al. [35], which allows to account for both yield and yield stability:
Y i n d e x = [ ( Y i Y m a x ) · 0.7 ] +   [ ( 1 C V i C V m a x ) · 0.3 ]
where Yi and CVi are the mean and the coefficient of variations of the yield values simulated with the combination of parameters i over the considered time frame (from 2009 to 2018); Ymax and CVmax are the mean and the coefficient of variations of the yield values simulated with the combination of parameters that achieved the highest yield. Yindex was used to rank the combinations of parameters sampled using the E-FAST method and to define the ideotype trait values as the mean of parameter values of the best 1% combinations [35].
For each of the 21 homogeneous contexts, the similarity between the ideotype and the 24 varieties for which functional trait values were determined was quantified using the weighted Euclidean distance method proposed by Carvalho et al. [50] for index-based selection.
This approach is based on the definition of the optimum range, the optimum phenotypic value and the relative importance of each trait as derived according to the breeder’s experience. The penalization of trait values outside the optimum range is achieved by considering that:
If   L I j     X i j   L S j   then   Y i j = X i j
If   X i j <   L I j   then   Y i j = X i j +   V O j   L S j ;
If   X i j >   L S j   then   Y i j = X i j +   V O j   L I j ;
where Xij and Yij are, respectively, the measured and the transformed phenotypic value of the ith variety for the jth trait; LIj, LSj, and VOj are, respectively, the lower and the upper limit of the optimum range and the optimum value of the jth trait.
In this study, we defined the optimum range of each trait as the range of the corresponding parameter in the best 1% of combinations used to derive the ideotype, and the optimum value of the trait (VOj) as that of the ideotype defined (see Table 1 for the trait-parameter correspondence). Given ideotypes were identified for each of the 21 agro-climatic contexts, LIj, LSj, and VOj were defined for each context too.
The transformed and the optimum phenotypic values of the ith variety for the jth trait (Yij and VOj) were then standardized and weighted as:
y i j =   a j · Y i j s ( Y j )
v o j =   a j · V O j s ( Y j )
where s(Yj) is the standard deviation of the transformed phenotypic value (Yj) of all the varieties including the ideotype, and aj is the relative importance of the jth trait.
In this study, the trait value of the ideotype used to calculate s(Yj) was that of the corresponding model parameter (Table 1), and its sensitivity index (total order effect) was used as the value of aj. This allowed to assign a value of the weighting factor aj that is specific for each of the 21 contexts, thus taking into account the fact that the relative importance of each trait may vary according to soil, climate and management factors.
The index used to score each variety (IDIi) was then calculated according to the following equation (Equation (9)):
I D I i =   1 n   ×   j = 1 n ( y i j   v o j ) 2
The lower the IDIi, the higher the similarity between a variety and the ideotype. Therefore, for each of the 21 agro-climatic contexts, the variety with the highest similarity with the ideotype was considered to be the recommended one.

3. Results

3.1. Model Evaluation

The calibration of model parameters allowed to successfully reproduce bean growth and development under the conditions explored in the study area, and a satisfying performance was confirmed for the validation datasets (Table 2; Figure 3).
Mean RRMSE was equal to 23.4% (including calibration and validation datasets), with values ranging from 10.7% (yield) to 36.1% (pod biomass), and EF was always positive, with the best results obtained for AGB for both the calibration and validation phase (mean value equal to 0.95). CRM revealed a systematic slight model underestimation for LAI and AGB and an overestimation—although negligible—for pod biomass and yield. Concerning R2, it was equal to 0.80 in the calibration dataset (average of all variables), with the lowest value achieved for yield (0.64) and the highest for AGB (0.99), whereas it improved in the validation phase (average value of 0.9), with values ranging from 0.69 (yield) to 0.98 (AGB).

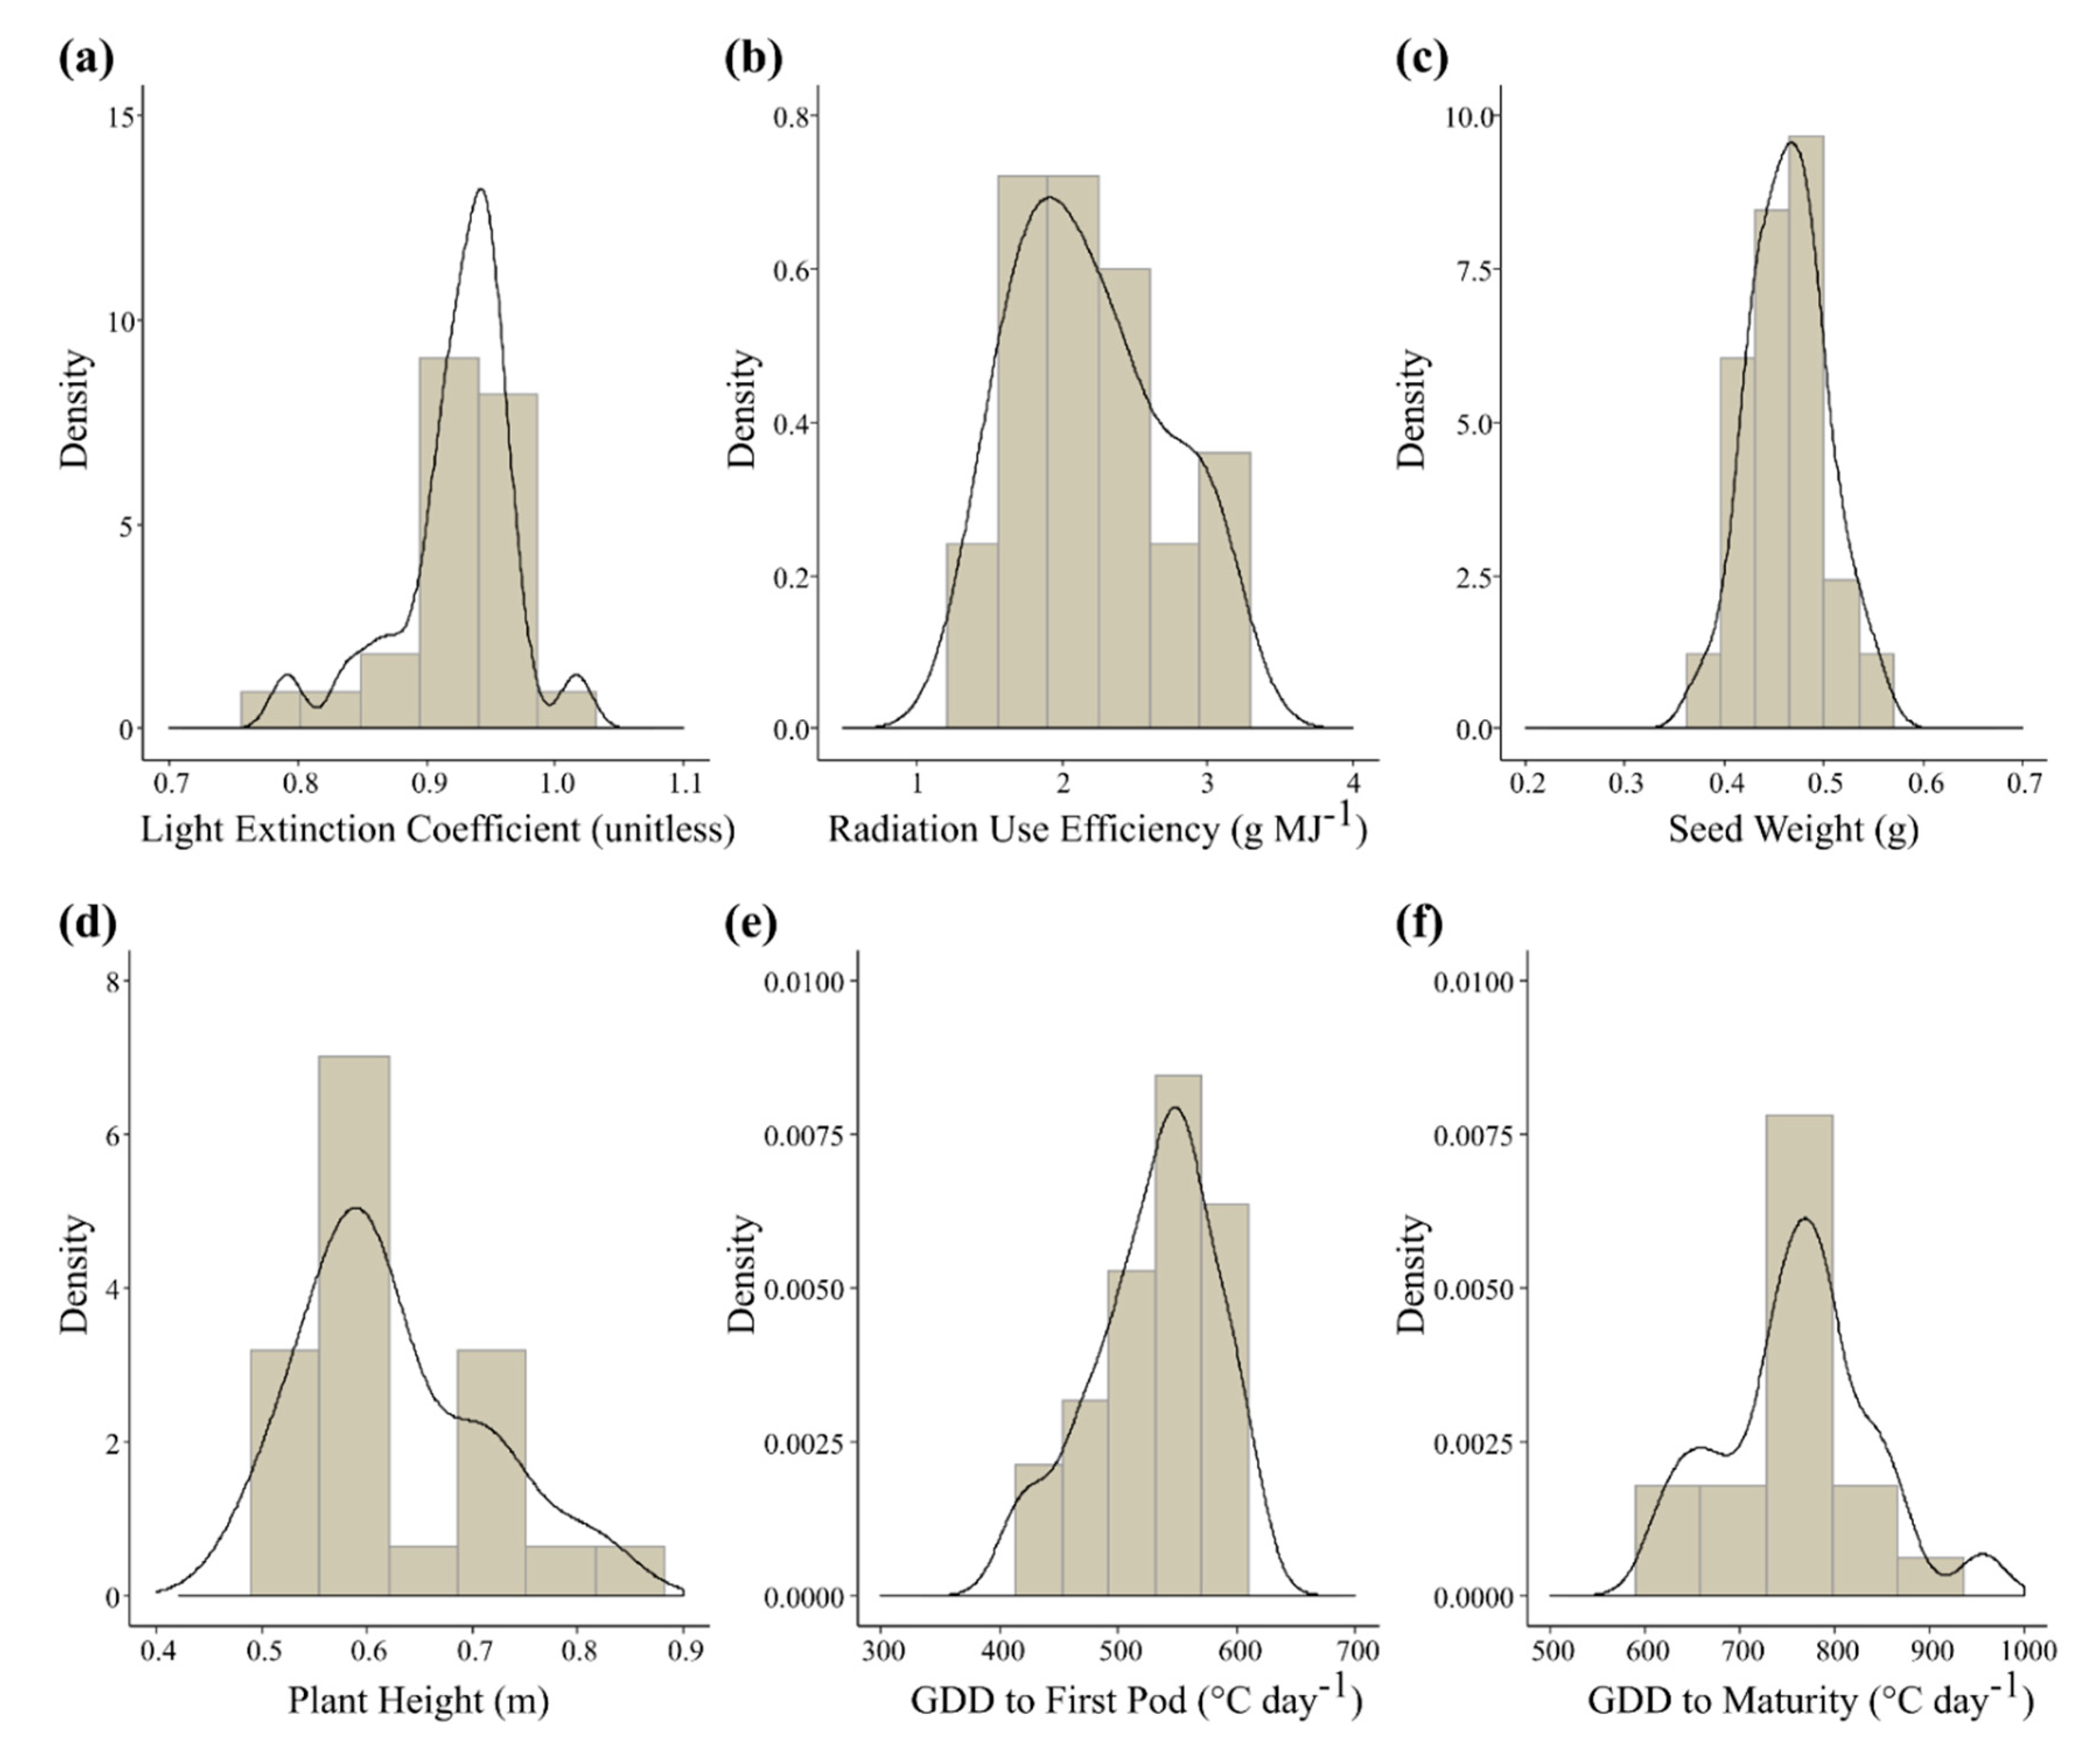
3.2. Variability of Functional Trait Values among Varieties

The analysis of the values of functional traits revealed that a normal distribution properly described the variability observed among the 24 varieties (Figure 4, Table 1). A marked variation in the phenotypic response was found for most of the traits, especially for radiation use efficiency (coefficient of variation was equal to 23.4%, values ranging from 1.4 g MJ−1 to 3.1 g MJ−1). For traits involved with thermal time accumulation, the coefficient of variation was around 10% (9.8% and 10.5% for, respectively, thermal time to first pod and to maturity), and the range of values explored was from 414 °C-day to 607 °C-day for thermal time to first pod, and from 617° C-day to 957 °C-day for thermal time to maturity. A similar variability was found for seed weight (coefficient of variation = 8.3%, values ranging from 0.38 g to 0.55 g) and plant height (coefficient of variation = 13.9%, range was 0.5 m to 0.8 m). Light extinction coefficient was the trait with the lowest heterogeneity among the varieties analyzed, with a coefficient of variation of 5% and values ranging from 0.79 to 1.

3.3. Ideotypes Derived for the Agro-Climatic Contexts

Results of the SA showed that thermal time to first pod was the trait with the largest impact on yield and yield stability for all 21 contexts. The corresponding parameter (stlevdrp) was always ranked first (Figure S1) and explained more than 50% of the variability in the composite index used as a target output variable for the SA (Yindex, Equation (3)). Radiation use efficiency during the vegetative phase (parameter efcroiveg) also played a relevant role, being always ranked second (average total order effect equal to 0.4). The third, fourth and fifth place in the rank were instead more variable, with light extinction coefficient, seed weight and thermal time to maturity (parameters hautmax, pgrainmaxi and stdrpmat, respectively) re-ranking according to the context explored. Thermal time to maturity turned out to be particularly relevant for late sowings and dry conditions (SAM class A and B) and less important in other environments, thus showing a marked heterogeneity in the fraction of Yindex variance (values ranging from 2.1% to 12.5%). Light extinction coefficient and seed weight, instead, did not show any particular pattern, explaining on average 4% and 4.9% of variability in Yindex, respectively. The trait with the lowest impact on Yindex was plant height (parameter hautmax), which accounted for less than 3% of the variability of yield and yield stability regardless of the conditions explored.
The primary role of the traits radiation use efficiency and thermal time to first pod reflected in the features of the ideotypes identified for the 21 contexts (Figure S2). All the ideotypes shared indeed an increased photosynthetic efficiency (+32.4% on average; parameter efcroiveg) and a delay in first pod appearance (+12.4% of thermal time needed to reach first pod on average; parameter stlevdrp), although with a larger variability in the parameter relevance in case of late sowings (Figure S2, lower panel). Reduced plant height and a slight increase in light extinction coefficient were the other features shared among the ideotypes identified for the different contexts (−9.4% and +4% on average, respectively, for the parameters hautmax and extin). Differences among ideotypes were mainly due to changes in thermal time to maturity (parameter stdrpmat), for which an increase was suggested under dry conditions (SAM classes A and B) and a slight decrease under wet ones. This pattern was observed for both early and late sowings, although it was clearer for the latter. The larger heterogeneity in ideotype features in case of late sowings was due to the wider range of conditions explored by the crop in terms of both thermal regimes and relationships between rainfall and evapotranspiration.

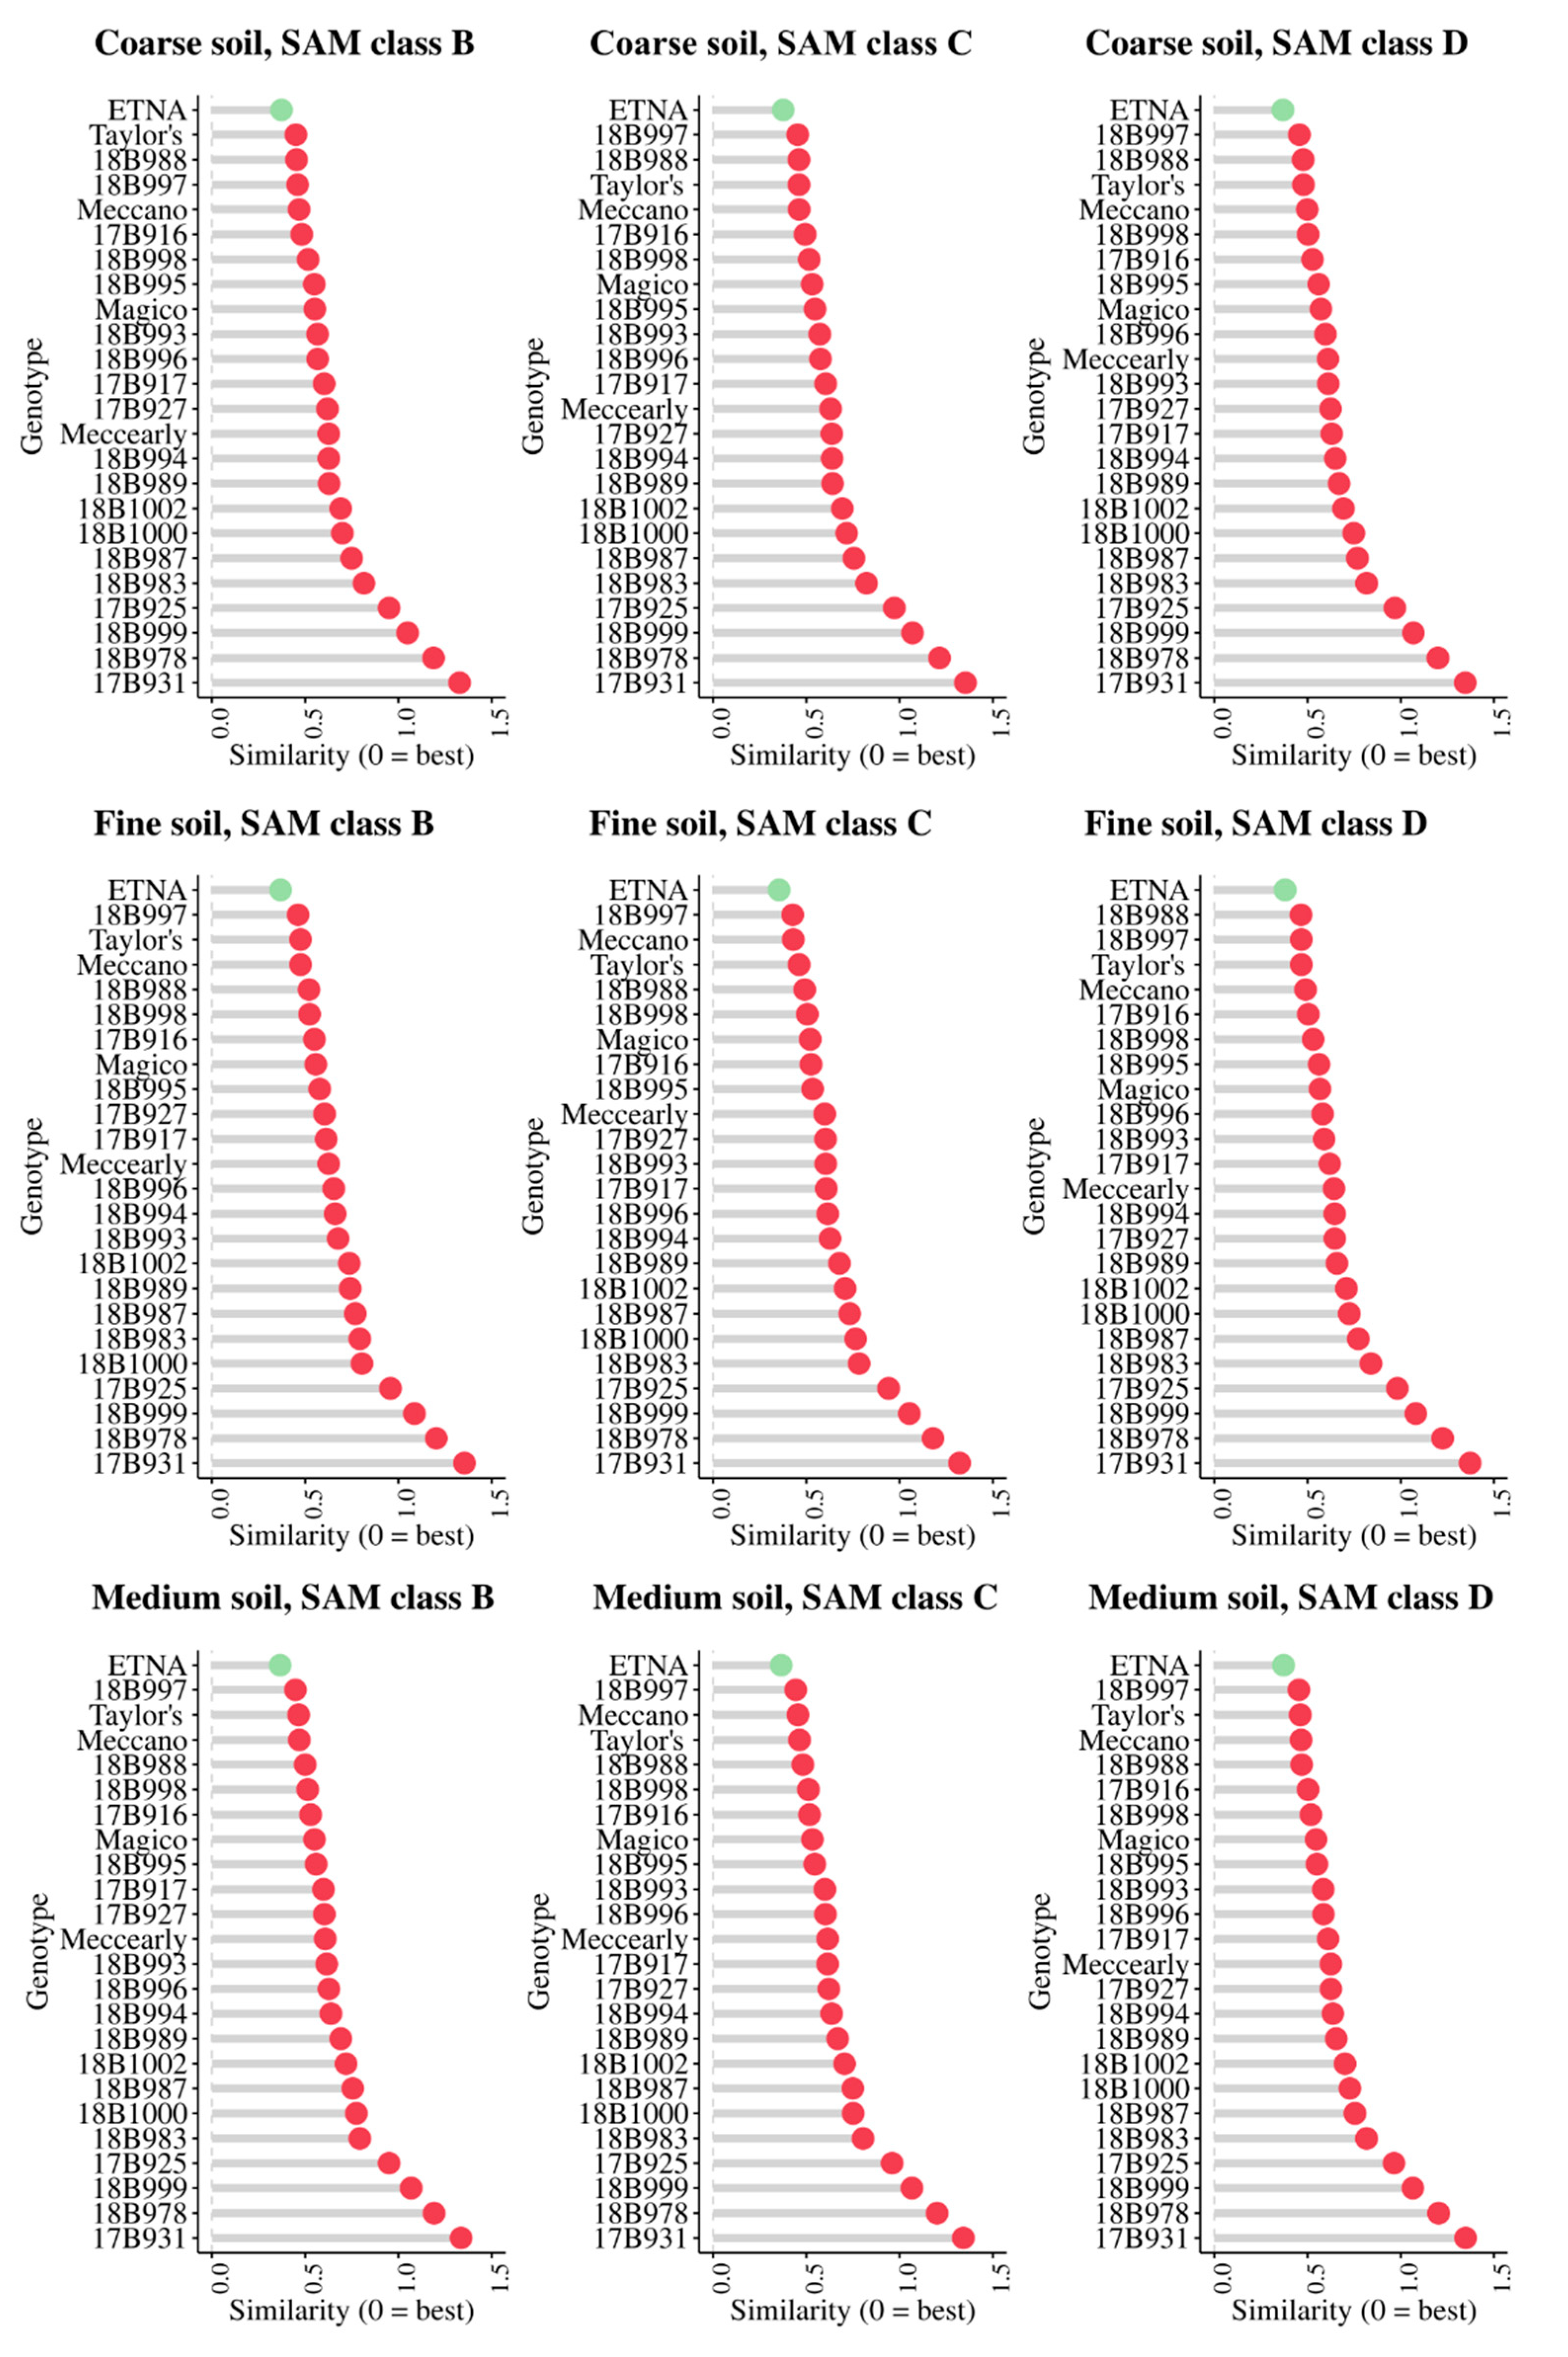
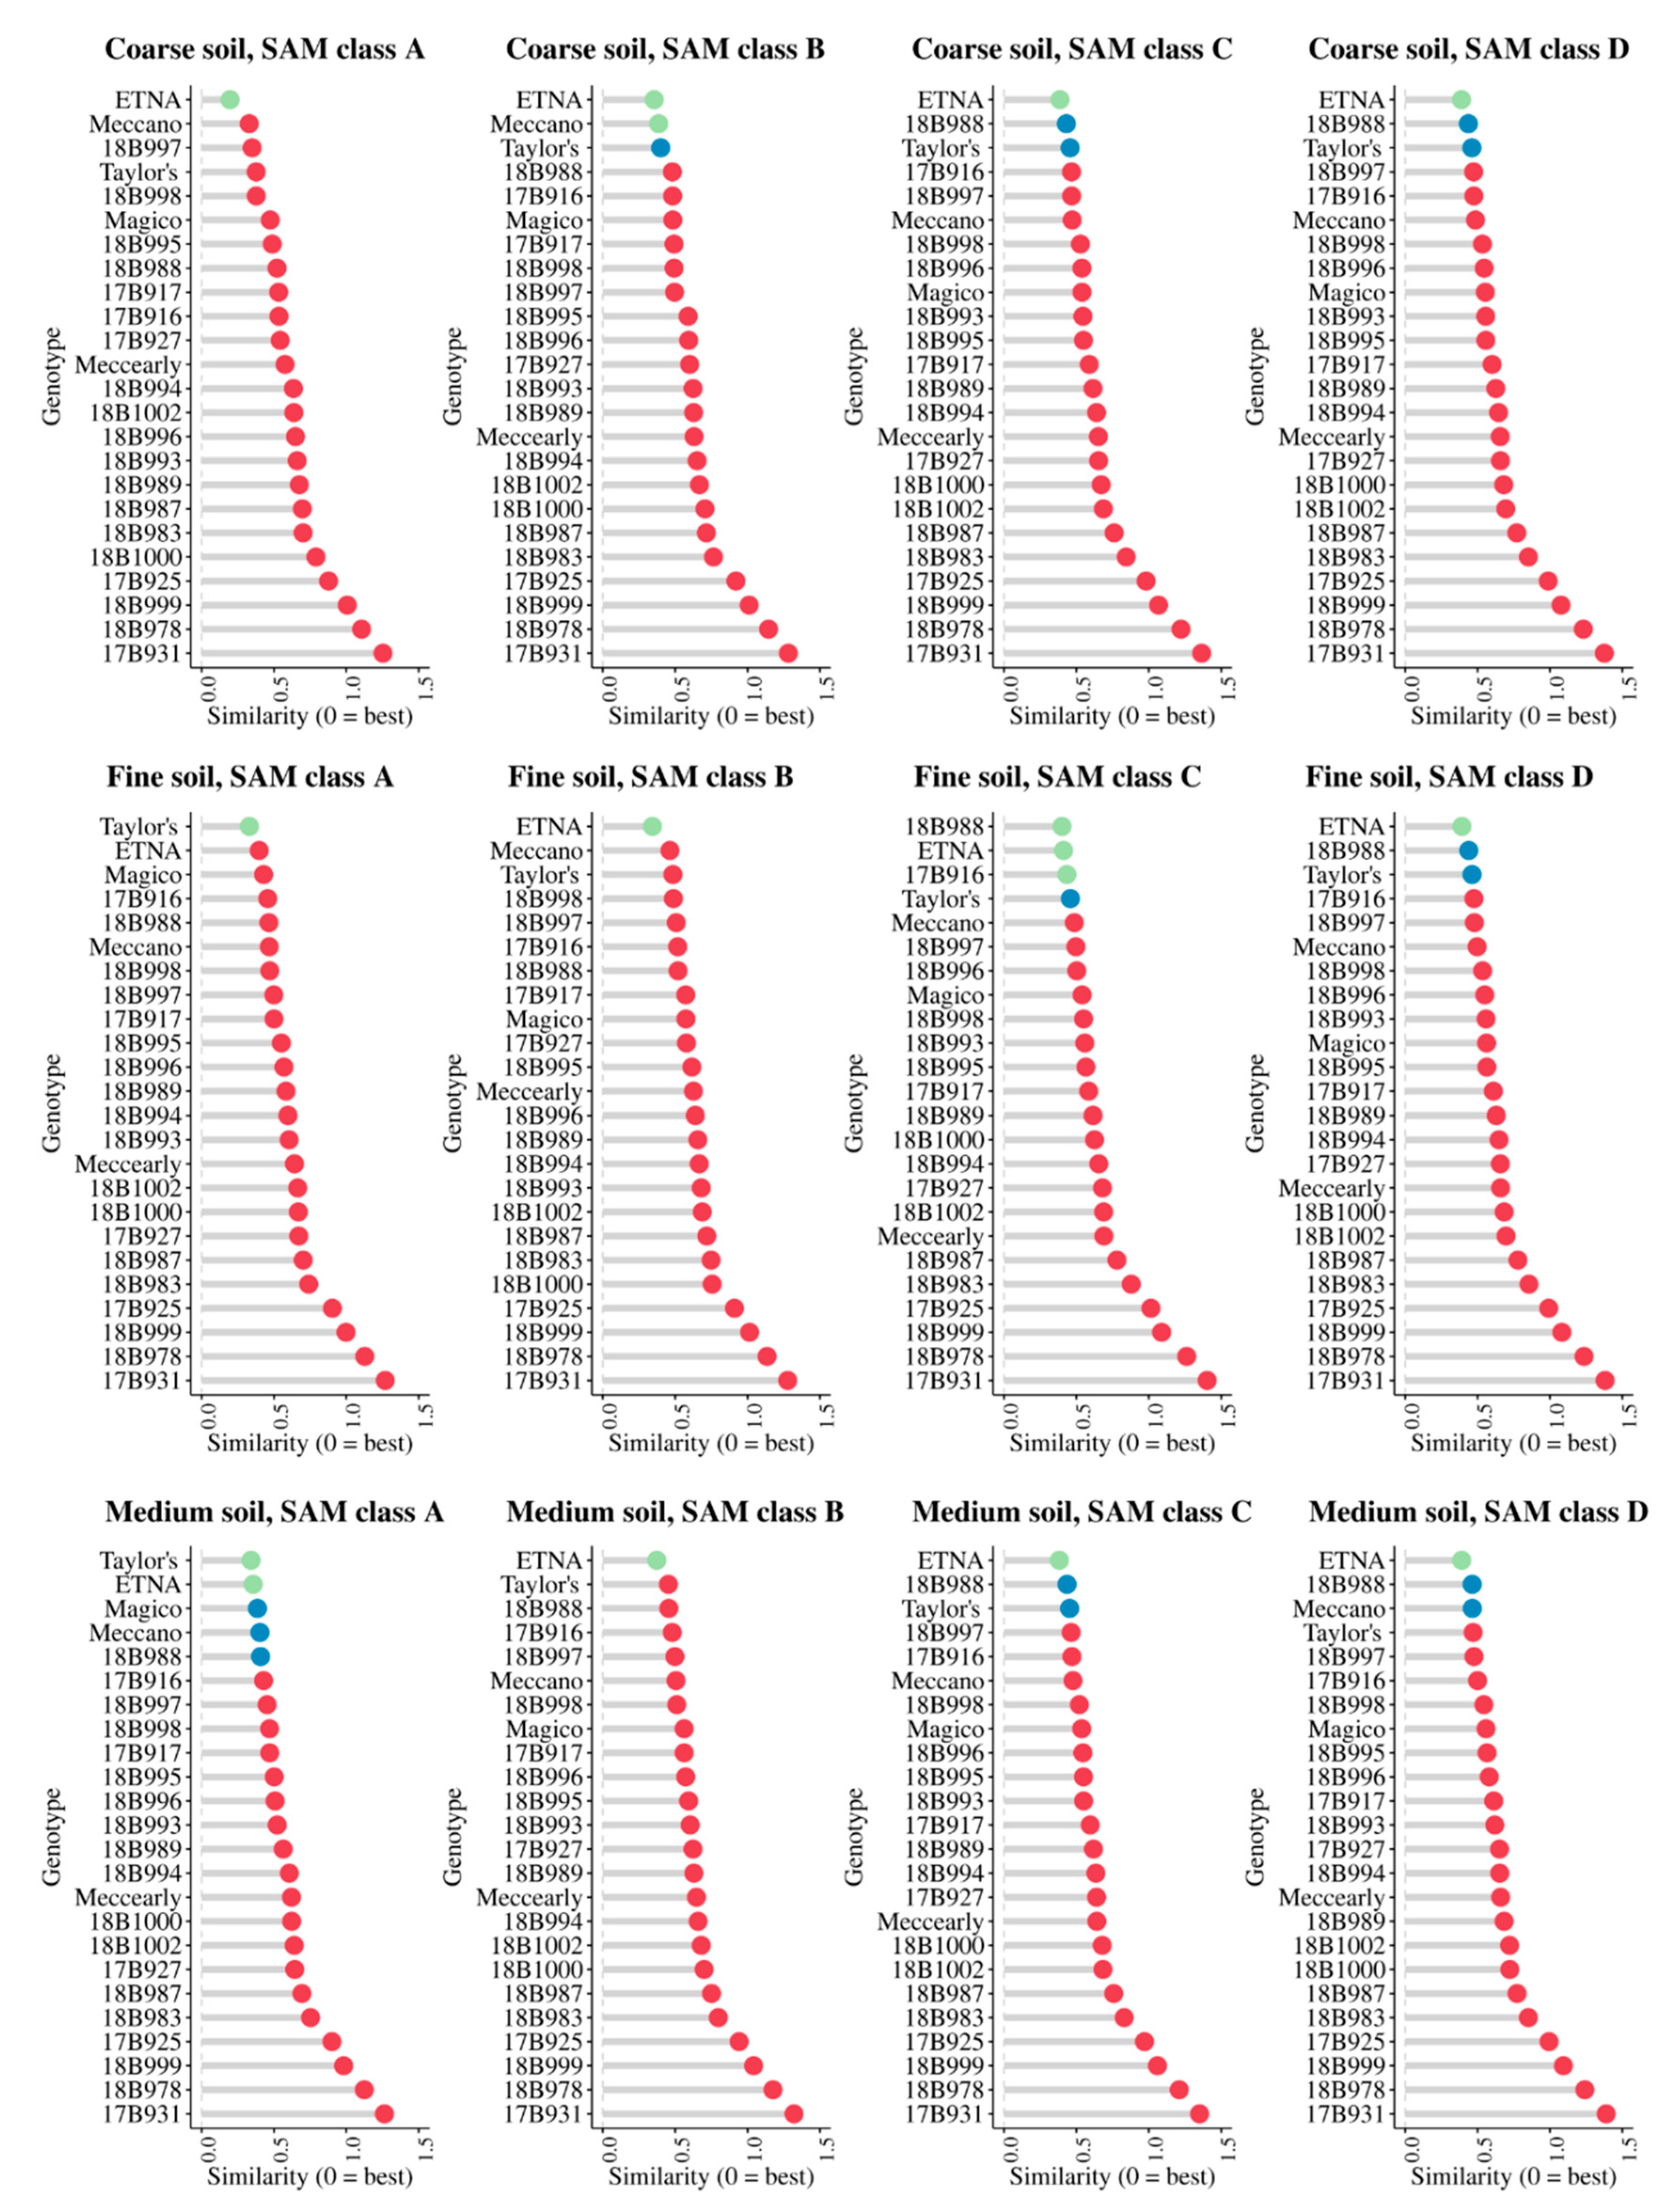
3.4. Cultivar Recommendation

Figure 5 and Figure 6 show the similarity between the ideotypes identified for each of the 21 contexts and the 24 varieties profiled in this study. The varieties at the top of the charts in Figure 5 and Figure 6 are the most similar to the context-specific ideotypes, thus being those recommended for the different contexts.
The variability observed among the ideotypes defined for each condition (Figure S2) was reflected in the heterogeneity among variety rankings. In case of early sowings (Figure 5), the high level of convergence observed among the ideotypes—especially for the traits with the highest sensitivity index (i.e., radiation use efficiency and thermal time to first pod, Figure S2, upper panel)—turned into the recommendation of the same variety (Etna) in all the agro-climatic contexts. A slight variability was observed from the second place downwards (Figure 5), although the differences in the similarity indexes between the first- and second-ranked varieties (higher than 20%) suggested an avoidance of recommending varieties other than Etna regardless of the context considered.
The varieties to be recommended in case of late sowings were instead different while moving across the agro-climatic contexts (Figure 6). The variability achieved among the ideotypes identified for alternative climate and soil combinations (Figure S2, lower panel) turned indeed into differences in the varieties to be recommended. Etna was still recommended in most cases (top-ranked according to the similarity with the ideotype in about 80% of the cases), but varieties Taylor’s, Meccano, 18B988, 17B916 and Magico played a key role too. Taylor’s was ranked first in two contexts out of twelve (SAM class A with fine and medium soils), and resulted in a good second choice variety (the difference in the similarity index compared to the top-ranked variety was lower than 20%) in 50% of the contexts (blue dots in Figure 6). Varieties 18B988 and Meccano were the most similar to the ideotype in one context out of twelve (18B988 for fine soil and SAM class C, Meccano for coarse soil and SAM class B), and they were in the pool of second choice varieties in 50% (18B988) and 16% (Meccano) of the cases. The placement of 17B916 and Magico in the rankings was instead a clear example of the large variability observed for late sowings. They resulted in nearly being recommendable (17B916 for fine soil and SAM class C, Magico for medium soil and SAM class A) in one context out of twelve, but then they played a marginal role—down to the tenth position in the ranking for Magico—in all the other contexts.
Another difference between the results obtained for early and late sowings was that for the latter it was possible to identify second choice varieties (blue in Figure 6, i.e., genotypes with an intermediate position between recommended cultivar (green in Figure 6) and those regarded as not suitable (red) for a specific growing contexts), thus presenting more options to farmers for variety choice. Differences between early and late sowings were found also in terms of the number of varieties recommended (green in Figure 5 and Figure 6). In the case of late sowings, indeed, up to three varieties were found to be very similar to the ideotype defined for fine soil and SAM class C, whereas only one cultivar resulted in being recommendable for early sowings regardless of the conditions explored (Figure 5).
Both early and late sowings presented a smooth worsening of the similarity index while moving from the top to the bottom of the charts shown in Figure 5 and Figure 6 until the fourth last position in the rank, where a steep decline in the similarity index was observed. The four bottom-ranked varieties were the same for all the 21 contexts analyzed, thus suggesting poor performance for these genotypes regardless of the sowing time, soil properties and climate conditions.

4. Discussion

The distributions derived for the six functional traits highlighted the marked heterogeneity in the pool of bean varieties, although the distribution means were in line with those reported in the literature for the common bean. For instance, the values of radiation use efficiency and light extinction coefficient estimated in this study were consistent with that reported by other authors [51,52] for common beans grown under optimal conditions. In the same way, the mean values for plant height, seed weight, and phenological traits were similar to what was reported for Italian common bean genotypes by Mercati et al. [53] and Campion et al. [54]. Despite distributions being derived using data from a single season, they can be considered as reliable. Indeed, the optimal growing conditions (for water, nutrients, weeds, and pests) and the methodology adopted to account for the effects of temperature on traits affected by thermal limitation (i.e., radiation use efficiency [25]) allowed a reduction of the effect of specific growing conditions on trait value determination [45]. Moreover, the phenotyping activities performed in this study focused on functional traits, which are less affected by G × E × M interactions compared to performance traits [16]. However, the purpose of this study was to present a new methodology to support cultivar recommendations. Therefore, different approaches for the characterization of pools of genotypes can be easily incorporated in the workflow we proposed, e.g., by extending the methodology to traits involved with tolerance/resistance to biotic and abiotic stressors, which can also be accounted for in ideotyping studies (e.g., [14]). The method can be applied also in cases of large variability among genotypes, given that this variability will reflect in the trait distributions used for sensitivity analysis and thus in the variability among the combinations of trait values used to design the ideotypes.
According to the author’s knowledge, this is the first time the crop model STICS is used for the common bean (Phaseolus vulgaris L.). However, its adaptability to different kinds of crops [25] has allowed us to obtain satisfactory results for both calibration and validation datasets, with agreement metrics in line with those reported for other legume species [33,34,35].
Although the extension of the study area was less than 16 thousands square kilometers, the heterogeneity in environmental conditions (soil, climate, and management) led to the identification of more than twenty homogeneous contexts. The variability in the results obtained for both ideotype definition and cultivar recommendations highlighted the marked impact of G × E × M on crop productivity and yield stability. This underlines once more the importance of targeting context-specific ideotypes [15,17] and of accurate characterizations of the environmental context before cultivar choice [26].
Given the complex and dynamic nature of G × E × M interactions—explored here via context-specific ideotyping—the impact of functional traits on the target goal (e.g., maximizing yield) may act counterintuitively and may be specific for the environmental and management conditions considered [55]. In this regard, the comprehensive exploration of the variability in growing conditions in the target area—and of its impact on recommended varieties—allowed us to show that Etna is likely the best choice regardless of soil and climate conditions in case of early sowings, whereas for late sowings there are new varieties (e.g., 18B988 and 17B916) and other cultivars (e.g., Taylor’s and Meccano) that might be a better option for achieving high and stable yields. For instance, in the case of the driest climate (SAM class A) with coarse soil (Figure 6), the slightly earlier flowering and the higher radiation use efficiency of Etna made this cultivar a better choice than Taylor’s, but the situation was overturned in the case of medium and fine soils. This is probably due to the fact that, even if the crop is irrigated, the mild water stress experienced before irrigation is triggered occurs more frequently in coarse soils than in those with higher water holding capacities, which under the dry and warm conditions that characterize the SAM class A (Figure S3) shortened the crop cycle, in turn penalizing crop productivity.
Another example of the marked G × E interactions observed for late sowings is the different ranking achieved by the cultivar Magico across different agro-climatic conditions. This cultivar was indeed among the top-ranked under SAM class A (driest and warmest), but it was clearly penalized under SAM class D. This can be due to the fact that Magico has a long pod filling duration, and the low temperatures that characterize SAM class D contexts (Figure S3) delayed the phenological development and led to maturity occurring under conditions warmer than the crop needs. The negative impact of high temperatures on pod filling due to reduced translocation of photosynthates to reproductive organs [56] is indeed accounted for by the model used in this study [25].
The reliability of the rankings we obtained was supported by the positive feedback received by the stakeholders involved in the study. Cultivar Etna was rated as one of the best in multi-year evaluation trials conducted in the study area, to the point of being used as a benchmark for the evaluation of new lines. As a result, it is currently one of the most widely grown varieties in the study area and, together with Taylor’s and Meccano, it is among the varieties recommended by the Emilia-Romagna Region Agronomic Service. However, preliminary results from field trials carried out in 2017 and 2018 pointed out new promising genotypes, including those identified in this study as being of potential interest (e.g., 18B988).
The methodology developed in this study also indicates second choice varieties (i.e., those with an index of similarity to the context-specific ideotype differing less than 20% from that of the top-ranked variety). This allows supporting—when possible—the recommendation of more than one variety, given that some of the traits that may contribute to drive the farmer’s choice were not included in the analysis. For instance, in case of the borlotto beans, the seed coat colour and other quality traits (e.g., seed shape) are important features for products destined for the dry seed market. Moreover, a larger pool of recommended cultivars would meet the need of sowing more varieties to limit the risk of yield losses due to the susceptibility of a particular genotype to specific biotic or abiotic stressors [26,57]. However, it should be noted that all these traits (qualitative traits and resistance/tolerance traits) can potentially be included in the workflow proposed, the only limit being—as in this study—the availability of functional trait measurements for the varieties of interest.
In particular, the methodology proposed can be easily extended to traits involved with resistance/tolerance to biotic and abiotic stressors. Indeed, examples of ideotyping studies targeting resistance/tolerance traits are already available (e.g., [14,58,59]), and constant efforts are being made by the modelling community to enhance the capability of crop models to reproduce the impact of environmental stressors on crop growth and development (e.g., [60,61]).

5. Conclusions

Variety recommendation is the last step of a breeder’s work and the key starting point of the agricultural production chain. Taking advantage of the capability of crop models to explicitly reproduce G × E × M interactions on large areas and of the available knowledge on the integration of the ideotype concept in cultivar selection frameworks, this study provides the first practical example of exploiting model-based ideotyping for cultivar recommendation purposes.
Results highlighted that even small variation in the environmental and management conditions may have a clear impact on variety suitability. This, in turn, underlines the key role of an accurate characterization of the target pool of environments (climate, soil, management factors) and the importance of grounding the variety recommendation process on context-specific ideotypes.
The crop model STICS was used as a simulation engine, which proved to be able to reliably reproduce bean growth and development despite it being the first time it was used for such a crop. Nevertheless, different crop models can be integrated into the proposed methodological framework. The approach we propose is indeed generic, being easily transferable to other crops, traits, and objective functions (e.g., resource use efficiency, ecosystem services). Given its flexibility and the limited number of inputs required, this approach has the potential for being operationally used to support breeders, seed companies and farmers in the identification of the best varieties for production contexts deriving from high-resolution zonations based on differences in environmental and management factors.

Supplementary Materials

The following are available online at https://www.mdpi.com/2073-4395/10/11/1733/s1, Figure S1: Sensitivity analysis results. E-FAST Total Order effect for all the combinations of sowing (early and late), soil (coarse, fine, and medium texture), and climate (SAM: Synthetic Agroclimatic Indicator); Figure S2. Ideotypes derived for early sowing (a) and late sowing (b) for each combination of soil (coarse, fine, and medium texture) and climate factors (SAM, Synthetic Agrometeorological Indicator). Ideotypes are reported as percentage variation of each trait as compared to the distribution mean. Extin: light extinction coefficient; efcroiveg: radiation use efficiency in the vegetative phase; stlevdrp: thermal time from sowing to first pod; stdrpmat: thermal time from first pod to maturity; pgrainmaxi: maximum seed weight; hautmax: maximum plant height; Figure S3. Boxplots of the variability observed in the 10-year time frame for daily mean, minimum and maximum temperatures (°C) in each combination of SAM class (SAM, Synthetic Agrometeorological Indicator; classes from A to D) and sowing time (early: 15th April; late: 15th May). Higher heterogeneity between SAM class can be seen in case of late sowing as compared to early ones. The soil type is not a factor included in the plot since all three soil types are present in each SAM × sowing time combination; Table S1. Simulation units derived from the intersection of sowing time, soil type and climate features (SAM; Synthetic Agrometeorological Indicator; from −1 to 1; Confalonieri et al., 2010); Table S2. Bean genotypes involved in the field experiment conducted in Cadriano (BO, Italy) in 2018. All genotypes are “borlotto” type and have a determinate bush growth habit. The name of the company who provided the seeds is also reported. For commercial cultivars, information about the registration are shown as retrieved from the EU database of registered plant varieties (2019 consolidated version) available at: https://ec.europa.eu/food/sites/food/files/plant/docs/plant-variety-catalogues_vegetable-species.pdf.

Author Contributions

Conceptualization, R.C. and L.P.; methodology, L.P., R.C., F.M.V., R.A.R.; data acquisition and analysis, L.P., R.C., F.M.V., R.A.R., E.M., S.T., M.I.; writing, L.P., R.C., R.A.R. All authors have read and agreed to the published version of the manuscript.

Funding

This research was partly funded by the Emilia Romagna Region, grant number FEASR PSR 2014-2020 sottomisura 16.1.01, domanda 5004939, and grant number FEASR PSR 2014-2020 sottomisura 16.2.01, domanda 5049726.

Acknowledgments

We gratefully acknowledged Stefano Moretti, Micol Femminella, Francesco Bergonzi and Daniele Piva (Conserve Italia Soc. Coop. Agricola) for providing information on the variety field trials and feedbacks on results.

Conflicts of Interest

The authors declare no conflict of interest.

References

  1. Messina, C.; Hammer, G.; Dong, Z.; Podlich, D.; Cooper, M. Modelling crop improvement in a G×E×M framework via gene–trait–phenotype relationships. In Crop Physiology: Application for Genetic Improvement and Agronomy; Sadras, V., Calderini, D., Eds.; Academic press: London, UK, 2009; pp. 235–265. ISBN 978-0-12-374431-9. [Google Scholar]
  2. Annicchiarico, P. Genotype X Environment Interactions: Challenges and Opportunities for Plant Breeding and Cultivar Recommendations; FAO: Rome, Italy, 2002; ISBN 978-92-5-104870-2. [Google Scholar]
  3. DeLacy, I.H.; Basford, K.E.; Cooper, M.; Bull, J.K.; McLaren, C.G. Analysis of multi-environment trials—An historical perspective. In Plant Adaptation and Crop Improvement; Cooper, M., Hammer, G.L., Eds.; CAB International: Wallingford, UK, 1996; Volume 39124, pp. 39–124. [Google Scholar]
  4. Casadebaig, P.; Mestries, E.; Debaeke, P. A model-based approach to assist variety evaluation in sunflower crop. Eur. J. Agron. 2016, 81, 92–105. [Google Scholar] [CrossRef] [Green Version]
  5. Comstock, R.E. Quantitative Genetics and the Design of Breeding Programs. In Proceedings of the International Conference Quantitative Genetics, Ames, IA, USA, 16–21 August 1976; Iowa State University Press: Ames, IA, USA, 1977; pp. 1705–1718. [Google Scholar]
  6. Lúquez, J.E.; Aguirrezábal, L.A.N.; Agüero, M.E.; Pereyra, V.R. Stability and adaptability of cultivars in non-balanced yield trials. Comparison of methods for selecting ‘High Oleic’ sunflower hybrids for grain yield and quality. J. Agron. Crop Sci. 2002, 188, 225–234. [Google Scholar] [CrossRef]
  7. Kang, M.S. Breeding: Genotype-by-environment interaction. In Encyclopedia of Plant and Crop Science; Goodman, R.M., Ed.; CRC Press: Boca Raton, FL, USA, 2004; pp. 218–221. [Google Scholar]
  8. Fan, X.-M.; Kang, M.S.; Chen, H.; Zhang, Y.; Tan, J.; Xu, C. Yield stability of maize hybrids evaluated in multi-environment trials in Yunnan, China. Agron. J. 2007, 99, 220–228. [Google Scholar] [CrossRef]
  9. Chenu, K.; Cooper, M.; Hammer, G.L.; Mathews, K.L.; Dreccer, M.F.; Chapman, S.C. Environment characterization as an aid to wheat improvement: Interpreting genotype–environment interactions by modelling water-deficit patterns in North-Eastern Australia. J. Exp. Bot. 2011, 62, 1743–1755. [Google Scholar] [CrossRef] [PubMed] [Green Version]
  10. Jeuffroy, M.-H.; Casadebaig, P.; Debaeke, P.; Loyce, C.; Meynard, J.-M. Agronomic model uses to predict cultivar performance in various environments and cropping systems. A review. Agron. Sustain. Dev. 2014, 34, 121–137. [Google Scholar] [CrossRef]
  11. Chenu, K.; Porter, J.R.; Martre, P.; Basso, B.; Chapman, S.C.; Ewert, F.; Bindi, M.; Asseng, S. Contribution of crop models to adaptation in wheat. Trends Plant Sci. 2017, 22, 472–490. [Google Scholar] [CrossRef] [PubMed]
  12. Chapman, S.C.; Cooper, M.; Hammer, G.L.; Butler, D.G. Genotype by environment interactions affecting grain sorghum. II. Frequencies of different seasonal patterns of drought stress are related to location effects on hybrid yields. Aust. J. Agric. Res. 2000, 51, 209. [Google Scholar] [CrossRef]
  13. Hammer, G.L.; Jordan, D.R. An integrated systems approach to crop improvement. In Scale and Complexity in Plant Systems Research: Gene–Plant–Crop Relations; Wageningen UR: Frontis Series; Spiertz, J.H.J., Struik, P.C., van Laar, H.H., Eds.; Springer: Dordrecht, The Netherlands, 2007; pp. 45–61. [Google Scholar]
  14. Paleari, L.; Movedi, E.; Cappelli, G.; Wilson, L.T.; Confalonieri, R. Surfing parameter hyperspaces under climate change scenarios to design future rice ideotypes. Glob. Change Biol. 2017, 23, 4651–4662. [Google Scholar] [CrossRef]
  15. Tao, F.; Rötter, R.P.; Palosuo, T.; Díaz-Ambrona, C.G.H.; Mínguez, M.I.; Semenov, M.A.; Kersebaum, K.C.; Nendel, C.; Cammarano, D.; Hoffmann, H.; et al. Designing future barley ideotypes using a crop model ensemble. Eur. J. Agron. 2017, 82, 144–162. [Google Scholar] [CrossRef]
  16. Violle, C.; Navas, M.-L.; Vile, D.; Kazakou, E.; Fortunel, C.; Hummel, I.; Garnier, E. Let the concept of trait be functional! Oikos 2007, 116, 882–892. [Google Scholar] [CrossRef]
  17. Paleari, L.; Cappelli, G.; Bregaglio, S.; Acutis, M.; Donatelli, M.; Sacchi, G.A.; Lupotto, E.; Boschetti, M.; Manfron, G.; Confalonieri, R. District specific, in silico evaluation of rice ideotypes improved for resistance/tolerance traits to biotic and abiotic stressors under climate change scenarios. Clim. Change 2015, 132, 661–675. [Google Scholar] [CrossRef]
  18. Gauffreteau, A. Using ideotypes to support selection and recommendation of varieties. OCL 2018, 25, D602. [Google Scholar] [CrossRef]
  19. Broughton, W.J.; Hernández, G.; Blair, M.; Beebe, S.; Gepts, P.; Vanderleyden, J. Beans (Phaseolus spp.)—model food legumes. Plant Soil 2003, 252, 55–128. [Google Scholar] [CrossRef] [Green Version]
  20. Graham, P.H.; Ranalli, P. Common bean (Phaseolus vulgaris L.). Field Crop. Res. 1997, 53, 131–146. [Google Scholar] [CrossRef]
  21. Beebe, S.E.; Rao, I.M.; Blair, M.W.; Acosta-Gallegos, J.A. Phenotyping common beans for adaptation to drought. Front. Physiol. 2013, 4. [Google Scholar] [CrossRef] [Green Version]
  22. Mousavi-Derazmahalleh, M.; Bayer, P.E.; Hane, J.K.; Valliyodan, B.; Nguyen, H.T.; Nelson, M.N.; Erskine, W.; Varshney, R.K.; Papa, R.; Edwards, D. Adapting legume crops to climate change using genomic approaches. Plant Cell Environ. 2019, 42, 6–19. [Google Scholar] [CrossRef] [Green Version]
  23. Beebe, S.; Ramirez, J.; Jarvis, A.; Rao, I.M.; Mosquera, G.; Bueno, J.M.; Blair, M.W. Genetic improvement of common beans and the challenges of climate change. In Crop Adaptation to Climate Change; Yadav, S.S., Redden, R.J., Hatfield, J.L., Lotze-Campen, H., Hall, A.E., Eds.; Wiley-Blackwell: Oxford, UK, 2011; pp. 356–369. ISBN 978-0-470-96092-9. [Google Scholar]
  24. Brisson, N.; Mary, B.; Ripoche, D.; Jeuffroy, M.H.; Ruget, F.; Nicoullaud, B.; Gate, P.; Devienne-Barret, F.; Antonioletti, R.; Durr, C.; et al. STICS: A generic model for the simulation of crops and their water and nitrogen balances. I. Theory and parameterization applied to wheat and corn. Agronomie 1998, 18, 311–346. [Google Scholar] [CrossRef]
  25. Brisson, N.; Launay, M.; Mary, B.; Beaudoin, N. Conceptual Basis, Formalisations and Parameterization of the Stics Crop Model; Editions Quae: Paris, France, 2009; ISBN 978-2-7592-0290-4. [Google Scholar]
  26. Annicchiarico, P. Coping with and exploiting genotype-by-environment interactions. In Plant Breeding and Farmer Participation; Ceccarelli, S., Guimarães, E.P., Weltzien, E., Eds.; FAO: Rome, Italy, 2009; pp. 519–564. [Google Scholar]
  27. Al Majou, H.; Bruand, A.; Duval, O.; Le Bas, C.; Vautier, A. Prediction of soil water retention properties after stratification by combining texture, bulk density and the type of horizon. Soil Use Manag. 2008, 24, 383–391. [Google Scholar] [CrossRef] [Green Version]
  28. Antolini, G.; Auteri, L.; Pavan, V.; Tomei, F.; Tomozeiu, R.; Marletto, V. A daily high-resolution gridded climatic data set for Emilia-Romagna, Italy, during 1961–2010. Int. J. Climatol. 2016, 36, 1970–1986. [Google Scholar] [CrossRef] [Green Version]
  29. Hargreaves, G.H.; Samani, Z.A. Estimating potential evapotranspiration. J. Irrig. Drain. Div. 1982, 108, 225–230. [Google Scholar]
  30. Hargreaves, G.H. Reference crop evapotranspiration from temperature. Appl. Eng. Agric. 1985, 1, 96–99. [Google Scholar] [CrossRef]
  31. Confalonieri, R.; Bregaglio, S.; Acutis, M. A proposal of an indicator for quantifying model robustness based on the relationship between variability of errors and of explored conditions. Ecol. Model. 2010, 221, 960–964. [Google Scholar] [CrossRef]
  32. Brisson, N.; Gary, C.; Justes, E.; Roche, R.; Mary, B.; Ripoche, D.; Zimmer, D.; Sierra, J.; Bertuzzi, P.; Burger, P.; et al. An overview of the crop model stics. Eur. J. Agron. 2003, 18, 309–332. [Google Scholar] [CrossRef]
  33. Coucheney, E.; Buis, S.; Launay, M.; Constantin, J.; Mary, B.; García de Cortázar-Atauri, I.; Ripoche, D.; Beaudoin, N.; Ruget, F.; Andrianarisoa, K.S.; et al. Accuracy, robustness and behavior of the STICS soil–crop model for plant, water and nitrogen outputs: Evaluation over a wide range of agro-environmental conditions in France. Environ. Model. Softw. 2015, 64, 177–190. [Google Scholar] [CrossRef]
  34. Falconnier, G.N.; Journet, E.-P.; Bedoussac, L.; Vermue, A.; Chlébowski, F.; Beaudoin, N.; Justes, E. Calibration and evaluation of the STICS soil-crop model for faba bean to explain variability in yield and N2 fixation. Eur. J. Agron. 2019, 104, 63–77. [Google Scholar] [CrossRef]
  35. Ravasi, R.A.; Paleari, L.; Vesely, F.M.; Movedi, E.; Thoelke, W.; Confalonieri, R. Ideotype definition to adapt legumes to climate change: A case study for field pea in Northern Italy. Agric. For. Meteorol. 2020, 291, 108081. [Google Scholar] [CrossRef]
  36. Confalonieri, R.; Bregaglio, S.; Acutis, M. Quantifying plasticity in simulation models. Ecol. Model. 2012, 225, 159–166. [Google Scholar] [CrossRef]
  37. Meier, U. Growth Stages of Mono-And Dicotyledonous Plants, 2nd ed.; Federal Biological Research Centre for Agriculture and Forestry: Braunschweig, Germany, 2001. [Google Scholar]
  38. Confalonieri, R.; Foi, M.; Casa, R.; Aquaro, S.; Tona, E.; Peterle, M.; Boldini, A.; De Carli, G.; Ferrari, A.; Finotto, G.; et al. Development of an app for estimating leaf area index using a smartphone. Trueness and precision determination and comparison with other indirect methods. Comput. Electron. Agric. 2013, 96, 67–74. [Google Scholar] [CrossRef]
  39. Willmott, C.; Matsuura, K. Advantages of the mean absolute error (MAE) over the root mean square error (RMSE) in assessing average model performance. Clim. Res. 2005, 30, 79–82. [Google Scholar] [CrossRef]
  40. Jørgensen, S.E.; Kamp-Nielsen, L.; Christensen, T.; Windolf-Nielsen, J.; Westergaard, B. Validation of a prognosis based upon a eutrophication model. Ecol. Model. 1986, 32, 165–182. [Google Scholar] [CrossRef]
  41. Nash, J.E.; Sutcliffe, J.V. River flow forecasting through conceptual models part I—A discussion of principles. J. Hydrol. 1970, 10, 282–290. [Google Scholar] [CrossRef]
  42. Loague, K.; Green, R.E. Statistical and graphical methods for evaluating solute transport models: Overview and application. J. Contam. Hydrol. 1991, 7, 51–73. [Google Scholar] [CrossRef]
  43. Confalonieri, R.; Paleari, L.; Foi, M.; Movedi, E.; Vesely, F.M.; Thoelke, W.; Agape, C.; Borlini, G.; Ferri, I.; Massara, F.; et al. PocketPlant3D: Analysing canopy structure using a smartphone. Biosyst. Eng. 2017, 164, 1–12. [Google Scholar] [CrossRef]
  44. Campbell, G.S. Extinction coefficients for radiation in plant canopies calculated using an ellipsoidal inclination angle distribution. Agric. For. Meteorol. 1986, 36, 317–321. [Google Scholar] [CrossRef]
  45. Paleari, L.; Movedi, E.; Vesely, F.M.; Confalonieri, R. Tailoring parameter distributions to specific germplasm: Impact on crop model-based ideotyping. Sci. Rep. 2019, 9, 18309. [Google Scholar] [CrossRef] [PubMed]
  46. Grubbs, F.E. Procedures for Detecting Outlying Observations in Samples. Technometrics 1969, 11, 1–21. [Google Scholar] [CrossRef]
  47. Shapiro, S.S.; Wilk, M.B. An analysis of variance test for normality (Complete Samples). Biometrika 1965, 52, 591. [Google Scholar] [CrossRef]
  48. Saltelli, A.; Tarantola, S.; Chan, K.P.-S. A quantitative model-independent method for global sensitivity analysis of model output. Technometrics 1999, 41, 39–56. [Google Scholar] [CrossRef]
  49. Confalonieri, R.; Bellocchi, G.; Bregaglio, S.; Donatelli, M.; Acutis, M. Comparison of sensitivity analysis techniques: A case study with the rice model WARM. Ecol. Model. 2010, 221, 1897–1906. [Google Scholar] [CrossRef]
  50. Carvalho, C.G.P.; Cruz, C.D.; Viana, J.M.S.; Silva, D.J.H. Selection based on distances from ideotype. Crop Breed. Appl. Biotechnol. 2002, 2, 171–178. [Google Scholar] [CrossRef]
  51. Tesfaye, K.; Walker, S.; Tsubo, M. Radiation interception and radiation use efficiency of three grain legumes under water deficit conditions in a semi-arid environment. Eur. J. Agron. 2006, 25, 60–70. [Google Scholar] [CrossRef]
  52. Karimzadeh Soureshjani, H.; Nezami, A.; Kafi, M.; Tadayon, M. Responses of two common bean (Phaseolus vulgaris L.) genotypes to deficit irrigation. Agric. Water Manag. 2019, 213, 270–279. [Google Scholar] [CrossRef]
  53. Mercati, F.; Leone, M.; Lupini, A.; Sorgonà, A.; Bacchi, M.; Abenavoli, M.R.; Sunseri, F. Genetic diversity and population structure of a common bean (Phaseolus vulgaris L.) collection from Calabria (Italy). Genet. Resour. Crop Evol. 2013, 60, 839–852. [Google Scholar] [CrossRef]
  54. Campion, B.; Perrone, D.; Galasso, I.; Bollini, R. Common bean (Phaseolus vulgaris L.) lines devoid of major lectin proteins. Plant Breed. 2009, 128, 199–204. [Google Scholar] [CrossRef]
  55. Tardieu, F. Any trait or trait-related allele can confer drought tolerance: Just design the right drought scenario. J. Exp. Bot. 2012, 63, 25–31. [Google Scholar] [CrossRef] [Green Version]
  56. Farooq, M.; Nadeem, F.; Gogoi, N.; Ullah, A.; Alghamdi, S.S.; Nayyar, H.; Siddique, K.H.M. Heat stress in grain legumes during reproductive and grain-filling phases. Crop Pasture Sci. 2017, 68, 985–1005. [Google Scholar] [CrossRef]
  57. Barkley, A.; Peterson, H.H.; Shroyer, J. Wheat variety selection to maximize returns and minimize risk: An application of portfolio theory. J. Agric. Appl. Econ. 2010, 42, 39–55. [Google Scholar] [CrossRef] [Green Version]
  58. Berry, P.M.; Sylvester-Bradley, R.; Berry, S. Ideotype design for lodging-resistant wheat. Euphytica 2007, 154, 165–179. [Google Scholar] [CrossRef]
  59. Singh, P.; Nedumaran, S.; Traore, P.C.S.; Boote, K.J.; Rattunde, H.F.W.; Prasad, P.V.V.; Singh, N.P.; Srinivas, K.; Bantilan, M.C.S. Quantifying potential benefits of drought and heat tolerance in rainy season sorghum for adapting to climate change. Agric. For. Meteorol. 2014, 185, 37–48. [Google Scholar] [CrossRef] [Green Version]
  60. Boote, K.J.; Prasad, V.; Allen, L.H.; Singh, P.; Jones, J.W. Modeling sensitivity of grain yield to elevated temperature in the DSSAT crop models for peanut, soybean, dry bean, chickpea, sorghum, and millet. Eur. J. Agron. 2018, 100, 99–109. [Google Scholar] [CrossRef]
  61. Willocquet, L.; Savary, S.; McDonald, B.A.; Mikaberidze, A. A polyetic modelling framework for plant disease emergence. Plant Pathol. 2020, 69, 91045. [Google Scholar] [CrossRef]
Figure 1. The study area. The Emilia-Romagna region is highlighted in red. Map created using Natural Earth Data in QGIS (v. 3.10).
Agronomy 10 01733 g001
Figure 2. Characterization of the study area according to soil properties, climate features and management practices. (a) Soil zoning. Left panel: classification of soil texture. Fine and very fine: clay content >35% and sand content <65%; coarse: clay content <17.5% and sand content >65%; medium and medium-fine: all the remaining soils [27]. The classes very fine (VF) and fine (F) were combined together given the limited number of points in the VF class. The same criterion was used to combine the class medium (M) and medium-fine (MF). Right panel: final soil map. (b) Climate zoning. Maps of the Synthetic AgroMeteorological indicator (SAM; −1 to +1) calculated for each of the two main sowing periods (early sowing: 15th April; late sowing: 15th of May). (c) Final zonation.
Agronomy 10 01733 g002
Figure 3. Agreement between observed and simulated data for the calibration (a,b) and validation (c,d) datasets. Biomass refers to dry aboveground biomass (triangles), pod biomass (stars), and grain yield (circles). LAI: leaf area index. The solid line represents perfect agreement (1:1 line).
Agronomy 10 01733 g003
Figure 4. Variability observed among the 24 bean cultivars for the six functional traits considered: light extinction coefficient (a), radiation use efficiency (b), seed weight (c), plant height (d), thermal time to first pod (e), thermal time to maturity (f). See Table 1 for the Shapiro–Wilk normality test statistics.
Agronomy 10 01733 g004
Figure 5. Similarity indices for early sowings between the ideotypes defined for the different agro-climatic contexts and the functional trait profiles of the 24 varieties analyzed in this study. Green dots: varieties recommendable (difference in similarity index lower than 10% compared to the most similar to the ideotype); red dots: varieties less suitable (difference in similarity index larger than 20%).
Agronomy 10 01733 g005
Figure 6. Similarity indices for late sowings between the ideotypes defined for the different agro-climatic contexts and the functional trait profiles of the 24 varieties analyzed in this study. Green dots: varieties recommendable (difference in similarity index lower than 10% compared to the most similar to the ideotype); blue dots: second-choice varieties (difference in similarity index between 10% and 20%); red dots: varieties less suitable (difference in similarity index larger than 20%).
Agronomy 10 01733 g006
Table 1. Traits considered in the study, with corresponding STICS parameters and statistical distribution (mean ± standard deviation) derived from the characterization of 24 bean varieties. Results of the Shapiro–Wilk normality test are also shown.
ProcessTraitParameter (Acronym)UnitDistributionShapiro-Wilk Test
PhotosynthesisRadiation use efficiencyMaximum radiation use efficiency of the vegetative phase (efcroiveg)g MJ−1Normal
(2.2 ± 0.5)
W = 0.949,
p-value = 0.256
Yield formationSeed weightMaximum grain weight at 0% humidity (pgrainmaxi)gNormal
(0.46 ± 0.04)
W = 0.987,
p-value = 0.983
Canopy structurePlant heightMaximum plant height (hautmax)mNormal
(0.6 ± 0.09)
W = 0.921,
p-value = 0.062
Light extinction coefficientExtinction coefficient for solar radiation (extin)-Normal
(0.9 ± 0.05)
W = 0.912,
p-value = 0.039 a
Phenological developmentThermal time to first podCumulative thermal time from emergence to the onset of filling of harvested organs (stlevdrp)°C-dayNormal
(530 ± 52)
W = 0.955,
p-value = 0.349
Thermal time to maturityCumulative thermal time from beginning of harvested organs filling to maturity (stdrpmat)°C-dayNormal
(761 ± 80)
W = 0.973,
p-value = 0.752
a: slightly deviating from normality but considered as normal for sensitivity analysis given it deviated more from other distributions.
Table 2. Agreement between observed and simulated data for the calibration and validation phase. MAE (same units of the variable): mean absolute error (from 0 to +∞, optimum: 0); RRMSE (%): relative root mean square error (from 0 to + ∞, optimum: 0); EF (−): Nash and Sutcliffe modelling efficiency (from −∞ to 1, optimum: 1); CRM (−): coefficient of residual mass (from −∞ to +∞, optimum: 0); R2 (−): coefficient of determination (from 0 to 1, optimum: 1).
ActivityVariableMAERRMSEEFCRMR2
CalibrationLeaf area index (−)0.7029.80.380.040.68
Aboveground biomass (t ha−1)0.9121.40.930.010.99
Pod biomass (t ha−1)0.7342.60.77−0.350.94
Yield (t ha−1)0.4012.90.10−0.100.64
ValidationLeaf area index (−)0.8229.10.790.120.96
Aboveground Biomass (t ha−1)0.4013.00.960.030.98
Pod biomass (t ha−1)0.3829.60.93−0.090.95
Yield (t ha−1)0.328.40.31−0.040.69
Publisher’s Note: MDPI stays neutral with regard to jurisdictional claims in published maps and institutional affiliations.

