Directed interactions between auditory and superior temporal cortices and their role in sensory integration
1
Max Planck Institute for Biological Cybernetics, Tübingen, Germany
2
Division of Imaging Science and Biomedical Engineering, University of Manchester, Manchester, UK
Recent studies using functional imaging and electrophysiology demonstrate that processes related to sensory integration are not restricted to higher association cortices but already occur in early sensory cortices, such as primary auditory cortex. While anatomical studies suggest the superior temporal sulcus (STS) as likely source of visual input to auditory cortex, little evidence exists to support this notion at the functional level. Here we tested this hypothesis by simultaneously recording from sites in auditory cortex and STS in alert animals stimulated with dynamic naturalistic audio–visual scenes. Using Granger causality and directed transfer functions we first quantified causal interactions at the level of field potentials, and subsequently determined those frequency bands that show effective interactions, i.e. interactions that are relevant for influencing neuronal firing at the target site. We found that effective interactions from auditory cortex to STS prevail below 20 Hz, while interactions from STS to auditory cortex prevail above 20 Hz. In addition, we found that directed interactions from STS to auditory cortex make a significant contribution to multisensory influences in auditory cortex: Sites in auditory cortex showing multisensory enhancement received stronger feed-back from STS during audio–visual than during auditory stimulation, while sites with multisensory suppression received weaker feed-back. These findings suggest that beta frequencies might be important for inter-areal coupling in the temporal lobe and demonstrate that superior temporal regions indeed provide one major source of visual influences to auditory cortex.
Our brain integrates the information registered through the different sensory modalities into a coherent percept, based upon which we interact with our environment (Stein and Meredith, 1993
). This process of sensory integration has often been attributed to higher association cortices, such as regions in the superior temporal lobe. Support for this notion comes from anatomical studies demonstrating convergence of visual, auditory and somatosensory afferents in the upper bank of the superior temporal sulcus (STS; Cusick, 1997; Seltzer and Pandya, 1978; Seltzer et al., 1996), and electrophysiological recordings revealing neurons responding to stimulation of several modalities in the same regions (Barraclough et al., 2005
; Benevento et al., 1977
; Bruce et al., 1981
; Hikosaka et al., 1988
). Work in the last decade, however, has contrasted this picture and suggested that processes related to sensory integration might already occur in early sensory cortices (Ghazanfar and Schroeder, 2006
; Kayser and Logothetis, 2007
; Schroeder and Foxe, 2005
). In auditory cortex, for example, functional imaging studies revealed activation patterns conforming to the principles of sensory integration (Calvert et al., 1997
; Foxe et al., 2000
, 2002
; Kayser et al., 2005
, 2007b
; van Atteveldt et al., 2004
), and electrophysiological recordings revealed that neuronal responses to sounds can be modulated by visual or somatosensory stimuli (Bizley et al., 2006
; Ghazanfar et al., 2005
; Kayser et al., 2008
; Lakatos et al., 2007
; Schroeder and Foxe, 2002
). These findings of multisensory influences in primary and secondary auditory cortex naturally beg the question of whether they simply reflect multisensory feed-back from association areas such as the STS, or whether they constitute processes related to sensory integration occurring independently from those in association cortices (Driver and Noesselt, 2008
).
Anatomical studies revealed several putative sources of multisensory influences in auditory cortex. These include feed-forward projections from unspecific subcortical structures such as the pulvinar or multimodal thalamic nuclei, as well as feed-back projections from superior-temporal or prefrontal regions (Bizley et al., 2006
; Cappe and Barone, 2005
; Hackett et al., 1999
, 2007
; Romanski et al., 1999
; Smiley et al., 2007
). However, anatomical studies cannot reveal the functional impact of individual projections, and hence cannot resolve whether multisensory influences in auditory cortex simply reflect multisensory feed-back from association cortices (e.g. STS), or whether they are mediated by feed-forward afferents from early sensory or subcortical regions, or both. As a result, functional methods assessing the mutual causal influences between auditory cortex and putative sources of multisensory input are required. For example, two recent studies quantified interactions between auditory cortex and STS using simultaneous electrophysiological recordings and promoted the notion that the STS might indeed serve as a major source of multisensory input to auditory cortex (Ghazanfar et al., 2008
; Maier et al., 2008
). While these studies focused only on high frequency oscillations as a measure of linear coupling, where here test this hypothesis systematically using measures of directed and causal interactions.
To quantify directed interactions between auditory cortex and STS we relied on the combination of multi-electrode recordings of continuous neuronal activity (field potentials) with structural measures of directed interactions (Bernasconi et al., 2000
; Cadotte et al., 2008
; Ding et al., 2000
; Liang et al., 2000
; Salazar et al., 2004
). Measurements of field potentials provide a continuous trace of neural activity at the mesoscopic scale, which constitutes a ‘middle ground’ linking the local microcircuitry and synaptic input to the spiking activity of single neurons. Importantly, local field potentials quantify oscillatory patterns of neural activity, which are considered one mechanism underlying the communication of distant groups of neurons (Abeles et al., 1994
; Fries et al., 2007
; Laughlin and Sejnowski, 2003
). Indeed, the responses of individual neurons are often precisely locked to oscillatory activity, and the coupling of brain rhythms in distant regions can provide insights into the causal interactions between these regions (Bressler et al., 2007
; Chen et al., 2006
; Womelsdorf et al., 2007
; Sehatpour, 2008
). Structural measures of directed interactions such as Granger causality or the directed transfer function (DTF) provide a principled approach to quantify this coupling, and allow insights into the contribution of individual rhythms to this coupling (Baccala and Sameshima, 2001
; Dhamala et al., 2008a
; Ding et al., 2000
; Kaminski et al., 2001
). In addition, oscillatory patterns of activity not only play a role in inter-areal communication, but also underlie processes related to multisensory integration. For example, visual or somatosensory influences in auditory cortex are mediated by low frequency oscillations that control the excitability of individual neurons (Kayser et al., 2008
; Lakatos et al., 2007
), while faster oscillations have been implicated in multisensory integration in the STS (Chandrasekaran and Ghazanfar, 2008
). This suggests that analyzing oscillatory components of neuronal activity provides a fruitful approach to quantify interactions between auditory cortex and STS and their relation to multisensory integration (Campanella and Belin, 2007
).
In the present study we applied methods of structural analysis to simultaneous recordings of field potentials and multi-unit activity in auditory and superior temporal cortices of alert macaque monkeys watching naturalistic dynamic audio–visual scenes. Our results demonstrate that feed-back from STS to auditory cortex indeed plays a significant role in shaping the neuronal spiking responses to multisensory stimuli in auditory cortex.
Electrophysiological Recording Procedures
Three adult rhesus monkeys (Macaca mulatta) participated in these experiments. All procedures were approved by local authorities (Regierungspräsidium) and were in compliance with the guidelines of the European Community (EUVD 86/609/EEC) for the care and use of laboratory animals. A detailed description of recording procedures and sensory stimulation protocols can be found in previous publications (Kayser et al., 2007a
, 2008
). Prior to the experiments, form-fitting head posts and recording chambers were implanted during an aseptic and sterile surgical procedure. The chambers were positioned based on pre-operative magnetic resonance images (MRI) and stereotaxic coordinates (AP + 3 mm, ML + 21 mm for animals M1 and M2, and AP + 8 mm, ML + 24 for animal M3) allowing vertical access to auditory cortex and the STS. A custom-made multi-electrode system was used to lower up to six microelectrodes (FHC Inc., Bowdoinham, Maine, USA; 2–8 MOhm impedance) through a grid placed on the recording chamber to either auditory cortex, the STS upper bank or the superior temporal gyrus. Signals were amplified with respect to a reference in the recording chamber using a custom modified Alpha Omega amplifier system (Alpha Omega GmbH, Ubstadt-Weiher, Germany), filtered between 4 Hz and 10 kHz (4-point Butterworth filter) and digitized at 20.83 kHz. Recordings were performed in a darkened and anechoic booth (Illtec, Illbruck acoustic GmbH, Germany), while the animals performed a visual fixation task for juice rewards (2.5° fixation window). Trials consisted of a 500 ms baseline period, a 1000–1200 ms stimulation period and a 300 ms post-stimulus baseline. To avoid entrainment of cortical rhythms to the stimulus sequence, inter trial intervals were jittered.
Audio–visual stimuli consisted of 16 different naturalistic scenes, with the sound matching the content of the movie. These stimuli included four stimuli showing close-ups of conspecific vocalizing animals (two coos, one grunt and one lip-smack); other monkeys making noises in a natural habitat but not vocalizing (chimps, gorillas); different animals in natural settings (lion, birds and elephant); and artificial stimuli such as cartoon movies or audio–visual pink noise. Figure 1
A displays the general experimental paradigm and example frames from these stimuli. In the present analysis no distinction was made between individual stimuli and data from all stimuli was analyzed together; partly this was necessary to accumulate sufficient data points for robust AR modeling (see below). Auditory only, visual only or combined audio–visual stimuli were presented in random order. Sounds were stored as WAV files and delivered from two free field speakers (JBL Professional, Northridge, CA, USA), positioned at ear level 70 cm from the head and 50° to the left and right (average intensity 65 dB SPL). Visual stimuli were presented on a 21 inch gamma-corrected monitor at a distance of 97 cm from the animal and covered a visual field of 24 × 18 degrees.
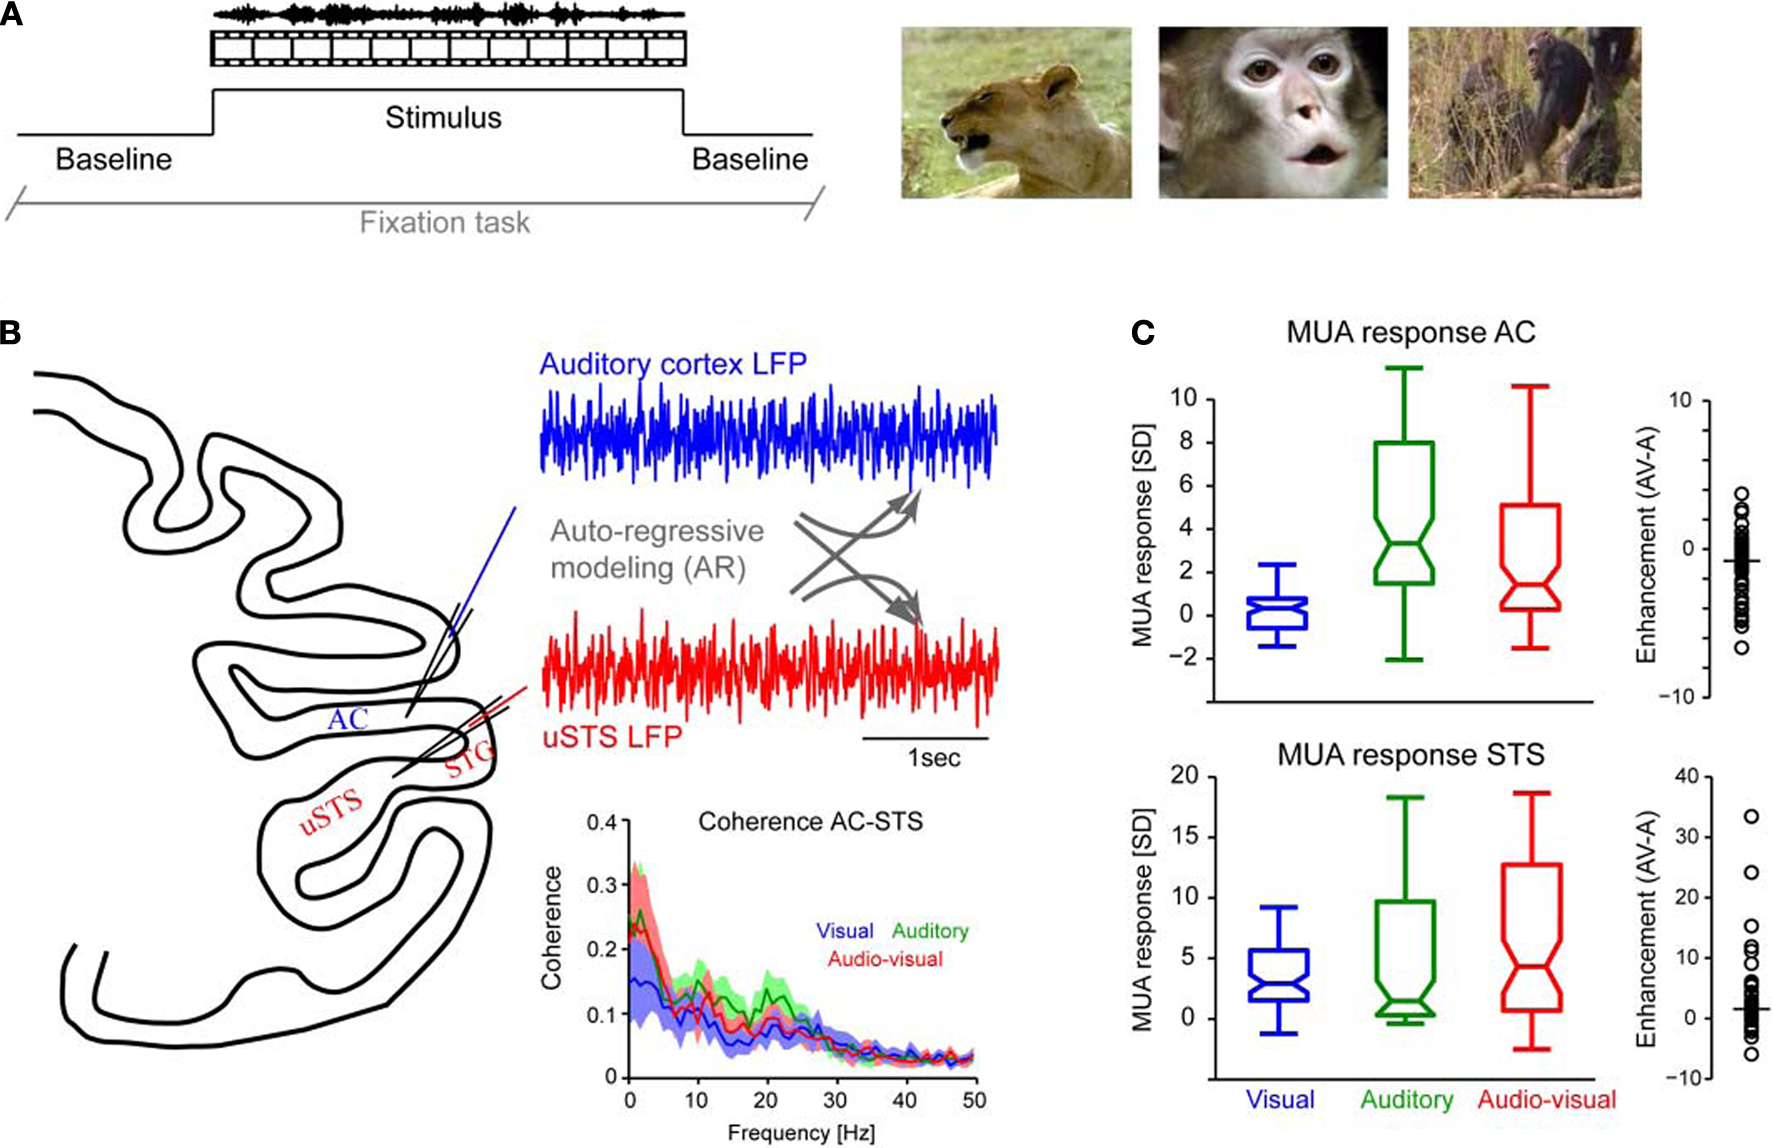
Figure 1. Experimental paradigm and multi-unit responses. (A) Auditory, visual or audio–visual stimuli were presented interleaved with baseline intervals and while animals performed a visual fixation task. The right panels display example frames from the stimulus set (left: lion roaring, middle: conspecific animal vocalizing, right: chimps making noises). (B) Neuronal responses were simultaneously recorded in auditory cortex (AC) and the upper bank of the superior temporal sulcus (uSTS) or the STG. Auto-regressive models were fit to these data to obtain measures of directed interactions. The lower-right panel displays the coherence between recordings in AC and STS for the three stimulation conditions (median and 25th and 75th percentile across sites). (C) Distribution of multi-unit (MUA) responses in both regions to the three different conditions. Boxplots indicate the median (middle horizontal line) the 25th and 75th percentile (box) and data range (whiskers). The right panels display the enhancement index for each unit (circle) and the median value across units (bar). The enhancement index characterizes the sign and strength of multisensory interaction and is defined by the comparison of bi-modal and maximal uni-modal responses [AV max(A,V)]. In auditory cortex, most units show a reduced response during audio–visual stimulation, while in the STS most sites show an enhanced response.
Identification of Recording Sites
Recording sites in auditory cortex were assigned to the auditory core (primary auditory cortex) and auditory belt regions based on pre- and post-operative MR images, frequency maps constructed for each animal and the responsiveness for tone vs. band-passed stimuli. Most of our recording sites were located in the caudal portions of primary auditory cortex (mainly fields R and A1) and in the caudal belt (fields CM and CL). Sites in the auditory cortex were distinguished from deeper recording sites in the upper bank STS (uSTS) using the depth of the electrodes, the occurrence of several millimeters of white matter between auditory cortex and STS, the longer response latency in the STS and the prominence of visual responses in the STS. Additional recording sites more lateral and slightly deeper than the auditory belt, not responding to simple acoustic stimuli, were judged as being on the superior temporal gyrus (STG) and were grouped with uSTS sites for the present analysis.
Data Analysis
All data were analyzed in Matlab (Mathworks Inc., Natick, MA, USA) using custom-written programs.
Signal extraction
The spike-sorted activity of single neurons and multi-unit clusters was extracted using commercial spike-sorting software (Plexon Offline Sorter, Plexon Inc., Dallas, USA) after high-pass filtering the raw signal at 500 Hz. Spike times were saved at a resolution of 1 ms. For the present analysis we did not distinguish single and multi-unit clusters. Sites with significant sensory responses were detected as those where the (trial-averaged) response during sensory stimulation exceeded 3 SD of its baseline variability during at least a 30 ms period (anywhere during stimulus presentation). The local field potential, the raw signal obtained from each electrode referenced to a common ground, was obtained by low-pass filtering and resampling the raw data at 100 Hz (third-order Butterworth filter).
The data from individual channels and trials was normalized to 0 mean and unit variance to facilitate the estimation of auto-regressive models. To estimate directed causal interactions, we analyzed only data obtained during the sensory stimulation period. Importantly, we also excluded the first 350 ms following stimulus onset to avoid effects induced by potentially large transients (evoked potentials) induced by the abrupt stimulus onset.
Multisensory influences
Following previous studies we quantified the impact of visual stimuli on responses in auditory cortex using the so called enhancement index (Kayser et al., 2008
; Stein and Meredith, 1993
). This index is defined as the difference of the responses to audio–visual minus the response to the maximal unisensory condition: enhancement = AV − max(A,V). In auditory cortex the maximal unisensory response always occurred in the auditory condition, and the enhancement index reduces to comparing auditory and audio–visual responses. In the STS regions, the maximal response could occur in either unisensory condition. If a neuron’s response is enhanced in the multisensory condition, this index will be positive, while if a neuron’s response is reduced this index will be negative.
Analysis of directed interactions
The analysis of directed interactions between simultaneously recorded traces of neuronal activity is based on the concepts of Wiener–Granger causality (Geweke, 1982
; Granger, 1963
, 1969
) and DTFs (Baccala and Sameshima, 2001
; Eichler, 2006
; Geweke, 1982
; Kaminski et al., 2001
) applied to autoregressive (AR) models of the data. Both methods are closely related and allow an assessment of the strength of directed information flow in multivariate signals.
A brief description of the conceptual and mathematical aspects of the Wiener–Granger causality the DTF and the AR models is given below. The methods were applied as follows: For each pair of local field potential time series (one from auditory cortex, one from the STS region) and for each stimulus condition (auditory, visual, audio–visual), we concatenated the data recorded during sensory stimulation of all trials that obeyed the Gaussian and stationarity criteria to yield two long time series. Importantly, in this process the first 350 ms following stimulus onset were omitted, to avoid unidirectional responses arising from the stimulus-onset related transient response, and data from each trial was normalized to 0 mean and unit variance. For these (long) time series we estimated bi-variate and uni-variate AR models of order p = 6 (see below). From the resulting noise residuals (Eqs 1 and 2 below) and their covariance’s (Eqs 3 and 4) we computed the indices of Granger causality (Eq. 5). The DTF was obtained from the bi-variate model and the related transfer function (Eqs 6 and 7). For further analysis, we then excluded those site pairs for which the resulting bi-variate AR model was structurally unstable for any of the three sensory stimulation conditions. This resulted in a set of 120 pairs of sites (pooled across all three animals) that fulfilled all criteria necessary for accurate AR modeling and at which neuronal spiking activity responded significantly to auditory, visual or combined stimulation.
The concept of Wiener–Granger causality is based on the intuitive notion that causes always precede their effects in time: hence, if one time series Y causes another time series X, knowledge of Y should improve the prediction of future values of X. This idea can be formalized in the context of multivariate AR models. Let X(t) and Y(t) be two time series; a p-th order AR model expresses X(t) and Y(t) as a linear combination of their past values, plus zero mean uncorrelated white noise process ε(t) and η(t):
with Ax(j) and Ay(j) being the model weights.
Alternatively, and crucial to study causal interactions, X(t) and Y(t) can also be expressed as bivariate models based on their own and the past values of the other time series:
Here Axx(j) denote the model coefficients linking X to its own past values and Axy(j) the model coefficients describing the influence of Y on X. The concept of Wiener–Granger causality now reduces to comparing the prediction performance of models (1) and (2): if time series Y has a Wiener–causal effect on time series X, then the prediction of X in model (2) should be better compared to the prediction in model (1); since the bivariate model incorporates this driving input and the univariate model does not. Mathematically, this can be formalized using the covariance of the residuals in the AR models: let

be the noise covariance of the uni-variate models for X and Y, and let
be the noise covariance of the bi-variate model. Based on Granger’s formulation one can conclude that Y has a causal influence on X if Σ2 is less than Σ1. However, if X and Y are independent then Axy would be uniformly 0 and Σ2 = Σ1. Statistically, this measure of dependence can be expressed using the log-ratios (|.| denotes the matrix determinant):

where FY→X quantifies the directed interaction of Y on X, while FX→Y describes the directed interaction from X on Y. In addition, FX*Y quantifies any interaction between these time series not explained by either of the two directed interactions, such as exogenous influences driving both time series (also known as instantaneous interactions).
Whether a computed interaction coefficient is significantly different from 0 can be assessed by comparing the coefficient to a chi-square distribution: Under the assumption that the noise processes are all independent and identically distributed, one can show that if FY→X = 0, then n · FY→X ∼ χ2(p), with n being the number of effective time points in the series and p being the order of the AR model (Geweke, 1982
).
The concept of DTF provides a description of directed interactions in the frequency domain and hence provides a link between causal interactions and individual frequency bands of oscillatory activity (Ding et al., 2000
; Eichler, 2006
; Sameshima and Baccala, 1999
). It should be noted that for bi-variate (N = 2) time series the DTF provides a frequency decomposition of Granger causality, while for higher dimensional multivariate models the DTF provides a slightly different interpretation (Eichler, 2006
).
Here we computed the DTF directly from a spectral representation of the AR coefficients:

where p denotes the order of the AR model, i the imaginary unit and Āxy(f) is the model coefficient from Y to X at frequency f. The model transfer function was obtained by matrix inversion:

where I denotes the identity matrix. The power of the transfer function |Hxy(f)|2 provides the value of the DTF from Y to X at frequency f (Eichler, 2006
; Kaminski, 2005
; Kaminski et al., 2001
).
Model estimation
Practically, we applied these concepts of directed interactions to pairs of simultaneously recorded field potentials from auditory cortex and the STS region. For the results reported in this study, field potentials were sampled with a precision of 10 ms. Previous tests using different sampling rates revealed this resolution to be optimal for AR modeling of the present data. In order for the AR models to be a valid representation of the actual data, the data time series needs to fulfill several criteria, which we assessed using previously established procedures (Ding et al., 2000
; Salazar et al., 2004
): the time series must be (i) stationary, (ii) follow a Gaussian distribution and (iii) the resulting AR model must be structurally stable. To ensure requirements (i) and (ii), we used for each pair of sites and sensory stimulation condition only those trials for which the data in both time series did not differ significantly from a Gaussian distribution (Kolmogorov–Smirnov test, p > 0.05), and for which the distribution of data values in the first and second half of the trial did not differ (indicating stationarity, Kolmogorov–Smirnov test, p > 0.05). Across pairs of sites this resulted in the inclusion of 39 ± 13 trials per pair and condition (mean ± SD); this corresponds to an average of 2535 time points which were used to estimate the AR models. Structural stability (point iii) was later ensured by analyzing on pairs of recording sites for which the final AR model had only negative eigenvalues. AR models were estimated using the ARFit Toolbox for Matlab (Neumaier and Schneider, 2001
; Schneider and Neumaier, 2001
).
As a next step we determined the optimal order p of the AR model. For each pair of sites we fit bi-variate AR models of different orders and used the Akaike Information criterion (AIC) to determine the optimal order (Akaike, 1974
; Cadotte et al., 2008
; Salazar et al., 2004
):
where T denotes the length of the time series and N is the number of time series (N = 2 here). The Akaike Information provides a tradeoff between the accuracy of model prediction and an increasing model order. For the present data we found orders in the range of 5–8 to be optimal (6.5 ± 1.2 mean ± SD). As a result, we employed a model order of p = 6 throughout this study for all pairs of sites and stimulation conditions.
Notation
Throughout the manuscript indices denote the site or direction of a particular quantity: for example, MUASTS denotes multi-unit activity at the STS site, while DTFAC→STS denotes the DTF from auditory cortex to STS.
We simultaneously recorded neuronal activity from sites in auditory cortex and the upper bank of the superior temporal region (Figures 1
A,B). Sites in auditory cortex included primary and secondary auditory cortex and sites in the STS included the upper bank of the sulcus (uSTS) and sites more lateral and on the gyrus (STG). From each electrode we obtained MUA activity and local field potentials in response to naturalistic and dynamic auditory, visual and audio–visual stimuli. Using auto-regressive models and measures of directed causal interactions we quantified the interactions between auditory and STS sites and investigated the dependency of these interactions on sensory stimulation condition and their relation to multisensory integration. Especially we asked whether feed-back from the STS to auditory cortex can be responsible for multisensory influences seen in auditory cortex. Please note that we use the terms feed-forward and feed-back here to simply denote the direction of interaction from and to auditory cortex. We do not implicate that such functional interactions are indeed mediated by connections that would anatomically be characterized as feed-back synapses, although there is good evidence that projections from STS to auditory cortex indeed follow the classical feed-back pattern (Cappe and Barone, 2005
).
Multi-Unit Responses in Auditory Cortex and STS
Across sites, multi-unit (MUA) sites in auditory cortex responded to auditory and audio–visual stimuli but not to visual stimuli alone (Figures 1
B,C top panel). The MUA response to visual stimuli (median 0.1 SD above baseline) was not significantly different from 0 (sign-rank test p = 0.6), while the responses to auditory (median 2.7 SD) and audio–visual stimuli (median 1.6 SD) were highly significant (sign-rank tests, p < 10−12 and p < 10−9). Noteworthy, and confirming the notion of early multisensory influences in auditory cortex, the MUA responses in the auditory and audio–visual conditions differed significantly (p < 0.01). In fact, for most of the sites the audio–visual response was reduced compared to the auditory response, resulting in a negative enhancement index (right panel Figure 1
C, top-panel). This demonstrates that neuronal responses to acoustic stimuli in auditory cortex can be modulated by the simultaneous presentation of visual stimuli, in agreement with previous findings (Bizley et al., 2006
; Ghazanfar et al., 2005
; Kayser et al., 2008
). The question addressed in the following is whether feed-back from STS could be responsible for this visual influence.
Multi-unit responses in the STS differed considerably from those in auditory cortex (Figure 1
C, bottom-panel). First, responses were significant for all three sensory conditions (median values for visual, auditory and audio–visual: 2.7, 1.4 and 4.2 SD; sign-rank tests vs. 0, at least p < 10−10). Second, responses to auditory and visual stimuli did not differ (p = 0.2), but both were significantly lower than responses to audio–visual stimuli (p < 0.01). This characterizes the STS region as a multisensory region, responding both to auditory and visual stimuli and showing considerable response enhancement to multisensory stimuli. This multisensory character, as well as the known anatomical projections from the STS regions to auditory cortex, suggests that this region might play an important role in mediating multisensory influences in auditory cortex (Ghazanfar et al., 2008
).
Field Potentials and Measures of Interactions
The most basic measure to study interactions between simultaneously recorded neuronal activities is the signals’ coherence. The coherence quantifies how much individual frequency components in both time series obey a particular phase relationship, regardless of their total amplitude, and hence provides a correlation like measure in the frequency domain. For our dataset we found that coherence peaked for the lowest frequency bands (below 8 Hz) and gradually decreased towards higher frequencies (Figure 1
B). Overall, coherence was weakest in the visual condition and strongest in the auditory condition. However, since coherence is a bidirectional measure, these observations only foster the conclusion that directed interactions between auditory cortex and STS exist, but they do not provide a separate quantification of feed-forward or feed-back interactions.
A directed measure of causal interactions is provided by the Granger causality. This index quantifies the strength of directed interactions between two time series across the entire range of frequency bands using a single number. Of the 120 pairs of sites (pooled from three animals) in our dataset, 76 pairs (63%) showed significant (χ2 test, p < 0.01) directed interactions in at least one direction during multisensory stimulation. Since we are interested in the strength and stimulus dependence of these interactions, we restricted the following analysis to this subset of sites. The distribution of Granger causality index of these sites is shown in Figure 2
A. Comparing the Granger index across directions and stimulation conditions revealed a significant effect of condition (Scheirer-Hare’s non-parametric ANOVA, F2,455 = 9.2 p < 0.01) but no overall effect of direction (F1,455 = 0.01, p = 0.99) and no interaction (F2,455 = 0.3, p = 0.83). Further comparisons between conditions revealed stronger interactions in the auditory than in the audio–visual or visual conditions (pair-wise sign-rank tests, at least p < 0.05). These results demonstrate that significant directed interactions between local field potentials in auditory cortex and STS regions exist and are modulated in a stimulus dependent manner. In the following, we exploit a spectral decomposition to reveal the contribution of individual frequency bands to these interactions.
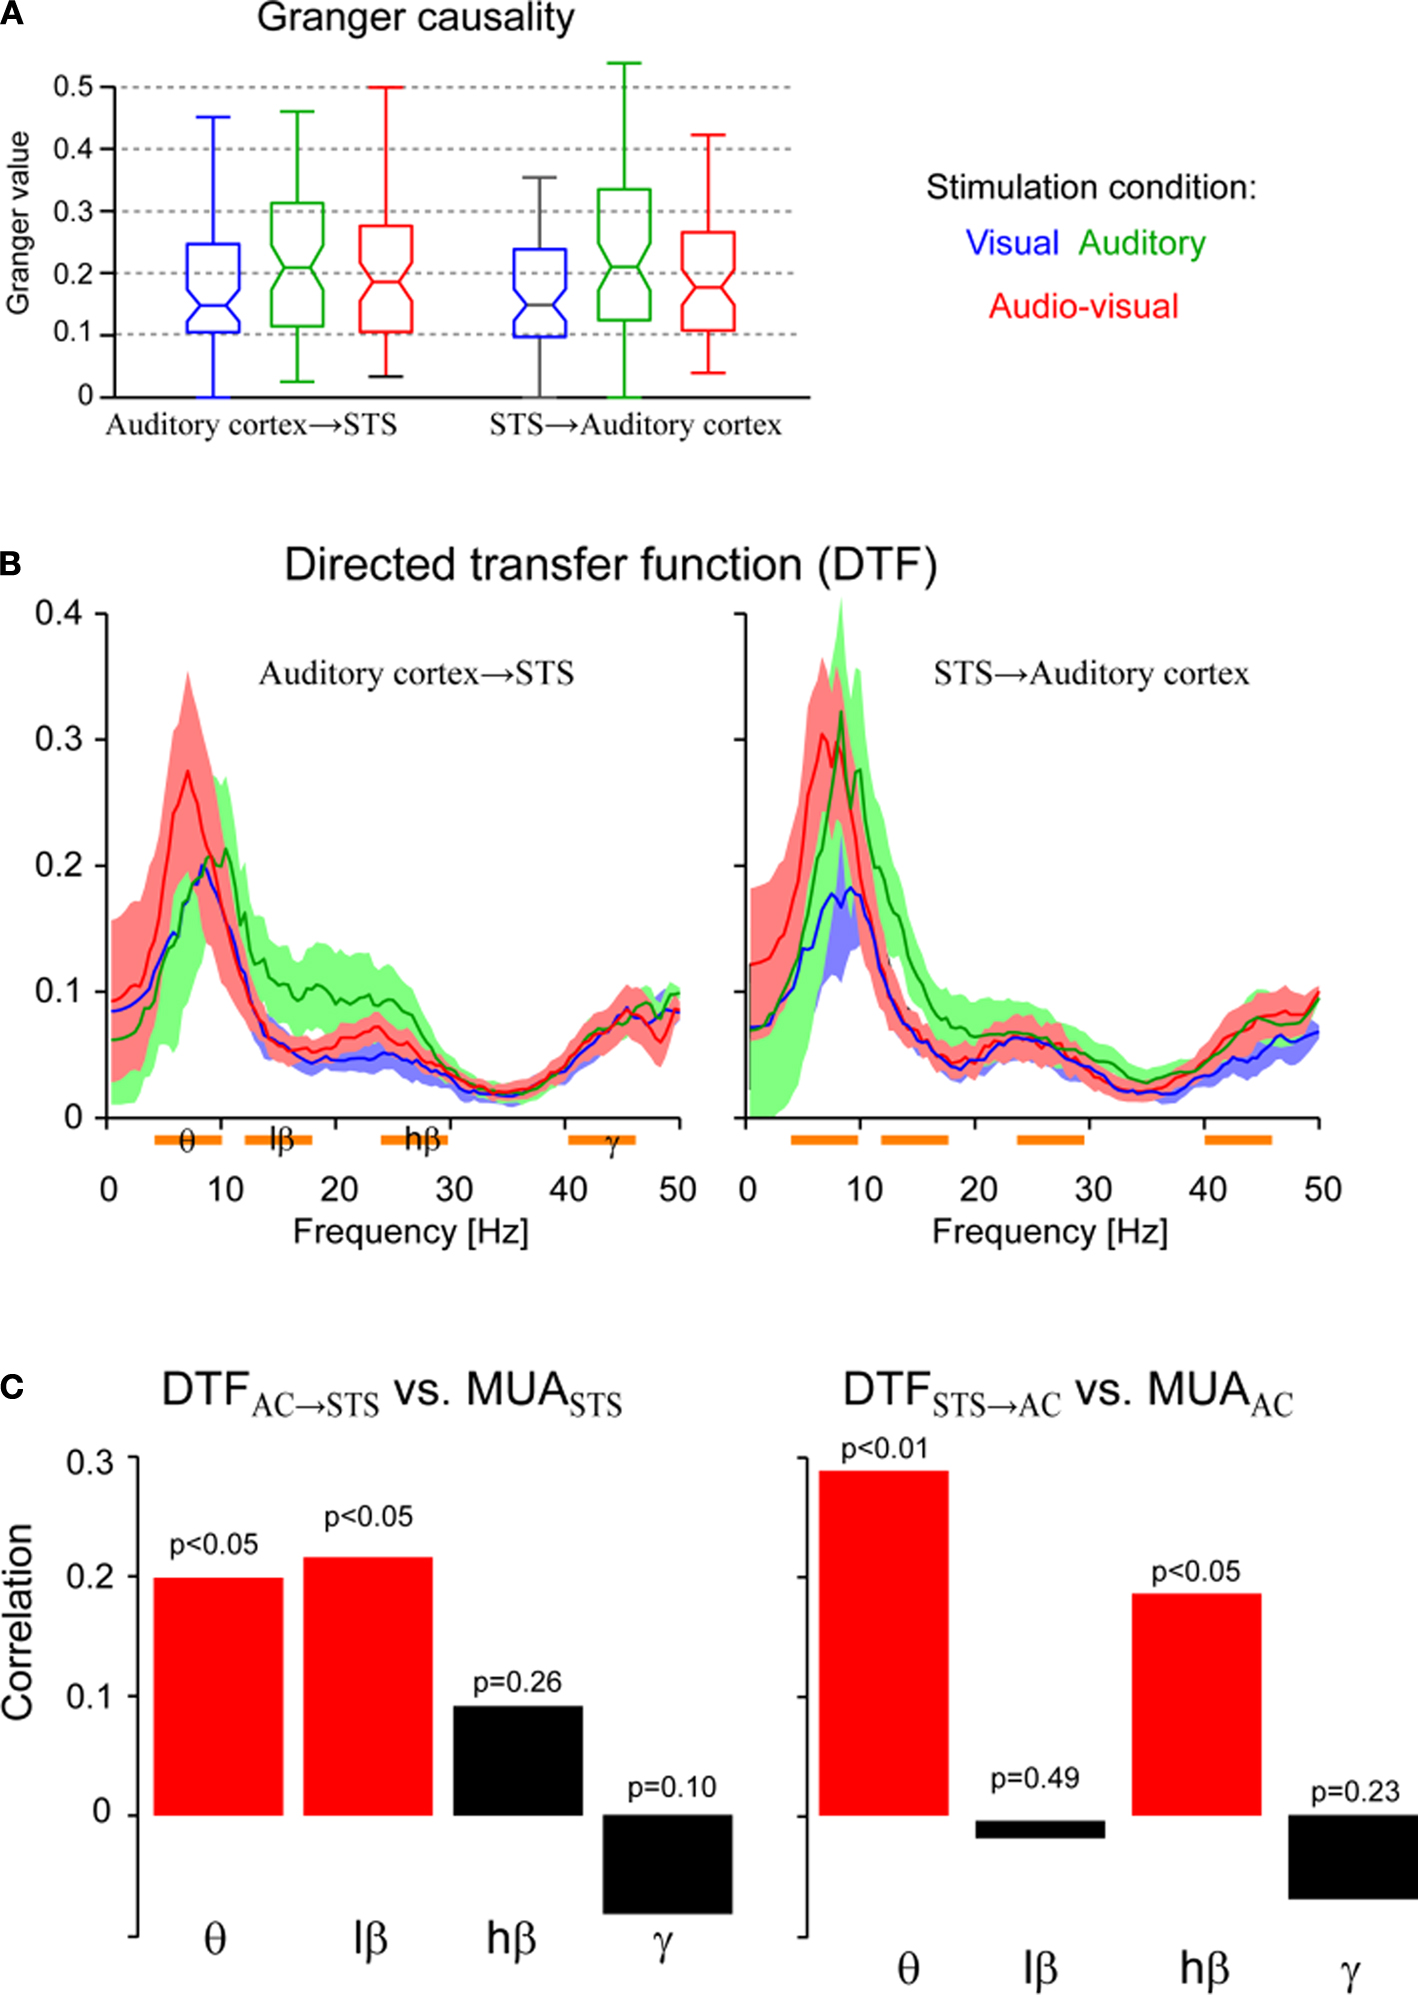
Figure 2. Directed interactions. (A) Distribution of Granger causality index across sites for each stimulation condition and both directions of interactions. Boxplots indicate the median (middle horizontal line) the 25th and 75th percentile (box) and data range (whiskers). (B) Directed transfer function for each stimulation condition and both directions of interactions (median and 25th and 75th percentiles). The DTF characterizes the strength of directed interactions in the frequency domain. Orange bars below the frequency axis indicate individual frequency bands used for further analysis. (C) Correlation between the strength of DTF and MUA at the target site. The correlation was computed across all pairs of sites and is show separately for individual frequency bands. Significant correlations are shown in red, insignificant in black. p-values are indicated. Significant correlations indicate that directed interactions in the respective frequency band have a ‘driving’ and influential role for MUA at the target site.
The DTF provides such a spectral decomposition of the Granger causality (Figure 2
B). This decomposition revealed that directed interactions were strongest at low frequencies (4–10 Hz), for all stimulation conditions and both directions. Higher frequency bands (10–30Hz) exhibited weaker interactions, but revealed a dominance of interactions in the auditory condition, in agreement with the above result from the Granger index. In the gamma band (>40 Hz) the strength of interactions again increased slightly. Importantly, directed interactions in all frequency bands were significantly stronger than interactions obtained from a bootstrap test using a dataset in which one time series was randomly shifted against the other (p < 0.01). To better quantify the differences between frequency bands, directions and stimulation conditions, we used these observations to divide the frequency axis into four bands of interest: the theta band (θ: 4–10 Hz), a low beta band (lβ: 12–18 Hz), a high beta band (hβ: 24–30 Hz) and a gamma band (γ: 40–46 Hz). These choices were made following conventional definitions of the theta and beta bands (Buzsaki, 2006
), but separating low and high beta regimes and ensuring a constant width of these bands. The gamma band was chosen only above 40 Hz, since between 30 and 40 Hz all interactions (DTFs) showed a dip, indicating that the range between 30 and 40 Hz is least relevant in the present setting.
A non-parametric ANOVA revealed an effect of stimulus (F2,1823 = 11, p < 0.001), no effect of direction (F1,1823 = 0.005, p = 0.94), and an effect of frequency band (F3,1823 = 84, p < 10−7). In addition, the interaction between frequency band and stimulus was significant (F6,1823 = 4.0, p < 0.001), while the other interactions were not (p > 0.25). This demonstrates that directed interactions vary significantly between frequency bands and stimulation conditions. In the following we establish a relation between these interactions and the underlying spiking activity in order to select those frequency bands that seem directly relevant for driving neuronal spiking activity, and hence likely constitute ‘effective’ interactions.
‘Effective’ Interactions and their Relation to Spiking Activity
The above results demonstrate the existence of directed causal interactions between auditory cortex and STS at the level of rhythmic activity indexed by field potentials. Although the firing of individual neurons often bears a particular relation to such rhythmic activity, it is a priori not clear for which of the frequency bands this is the case in the present setting. As a result, we asked which of the interactions, i.e. which frequency band, has a likely impact on neuronal firing at the target site (here termed ‘effective’ interactions). To this end we tested whether the DTF in a given frequency band correlates with the strength of the MUA at the target site; for example, whether the amplitude of DTFAC→STS correlates with MUASTS. Such correlations were computed across all 76 pairs of sites using the DTF and MUA obtained during audio–visual stimulation. Figure 2
C displays the resulting correlations for both directions and each of the four frequency bands: Directed interactions from auditory cortex to STS correlated significantly with the MUASTS activity in the theta (r = 0.19, p < 0.05) and low beta bands (r = 0.21, p < 0.05). In contrast, interactions from STS to auditory cortex correlated significantly with MUAAC in the theta (r = 0.28, p < 0.01) and high beta bands (r = 0.18, p < 0.05). These correlations were computed during bimodal stimulation, but similar results were also obtained during unimodal auditory stimulation. In addition, correlations of the DTF and the strength of the MUA at the source site, reached significance only for the theta band (DTFAC→STS with MUAAC: r = 0.25, p < 0.05 and DTFSTS→AC with MUASTS: r = 0.43, p < 0.01).
This result provides an important link between the directed causal interactions estimated from field potentials and neuronal spiking activity. Interactions derived from the DTF in specific frequency bands correlate with firing rates at the target site, suggesting that they characterize interactions that are indeed effective in shaping neuronal responses. Such effective interactions occur bi-directional in the theta band, and uni-directional in the low (from auditory cortex to STS) and high (from STS to auditory cortex) beta bands. Noteworthy, interactions in the gamma band do not seem to relate to neuronal firing rates in the present setting. This finding paves the way to our final question: whether effective feed-back from STS to auditory cortex plays a role in mediating multisensory influences in auditory cortex.
STS Feed-Back to Auditory Cortex and Multisensory Influences
To determine whether feed-back from STS is related to the multisensory integration in auditory cortex (c.f. Figure 1
B), we compared directed interactions and MUA responses using the same index of multisensory influence. For both quantities we computed the enhancement index, which is defined as the difference between the MUA responses (or DTF) in audio–visual minus auditory conditions. We reasoned that if directed interactions from STS to auditory cortex contribute to multisensory influences in auditory cortex, there should be a significant correlation between both indices. In addition, we expected this correlation to occur especially in the ‘effective’ frequency bands.
Computing the correlation of both indices across all pairs of sites indeed confirmed these expectations (Figure 3
A). Correlations between the enhancement index of DTFSTS→AC and MUAAC were significant in the high beta band (r = 0.23, p < 0.05), but not in other frequency bands. The implications of this correlation are visualized in Figure 3
B: sites in auditory cortex at which MUA responses to auditory stimuli are enhanced by visual stimuli (MUAaudio–visual > MUAaudio) also receive an increased feed-back from STS during audio–visual stimulation (black graphs). Sites in auditory cortex where responses to auditory stimuli are reduced by visual stimuli (MUAaudio–visual < MUAaudio), in contrast, receive a reduced feed-back from STS (red graphs). Figure 3
C further exemplifies this finding at the level of two individual sites in auditory cortex and their respective feed-back from STS. In the upper example the MUA response is enhanced in the audio–visual condition, as is the feed-back. In the lower example, both MUA response and feed-back are reduced in the audio–visual condition. Overall, this demonstrates that the strength of directed interactions from STS to auditory cortex in the high beta band has a causal and significant impact on the modulation of auditory MUA responses by visual stimuli.

Figure 3. Directed interactions and multisensory influences. (A) Correlation of the multisensory enhancement in feed-back interaction from STS to auditory cortex and in MUA activity in auditory cortex. The correlation was computed based on the enhancement index applied to the DTF and multi-unit activity and across all pairs of sites. Significant correlations are shown in red, insignificant in black. p-values are indicated. Significant correlations indicate that enhanced (reduced) MUA in the audio–visual condition co-occurs with enhanced (reduced) feed-back from STS. (B) Displays the average DTF (low beta band) from STS to auditory cortex and MUA in auditory cortex separately for sites where the MUA shows multisensory enhancement (black) or suppression (red). (C) Example data showing the MUA and DTF for two pairs of sites. In the upper example the MUA activity is enhanced, in the lower it is reduced.
We also investigated whether a similar relation holds between the MUA activity in STS and the strength of feed-forward interactions from auditory cortex to STS. While the correlation between the enhancement indices of MUASTS and DTFAC→STS was strongest in the low beta band, the correlation did not reach significance (r = 0.12, p = 0.19). Separating sites with multisensory enhancement or suppression, as above, revealed that for both groups the DTFAC→STS was reduced in the bimodal compared to the unimodal condition. As a result, the difference in sign of the DTF in auditory and audio–visual conditions cannot account for the difference in sign of the MUA responses. This suggests that while interactions from auditory cortex to STS have a causal relation to the MUA activity (c.f. Figure 2
C), these interactions are not the only, or the most dominating source shaping multisensory integration in superior temporal regions. Other afferent sources to the STS, for example from other visual or multisensory regions (Cusick, 1997
; Seltzer and Pandya, 1978
; Seltzer et al., 1996
), likely make important contributions to the MUA activity in this region as well.
Recent work demonstrates that processes related to sensory integration are not restricted to higher association cortices, but might already occur at the level of early sensory cortices (Calvert, 2001
; Ghazanfar and Schroeder, 2006
; Kayser and Logothetis, 2007
; Schroeder and Foxe, 2005
). Especially in auditory cortex it has been shown that responses to acoustic stimuli can be enhanced or reduced by the simultaneous presentation of visual or somatosensory stimuli (Bizley et al., 2006
; Ghazanfar et al., 2005
; Kayser et al., 2008
; Lakatos et al., 2007
). While anatomical studies suggest regions in the STS as a likely source of visual input to auditory cortex (Bizley et al., 2006
; Budinger et al., 2006
; Cappe and Barone, 2005
; Hackett et al., 1998
; Padberg et al., 2003
; Smiley et al., 2007
), little evidence exists at the functional level to support this notion (Ghazanfar et al., 2008
). Here we tested this hypothesis by performing simultaneous recordings from auditory cortex and STS in alert animals stimulated with naturalistic audio–visual scenes and using advanced methods of causal time series analysis.
Building on the methods of Granger causality and DTFs we made two important findings: First, so called ‘effective’ interactions, which correlate with the MUA activity at the target site, occur in different frequency bands: While apparent interactions in the theta band occur bi-directional, interactions from auditory cortex to STS prevailed in the low beta band while interactions from STS to auditory cortex dominate in the high beta band. This suggests that directed causal interactions between auditory and superior temporal regions occur in complementary frequency bands. Second, modulation of directed interactions from STS to auditory cortex in the high beta band by visual or auditory stimuli correlated significantly with the multisensory enhancement of MUA in auditory cortex: auditory cortex sites showing multisensory enhancement received stronger feed-back from STS during audio–visual stimulation than during auditory stimulation, while sites showing multisensory suppression received weaker feed-back during audio–visual stimulation. This relation between directed effective interactions and multisensory enhancement at the level of MUA activity demonstrates that regions in the superior temporal lobe make a significant contribution to multisensory influences in auditory cortex in the alert animal.
Our results complement those of previous studies which found that high frequency interactions (above 50 Hz) also play a role in mediating multisensory influences in auditory cortex. Ghazanfar and colleagues (Ghazanfar et al., 2008
; Maier et al., 2008
) found that linear coherence between regions in auditory belt and STS was increased during multisensory stimulation. This increased coherence not only pertained to pairs of field potentials, but also to coherences between MUA activity in auditory cortex and field potentials in the STS. Unfortunately these studies did not report results for frequency bands below 50 Hz, making a direct comparison to the present results difficult. Overall, this suggests that high frequency oscillations also add to the functional coupling of auditory cortex and STS, suggesting that multiple frequency bands are likely involved in mediating multisensory influences in auditory cortex (see also Chandrasekaran and Ghazanfar, 2009
for recent results along the same line).
Together these results provide strong support for the notion that visual influences in auditory cortices are mediated by feed-back projections from regions in the superior temporal lobe. While anatomical projections from the upper bank of the STS and the STG to auditory cortex have been known for a while (Cusick, 1997
; Pandya and Yeterian, 1985
; Seltzer and Pandya, 1978
, 1994
; Seltzer et al., 1996
), their functional implications for sensory responses in auditory cortex is only about to become evident. Consistent with our findings that feed-back projections from STS to auditory cortex contribute prominently to visual influences in auditory cortex are two observations: First, responses in auditory cortex to visual stimuli have a laminar pattern that is consistent with anatomical feed-back connections primarily targeting superficial layers (Schroeder and Foxe, 2002
). And second, the distribution of anatomically labeled afferent STS projections to auditory cortex conforms to the classical feed-back pattern (Cappe and Barone, 2005
). Together this makes a strong point for anatomical feed-back projections from STS to modulate responses in auditory cortex and to mediate multisensory influences.
While our and previous results make a strong point about the STS mediating multisensory influences in auditory cortex, they nevertheless do not rule out other contributing regions. Importantly, anatomical studies revealed a number of other potential sources for non-auditory inputs to auditory cortex, such as feed-back projections from frontal or parietal association areas, as well as projections from other primary sensory cortices and several subcortical structures (Hackett et al., 2007
; Smiley et al., 2007
). It might well be that different projections contribute to multisensory influences in auditory cortex concurrently, or to a different degree during different stimulation conditions or tasks. For example, feed-back from STS might be especially important for the processing of communication signals or behaviorally relevant objects (Ghazanfar et al., 2008
), while information from subcortical regions might relate more to the novelty or saliency of a stimulus (Lakatos et al., 2007
). Noteworthy, multisensory influences in auditory cortex have also been reported during anesthesia or with very short latencies, suggesting that the feed-forward convergence of (thalamic) afferents contributes at least partly to this process (Kayser et al., 2005
, 2007b
; Lakatos et al., 2007
; Schroeder and Foxe, 2005
). Altogether this suggests that a number of sources contribute to the multisensory influences in auditory cortex, with the STS playing a major role in the alert animal and during the processing of complex and dynamic stimuli, such as tested here.
Different Frequency Bands and their Contribution to Inter-Areal Coupling
Several lines of evidence have suggested that oscillations in the beta range play a role in the inter-areal coupling of distant brain regions. For example, sensorimotor interactions during different tasks occur in this frequency regime, both in animals and humans (Brovelli et al., 2004
; Liang et al., 2002
; Rodriguez et al., 1999
; Roelfsema et al., 1997
; von Stein et al., 2000
). This has lead to the suggestion that beta frequencies contribute strongly to the coupling between brain regions, possibly mediating interactions specific not to feed-forward sensory stimulation, but more to multisensory processes such as directed attention (Womelsdorf and Fries, 2007
; Wrobel, 2000
). In our data we found strong functional coupling in the beta band, and individual beta sub-bands contained interactions occurring in one direction only. This makes a strong case for the specificity of beta oscillations in mediating directed interactions related to merging sensory information. Noteworthy, previous human EEG studies also found correlations between beta oscillations and behavioral benefits of sensory integration (Senkowski et al., 2006
), further strengthening this link.
In addition, our results also suggest a role of slow theta oscillations in inter-areal communication. However, in contrast to the beta band, theta oscillations did not exhibit directional specificity. Noteworthy, the strength of these interactions correlated both with the MUA activity at the target site and the MUA activity at the source site. It might hence well be that these slow rhythms reflect common inputs to both regions. Recent evidence highlights the role of slow oscillations in mediating mechanisms for stimulus coding (Kayser et al., 2009
), modulating the responsiveness of neurons (Canolty et al., 2006
; Lakatos et al., 2005
), attention (Lakatos et al., 2008
) and stimulus selection (Schroeder and Lakatos, 2009
; Schroeder et al., 2008
). Common inputs to lower and higher areas involved in auditory processing hence could ensure that the same stimulus epochs are amplified by such mechanisms and hence serve to coordinate the processing along different stages of the auditory hierarchy.
Using Directed Causal Measures to Study Neuronal Interactions
Methods to quantify directed causal interactions in neural networks have become increasingly popular over the last years, and can provide important contributions to our understanding of the complex functional connectivity of brain regions involved in sensation and cognition. Granger causality and related techniques building on auto-regressive models provide one possible approach. In fact, a number of publications has tested and demonstrated the usefulness of this technique to study the functional connectivity between cortical areas (Bernasconi et al., 2000
; Cadotte et al., 2008
; Ding et al., 2000
; Liang et al., 2000
; Salazar et al., 2004
) to cite only some. Yet, one should keep in mind that these techniques still have their limitations: by relying on auto-regressive modeling of the data the present analysis can only reveal linear interactions, and contributions from third areas not included in the model can appear as directed interactions between the regions investigated. Although some of these limitations can are reduced by ongoing developments (Dhamala et al., 2008b
; Guo et al., 2008
; Nolte et al., 2008
), future work is still necessary to further enhance the power of such techniques in studying the complex functional connectivity of the brain.
Besides providing insights into the origin of multisensory influences in auditory cortex, the present study also presents one improvement of the classical approach using Granger causality and DTFs. Typically the directed interactions are estimated from continuous recordings of neuronal activity, such as field potentials, without making any reference to neuronal spiking activity. As a result it is not clear whether and how these interactions relate to neuronal firing at all. In our analysis we provided one method to test for such a relation, by asking which of the interactions likely have a ‘driving’ role for the spiking activity at the target site. We tested for such ‘effective’ interactions by computing correlations between directed interactions in different frequency bands the MUA activity at the target site. Interestingly, we found that only some of the interactions have a effective implication on neuronal spiking activity. This suggests that directed causal interactions estimated from field potentials can be further subdivided into functional specific bands, of which only some have an effective implication on neuronal spiking activity. Such an analysis providing a relation between causal interactions of LFPs and spiking activity can be easily computed and might be revealing in the context of other datasets as well.
The authors declare that the research was conducted in the absence of any commercial or financial relationships that could be construed as a potential conflict of interest.
This work was supported by the Max Planck Society. We are grateful to Stefano Panzeri for many helpful discussions and comments on the manuscript.
Sehatpour, P., Molholm, S., Schwartz, T. H., Mahoney, J. R., Mehta, A. D., Javitt, D. C., Stanton, P. K., Foxe, J. J. (2008). A human intracranial study of long-range oscillatory coherence across a frontal-occipital-hippocampal brain network during visual object processing. Proc. Natl. Acad. Sci. U.S.A. 105, 4399–4404.