Selection of internal reference gene for normalization of reverse transcription-quantitative polymerase chain reaction analysis in Mycoplasma hyopneumoniae
 Shiyang Li1,2 Yanqing Zhou2,3,4 Ting Yuan2
  Zhixin Feng2,3
  Zhenzhen Zhang2 Yuzi Wu2 Qingyun Xie2 Jia Wang2 Quan Li5 Zhibang Deng1
  Yanfei Yu1,2,3,6* Xiaomin Yuan1*
- 1College of Veterinary Medicine, Hunan Agricultural University, Changsha, China
- 2Key Laboratory of Veterinary Biological Engineering and Technology, Institute of Veterinary Medicine, Jiangsu Academy of Agricultural Sciences, Ministry of Agriculture and Rural Affairs, Nanjing, China
- 3College of Veterinary Medicine, Nanjing Agricultural University, Nanjing, China
- 4Zhongshan Institute for Drug Discovery, Shanghai Institute of Materia Medica, Chinese Academy of Sciences, Zhongshan, China
- 5College of Veterinary Medicine, Yangzhou University, Yangzhou, China
- 6School of Food and Biological Engineering, Jiangsu University, Zhenjiang, China
Mycoplasma hyopneumoniae is the etiological agent of swine enzootic pneumonia (EP), which resulting in considerable economic losses in pig farming globally. Reverse transcription-quantitative polymerase chain reaction (RT-qPCR) is a major tool for gene expression studies. However, no internal reference genes for normalization of RT-qPCR data of M. hyopneumoniae have been reported. The aim of this study was to screen the most stable genes for RT-qPCR analysis in M. hyopneumoniae under different conditions. Therefore, a total of 13 candidate internal reference genes (rpoC, Lipo, sgaB, oppB, hypo621, oppF, gyrB, uvrA, P146, prfA, proS, gatB, and hypo499) of M. hyopneumoniae filtered according to the reported quantitative proteomic analysis and the 16S rRNA internal reference gene frequently used in other bacteria were selected for RT-qPCR analysis. The mRNAs from different virulence strains (168, 168 L, J, NJ, and LH) at five different growth phases were extracted. The corresponding cycle threshold (Ct) values of the 25 reverse transcribed cDNAs using the 14 candidate genes were determined. Different internal reference genes or combinations were then screened for expression stability analysis using various statistical tools and algorithms, including geNorm, BestKeeper, and NormFinder software, to ensure the reliability of the analysis. Through further comprehensive evaluation of the RefFinder software, it is concluded that the gatB gene was the most suitable internal reference gene for samples of the different virulence strains in different growth phases for M. hyopneumoniae, followed by prfA, hypo499, and gyrB.
Introduction
Mycoplasma hyopneumoniae is the primary pathogen of enzootic pneumonia (EP), a chronic respiratory disease in pigs, and one of the primary agents involved in the porcine respiratory disease complex (PRDC) (1). Studies of virulence factors have mainly focused on adhesion proteins, such as P97 and P102 (2, 3). However, the pathogenic mechanism is still unclear and additional virulence factors need to be discovered. These discoveries will be aided by reverse transcription-quantitative polymerase chain reaction (RT-qPCR). RT-qPCR is frequently used to screen genes with different expression levels in different samples (4). The difference in expression level of genes under specific conditions can be linked to specific phenotypes. For instance, genes with significantly different expression levels in strains with different virulence strains can be used to correlate the gene products with the virulence of the strains. However, a credible RT-qPCR is not available for M. hyopneumoniae. The key to the establishment of a reliable RT-qPCR system is the identification of internal reference genes. The inclusion of reference genes enables the normalization of sample-to-sample variation and avoids misinterpretation of the RT-qPCR assays. An ideal internal reference gene should be expressed consistently under various conditions. However, despite many studies, no internal reference gene capable of stable expression under all test conditions has been identified. The expression of internal reference gene changes in different types of cells and during different stages of cell growth (5). Hence, it is vital to identify the stable internal reference gene under particular conditions used in a study to allow accurate interpretation of the results. Many reports have described the screening of internal reference genes under different conditions. Previous experimental analyses determined that recA, rho, proC, and rpoD are the most appropriate reference genes for the normalization of RT-qPCR data in Klebsiella pneumoniae (6). Analysis of the weighted average covariance and NormFinder stability index of the expression of 39 genes implicated mdoG as a stable internal reference gene in Escherichia coli K-12 (7). A study in Streptococcus thermophilus showed that, compared with traditional RG 16S rRNA, genes encoding glycine-tRNA ligase subunit β GlyS and fatty acid-binding protein DegV were more stably expressed (8). However, no internal reference genes of M. hyopneumoniae have been reported. This has prevented data normalization from this bacterium, which has hindered scientific gene transcription analysis and the comparison of results from different laboratories.
In this study, mRNAs extracted from M. hyopneumoniae strains in different growth phases and with diverse virulence were reverse transcribed into cDNAs and subjected to gene expression stability analysis by various statistical tools and algorithms, including geNorm, NormFinder, BestKeeper, and RefFinder.
Materials and methods
Strains and cultivation
High virulence M. hyopneumoniae strains 168, LH, and NJ and low virulence strains 168 L and J were cultured in modified Friis broth, KM2 medium (pH 7.4), at 37°C until the red medium turned yellow (pH 6.8). Details of the strains were mentioned in Data Sheet 1. Bacteria were harvested by centrifugation at 12,000 × g for 20 min at 4°C after culture for 12, 24, 36, 48, and 60 h. The pellets were washed twice with phosphate-buffered saline (PBS) before preparation for RNA extraction.
Extraction of total RNA and reverse transcription
The extraction of RNA from a total of 25 samples of different strains at different growth stages was performed using the RNAprep Pure Cell/Bacteria Kit (TIANGEN BIOTECH CO., LTD., Beijing, China), followed by the manufacturer's instructions. First-strand cDNA synthesis was performed using a HiScriptIII Reverse Transcriptase Kit (Vazyme Biotech Co., Ltd., Nanjing, China), followed by the manufacturer's instructions. All cDNA samples were stored at −80°C until used. The details of the reverse transcription reaction system are summarized in Table 1.
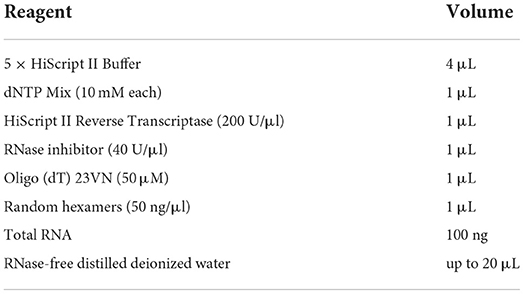
Table 1. Reverse transcription reaction system details.
Design and validation of specific primers
The candidate reference genes were chosen according to the proteomic analysis of M. hyopneumoniae (9). Genes displaying constant expression levels between the two strains with different virulence strains were used for further analysis of transcript levels. The threshold was defined with the abundance fold change between −1.1 and 1.1, because fold change > 1.2 (10), 1.5 (11), or 2.0 (12) was considered significant in most comparative proteomics analyses. According to the standards, a total of 13 candidates were chosen. These included DNA-directed RNA polymerase subunit beta (rpoC), lipoprotein (Lipo), pentitol phosphotransferase enzyme II, B component (sgaB), oligopeptide transport system permease protein (oppB), hypothetical protein (hypo621), oligopeptide transport system permease protein (oppF), DNA gyrase subunit B (gyrB), excinuclease ABC subunit A (uvrA), P146 adhesin like-protein, p97 paralog (P146), peptide chain release factor 1 (prfA), prolyl-tRNA synthetase (proS), glutamyl-tRNA amidotransferase subunit B (gatB), and hypothetical protein (hypo499). In addition, another candidate commonly used in other bacteria, 16S ribosomal RNA (16S), was also evaluated in this study. 16S is a housekeeping gene among different strains and its transcription level is reported to be relatively stable (13). Specific primers of the 14 candidates (Table 2) were synthesized by GenScript Biotech (Nanjing, China).
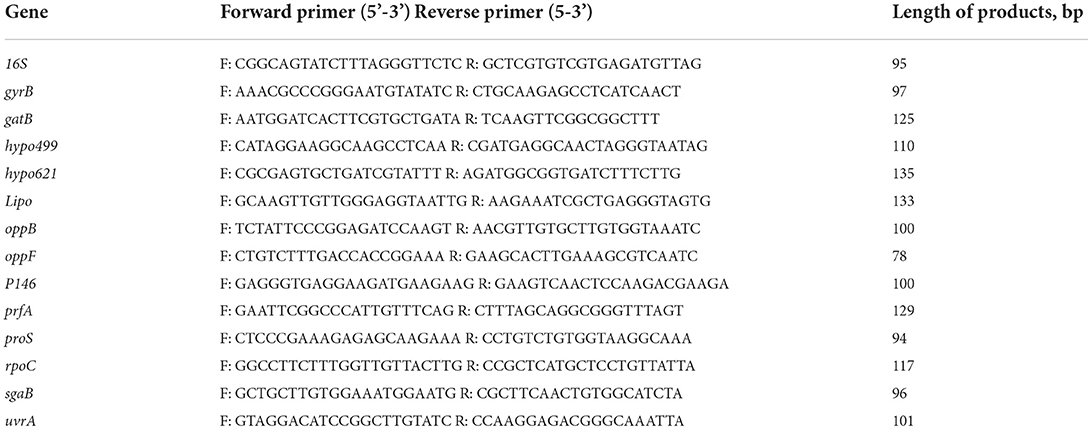
Table 2. RT-qPCR primers for candidate reference genes.
To evaluate the specificity of the candidate internal reference genes, both agarose gel electrophoresis and melting curves of primers analysis were performed. Using the strain cDNA as a template, the RT-qPCR amplification products of 14 internal reference genes were verified by 1% agarose gel electrophoresis to investigate the homogeneity and purity of the products, evident as a single band. The melting curves of the primer analyses determined using the QuantStudio 5 software were also analyzed to determine if the dissolution peaks were single and sharp. A sharp peak will appear in the curve if the reaction product is single. At least two or more peaks will appear if there is a dimer or non-specific amplification.
RT-qPCR analysis
Taq Pro Universal SYBR qPCR Master Mix was used for RT-qPCR analysis (Vazyme Biotech Co., Ltd.). All tests were carried out in biological triplicates and technical duplicates. The experimental reaction system conditions are presented in Table 3. RT-qPCR was performed for each candidate reference gene according to the procedures listed in Table 4. The cycle threshold (Ct) values of 25 samples were collected for statistical analyses.
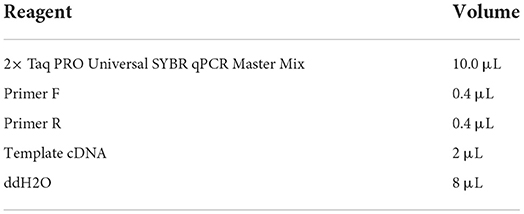
Table 3. RT-qPCR reaction system details.
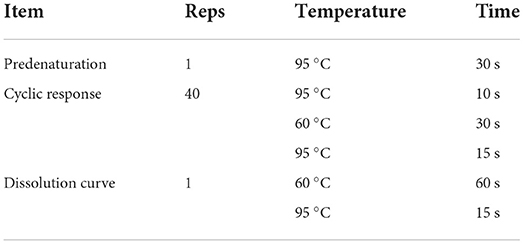
Table 4. RT-qPCR reaction procedures.
Expression stability analysis
The stability of gene expression level was analyzed using the geNorm (14, 15), NormFinder (16, 17), and BestKeeper software (18, 19).
GeNorm
The data analysis was first performed using geNorm (14). The Ct value of 25 samples was converted into a relative quantitative Q-value using the following formula: Q = 2–ΔCt (ΔCt=Ct sample–Ct min). “Ct sample” was the Ct value of the housekeeping gene in each of the samples of M. hyopneumoniae with different virulence strains and in different growth stages. “Ct min” indicated the lowest Ct value of the housekeeping genes among the 25 samples. Then, the expression stability measurement (M) value was calculated with Q-value by the geNorm program for each candidate reference gene. The optimal number of reference genes was determined by the paired coefficient of variation Vn/Vn+1. When Vn/V (n + 1) <0.15, the optimal number of internal reference genes is n. When Vn/V (n + 1) > 0.15, the optimal number of internal reference genes is n + 1. GeNorm did not differentiate between groups of samples or treatments.
NormFinder
The principle of NormFinder was similar to that of the geNorm program. The stable value of gene expression was the same as the M-value of geNorm (16). However, NormFinder offered a method of reference gene selection that took into account intragroup and intergroup variability. The gene with the smallest stable value of expression was taken as the most stable. Another characteristic of the NormFinder software was that only one appropriate internal reference gene would be selected as the reference gene.
BestKeeper
BestKeeper is also a program designed for selection against internal reference genes (19). The raw data were filled into the table of the BestKeeper software. The expression stability was evaluated by calculating standard deviation (SD) and percentage covariance (CV). Both BestKeeper and geNorm were based on pairwise comparison, which carried the same vulnerabilities regarding co-regulated genes (20). Internal reference genes and target genes were analyzed separately in this program. The BestKeeper program produces paired correlation coefficients and BestKeeper indices (geometric mean of Ct values of each candidate gene) between genes, which are compared according to the magnitude of their values.
Integrated analysis by RefFinder
Finally, the results obtained from geNorm (M-values), NormFinder (stability values), and BestKeeper (CV and SD) were subjected to the RefFinder algorithm (http://150.216.56.64/referencegene.php?type=reference), which integrated the results of the aforementioned three standard analysis algorithms for the comprehensive ranking of candidate reference gene(s) (21).
Results
Validation of specificity of candidate internal reference genes
The expression stability of housekeeping genes is the determining factor for the screening of internal reference genes. According to this principle, the genes previously reported to be expressed constantly in two different virulence strains (9), as well as the frequently used internal reference target 16S, were chosen for further evaluation. Prior to the RT-qPCR assay, the validity of the designed primers for a total of 14 candidates was subjected to reference genes specificity evaluation using cDNA transcribed from RNA as the template. RNA of 25 different samples from M. hyopneumoniae strains with different virulence strains and in different growth stages was obtained by RNA extraction. Equal amounts of RNA were further used as the template for the reverse transcription reaction to obtain cDNA. The obtained RT-qPCR amplification products of 14 internal reference genes using cDNA of 5 different strains as the template were verified by 1% agarose gel electrophoresis. As shown in Figure 1A, clear and specific target bands were obtained from all 14 tested internal reference genes using the genomes of five different strains as a template. In addition, the good specificity of the 14 primers was also validated by the melting curve analysis. As shown in Figure 1B, the melting curves of all the 14 primers exhibited a single and sharp peak in 5 different stains, which confirmed the specificity of every primer pair.
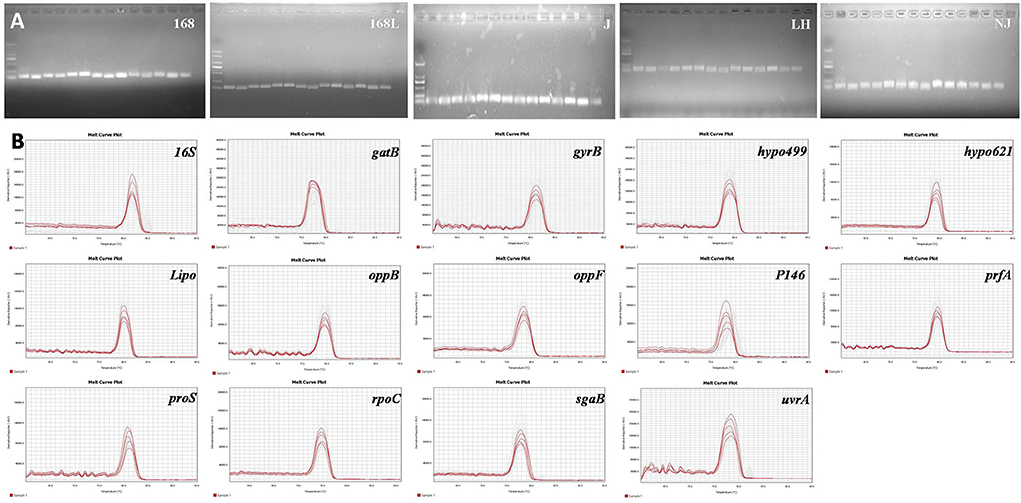
Figure 1. (A). Nucleic acid gel electrophoresis of candidate reference genes. M: DL2000;1: 16S; 2: gyrB; 3: gatB; 4: hypo499; 5: hypo621; 6: Lipo; 7: oppB; 8: oppF; 9: P146; 10: prfA; 11: proS; 12: rpoC; 13: sgaB; 14: uvrA. (B). Melting curves of the 14 candidate reference genes using genomes of different M. hyopneumoniae strains. Melting temperatures were visualized by plotting the negative first derivative of fluorescence relative to temperature (°C).
Abundance of transcripts of candidate internal reference genes
Analyzing the abundance of mRNA level was another important prerequisite for the selection of internal reference genes. A moderate level of gene expression was an optimal choice for reference genes, because it allows the evaluation of genes expressed at various levels, including very high and very low. The Ct value of reference genes was inversely proportional to the expression level of the genes in RT-qPCR analysis. The greater the Ct value of the reference gene, the lower the expression of the target gene in the sample and vice versa. Expression abundance of the 14 candidate reference genes in all 25 samples was analyzed using serial 10-fold dilutions of PCR products via RT-qPCR. The Ct values for each reference gene ranged from 8 to 29 (Figure 2). The large distribution of Ct values suggested that the expression abundance differed among the reference genes. The minimum Ct value of 8 was displayed by 16S. Thus, the gene expression abundance of 16S was the highest. The extremely high abundance of the reference genes will hinder the evaluation of the transcriptional level of those genes with low abundance. Thus, 16S was excluded from the candidate reference genes pool in the following analysis. The Ct values of the other 13 genes were approximately 21, which was neither too high nor too low, and suitable to evaluate the transcription levels of other genes.
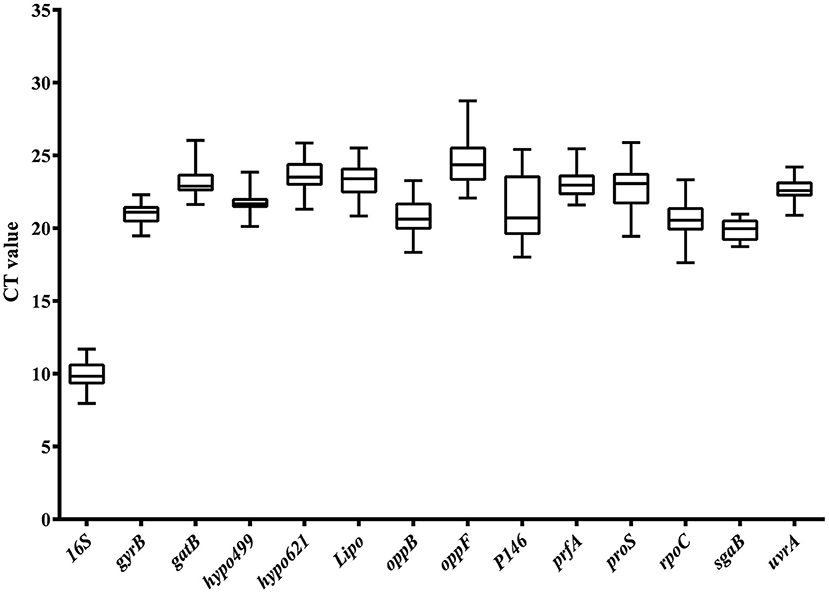
Figure 2. Ct value distribution of candidate reference genes in all samples by RT-qPCR. Boxes represent the mean Ct value and bars depict the mean ± standard deviation.
Stability of candidate internal reference genes
The transcription stability is vital for the internal reference of the 13 housekeeping genes with moderate abundance. This stability was determined for all 25 M. hyopneumoniae samples in different growth phases and with different virulence strains.
GeNorm analysi
All 25 M. hyopneumoniae samples were split into two sets according to the same strain at different growth stages and different virulence strains at the same growth stages, which were entered separately in the geNorm software package. Figures 3A,C shows the geNorm M analysis for all samples. Lower geNorm M values represented more stable reference genes. In addition, it is generally considered that when the value of Vn/V (n+1) calculated with Ct values of different primers and different samples by geNorm is <0.15, it is unnecessary to introduce a new reference gene into the internal reference system. Otherwise, (n+1)th reference gene is needed. As shown in Figure 3B, the V2/3 values of reference genes in all samples, except for strain NJ, were less than the threshold value of 0.15. Gene expression analysis by geNorm recommended two reference genes to achieve the best performance for strains 168, 168 L, J, and LH, while 3 reference genes were suitable for strain NJ. Results shown in Figure 3A demonstrated that for strain 168 at different growth stages, the candidate hypo499 and uvrA genes had the lowest M-values and were ranked as the most stable candidates. Accordingly, the candidate oppB and P146 genes ranked as the most stable genes in strain 168 L at different growth stages. In strain J, the stability of gyrB and rpoC was highest. For strain LH, the targets of highest transcriptional stability in different culture times were rpoC and sgaB. For strain NJ, gyrB, hypo499, and uvrA were the most stable.
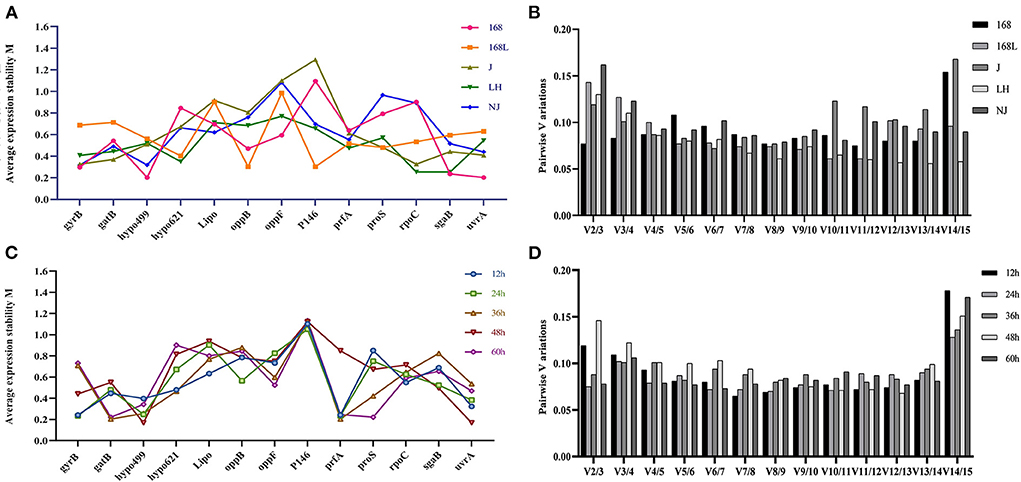
Figure 3. Average expression stability M-value and optimal number of reference genes according to geNorm analysis. The expression stability of 13 candidate genes in the same strain at different culture time (A) and different strains at the same culture time (C) was calculated. The x-axis represents various candidate reference genes. The y-axis represents stability value (M-value). Lower M-value suggests higher expression stability. (B) and (D) show the optimal number of reference genes in different subsets. The x-axis represents the number of genes selected for comprehensive analysis V (n/n+1), and the y-axis means the pairwise variation value (V-value). When the V-value is <0.15, the corresponding combination is deemed stable; n is the best number of internal reference genes.
The stability of internal reference genes for samples in the same growth phases of different strains was further evaluated. As shown in Figure 3D, two reference genes were suitable for RT-qPCR normalization in 12-h, 24-h, 36-h, 48-h, and 60-h cultures of different strains. The most stable candidates of 12-h cultures of the above five different strains were gyrB and prfA. Genes gyrB and prfA ranked as the two most stable candidates due to their minimum M-values. P146 and prfA similarly ranked as the two most stable genes of 24-h cultures of the different strains. The most stable reference genes of 36-h cultures of the different strains were gatB and prfA. Genes hypo499 and uvrA were the two most stable genes of 48-h cultures of the different strains. The candidate reference genes with maximum stability of 60-h cultures of the different strains were gatB and proS.
NormFinder analysis
NormFinder was a similar software to geNorm in the calculation method. The lower stability value calculated from NormFinder indicated the higher stability of the reference gene expression. The difference in NormFinder with geNorm was that NormFinder selected only one most suitable candidate internal reference gene. GatB was shown to be the most stable reference gene to evaluate the gene expression level in strains 168 and J at different growth phases (Figure 4A). PrfA ranked as the most stable reference gene at different growth stages of strains 168 L and NJ. RpoC ranked as the most stable reference gene for strain LH under different culture times.
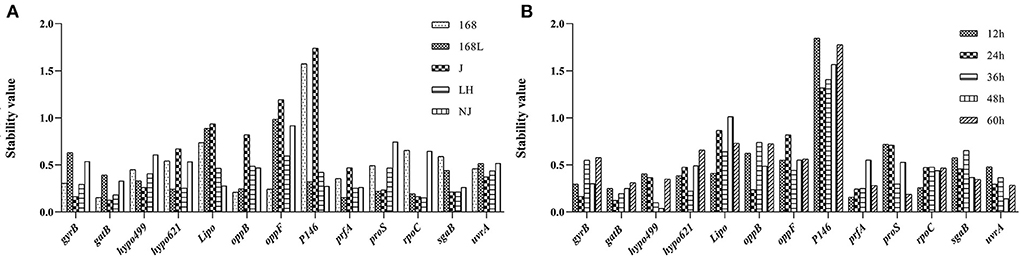
Figure 4. Stability analysis of internal reference genes using the NormFinder software. The x-axis represents various candidate reference genes. The y-axis represents stability value. (A): stability value of reference gene of the same strain at different culture time. (B): stability value of reference gene of different strains at the same culture time.
In the samples of different strains with a fixed culture time of 12 h, prfA displayed the highest stability (Figure 4B). The gene with the highest stability in 24-h cultures of the five different strains was gatB. Hypo499 displayed the highest stability in both 36-h and 48-h cultures among all five different strains. ProS was the most potential candidate for the evaluation of the gene expression changes in 60-h cultures of different strains.
For strain LH at different growth phases, the top two genes analyzed by geNorm analysis included the most stable gene rpoC obtained from the NormFinder algorithm. In the samples of different strains with fixed culture times of 12 h, 48 h, and 60 h, the respective most stable genes, prfA, hypo499, and proS, from NormFinder analysis ranked top two in geNorm.
BestKeeper analysis
BestKeeper was also used to determine the expression stability of the candidate reference genes by calculating the SD and CV of the Ct values obtained from samples of different stains in different growth phases. The lower the SD value, the higher the gene stability. Genes with SD value >1 were considered unsuitable as reference genes (22). As shown in Figure 5A, the sgaB gene was most stable in strain 168 in different growth stages. Hypo499 was most stable in strain LH harvested at different times. GyrB was the most stable reference gene in strains 168 L, J, and NJ harvested at different times.
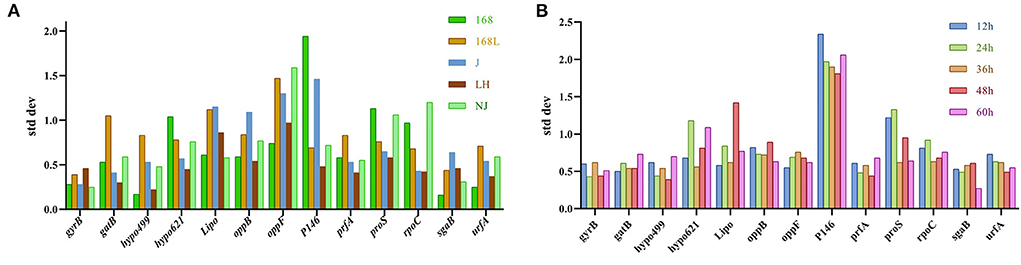
Figure 5. Analysis of internal reference gene standard deviation (SD) using the BestKeeper software. The x-axis represents various candidate reference genes. The y-axis represents stability value. (A): SD value of reference gene of the same strain at different culture times. (B): SD value of reference gene of different strains at the same culture time.
The gatB gene was the most stable reference gene in all strain samples cultured for 12 or 36 h (Figure 5B). For 24, 48, and 60 h cultures, gyrB, hypo499, and sgaB were the most stable genes, respectively. The most unstable internal reference gene among the 13 candidates at different culture times was P146, which was the same as the results obtained from both geNorm and NormFinder.
For strains J and NJ at different growth phases, the most stable gene gyrB analyzed by BestKeeper analysis was included in the top two genes obtained from the geNorm algorithm. In the samples of different strains with fixed culture times of 36 h and 48 h, the most stable gene hypo499 from BestKeeper analysis ranked top one in NormFinder.
Integrated analysis by RefFinder
RefFinder integrates all the results of the three aforementioned methods to calculate the geometric mean for each reference gene and their comprehensive ranking index of stability. A lower index value indicates a higher stability of the reference gene. The RefFinder comprehensive analysis displayed in Figure 6 showed that the expression stability of 13 internal reference genes from high to low under different culture time conditions of different strains of M. hyopneumoniae was: gatB, prfA, hypo499, gyrB, urfA, sgaB, hypo621, rpoC, 16S, proS, oppB, Lipo, oppF, and P146. In all samples, the top four most stable reference genes were gatB, prfA, hypo499, and gyrB, and the most unsuitable reference gene was P146, which was consistent with the results from geNorm and NormFinder (Figure 6). For simplicity of use, the most stable gene, gatB, can be used for gene expression analysis among different M. hyopneumoniae strains at different growth phases.
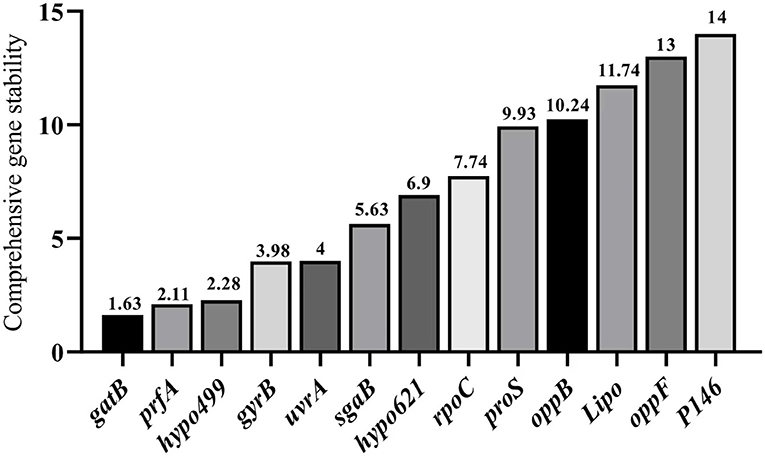
Figure 6. RefFinder analysis of expression stability of candidate internal reference genes. The x-axis represents various candidate reference genes. The y-axis represents stability value.
Validation and application
To confirm the validity of using gatB as an internal reference gene for RT-qPCR analysis to screen the virulence-associated genes of M. hyopneumoniae, we evaluated the expression level of a reported virulence factor ef-tu in this study. We found that the abundance of ef-tu gene expression products in high virulence strain 168 was significantly higher than that in attenuated strain 168 L, which indicated the relevance of ef-tu with M. hyopneumoniae virulence (Figure 7). The results were consistent with the reported research, in which ef-tu encoding products were found to contribute to the adhesion process of M. hyopneumoniae (23). The consistency of the results using gatB as the internal reference gene in RT-qPCR and the reported data demonstrated the reliability of the established RT-qPCR method.
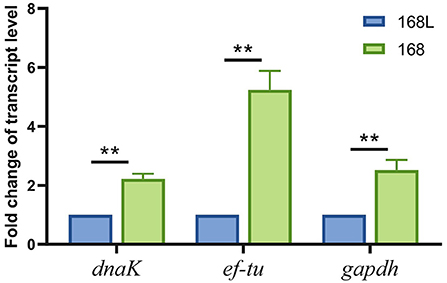
Figure 7. Transcription levels of dnak, ef-tu, and gapdh genes between high virulence M. hyopneumoniae strain 168 and low virulence strain 168 L.
The established RT-qPCR method using gatB as the internal reference gene was then used to identify novel virulence-related genes. Gapdh and dnaK were found significantly different in transcript levels in high virulence strain 168 and low virulence strain 168 L. GAPDH of Mycoplasma hyorhinis was found to be an adhesin to epithelial cells as well as a plasminogen receptor mediating extracellular matrix (ECM) degradation (24). DnaK of M. hyorhinis functioned as a multi-binding protein on the surface of M. hyorhinis cells (25). GAPDH and DnaK of M. hyopneumoniae were also found to contribute to ECM degradation, which may help the pathogen break through the tissue barrier for further invasion (data unpublished). These findings demonstrated that the established RT-qPCR method can be used to discover novel phenotype (virulence/growth phases)-related genes.
Discussion
Discovering physiological and pathological functions of key genes is of great significance for studies of pathogenic mechanism of M. hyopneumoniae. The relative quantification of gene expression is mainly realized through RT-qPCR. Suitable reference genes are necessary for the quantification of key gene expression patterns. To date, although no study on identifying reference genes of M. hyopneumoniae had been conducted, many studies on identifying suitable reference genes of other bacteria had been reported (26). As found in these studies, genes with the most stable expression patterns were always different in different species, at different developmental stages, or with different virulence strains, indicating the complexity of suitable reference genes (6, 27, 28). Therefore, it was necessary to conduct careful verification to identify the most stable reference genes in different M. hyopneumoniae strains with various virulence strains at different growth phases.
In this study, to identify the most stable reference gene, we used four statistical approaches to estimate the expression stability of 14 candidate reference genes in 5 different M. hyopneumoniae strains with various virulence strains and at 5 different growth phases. Various combinations of internal reference genes for RT-qPCR analysis of M. hyopneumoniae in different conditions were proposed. Although the optimal internal reference genes calculated by geNorm, NormFinder, BestKeeper, and ReFinder for M. hyopneumoniae RT-qPCR analysis between different virulence strains and under diverse growth phases were not completely identical; the rank of the most stable reference genes did not show great differences. Of the 14 candidate reference genes, gatB, prfA, hypo499, and gyrB were consistently among the top few optimal internal reference genes in all three methods, geNorm, NormFinder, and BestKeeper, respectively. Other studies also reported different ranking orders using different statistical approaches when identifying suitable reference genes under different developmental stages and temperature stresses (29). To comprehensively utilize the data analyzed by the three methods to obtain one best reference gene for the sake of simplicity, integrated analysis by ReFinder was further performed. The online software selected gatB as the comprehensive optimum reference gene for the analysis of gene expression differences of both different virulence strains and strains at different growth phases.
The internal reference genes screened in this study were then subjected to reevaluation with the reported virulence-associated genes in M. hyopneumoniae. The known virulence factor ef-tu (30) and novel virulence-associated genes gapdh (24) and dnaK (25) were also highly transcribed in virulence strains when RT-qPCR analysis was performed using gatB as an internal reference gene. This further validated the credibility of our screened internal reference genes.
In addition to virulence and growth cycles, the gatB internal reference genes may be used to assess gene expression levels in dynamic conditions, such as cultures in different media. However, more validation needs to be done. Meanwhile, there are also some limitations in the application of this method. It can certainly be used to evaluate changes in gene transcription levels. However, it cannot connect a specific gene to certain phenotypes, because in most cases proteins are the final functional form of the gene, and there are many ways of regulation from RNA to proteins.
Data availability statement
The original contributions presented in the study are included in the article/supplementary material, further inquiries can be directed to the corresponding authors.
Author contributions
SL performed most of the experiments. SL and YY prepared the manuscript. YZ and JW helped with the statistical analyses. TY and YW are responsible for the preparation of the experimental materials. ZZ, QX, and QL participated in the evaluation process. ZF, XY, and ZD supervised the work. All authors contributed to the article and approved the submitted version.
Acknowledgments
This study was supported by the Programs of Jiangsu Agricultural Science and Technology Innovation Fund [CX (20) 3090], the Programs of National Natural Science Foundation of China (32172860, 32102675, and 31900159), and the Natural Science Foundation of Jiangsu Province (BK20190269).
Conflict of interest
The authors declare that the research was conducted in the absence of any commercial or financial relationships that could be construed as a potential conflict of interest.
Publisher's note
All claims expressed in this article are solely those of the authors and do not necessarily represent those of their affiliated organizations, or those of the publisher, the editors and the reviewers. Any product that may be evaluated in this article, or claim that may be made by its manufacturer, is not guaranteed or endorsed by the publisher.
Supplementary material
The Supplementary Material for this article can be found online at: https://www.frontiersin.org/articles/10.3389/fvets.2022.934907/full#supplementary-material
References
1. Bandrick M, Pieters M, Pijoan C, Molitor TW. Passive transfer of maternal mycoplasma hyopneumoniae—specific cellular immunity to piglets. Clin Vaccine Immunol. (2008) 15:540–3. doi: 10.1128/CVI.00466-07
2. Minion FC, Adams C, Hsu T. R1 region of P97 mediates adherence of mycoplasma hyopneumoniae to swine cilia. Infect Immun. (2000) 68:3056–60. doi: 10.1128/IAI.68.5.3056-3060.2000
3. Seymour LM, Jenkins C, Deutscher AT, Raymond BBA, Padula MP, Tacchi JL, et al. Mhp182 (P102) binds fibronectin and contributes to the recruitment of plasmin(ogen) to the mycoplasma hyopneumoniae cell surface. Cell Microbiol. (2012) 14:81–94. doi: 10.1111/j.1462-5822.2011.01702.x
4. Huggett J, Dheda K, Bustin S, Zumla A. Real-time RT-PCR normalisation; strategies and considerations. Genes Immun. (2005) 6:279–84. doi: 10.1038/sj.gene.6364190
5. Giri A, Sundar IK. Evaluation of stable reference genes for qPCR normalization in circadian studies related to lung inflammation and injury in mouse model. Sci Rep. (2022) 12:1764. doi: 10.1038/s41598-022-05836-1
6. Gomes AEI, Stuchi LP, Siqueira NMG, Henrique JB, Vicentini R, Ribeiro ML, et al. Selection and validation of reference genes for gene expression studies in Klebsiella pneumoniae using reverse transcription quantitative real-time PCR. Sci Rep. (2018) 8:9001. doi: 10.1038/s41598-018-27420-2
7. Goswami M, Rao AVSSN. Transcriptome profiling reveals interplay of multifaceted stress response in escherichia coli on exposure to glutathione and ciprofloxacin. mSystems. (2018) 3:e00001-18. doi: 10.1128/mSystems.00001-18
8. Xiong ZQ, Fan YZ, Song X, Xia YJ, Zhang H, Ai LZ. Short communication: genome-wide identification of new reference genes for reverse-transcription quantitative PCR in Streptococcus thermophilus based on RNA-sequencing analysis. J Dairy Sci. (2020) 103:10001–5. doi: 10.3168/jds.2020-18672
9. Li S, Fang LR, Liu W, Song T, Zhao FW, Zhang RX, et al. Quantitative proteomic analyses of a pathogenic strain and its highly passaged attenuated strain of mycoplasma hyopneumoniae. Biomed Res Int. (2019) 2019:4165735. doi: 10.1155/2019/4165735
10. Wang H, Jiao PX, Zhang XX, Xing HJ. Quantitative proteomic analysis of trachea in fatting pig exposed to ammonia. J Proteomics. (2021) 247:104330. doi: 10.1016/j.jprot.2021.104330
11. Zhao M, Jia SJ, Gao XF, Qiu H, Wu RF, Wu HJ, et al. Comparative analysis of global proteome and lysine acetylome between naive CD4(+) T cells and CD4(+) T follicular helper cells. Front Immunol. (2021) 12:643441. doi: 10.3389/fimmu.2021.643441
12. Thiruvengadam SS, O'Malley M, LaGuardia L, Lopez R, Wang Z, Shadrach BL, et al. Gene expression changes accompanying the duodenal adenoma-carcinoma sequence in familial adenomatous polyposis. Clin Transl Gastroen. (2019) 10:e00053. doi: 10.14309/ctg.0000000000000053
13. Zhao WJ, Li Y, Gao PF, Sun ZH, Sun TS, Zhang HP. Validation of reference genes for real-time quantitative PCR studies in gene expression levels of Lactobacillus casei Zhang. J Ind Microbiol Biot. (2011) 38:1279–86. doi: 10.1007/s10295-010-0906-3
14. Albuquerque GMR, Fonseca FCA, Boiteux LS, Borges RCF, Miller RNG, Lopes CA, et al. Stability analysis of reference genes for RT-qPCR assays involving compatible and incompatible Ralstonia solanacearum-tomato 'Hawaii 7996' interactions. Sci Rep. (2021) 11:18719. doi: 10.1038/s41598-021-97854-8
15. Vandesompele J, De Preter K, Pattyn F, Poppe B, Van Roy N, De Paepe A, et al. Accurate normalization of real-time quantitative RT-PCR data by geometric averaging of multiple internal control genes. Genome Biol. (2002) 3:research0034.1. doi: 10.1186/gb-2002-3-7-research0034
16. Yang ZY, Zhang R, Zhou ZC. Identification and validation of reference genes for gene expression analysis in schima superba. Genes. (2021) 12:732. doi: 10.21203/rs.3.rs-361995/v1
17. Andersen CL, Jensen JL, Orntoft TF. Normalization of real-time quantitative reverse transcription-PCR data: a model-based variance estimation approach to identify genes suited for normalization, applied to bladder and colon cancer data sets. Cancer Res. (2004) 64:5245–50. doi: 10.1158/0008-5472.CAN-04-0496
18. Pfaffl MW, Tichopad A, Prgomet C., Neuvians TP. Determination of stable housekeeping genes, differentially regulated target genes and sample integrity: bestkeeper - excel-based tool using pair-wise correlations. Biotechnol Lett. (2004) 26:509–15. doi: 10.1023/B:BILE.0000019559.84305.47
19. Wang Y, Zhang Y, Liu Q, Tong H, Zhang T, Gu C, et al. Selection and validation of appropriate reference genes for RT-qPCR analysis of flowering stages and different genotypes of Iris germanica L. Sci Rep. (2021) 11:9901. doi: 10.1038/s41598-021-89100-y
20. Gao JQ, Liu J, Jiang C, Chen SL. Huang LQ. Identification of suitable reference genes for studies of Syringa pinnatifolia Hemsl, FEBS. Open Bio. (2021) 11:1041–53. doi: 10.1002/2211-5463.13097
21. de Lima CAD, de Lima SC, Barbosa AD, Sandrin-Garcia P, Pita WD, Silva JD, et al. Postmenopausal osteoporosis reference genes for qPCR expression assays. Sci Rep. (2019) 9:16533. doi: 10.1038/s41598-019-52612-9
22. Zhao N, Xu J, Jiao L, Qiu M, Zhang J, Wei X, et al. Transcriptome-based selection and validation of reference genes for gene expression analysis of alicyclobacillus acidoterrestris under acid stress. Front Microbiol. (2021) 12:731205. doi: 10.3389/fmicb.2021.731205
23. Yu YF, Wang HG, Wang J, Feng ZX, Wu M, Liu BB, et al. Elongation Factor Thermo Unstable (EF-Tu) moonlights as an adhesin on the surface of mycoplasma hyopneumoniae by binding to fibronectin. Front Microbiol. (2018) 9:974. doi: 10.3389/fmicb.2018.00974
24. Wang J, Li Y, Pan LJ, Li J, Yu YF, Liu BB, et al. Glyceraldehyde-3-phosphate dehydrogenase (GAPDH) moonlights as an adhesin in Mycoplasma hyorhinis adhesion to epithelial cells as well as a plasminogen receptor mediating extracellular matrix degradation. Vet Res. (2021) 52:80. doi: 10.1186/s13567-021-00952-8
25. Li Y, Wang J, Liu BB, Yu YF, Yuan T, Wei YN, et al. DnaK functions as a moonlighting protein on the surface of mycoplasma hyorhinis cells. Front Microbiol. (2022) 13:58. doi: 10.3389/fmicb.2022.842058
26. Rego ECS, Pinheiro TDM, Antonino JD, Alves GSC, Cotta MG, Fonseca FCD, et al. Stable reference genes for RT-qPCR analysis of gene expression in the musa acuminata-pseudocercospora musae interaction. Sci Rep. (2019) 9:14592. doi: 10.1038/s41598-019-51040-z
27. Takle GW, Toth IK, Brurberg MB. Evaluation of reference genes for real-time RT-PCR expression studies in the plant pathogen pectobacterium atrosepticum. BMC Plant Biol. (2007) 7:50. doi: 10.1186/1471-2229-7-50
28. Golpayegani A, Nodehi RN, Rezaei F, Alimohammadi M, Douraghi M. Real-time polymerase chain reaction assays for rapid detection and virulence evaluation of the environmental pseudomonas aeruginosa isolates. Mol Biol Rep. (2019) 46:4049–61. doi: 10.1007/s11033-019-04855-y
29. Wang G, Cheng H, Li M, Zhang C, Deng W, Li T. Selection and validation of reliable reference genes for Tolypocladium guangdongense gene expression analysis under differentially developmental stages and temperature stresses. Gene. (2020) 734:144380. doi: 10.1016/j.gene.2020.144380
Keywords: Mycoplasma hyopneumoniae, RT-qPCR – real-time quantitative polymerase chain reaction, internal reference genes, gatB, virulence
Citation: Li S, Zhou Y, Yuan T, Feng Z, Zhang Z, Wu Y, Xie Q, Wang J, Li Q, Deng Z, Yu Y and Yuan X (2022) Selection of internal reference gene for normalization of reverse transcription-quantitative polymerase chain reaction analysis in Mycoplasma hyopneumoniae. Front. Vet. Sci. 9:934907. doi: 10.3389/fvets.2022.934907
Received: 03 May 2022; Accepted: 27 June 2022;
Published: 22 July 2022.
Edited by:
Fazul Nabi, Lasbela University of Agriculture, Water and Marine Sciences, PakistanReviewed by:
Muhammad Fakhar-e-Alam Kulyar, Huazhong Agricultural University, ChinaJoycee Jogi, Nanaji Deshmukh Veterinary Science University, India
Copyright © 2022 Li, Zhou, Yuan, Feng, Zhang, Wu, Xie, Wang, Li, Deng, Yu and Yuan. This is an open-access article distributed under the terms of the Creative Commons Attribution License (CC BY). The use, distribution or reproduction in other forums is permitted, provided the original author(s) and the copyright owner(s) are credited and that the original publication in this journal is cited, in accordance with accepted academic practice. No use, distribution or reproduction is permitted which does not comply with these terms.
*Correspondence: Yanfei Yu, yuyanfeihaha@163.com; Xiaomin Yuan, 187027211@qq.com