Modeling the Effect of Bovine Viral Diarrhea Virus in Australian Beef Herds
 Jake Fountain1,2*
  Marta Hernandez-Jover1,2
  Carsten Kirkeby3
  Tariq Halasa3
  Jennifer Manyweathers1,2
  Yiheyis Maru4
  Victoria Brookes1,2,5
- 1Graham Centre for Agricultural Innovation (An Alliance Between Charles Sturt University and NSW Department of Primary Industries), School of Agricultural, Environmental and Veterinary Sciences, Charles Sturt University, Wagga Wagga, NSW, Australia
- 2School of Agricultural, Environmental and Veterinary Sciences, Charles Sturt University, Wagga Wagga, NSW, Australia
- 3Section of Animal Welfare and Disease Control, Institute of Veterinary and Animal Sciences, Faculty of Medical and Health Sciences, University of Copenhagen, Frederiksberg, Denmark
- 4Commonwealth Scientific and Industrial Research Organisation Land and Water, Canberra, ACT, Australia
- 5Sydney School of Veterinary Science, Faculty of Science, The University of Sydney, Camperdown, NSW, Australia
Bovine viral diarrhea virus (BVDV) is an economically important disease in Australian beef farming. The disease typically results in low-level production losses that can be difficult to detect for several years. Simulation modeling can be used to support the decision to control BVDV; however, current BVDV simulation models do not adequately reflect the extensive farming environment of Australian beef production. Therefore, the objective of this study was to develop a disease simulation model to explore the impact of BVDV on beef cattle production in south-east Australia. A dynamic, individual-based, stochastic, discrete-time simulation model was created to simulate within-herd transmission of BVDV in a seasonal, self-replacing beef herd. We used the model to simulate the effect of herd size and BVDV introduction time on disease transmission and assessed the short- and long-term impact of BVDV on production outputs that influence the economic performance of beef farms. We found that BVDV can become established in a herd after a single PI introduction in 60% of cases, most frequently associated with the breeding period. The initial impact of BVDV will be more severe in smaller herds, although self-elimination is more likely in small herds than in larger herds, in which there is a 23% chance that the virus can persist for >15 years following a single incursion in a herd with 800 breeders. The number and weight of steers sold was reduced in the presence of BVDV and the results demonstrated that repeat incursions exacerbate long-term production losses, even when annual losses appear marginal. This model reflects the short- and long-term production losses attributed to BVDV in beef herds in southeast Australia and provides a foundation from which the influence and economic utility of BVDV prevention in Australian beef herds can be assessed.
Introduction
Endemic diseases are responsible for significant economic losses in the Australian beef industry. A report commissioned in 2015 indicated that bovine viral diarrhea virus (BVDV) was the second-most economically significant endemic disease affecting Australian beef production (1). BVDV is a small, highly infectious, enveloped RNA virus of the genus Pestivirus (2). Serological studies have shown that cattle in all states across Australia are exposed to the virus, with a herd-level seroprevalence between 48% (Tasmania) and 86% (South Australia) (3). A review of BVDV in the eastern states of Australia conducted in 2012 revealed that the national herd-level seroprevalence of the disease has remained at ~60% since 1967 (3, 4).
Loss of production in beef herds is typically characterized by the reproductive effects of BVDV. Early embryonic death and abortion as a result of virus exposure can lead to reduced pregnancy rates and increased calving intervals (5). This effect on reproduction can be severe if a naïve cattle population is exposed to the virus, especially during the breeding period. In-utero infection from 30 to 120 days gestation is likely to result in the birth of a persistently infected (PI) calf (2, 6). PI calves are the main source of viral persistence within a cattle population and the presence of a single PI calf has been attributed to herd seroconversion rates of up to 97% in a six-month period (7–10). PI calves are also attributed with increased calf mortality, with a 35–50% probability of death or culling before one year of age (10). In contrast, transiently infected (TI) animals (susceptible animals that are acutely infected) only shed the virus for up to 14 days and are generally subclinical, making them an inefficient source of horizontal transmission between herds (6, 8).
In a herd with endemic BVDV infection, the reproductive and immunosuppressive effects of the disease typically result in low-level annual production losses which can be difficult to detect, but the loss over several years can be significant (11). The production losses attributed to BVDV can influence the export market. Australia is the world's third largest exporter of beef products and is able to compete for global markets due to superior disease status and production of high-quality products (12). As an OIE-Listed disease, BVDV influences international trade under the Sanitary and Phytosanitary Agreement (13, 14). Strategies for the control of BVDV have become increasingly important, with some countries using test and cull schemes and others using a combined approach with vaccination (2, 15).
Despite these interventions, the success of nationwide control of BVDV is highly variable and modeling has been used to study country-specific disease dynamics and facilitate decisions for disease control (16). Disease modeling can quantify the effect of specific disease control measures on morbidity, animal health and welfare, as well as economic impacts, effects on reproduction and subclinical disease (17). Simulation modeling of BVDV has been used by several countries to justify the implementation of nationwide control and disease mitigation strategies (16, 18, 19). However, dairy systems predominate the production industries in most of these countries. Due to the role of PI calves in BVDV transmission, differences in reproductive and calf-rearing practices between dairy and beef production systems mean that BVDV simulation models for the dairy industry do not reflect the effect of the disease in beef systems (9).
Simulation models have been used to assess the effect of BVDV in beef herds in Scotland, Ireland, United States and France (20–24). These studies used modeling to assess the economic utility of BVDV control strategies, as well as the benefits of on-farm mitigation strategies (17). In the absence of an official national BVDV control program, the responsibility of BVDV control in Australia falls on individual producers. Therefore, the Australian beef industry would benefit from a BVDV simulation model to guide mitigation of the disease at farm-level. Existing BVDV models simulate dairy production systems or beef systems in which cattle are housed in close quarters for a portion of the year, which is not typical of beef production in Australia. Han et al. (25) illustrated a difference in the impact of BVDV on pastoral beef farms when compared to other modeling studies, likely due to differences in housing and farm management. These findings demonstrate the need for country specific BVDV simulation modeling that is able to reflect the management practices of different beef farms.
The objective of this study was to develop a disease simulation model to investigate the impact of BVDV on Australian beef farms and inform the need for intervention in environments typical of beef farming in southeast Australia. The study compares the short- and long-term impacts of BVDV on beef production to highlight the production losses that can occur in the absence of disease prevention strategies.
Materials and Methods
Simulation Model
A dynamic, individual-based, stochastic discrete-time simulation model was created using the software R (26) to assess the effect of BVDV on a beef herd representative of seasonal, single-calving, self-replacing beef production systems in south-eastern Australia. The annual production calendar is based on the “Beef Calendar of Operations” published by the local government for south-east NSW (27). Simulations in which BVDV transmission was modeled (Scenario 1–3) were used to assess the short- and long-term effect of BVDV on beef production parameters, compared to a baseline scenario without BVDV (Scenario 0). Mitigation strategies were not simulated. The total number of infected animals was an additional output of interest for Scenario 1–3. BVDV transmission was characterized according to herd size and timing of virus introduction, which also allowed for comparison of simulation output parameters to published values for external validation of the model.
On each day of the simulation (one time-step), the model was updated in five stages: (1) disease transmission; (2) movements between groups on the farm; (3) removal of animals (through deaths, culls or sales); (4) pregnancy status; and (5) addition of animals (through purchases or births). Model parameters including herd structure and contact rates are described below. A Bernoulli process was used to model stochasticity for the probability of daily infection, mortality risk, probability of conception and daily probability of abortions. Sensitivity analysis was conducted to assess the influence of model parameters on the outputs of interest, as described below.
Herd Structure
The herd consisted of bulls (B), cull cows (CC), weaned steers (WS), weaned heifers (WH), first-calving cows (FC) and mature cows (MC). Each animal group was assigned to a single virtual paddock (Paddock 1–5, respectively) with the exception of MCs, which were split into age-related groups (≥ Paddock 6). The maximum number of MC paddocks was based on the bull-to-cow ratio and varied according to breeding herd size (minimum two MC paddocks and maximum 32 MC paddocks for a breeding herd of 50 and 800 animals, respectively).
Figure 1 provides a detailed illustration of the annual production calendar and animal movements used in the simulation model. Bulls were distributed between the WH, FC and MC paddocks (≥ Paddock 4) to simulate the start of the breeding period (joining). An estrus counter for each individual breeding animal (WH, FC and MC) was decreased by one unit daily to simulate the duration of the estrus cycle, and was predetermined from a uniform distribution of 18–24 days for each individual animal (reproduction parameters are described in Table 1). When the counter reached zero, the animal had a chance to conceive (see Table 1). The probability of conception for FC and MCs was dependent on their estrus cycle number and BVDV infection status (Tables 1, 2). WHs had the same probability of conception for all estrus cycles because they did not undergo uterine involution prior to joining. If conception did not occur, the estrus counter was restarted. If the animal conceived, a gestation period was assigned from a PERT distribution of range 279–287 (mode 283). At the start of every joining period, a fixed percentage of cows and heifers were made infertile, to reflect the expected infertility rate of heifers and cows (Table 1). To simulate seasonal breeding, bulls were removed from the WH and FC/MC paddocks at days 42 and 63 calendar year, respectively, based on industry recommendations (45, 46). Bulls were randomly selected and culled annually after the breeding period, according to the annual bull cull rate and an average life expectancy of 3 years (Table 1).
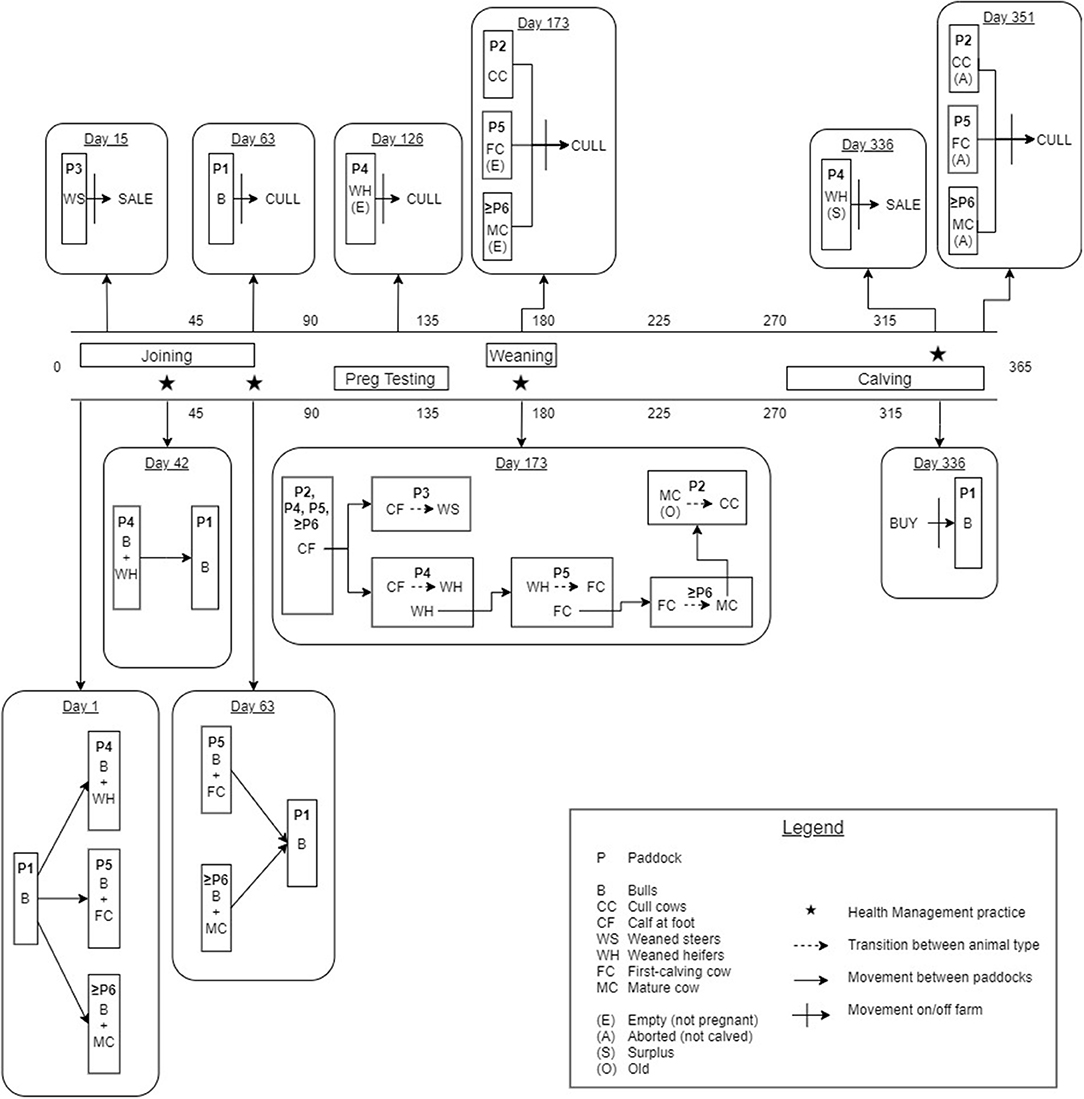
Figure 1. Schematic of the annual production calendar, animal movements and transitions between animal groups for the simulated beef herd.
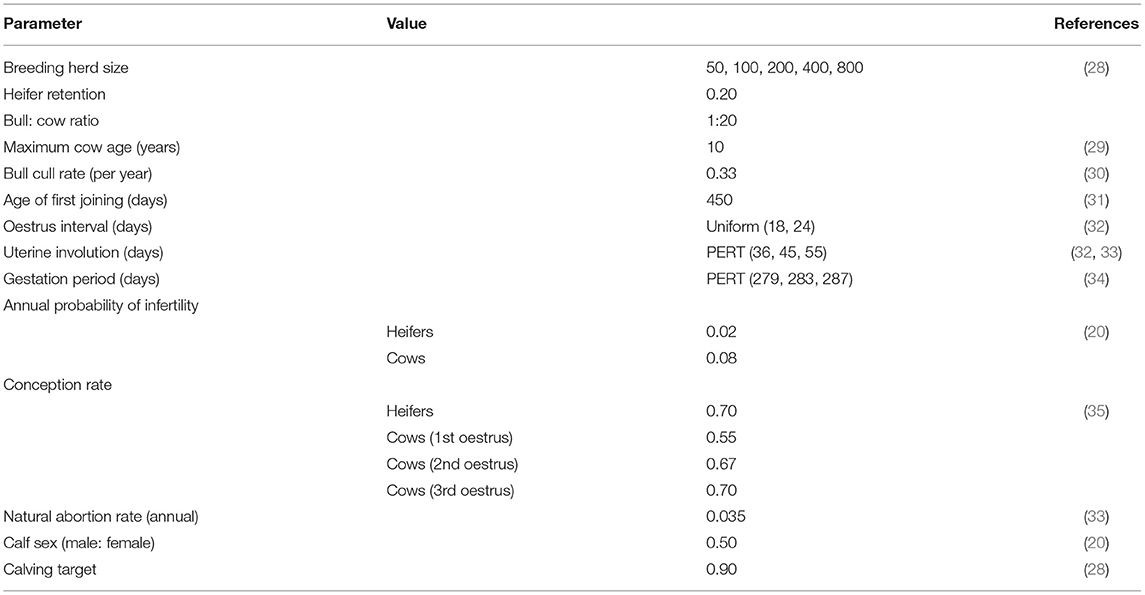
Table 1. Parameters used to represent a self-replacing beef system in south-east Australia in a BVDV simulation model.
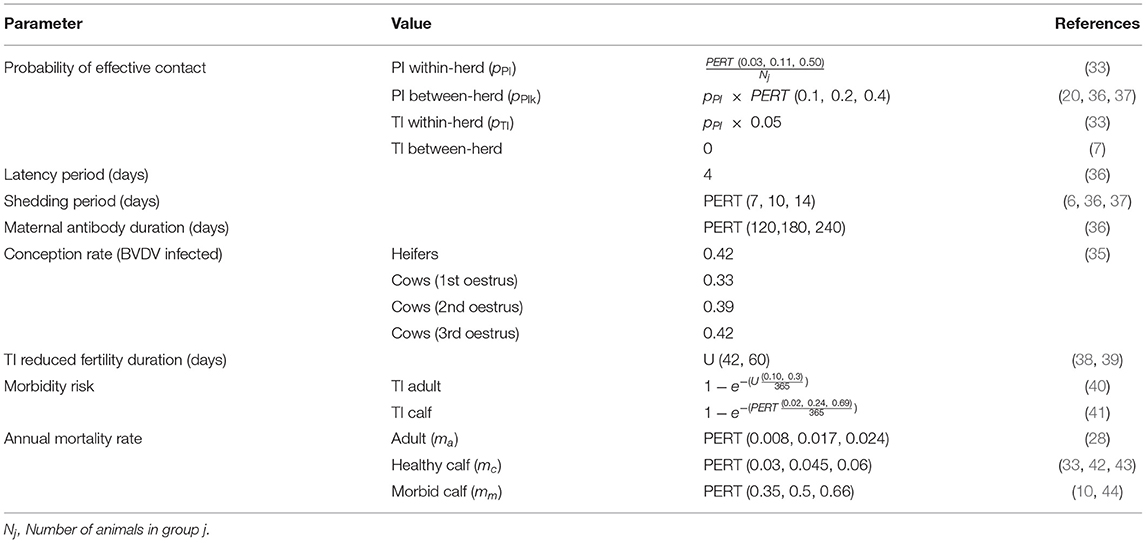
Table 2. Disease parameters used in a simulation model of BVDV in a self-replacing beef herd.
Any WH that was not pregnant at day 126 following the end of the breeding period (simulated pregnancy testing) was culled from the herd (Figure 1). FC and MCs with a calf at foot (CF) that were empty at pregnancy testing were culled at weaning (27). CFs remained in the same group as their dam until weaning at day 173 of the calendar year (6–9 months of age). At weaning, all CFs were distributed into Paddocks 3 and 4, where they became WS and WH, respectively. The WH bred in this season were moved to Paddock 5 to become the new FCs and the previous FCs were distributed to the MC paddock with the fewest animals. If the breeding herd size was sufficient to meet targets in the next joining period, the oldest MCs were moved to Paddock 2 and became CCs, to be culled the following year at weaning (29).
A CF was added to the herd when the gestation counter was equal to the breeding animal's assigned gestation period, signifying the end of gestation. In the absence of BVDV, a BVDV-susceptible, healthy calf was produced with a 0.5 probability of being male (20). The estrus counter for the breeding animal was recommenced from between 36 and 55 days to represent uterine involution, with the exception of FCs which were assigned an additional 20–30 days of involution (33, 34). Any breeding animal that did not produce a calf (due to abortion following pregnancy testing) was culled after the calving period. One month prior to joining, bulls were purchased to maintain a bull-to-cow ratio of 1:20 (30). WH in Paddock 4 were selected for retention based on live weight on day 336 of the calendar year, prior to the joining period. The lightest WHs were removed from the herd as sale animals if they were not required to maintain breeding herd numbers (Figure 1). If numbers of replacement heifers were not sufficient to maintain breeding herd targets, the youngest CCs from Paddock 2 were moved back into the MC paddocks for joining. All WS were removed from the herd as sale animals at Day 15 of the calendar year at 14–16 months of age. WS that were 380–500 kg satisfied the weight requirements for a premium price at sale (47).
Disease Dynamics
Infection dynamics for BVDV were based on an extension of the Reed-Frost model for individual-based, discrete-time disease modeling (48). Disease transmission on any day was dependent on the total number of effective animal contacts and the total number of TI and PI animals present within the population. Infection from a PI animal to a susceptible individual could occur through direct contact between cattle within a group, or via aerosols, vectors or fomites between groups (8, 9). Previous studies have determined that spread from TI cattle to other groups is negligible and therefore, transmission of the virus due to contact with TI animals could only occur within a group (7, 49).
Indirect transmission of BVDV has been demonstrated via shared needles during vaccination and reused rectal gloves during pregnancy testing (8) and therefore, increased probability of infection during health management was reflected in the simulation model through vaccination and pregnancy testing. Four vaccinations were simulated annually (Figure 1): initial CF vaccination (Day 42), second CF vaccination (Day 63), booster CF vaccination at weaning and booster B, WH, FC and MC vaccination prior to joining (Day 336).
When accounting for all routes of transmission of BVDV, the daily risk of infection for an individual animal in group j (λj) is described by equation 1:
*For animals involved in management practices on that day.
in which: IPIj = the number of persistently infected animals within paddock j; pPI = the probability of daily effective contact between individuals for PI transmission within paddock j; ITIj = the number of transiently infected animals within paddock j; pTI = the probability of daily effective contact between individuals for TI transmission within paddock j; IPIk= the number of persistently infected animals in paddock k; pPIk = the probability of daily effective contact from PI animals in paddock k to animals in paddock j (k = 1, …, n, k ≠ j). IPIh and ITIh represent the number of PI animals and the number of TI animals involved in a health management practice, respectively. The value for pPI in the current model study was derived from values used in Han, Weston (33), and the values for pPIk and pTI were scaled according to pPI (Table 2).
Morbidity, Mortality and BVDV Effect on Pregnancy
BVDV infection in TI females can cause oophoritis which will reduce the probability of conception (38, 39). In the model, non-pregnant animals that recovered from transient infection had a reduced probability of conception (the same probability of conception as an animal with active BVDV infection) for 42–60 days (Table 2). If an animal became infected while pregnant, the likelihood of abortion, development of a PI calf, weak-born calf and the probability of a calf born with permanent immunity to BVDV was based on McCormick 2010 (Supplementary Table 1). Breeding animals that recovered from transient infection prior to conception produced naïve calves that received passive immunity from colostrum. The duration of maternal immunity was 120–240 days, following which the calf became fully susceptible (36). A pregnant PI animal that did not abort their conceptus always produced a PI calf (6).
The daily individual mortality risk (mr) was derived from the relationship between risks and rates as described by Vynnycky and White (48):
in which: e = Euler's number and mi = the annual mortality rate based on the animal type (ma, mc and mm for adults, healthy calves and morbid animals, respectively). The mortality rates of adult cattle and healthy calves were derived from industry data from Meat & Livestock Australia (28) (Table 2). Most studies suggest that approximately half of all PI calves die within the first year (50, 51). Houe et al. (10) and McCormick et al. (44) found that the annual mortality rate of PI calves was ~35 and 66%, respectively. Therefore, annual PI calf mortality was based on a PERT distribution with 50% as the mode (range 0.35–0.66). Weak-born calves will exhibit high mortality in the first week of life, as well as poor growth rates up to weaning (6, 52, 53). Therefore, in the current model, weak-born calves had the same mortality rate as a PI animal until they reached seven days old. The mortality risk of a TI individual was not affected by BVDV infection.
Immunosuppression due to BVDV infection can increase the risk of secondary infections, causing calf diarrhea and bovine respiratory disease (BRD) (40, 54, 55). However, due to the variations in management practices and BVDV incidence between farms, it is difficult to accurately model the effect of BVDV on the incidence of specific secondary infections, or the effect of secondary infection on mortality. In the current model, risk of secondary infection due to immunosuppression from BVDV was characterized as a reduction in growth rate due to morbidity. All weak-born calves and all but 10% of PI calves were morbid throughout their entire lives [Taylor and Rodwell (52) reported 3 out of 30 PI animals with similar growth performance to healthy cattle]. TI calves < six months old that were infected with BVDV after birth had a risk of becoming morbid for the duration of their infectious period (Table 2). Transient infection is subclinical in 70–90% of adult cattle (40). Therefore, TI adults had a uniform probability of 0.1–0.3 of becoming morbid throughout the duration of their infectious period.
Modeling Daily Liveweight Gain
The model simulated live weight gain for CF, WS, WH and FC. Daily weight gain was calculated as an animal-specific percentage of individual animal live weight, derived from industry standard targets (Supplementary Table 2). Calves were assigned a birthweight from 32 to 40 kg based on the gestation period of their dam, with longer gestation periods producing heavier calves at birth (46, 56, 57). The growth rate of calves reared by an FC is 10–15% less than that of calves reared by an MC (58). Furthermore, female calves will grow about 5% slower than their male siblings until 400 days of age (59). These variations in weight gain were reflected in the model using animal-specific growth percentages for CF steers, heifers, and FC-reared calves (Supplementary Table 3).
An outbreak of BVDV on a beef herd in central Queensland Australia recorded significant variability in the weight of PI grower steers at weaning and sale (52). There is also evidence that TI animals and calves born weak following intra-uterine infection exhibit sub-optimal growth rates compared to virus negative animals (40, 54, 60). In the current model, weak-born and morbid PI calves had reduced daily live weight gains until 450 days of age (Supplementary Table 2) (52, 61).
Disease Simulation Scenarios and Model Outputs
Simulations commenced at the start of joining and prior to each scenario (Table 3) the model was run for a five-year burn-in period to reach a stable herd population. Initially, beef production was simulated for a period of 15 years without BVDV to obtain baseline production outputs for an uninfected herd (Scenario 0).
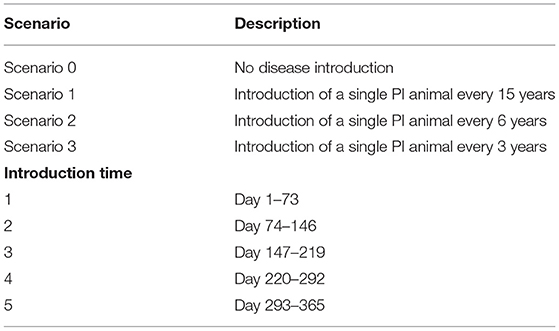
Table 3. Scenario and introduction time categories for within-herd simulation of BVDV in an Australian beef herd.
In Scenario 1, a single animal (<3 years old) was randomly selected and converted to a PI animal to simulate introduction of a PI animal into the farm from an external source. The model was run for a simulation period of 15 years with no further introduction of the virus. The day of BVDV introduction was recorded and categorized according to the time of year (Table 3). Scenario 1 was used to examine the impact of herd size and introduction time on the infection dynamics of BVDV.
Scenario 2 and 3 examined the impact of BVDV introduction frequency by simulating the introduction of a PI animal at regular intervals over a 15-year period (Table 3). As with Scenario 1, a random animal from the herd was converted to a PI animal in the first year of the simulation, and then again at 6- and 3-year intervals for Scenario 2 and 3, respectively. Each subsequent disease introduction event in Scenario 2 and 3 occurred on the same day of the calendar year to aid internal validation and interpretation of results.
Model outputs of interest were those that contribute to the economic performance of an Australian beef herd, including: the number of heifers retained for breeding, the number of cows culled, the number of bulls purchased, the annual number of steers sold and the number of those steers that were under the target weight to obtain a premium price at sale (47). It is assumed that the number of surplus heifers sold would follow the same trend as steer sales (due to indiscriminate calf deaths) and so, heifer retention was used as a surrogate of heifer sales. An increase in heifer retention will not only imply a reduction in the number of surplus heifers sold but can also be an indicator of poor reproductive performance in the breeding herd when mature cows are sold due to poor conception rates (46).
PI animals are the main contributors to BVDV transmission and persistence within a herd. Therefore, if a PI animal was born following disease introduction, we characterized this as establishment of infection within the herd. Self-elimination of the virus was classified as the last year that any infected animals (TI and PI animals) were present in the herd. The cumulative number of infected (TI and PI) animals was also of interest in those scenarios with BVDV transmission. Simulations were repeated for all scenarios until the model outputs reached convergence, with input variables changing every iteration according to the distributions in Tables 1, 2.
The effect of disease introduction frequency on performance was also demonstrated by taking the “per breeding animal” difference in outputs from Scenarios 1–3 compared to Scenario 0, at the cumulative 5-, 10- and 15-year values for all outputs of interest to enable direct comparisons between herd sizes.
Model Validation
Internal validation of the model was achieved using the rationalism and the tracing methods (36). Implementation without disease introduction ensured that the breeding herd size and replacement practices were performing as expected, given industry-derived parameters, and to determine the burn-in period of the model. Implementation with BVDV transmission tested variation in outputs in response to variation in transmission parameters. Individual animals were followed throughout the simulations to identify inconsistencies in model activity. The disease status of each newborn calf was recorded annually to ensure that vertical transmission aligned with the disease status of the herd.
External validation was achieved by comparing the model outputs to published data from the BVDV literature. Transmission characteristics of the virus and model outputs such as pregnancy risk, abortion rate and calf deaths were validated against corresponding values from Australian BVDV outbreaks using the modeling scenario, breeding herd size and introduction time that best fit the context of published cases.
Convergence Testing
The number of iterations required to achieve convergence for each modeling scenario was identified using the method described in Brookes et al. (62). Briefly, the coefficient of variation (CV; standard deviation/mean) of a sample from each model output was calculated. This was repeated, increasing the sample size each time, causing CV to approach zero until the number of iterations (sample size) was sufficient to achieve output stability (CV <0.025; the lower part of a 95% confidence interval). Convergence testing was performed on the 15-year cumulative values (expressed as a proportion of breeding herd size) of the main model outputs of interest for each scenario.
Sensitivity Analysis
Sensitivity analysis was used to determine the influence of input variables on the outputs of the scenario with the most variation (as determined by convergence testing). Only input variables that changed with every iteration of the model (based on a uniform or PERT distribution) were included in the analysis, as well as breeding herd size and introduction time (Supplementary Table 4). Collinearity was expected between the parameter for “number of effective PI contacts within a paddock” and “number of effective PI contacts between a paddock” and therefore, the latter was omitted from the analysis. The 15-year cumulative values for the number of infected animals, as well as the outputs contributing to economic performance in beef farming, were used in the sensitivity analysis.
Scatter plots were used to assess for collinearity between input parameters. Generalized additive mixed models [GAM model; gamm function in the mcgv package (63)] with a negative binomial link function were used to model the relationships between input and output data with a smooth function to account for non-linear relationships between some input parameters and model outputs. The GAM model then was used to predict the minimum and maximum effect of each independent variable on the model outputs (while all other independent variables were fixed at their median value), which were checked visually to ensure that the GAM model results were sensible.
Results
Convergence
The outcome of convergence testing for all scenarios is illustrated in Supplementary Figures 1–4. The output with the most variation over 15 years was the total number of infected animals, followed by the number of bulls purchased. It was deemed that variation in all outputs of interest for all Scenarios was <2.5% after 5,000 iterations.
Description of BVDV Transmission Characteristics
BVDV became established in 59.66% (n = 2983) of all iterations following a single PI introduction and therefore, quantitative analysis of all results that follow are based on these iterations. BVDV was least likely to become established in a herd with 50 breeders and after an incursion at Introduction Time 3 (Table 4). The maximum number of viremic animals following establishment of BVDV was highest (at the median value) after an incursion at Introduction Time 2 (median 0.49 infected animals/breeding animal) and was lowest at Introduction Time 5 (median 0.35 infected animals/breeding animal; Figure 2A). The maximum annual number of viremic animals/breeding animal following a single PI introduction had an inverse relationship to breeding herd size, with 50-breeders resulting in a median 0.54 (95% range 0.02–1.74) infected animals/breeding animal compared to median 0.38 (95% range 0.00–1.21) for 800-breeders (Figure 2B).
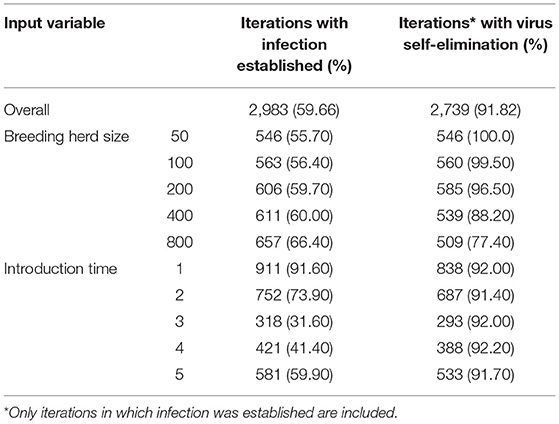
Table 4. Characteristics of BVDV transmission for a single PI introduction (Scenario 1) in a simulated beef herd.
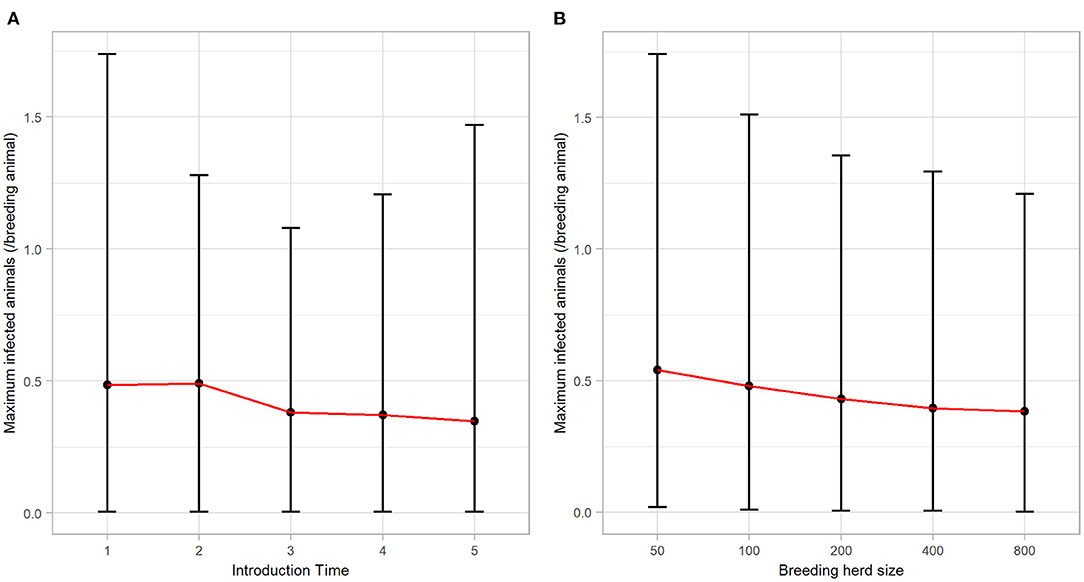
Figure 2. The maximum annual BVDV infections following a single PI introduction in a simulated beef herd. Line plots illustrating the influence of (A) introduction time and (B) breeding herd size on the number of animals (per breeding animal) that became infected by BVDV in the highest year of BVDV transmission. Points represent the median value, while error bars represent the 95% range.
Of the iterations that resulted in establishment of BVDV, self-elimination occurred in 91.82% (n = 2739) of cases (Table 4). There was no influence of Introduction Time on the likelihood of self-elimination once the disease was established (92% of iterations resulted in self-elimination for all Introduction Times). Introduction Time 1 had the shortest time to self-elimination (median 4 years, 95% range 3–5) and Introduction Time 3 resulted in the longest time to self-elimination (median 6 years, 95% range 2–10; Figure 3A). The virus was most likely to persist beyond the simulation period (15 years) in a herd with 800-breeders and self-eliminated in 100% of iterations with 50-breeders (Table 4). The virus self-eliminated from a herd of 50- and 800-breeders at median 4 years (95% range 1–8) and median 6 years (4–15; *No self-elimination occurred in the upper 95% percentile), respectively (Figure 3B).
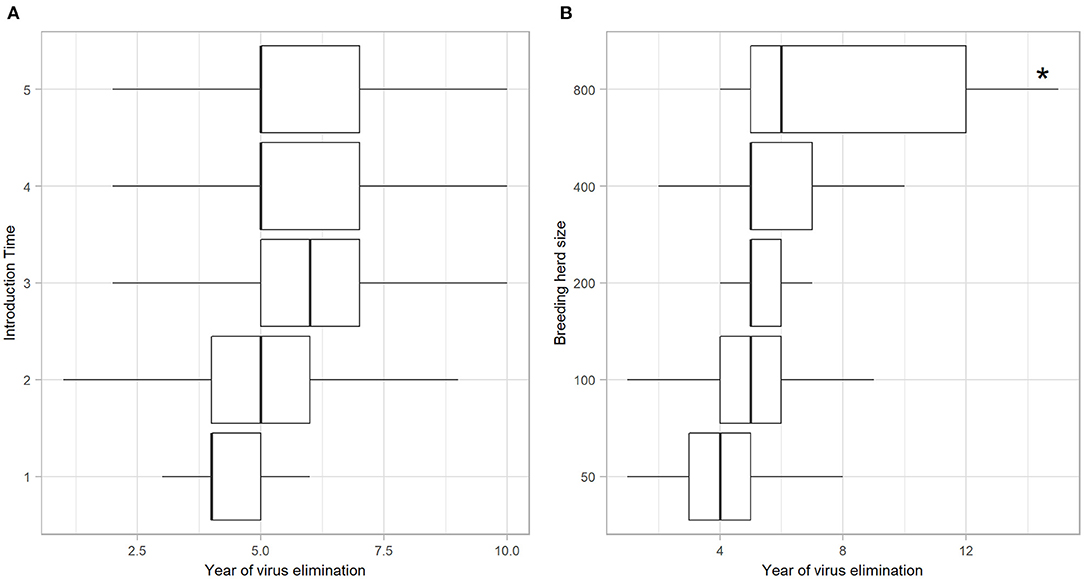
Figure 3. Year of BVDV elimination in those iterations with virus establishment following a single PI introduction in a simulated beef herd. Boxplots illustrating the year at which BVDV self-eliminated from the herd following virus introduction at different times of the production calendar (A) and in different herd sizes (B). Boxes represent the 25 and 75% percentiles while whiskers represent the 2.5 and 97.5% percentiles. Outliers removed for improved scale and readability. Asterisk (*) indicates that no self-elimination occurred in the 95% range.
Figure 4 highlights the relationship between herd immunity and the prevalence of viremia for the different outbreak scenarios. In all three scenarios, initial introduction of BVDV in the naïve herd resulted in maximum daily prevalence of viremic animals at median 3% (95% range 0.30–15%) of the total herd. Herd seroprevalence was highest at the start of the third year of the simulation (median 55%, 95% range 0.60–97%), following a steady decline in immunity as animals left the herd. In Figures 4B,C, BVDV was introduced in 6- and 3-year increments after the first incursion, respectively. In both scenarios, the second incursion resulted in a smaller increase in viremic animals (median 1%, 95% range 0.30–11% and median 2%, 95% range 0.60–10% for six and three years, respectively) compared to the initial introduction. The highest daily prevalence of viremia was even lower for subsequent BVDV introductions every three years (median 2%; 95% range 0.40–8%; Figure 4C).
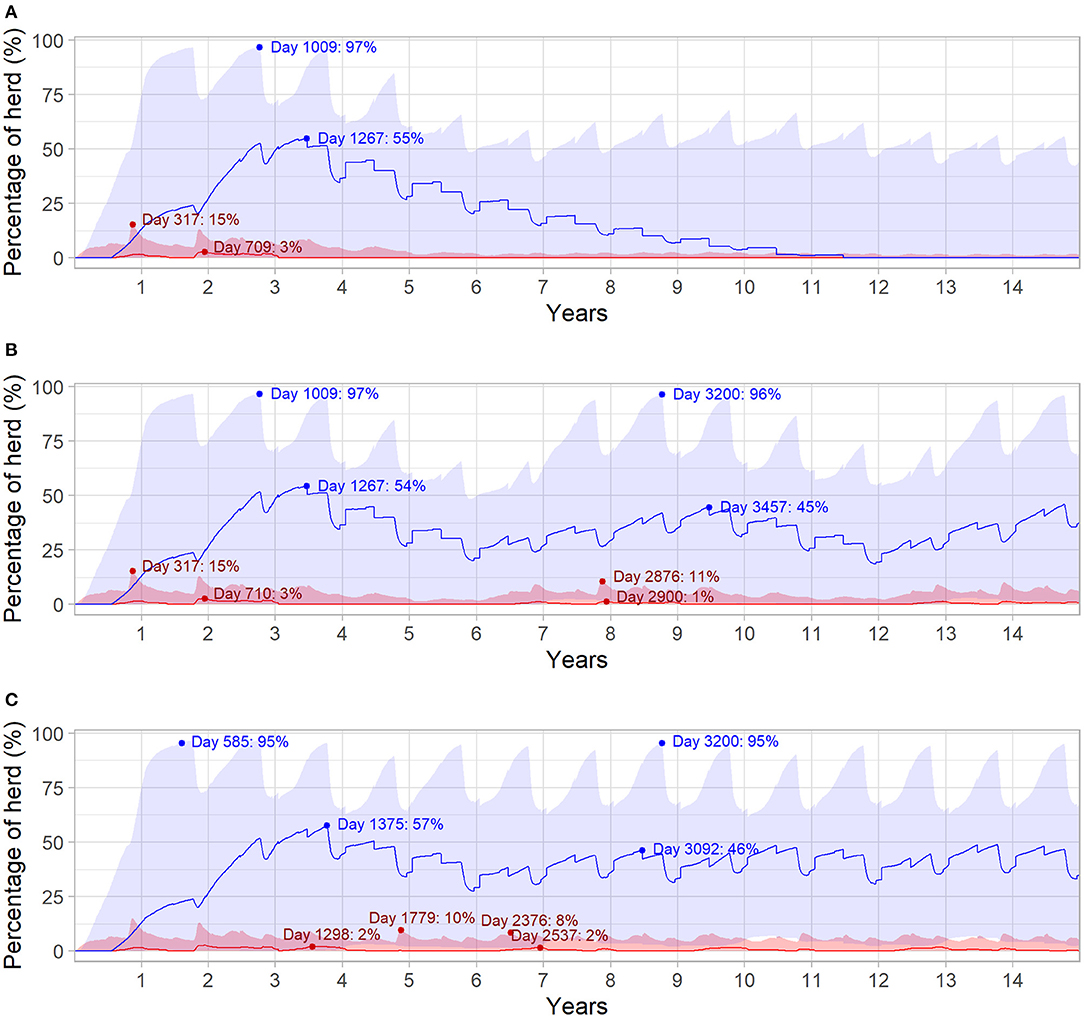
Figure 4. Daily infection dynamics for different BVDV introduction scenarios over 15 years in a simulated beef herd. Introduction of a single PI animal in the first year of the simulation (Scenario 1; A), introduction of a single PI animal every 6 years (Scenario 2; B) and introduction of a single PI animal every 3 years (Scenario 3; C) for 15 years. Percentage of daily viremic (TI and PI) animals (red) and daily seropositive animals (blue), with maternal immunity not represented. Solid red and blue lines indicate the median value for viremic and seropositive animals, respectively, while shaded areas represent the 95% range. Dot points and annotations represent the highest median values following each introduction of a PI animal (values following initial PI introduction in Scenario 3 are removed for improved readability).
BVDV Influence on Production Outputs
The number and weight of steers sold were most affected by BVDV. Initial introduction of BVDV in a naïve herd resulted in a reduction of steers sold at median 0.025 steers (95% range −0.32 to 0.270) per breeder over five years. Of these steers, median 0.015 steers/breeding animal (95% range −0.130 to 0.155) had liveweight at sale insufficient to reach the premium price range. Figure 5 demonstrates that the negative effects of BVDV on steer sales are cumulative as introduction of the disease becomes more frequent, with a reduction of median 0.082 (95% range −0.605 to 0.425) steers sold/breeding animals in Scenario 3 over 15 years (this equates to 4 and 66 steers for a 50- and 800-breeder herd, respectively).
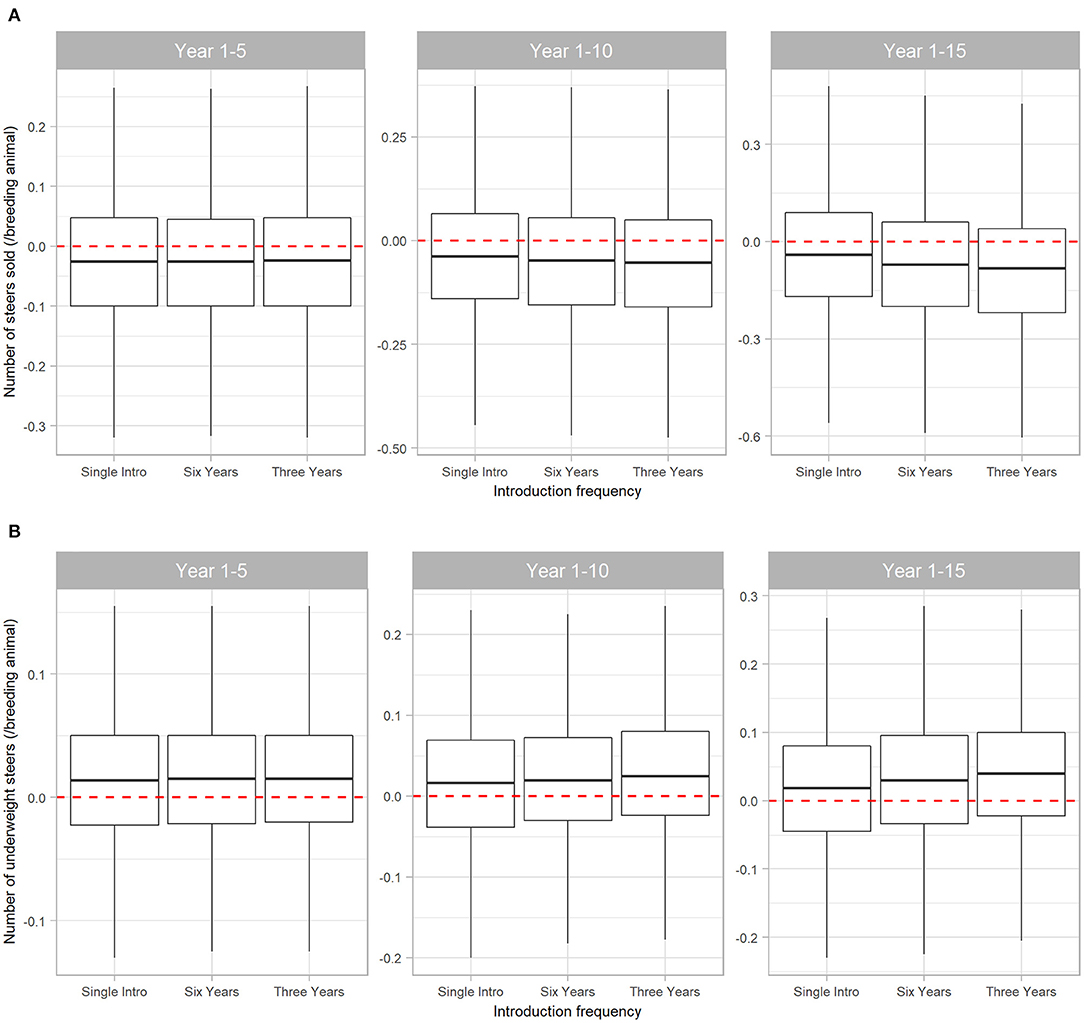
Figure 5. Boxplot illustrating the cumulative effect of BVDV introduction frequency on production outputs relating to steer sales in a simulated beef herd. The values depict the production loss for BVDV introduction compared to a disease-free herd. The dotted red line highlights zero, which would represent “no difference” between the disease-free scenario and the scenarios with BVDV. Values either side of the line indicate the impact of BVDV on the number of steers sold (A) and the number of steers sold that were too lightweight to qualify for a price premium (B)/breeding animal. Boxes represent the 25 and 75% percentiles while whiskers represent the 2.5 and 97.5% percentiles. Outliers removed for improved scale and readability.
The number of cows culled from the herd was also affected by BVDV, but to a lesser extent than steer sales (Figure 6B). Compared to a disease-free herd, BVDV resulted in median 0.01 (95% range −0.18 to 0.20) more cows culled/breeding animal in the first five years of disease exposure (all Scenarios) and median 0.024 (95% range −0.24 to 0.30) more cows culled/breeding animal when BVDV was introduced every three years for 15 years (Scenario 3). BVDV presence and introduction frequency had no influence on the median number of heifers retained in the herd or bulls purchased over 5, 10 or 15 years (Figures 6A,C).
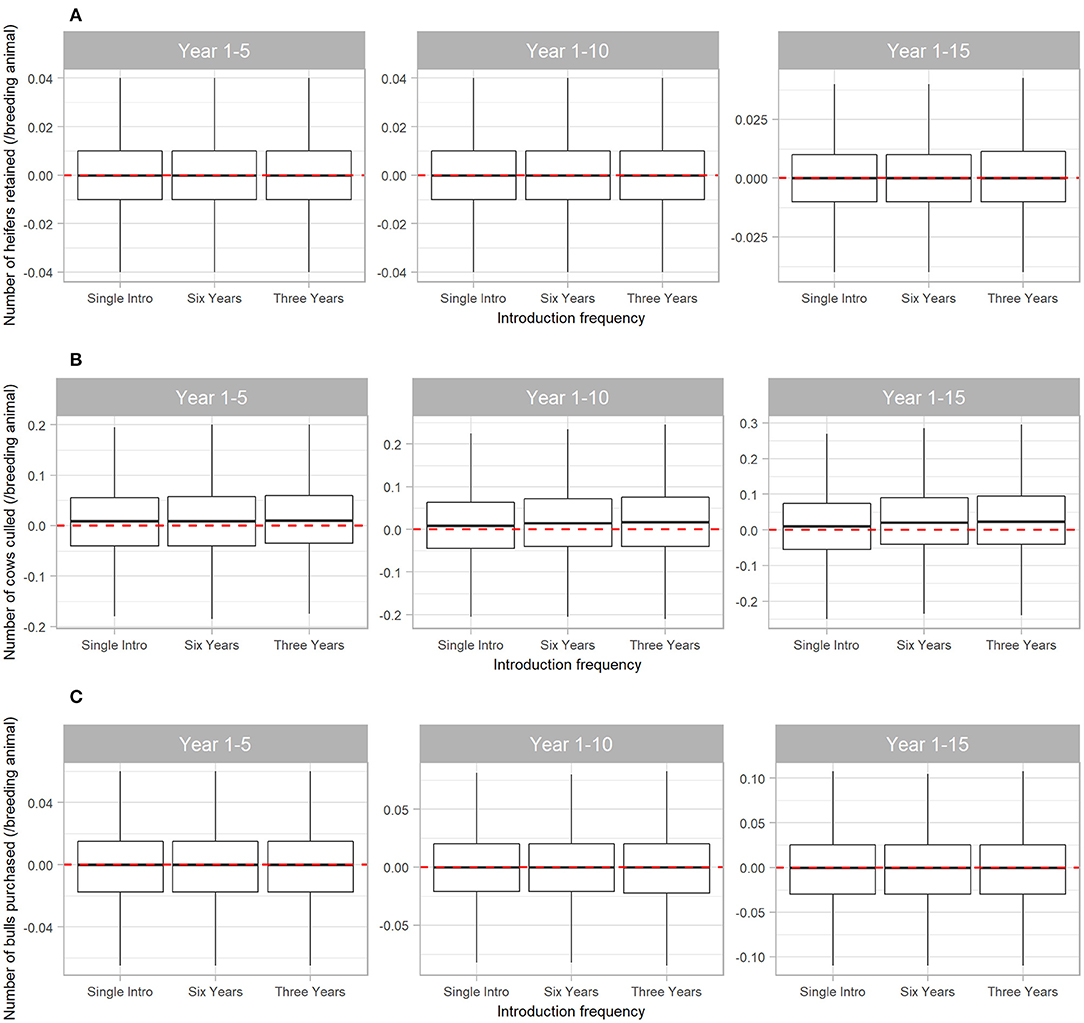
Figure 6. Boxplot illustrating the cumulative effect of BVDV introduction frequency on economic outputs relating to reproduction animals in a simulated beef herd. The values depict the production loss in for BVDV introduction compared to a disease-free herd. The dotted red line highlights zero, which would represent “no difference” between the disease-free scenario and the scenarios with BVDV. Values either side of the line indicate the impact of BVDV on the number of heifers retained for breeding (A), the number of cows culled (B) and the number of bulls purchased for replacement (C)/breeding animal. Boxes represent the 25 and 75% percentiles while whiskers represent the 2.5 and 97.5% percentiles. Outliers removed for improved scale and readability.
External Validation of Model Outputs
A description of the model outputs and reference values used for external validation of the model are summarized in Table 5. The mean herd viremic prevalence (1%), median age of PI animal death (6.7 months) and the median herd seroprevalence two years after a single BVDV introduction (40%) were all analogous to the corresponding median/mean values obtained in the literature. The mean prevalence of PI animals (0.7%), the median pregnancy risk (88%) for a naïve herd and the calf mortality rate in an infected herd (5%) was also within the range of the external reference values (0.2–0.8%; 85–89% and 5–7%, respectively) (64, 65). The median value for abortion rate, calf mortality rate and the percentage of light sale steers following a single BVDV introduction did not match the external data; however, the 95% range of these parameters did include their corresponding reference value.
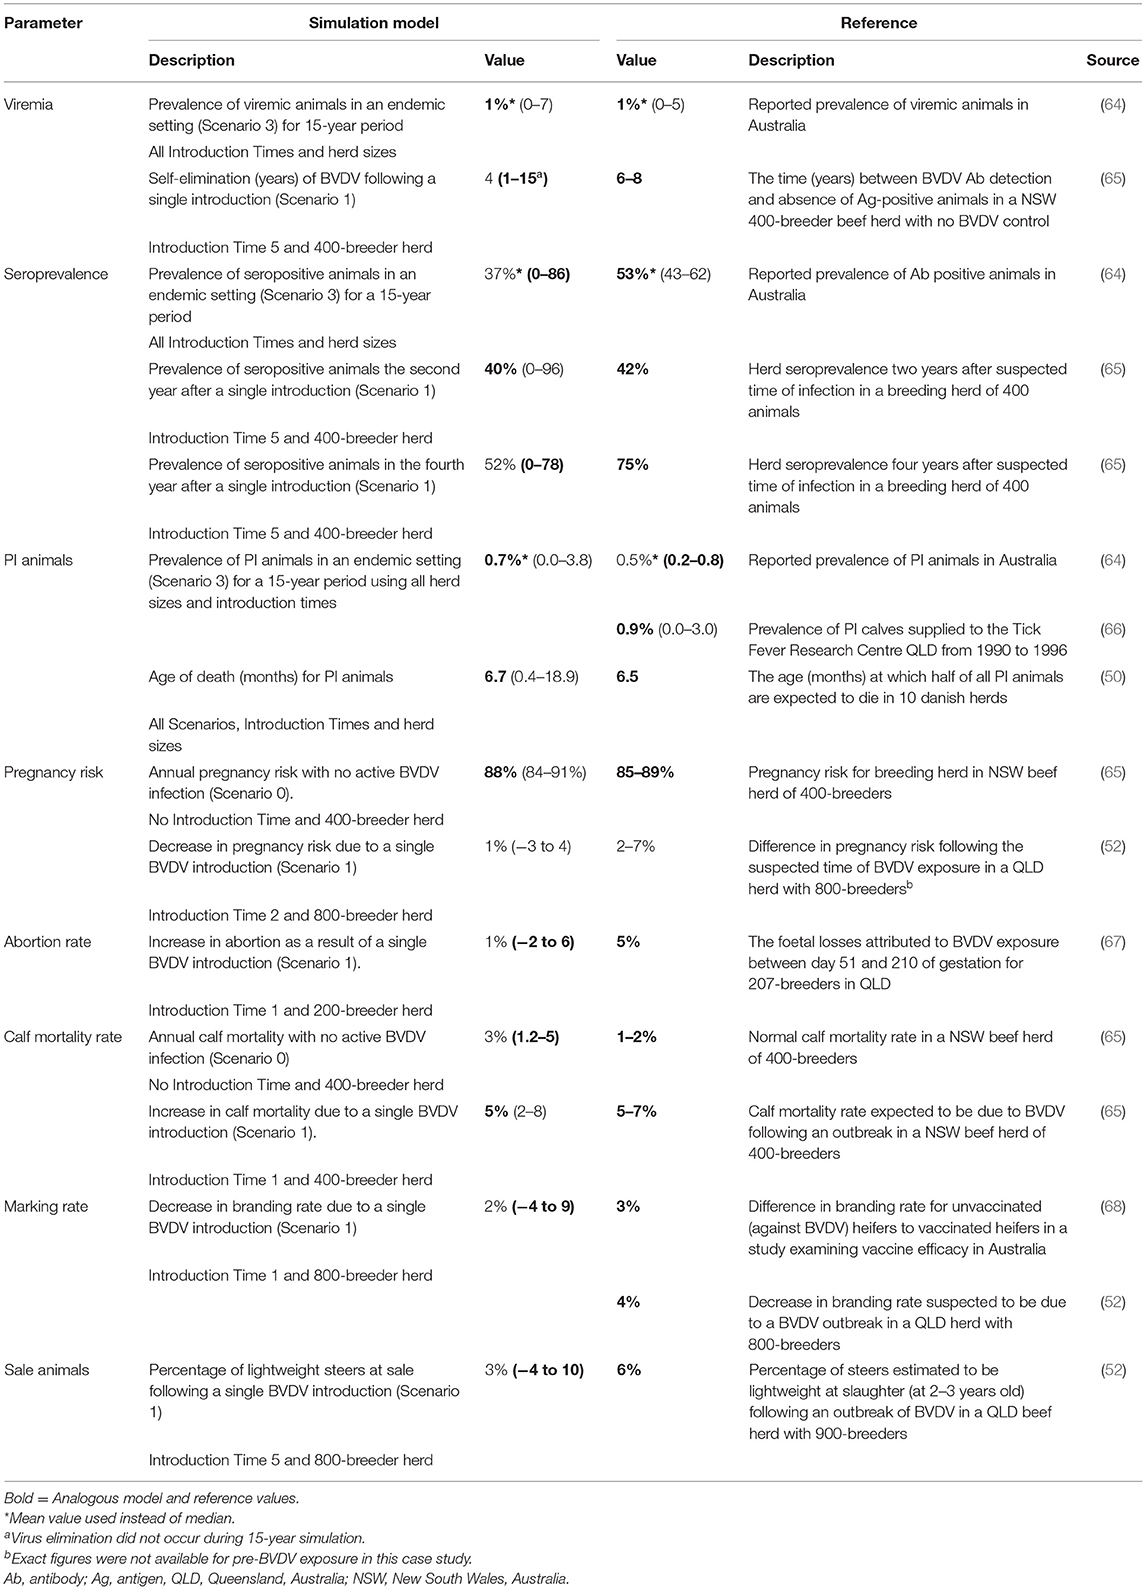
Table 5. Comparison of model outputs to corresponding values from the published literature for external validation of a within-herd BVDV simulation model. All model outputs are presented as median (95% range) unless otherwise indicated.
Sensitivity Analysis
Sensitivity analysis was conducted using Scenario 1 (most variation in model outputs). Scatter plots indicated no evidence of collinearity and so all parameters in Supplementary Table 4 were included in the analysis. The influence of the input parameters on model outputs of interest are illustrated in Supplementary Figures 5–10. Introduction time of the virus, breeding herd size and the number of effective contacts for PI animals resulted in the most variation in the total number of animals infected over 15 years. The adult mortality rate and the calf mortality rate resulted in the greatest variation for the total number of steers sold, and annual calf mortality was also the biggest contributor to the total number of underweight steers sold. The number of heifers retained for breeding and the number of cows culled was most dependent on breeding herd size and the mortality rate of adult cattle. Apart from breeding herd size, all other input variables had a negligible impact on the total number of bulls purchased in the simulation period.
Discussion
The individual producer is solely responsible for the prevention and control of BVDV in Australia. This novel disease simulation model reflects the impact of BVDV in settings consistent with Australian beef production at the individual farm level. Convergence testing demonstrated stability in all of the model outputs, illustrating little variation between simulations. Model outputs indicated that a single BVDV incursion is likely to cause the birth of at least one PI animal (meaning that infection is established in the herd) in ~60% of all simulations. The timing of BVDV introduction in relation to the production calendar had the most influence on establishment, which was most likely for the 73 days prior to joining through to 146 days after the joining period. This is recognized as the highest risk period for persistent infection in developing fetuses (8, 69, 70). Introduction of animals is one of the main pathways in which BVDV can enter a herd and it is common for Australian beef producers to purchase breeding animals (such as bulls or replacement heifers) in conjunction with the joining period (27). This model demonstrates that an established BVDV outbreak is likely to occur in a beef farm with no preventative measures in place, especially when replacement practices coincide with joining.
Once BVDV has become established in a beef herd, the model demonstrates that herd size characterizes the severity and length of the outbreak. The proportion of animals in the simulated farm that were viremic at the peak of infection had an inverse relationship to breeding herd size; however, the distribution of MCs in simulated paddocks may have contributed to these results. The number of MCs in each paddock is fixed in this model, based on the bull-to-cow ratio. Smaller herds will have a higher proportion of breeding animals in a single paddock when compared to a large herd, in which the breeding herd is spread across multiple paddocks. BVDV transmission within a paddock will initially result in a higher proportion of infected animals in a smaller herd. Transmission within a paddock diminishes over time as animals become immune to infection and so, transmission between paddocks becomes responsible for BVDV persistence within the farm. Therefore, the duration of a BVDV outbreak in the model increased as herd size increased. A herd of 50-breeders had a maximum outbreak duration of 8 years following a single introduction, compared to an 800-breeder herd, in which 23% of outbreaks continued after 15 years. In reality, it is reasonable to assume that larger farms would consist of more paddocks than those with smaller herds to achieve ideal stocking rates to maximize production (71). The relationship between herd size, outbreak severity and virus persistence demonstrated by the results of this study suggest that timely elimination of BVDV may require less intervention in smaller herds.
While the median duration of BVDV outbreak in the simulated 400-breeder herd (4 years) was shorter than that reported for a similar sized Australian outbreak, the 95% range included the published values for elimination time [6–8 years; Allworth et al. (65)]. In the case study, Allworth et al. (65) speculates that BVDV was introduced into the NSW farm via breeding stock. It was not possible to ascertain the infection status of these animals retrospectively, and it is possible that introduction of multiple infected animals may have contributed to a longer time to elimination. In addition to elimination time, data from the model for the 400-breeder herd showed that the 2-and 4-year seroprevalence in the 73-day period prior to joining were comparable to the values reported by Allworth et al. (65). The model also demonstrated that the highest daily prevalence of viremia following subsequent BVDV introductions became lower as herd seroprevalence increases; a relationship which is well recognized in the literature (11). These examples, as well as those found in Table 5, further validate the disease transmission component of the BVDV simulation model described in this study.
Dairy, intensive beef and extensive beef farming operations require different approaches to BVDV detection and prevention as a result of variations in farm management (20, 21, 69, 72). Due to the subclinical nature of BVDV, in most cases interventions on an individual farming level are not considered until an effect on production is identified (73–75). In Australia there is minimal contact between beef producers and cattle between management events and so producers are unlikely to recognize a subtle drop in annual production (76). The annual impact of BVDV on pregnancy loss, abortion and calf mortality recorded by the simulation model was modest, even at its highest following initial exposure of a naïve herd. However, the study demonstrated that the impact of repeat BVDV incursions as little as every three years can result in long-term impacts that would affect beef farm productivity; in particular the number of steers sold and the liveweight of those steers. Economic analysis is needed to determine whether these long-term production impacts reduce farm revenue enough to prompt action by the producer.
Long et al. (77) found that BVDV is of low concern to 68% of Australian beef producers, with other diseases and management issues taking priority. Motivating producers to address BVDV is a challenge that is not specific to Australia (75, 78). Apart from undetected losses, difficulty in communicating the negative impacts of BVDV to stakeholders is partly due to the wide variation in outcomes that could occur during an outbreak of BVDV. Poor conception and reduced pregnancy risks are often identified during BVDV outbreaks (70); however, this study, consistent with Allworth et al. (65), found that the pregnancy risk in a herd of 400 animals was largely unaffected by BVDV. The joining practices used in this model and described by Allworth et al. (65) are similar to industry-recommended joining practices for seasonal calving beef herds in NSW (McConchie 2007, MLA 2019). These short duration joining periods are designed to limit infertility and might also reduce the apparent reproductive effects of BVDV infection. If pregnancy risks are unaffected, this could explain the marginal impact of simulated BVDV infection on culling rates, which are largely dictated by pregnancy status (46). Given the aforementioned relationship between the timing of reproductive practices and disease behavior, any discrepancies between the reproductive results of this study and the published effects of BVDV could be due to differences in reproductive management and/or model uncertainty; both of which should be considered when interpreting model outcomes. However, the model has identified a range of possible consequences of BVDV infection that might be used as best- and worst-case scenarios to inform decision-making for seasonal-calving Australian beef farms.
A limitation of this model is an inability to account for the impact of secondary infections that may exacerbate the effects of BVDV. Immunosuppression is a documented consequence of BVDV infection that is suggested to facilitate secondary infections that may increase abortion, calf mortality and reduce growth performance (79–81). In this study, immunosuppression only affects growth rate and therefore, it is likely that the model underestimates the impact that BVDV might have on productivity in the field. Another limitation of the model is the use of a NZ parameter for BVDV transmission. Whilst this is based on extensive production, it should be noted that this model does not account for the effect of the Australian climate on virus survival. Furthermore, a limitation of individual-based models is the assumption of homogenous mixing between animals within a group. However, in reality, beef cattle exhibit a social hierarchy which results in clustering of animals within a group which might affect disease transmission (82). Future studies modeling BVDV in Australia would benefit from serological data which could be used to identify transmission characteristics of the disease specific to the Australian environment.
Using simulation modeling, this study described the impact of BVDV on a farm characteristic of Australian beef farming. Exposure to BVDV is most likely to cause an outbreak when the virus is introduced in conjunction with the breeding period and there is a high (60%) likelihood that BVDV will be established in a beef herd after the introduction of a single PI animal. The initial impact of a BVDV outbreak will be more severe in smaller beef herds; however, the virus takes longer to self-eliminate as herd size increases. The model can measure the underlying production losses that can occur from long-term outbreaks of BVDV which might otherwise go unnoticed in the field; however, economic analysis is required to determine the financial implications of BVDV in Australian beef production. Future studies can use this model to investigate BVDV prevention strategies for Australian beef farms.
Data Availability Statement
The raw data supporting the conclusions of this article will be made available by the authors, without undue reservation.
Author Contributions
The study was designed by JF, VB, MH-J, JM and YM as part of a PhD project. Modeling and data analysis were performed by JF, with assistance from VB, CK, and TH. All authors read and approved the final manuscript.
Funding
This study is part of a PhD project that was supported by an Australian Research Training Program (ARTP) scholarship, with a top-up from the Graham Centre for Agricultural Innovation and Meat and Livestock Australia Ltd. There was no involvement of the funding sources in the study design, collection or analysis of data, interpretation of results, or the decision to submit the article for publication.
Conflict of Interest
The authors declare that the research was conducted in the absence of any commercial or financial relationships that could be construed as a potential conflict of interest.
Publisher's Note
All claims expressed in this article are solely those of the authors and do not necessarily represent those of their affiliated organizations, or those of the publisher, the editors and the reviewers. Any product that may be evaluated in this article, or claim that may be made by its manufacturer, is not guaranteed or endorsed by the publisher.
Acknowledgments
The authors thank Bruce Allworth for reviewing the beef production calendar and providing advice on current practices of beef farming in NSW. We also thank Alessandro Foddai for providing us with his Danish BVDV dairy model which assisted us in the initial modeling phase.
Supplementary Material
The Supplementary Material for this article can be found online at: https://www.frontiersin.org/articles/10.3389/fvets.2021.795575/full#supplementary-material
Abbreviations
BVDV, bovine viral diarrhea virus; PI, persistently infected; TI, transiently infected; NSW, New South Wales; B, bulls; CC, cull cows; WS, weaned steers; WH, weaned heifers; FC, first-calving cows; MC, mature cows; CF, calf at foot; BRD, bovine respiratory disease; GAM, generalized additive mixed; CV, coefficient of variation; NZ, New Zealand.
References
1. Lane J, Jubb T, Shephard R, Webb-Ware J, Fordyce G. Priority List of Endemic Diseases for the Red Meat Industries. North Sydney: Meat & Livestock Australia Limited (2015).
2. Lanyon SR, Hill FI, Reichel MP, Brownlie J. Bovine viral diarrhoea: Pathogenesis and diagnosis. Vet J. (2014) 199:201–9. doi: 10.1016/j.tvjl.2013.07.024
3. Kirkland PD, Fordyce G, Holroyd R, Taylor J, McGowan MR. Impact of Infectious Diseases on Beef Cattle Reproduction. North Sydney: Meat & Livestock Australia Limited (2012).
4. St George TD, Snowdon WA, Parsonson IM, French EL. A serological survey of mucosal disease and infectious bovine rhinotracheitis in cattle in Australia and New Guinea. Aust Vet J. (1967) 43:549–56. doi: 10.1111/j.1751-0813.1967.tb04799.x
5. Grooms DL. Reproductive consequences of infection with bovine viral diarrhea virus. Vet Clin North Am Food Anim Pract. (2004) 20:5–19. doi: 10.1016/j.cvfa.2003.11.006
6. Brownlie J, Clarke M, Howard C, Pocock D. Pathogenesis and epidemiology of bovine virus diarrhoea virus infection of cattle. Ann Recher Vet. (1987) 18:157–66.
7. Ezanno P, Fourichon C, Viet A-F, Seegers H. Sensitivity analysis to identify key-parameters in modelling the spread of bovine viral diarrhoea virus in a dairy herd. Prev Vet Med. (2007) 80:49–64. doi: 10.1016/j.prevetmed.2007.01.005
8. Houe H. Epidemiological features and economical importance of bovine virus diarrhoea virus (BVDV) infections. Vet Microbiol. (1999) 64:89–107. doi: 10.1016/S0378-1135(98)00262-4
9. Lindberg A, Houe H. Characteristics in the epidemiology of bovine viral diarrhea virus (BVDV) of relevance to control. Prev Vet Med. (2005) 72:55–73. doi: 10.1016/j.prevetmed.2005.07.018
10. Houe H, Pedersen KM, Meyling A. The effect of bovine virus diarrhoea virus infection on conception rate. Prev Vet Med. (1993) 15:117–23. doi: 10.1016/0167-5877(93)90107-5
11. Reichel MP, Lanyon SR, Hill FI. Perspectives on current challenges and opportunities for bovine viral diarrhoea virus eradication in Australia and New Zealand. Pathogens. (2018) 7:14. doi: 10.3390/pathogens7010014
12. Meat & Livestock Australia. State of the Industry Report 2018: The Australian Red Meat and Livestock Industry. North Sydney: Meat & Livestock Australia (2018).
13. World Organisation for Animal Health (OIE). OIE-Listed Diseases, Infections and Infestations in Force in 2020. (2020). Available online at: https://www.oie.int/animal-health-in-the-world/oie-listed-diseases-2020/ (accessed May, 2021).
14. World Trade Organization (WTO). Understanding the WTO Agreement on Sanitary and Phytosanitary Measures. (1998). Available online at: https://www.wto.org/english/tratop_e/sps_e/spsund_e.htm (accessed May, 2021).
15. Moennig V, Becher P. Control of bovine viral diarrhea. Pathogens. (2018) 7:29. doi: 10.3390/pathogens7010029
16. Iotti B, Valdano E, Savini L, Candeloro L, Giovannini A, Rosati S, et al. Farm productive contexts and the dynamics of bovine viral diarrhea (BVD) transmission. Prev Vet Med. (2019) 165:23–33. doi: 10.1016/j.prevetmed.2019.02.001
17. Shortall O, Green M, Brennan M, Wapenaar W, Kaler J. Exploring expert opinion on the practicality and effectiveness of biosecurity measures on dairy farms in the United Kingdom using choice modeling. J Dairy Sci. (2017) 100:2225–39. doi: 10.3168/jds.2016-11435
18. Qi L, Beaunée G, Arnoux S, Dutta BL, Joly A, Vergu E, et al. Neighborhood contacts and trade movements drive the regional spread of bovine viral diarrhoea virus (BVDV). Vet Res. (2019) 50:30. doi: 10.1186/s13567-019-0647-x
19. Sekiguchi S, Presi P, Omori R, Staerk K, Schuppers M, Isoda N, et al. Evaluation of bovine viral diarrhoea virus control strategies in dairy herds in Hokkaido, Japan, using stochastic modelling. Transbound Emerg Dis. (2018) 65:e135–e44. doi: 10.1111/tbed.12693
20. Damman A, Viet A-F, Arnoux S, Guerrier-Chatellet M-C, Petit E, Ezanno P. Modelling the spread of bovine viral diarrhea virus (BVDV) in a beef cattle herd and its impact on herd productivity. Vet Res. (2015) 46:12. doi: 10.1186/s13567-015-0145-8
21. Gunn GJ, Stott AW, Humphry RW. Modelling and costing BVD outbreaks in beef herds. Vet J. (2004) 167:143–9. doi: 10.1016/S1090-0233(03)00112-6
22. Nickell JS, White BJ, Larson RL, Renter DG, Sanderson MW. A simulation model to quantify the value of implementing whole-herd bovine viral diarrhea virus testing strategies in beef cow–calf herds. J Vet Diagn Investig. (2011) 23:194–205. doi: 10.1177/104063871102300202
23. Smith RL, Sanderson MW, Renter DG, Larson RL, White BJ, A. stochastic model to assess the risk of introduction of bovine viral diarrhea virus to beef cow–calf herds. Prev Vet Med. (2009) 88:101–8. doi: 10.1016/j.prevetmed.2008.08.006
24. Stott AW, Humphry RW, Gunn GJ, Higgins I, Hennessy T, O'Flaherty J, et al. Predicted costs and benefits of eradicating BVDV from Ireland. Irish Vet J. (2012) 65:12. doi: 10.1186/2046-0481-65-12
25. Han J-H, Weston JF, Heuer C, Gates MC. Modelling the economics of bovine viral diarrhoea virus control in pastoral dairy and beef cattle herds. Prev Vet Med. (2020) 182:105092. doi: 10.1016/j.prevetmed.2020.105092
26. R Core Team,. R: A Language Environment for Statistical Computing. Vienna, Austria: R Foundation for Statistical Computing (2018). Available online at: https://www.R-project.org/ (accessed July 2019).
27. Britton A,. Beef Calendar of Operations: New South Wales South Coast. (2016). Available online at: https://www.lls.nsw.gov.au/__data/assets/pdf_file/0006/1273848/SELLS-Beef-Calendar-Final-version.pdf (accessed January 2020).
28. Meat & Livestock Australia,. Farm survey data for the beef, slaughter lambs sheep industries: ABARES. (2020). Available online at: http://apps.agriculture.gov.au/mla/ (accessed April 2020).
29. Department of Primary Industries Regional Development (WA). Managing the Beef Breeder Herd in Southern Western Australia. (2017). Available online at:https://www.agric.wa.gov.au/management-reproduction/managing-breeder-herd-southern-western-australia (accessed July 2020).
30. NSW Department of Primary Industries. Yearling Bulls—Tapping Their Immense Potential. (2019). Available online at: https://www.dpi.nsw.gov.au/animals-and-livestock/beef-cattle/breeding/bull-selection/yearling-bulls (accessed April 2020).
31. Exton S. Economic Advantages of Better Management of Your Beef Breeding Herd. Orange, NSW: NSW Department of Primary Industries (2007).
32. Meat & Livestock Australia,. Cattle Breeding Guide: A Guide to the Management for Breeding Cattle in South-East Asia. North Sydney: Meat & Livestock Australia Limited (2010). Available online at: https://livecorp.com.au/publication/63KqjrlEQDVk33PuPtQiVL (accessed November, 2021).
33. Han J-H, Weston JF, Heuer C, Gates MC. Estimation of the within-herd transmission rates of bovine viral diarrhoea virus in extensively grazed beef cattle herds. Vet Res. (2019) 50:103. doi: 10.1186/s13567-019-0723-2
34. University of Nebraska-Lincoln. Pregnant Cows, Timing of Pregnancy, Open Cows, Pregnancy Rate. (2019). Available online at: https://beef.unl.edu/faq/pregnant-cows (accessed April 2020).
35. Barbudo AV, Gunn GJ, Stott AW. Combining models to examine the financial impact of infertility caused by bovine viral diarrhoea in Scottish beef suckler herds. J Agric Sci. (2008) 146:621–32. doi: 10.1017/S0021859608008113
36. Foddai A, Enøe C, Krogh K, Stockmarr A, Halasa T. Stochastic simulation modeling to determine time to detect Bovine Viral Diarrhea antibodies in bulk tank milk. Prev Vet Med. (2014) 117:149–59. doi: 10.1016/j.prevetmed.2014.07.007
37. Gates MC, Humphry RW, Gunn GJ, Woolhouse MEJ. Not all cows are epidemiologically equal: quantifying the risks of bovine viral diarrhoea virus (BVDV) transmission through cattle movements. Vet Res. (2014) 45:1–15. doi: 10.1186/s13567-014-0110-y
38. Muñoz-Zanzi CA, Thurmond MC, Hietala SK. Effect of bovine viral diarrhea virus infection on fertility of dairy heifers. Theriogenology. (2004) 61:1085–99. doi: 10.1016/j.theriogenology.2003.06.003
39. Shephard R. Modelling the Impact of BVDV in Australian Dairy Farms: Using BVDV Farm Model V 1.0. Maffra. Victoria: Herd Health Pty Ltd. (2018).
40. Ridpath JF. The contribution of infections with bovine viral diarrhea viruses to bovine respiratory disease. Vet Clin North Am Food Anim Pract. (2010) 26:335–48. doi: 10.1016/j.cvfa.2010.04.003
41. Smith RL, Sanderson MW, Renter DG, Larson R, White B, A. stochastic risk-analysis model for the spread of bovine viral diarrhea virus after introduction to naïve cow–calf herds. Prev Vet Med. (2010) 95:86–98. doi: 10.1016/j.prevetmed.2010.02.009
42. Henderson A, Perkins N, Banney S. Breeder Mortality: Determining Property-Level Rates of Breeder Mortality in Northern Australia: Literature Review. North Sydney: Meat & Livestock Australia Limited (2013).
43. NSW Department of Primary Industries. Livestock Gross Margin Budgets. (2019). Available online at: https://www.dpi.nsw.gov.au/agriculture/budgets/livestock (accessed July 2020).
44. McCormick BJJ, Stott AW, Brülisauer F, Vosough Ahmadi B, Gunn GJ. An integrated approach to assessing the viability of eradicating BVD in Scottish beef suckler herds. Vet Microbiol. (2010) 142:129–36. doi: 10.1016/j.vetmic.2009.09.053
45. McConochie J. Selecting and Managing Beef Heifers. Walgett, NSW: Department of Primary Industries (2007).
46. Meat & Livestock Australia,. Weaner Throughput. (2019). Available online at: https://mbfp.mla.com.au/siteassets/cattle-genetics/weaner-throughput.pdf (accessed April 2020).
47. Bindaree Food Group,. Myola Feeder Grid #30-20. (2020). Available online at: https://www.bindareefoodgroup.com.au/grid (accessed July 2020).
48. Vynnycky E, White RG. An Introduction to Infectious Disease Modelling. New York: Oxford University Press (2010).
49. Viet A-F, Fourichon C, Seegers H, Jacob C, Guihenneuc-Jouyaux C. A model of the spread of the bovine viral-diarrhoea virus within a dairy herd. Prev Vet Med. (2004) 63:211–36. doi: 10.1016/j.prevetmed.2004.01.015
50. Houe H. Survivorship of animals persistently infected with bovine virus diarrhoea virus (BVDV). Prev Vet Med. (1993) 15:275–83. doi: 10.1016/0167-5877(93)90099-F
51. Duffell SJ, Harkness JW. Bovine virus diarrhoea-mucosal disease infection in cattle. Vet Rec. (1985) 117:240–5. doi: 10.1136/vr.117.10.240
52. Taylor LF, Rodwell BJ. Outbreak of foetal infection with bovine pestivirus in a central Queensland beef herd. Aust Vet J. (2001) 79:682–5. doi: 10.1111/j.1751-0813.2001.tb10670.x
53. Astiz S, Cogollos L, Loste JM, Aduriz G, Heras J, Cerviño M. Clinical picture of active bovine viral diarrhoea infection in commercial bovine productive systems. Anim Prod Sci. (2017) 57:334–7. doi: 10.1071/AN15235
54. Martin SW, Nagy E, Armstrong D, Rosendal S. The associations of viral and mycoplasmal antibody titers with respiratory disease and weight gain in feedlot calves. Can Vet Jl. (1999) 40:560.
55. Baker JC. Clinical aspects of bovine virus diarrhoea virus infection. Rev Sci Tech. (1990) 9:25–41. doi: 10.20506/rst.9.1.492
56. Herd RM, Arthur PF. Lessons from the Australian experience. Feed Eff Beef Ind. (2012) 2012:61–73. doi: 10.1002/9781118392331.ch5
57. Funston RN, Musgrave JA, Meyer TL, Larson DM. Effect of calving distribution on beef cattle progeny performance. J Anim Sci. (2012) 90:5118–21. doi: 10.2527/jas.2012-5263
58. Agriculture Victoria,. Managing Heifers During After Calving. (2020). Available online at: https://agriculture.vic.gov.au/livestock-and-animals/beef/breeding/managing-heifers-during-and-after-calving (accessed November 2020).
59. Agriculture Victoria,. Calving Difficulty in Heifers. (2020). Available online at: https://agriculture.vic.gov.au/livestock-and-animals/beef/breeding/calving-difficulty-in-heifers (accessed November 2020).
60. Pinior B, Firth CL, Richter V, Lebl K, Trauffler M, Dzieciol M, et al. A systematic review of financial and economic assessments of bovine viral diarrhea virus (BVDV) prevention and mitigation activities worldwide. Prev Vet Med. (2017) 137:77–92. doi: 10.1016/j.prevetmed.2016.12.014
61. Taylor LF, Janzen ED, Van Donkersgoed J. Losses over a 2-year period associated with fetal infection with the bovine viral diarrhea virus in a beef cow-calf herd in Saskatchewan. Can Vet J. (1997) 38:23–8. doi: 10.4141/cjas58-003
62. Brookes VJ, Dürr S, Ward MP. Rabies-induced behavioural changes are key to rabies persistence in dog populations: Investigation using a network-based model. PLoS Negl Trop Dis. (2019) 13:e0007739. doi: 10.1371/journal.pntd.0007739
63. Wood S. Generalized Additive Models: An Introduction with R. Boca Raton: Chapman and Hall/CRC (2017).
64. Scharnbock B, Roch F-F, Richter V, Funke C, Firth CL, Obritzhauser W, et al. A meta-analysis of bovine viral diarrhoea virus (BVDV) prevalences in the global cattle population. Sci Rep. (2018) 8:15. doi: 10.1038/s41598-018-32831-2
65. Allworth MB, Long R, Smith AK, Bergman EL, Hernández-Jover M. Introduction and elimination of Bovine Viral Diarrhoea Virus in a commercial beef herd: a case study. Aust Vet J. (2020) 98:596–601. doi: 10.1111/avj.13015
66. Bock RE, Rodwell BJ, McGowan MR. Detection of calves persistently infected with bovine pestivirus in a sample of dairy calves in south-eastern Queensland. Aust Vet J. (1997) 75:656–9. doi: 10.1111/j.1751-0813.1997.tb15364.x
67. McGowan MR, Kirkland PD, Rodwell BJ, Kerr DR, Carroll CL. A field investigation of the effects of bovine viral diarrhea virus infection around the time of insemination on the reproductive performance of cattle. Theriogenology. (1993) 39:443–9. doi: 10.1016/0093-691X(93)90387-K
68. Morton JM, Phillips NJ, Taylor LF, McGowan MR. Bovine viral diarrhoea virus in beef heifers in commercial herds in Australia: Mob-level seroprevalences and incidences of seroconversion, and vaccine efficacy. Aust Vet J. (2013) 91:517–24. doi: 10.1111/avj.12129 PubMed PMID: alma990002467400402357
69. Smith DR, Grotelueschen DM. Biosecurity and biocontainment of bovine viral diarrhea virus. Veterinary Clinics of North America: Food Animal Practice. (2004) 20:131–49. doi: 10.1016/j.cvfa.2003.11.008
70. McGowan MR, Kirkland PD, Richards SG, Littlejohns IR. Increased reproductive losses in cattle infected with bovine pestivirus around the time of insemination. Vet Rec. (1993) 133:39–43. doi: 10.1136/vr.133.2.39
71. Schulke B,. Stocking Rates, Productivity Profitability: FutureBeef. (2021). Available online at: https://futurebeef.com.au/knowledge-centre/stocking-rates-productivity-and-profitability/ (accessed August 2021).
72. Reichel MP, Wahl LC, Hill FI. Review of diagnostic procedures and approaches to infectious causes of reproductive failures of cattle in Australia and New Zealand. Front Vet Sci. (2018) 5:222. doi: 10.3389/fvets.2018.00222
73. Gates MC, Humphry RW, Gunn GJ. Associations between bovine viral diarrhoea virus (BVDV) seropositivity and performance indicators in beef suckler and dairy herds. Vet J. (2013) 198:631–7. doi: 10.1016/j.tvjl.2013.09.017
74. Lanyon SR, Anderson ML, Reichel MP. Survey of farmer knowledge and attitudes to endemic disease management in South Australia, with a focus on bovine viral diarrhoea (bovine pestivirus). Aust Vet J. (2015) 93:157–63. doi: 10.1111/avj.12316
75. Gates MC, Evans CA, Weston JF. Practices and opinions of New Zealand veterinarians regarding control of bovine viral diarrhoea. N Z Vet J. (2021) 69:274–84. doi: 10.1080/00480169.2021.1920511
76. Hernández-Jover M, Higgins V, Bryant M, Rast L, McShane C. Biosecurity and the management of emergency animal disease among commercial beef producers in New South Wales and Queensland (Australia). Prev Vet Med. (2016) 134:92–102. doi: 10.1016/j.prevetmed.2016.10.005
77. Long R, Allworth MB, Smith AK, Hayes L, Hernández-Jover M. Knowledge, attitudes and management of bovine viral diarrhoea virus among eastern Australian cattle producers: results from a 2013 cross-sectional study. Aust Vet J. (2020) 98:429–37. doi: 10.1111/avj.12988
78. Yarnall MJ, Thrusfield MV. Engaging veterinarians and farmers in eradicating bovine viral diarrhoea: a systematic review of economic impact. Vet Rec. (2017) 181:347. doi: 10.1136/vr.104370
79. Brodersen BW. Bovine Viral Diarrhea Virus Infections: Manifestations of Infection and Recent Advances in Understanding Pathogenesis and Control. Vet Pathol. (2014) 51:453–64. doi: 10.1177/0300985813520250
80. Kapil S, Walz PH, Wilkerson M, Minocha H. Immunity and immunosuppression. In: Goyal SM, Ridpath JF, editors. Bovine Viral Diarrhea Virus: Diagnosis, Management and Control. 1st ed. Iowa: Blackwell Publishing Professional (2005). p. 157–70.
81. Al-Kubati AAG, Hussen J, Kandeel M, Al-Mubarak AIA, Hemida MG. Recent advances on the bovine viral diarrhea virus molecular pathogenesis, immune response, and vaccines development. Front Vet Sci. (2021) 8:475. doi: 10.3389/fvets.2021.665128
Keywords: BVDV, simulation, model, Australia, beef, production, bovine, viral
Citation: Fountain J, Hernandez-Jover M, Kirkeby C, Halasa T, Manyweathers J, Maru Y and Brookes V (2021) Modeling the Effect of Bovine Viral Diarrhea Virus in Australian Beef Herds. Front. Vet. Sci. 8:795575. doi: 10.3389/fvets.2021.795575
Received: 15 October 2021; Accepted: 23 November 2021;
Published: 14 December 2021.
Edited by:
Heinzpeter Schwermer, Federal Food Safety and Veterinary Office (FSVO), SwitzerlandReviewed by:
Robert Larson, Kansas State University, United StatesHans-Hermann Thulke, Helmholtz Association of German Research Centres (HZ), Germany
Copyright © 2021 Fountain, Hernandez-Jover, Kirkeby, Halasa, Manyweathers, Maru and Brookes. This is an open-access article distributed under the terms of the Creative Commons Attribution License (CC BY). The use, distribution or reproduction in other forums is permitted, provided the original author(s) and the copyright owner(s) are credited and that the original publication in this journal is cited, in accordance with accepted academic practice. No use, distribution or reproduction is permitted which does not comply with these terms.
*Correspondence: Jake Fountain, jfountain@csu.edu.au