Multidimensional impacts from international agricultural research: Implications for research priorities
 Keith Fuglie
 Keith Wiebe
 Timothy B. Sulser
 Nicola Cenacchi
 Dirk Willenbockel
- 1U.S. Department of Agriculture, Economic Research Service, Washington, DC, United States
- 2International Food Policy Research Institute (IFPRI), Washington, DC, United States
- 3Institute of Development Studies, Brighton, United Kingdom
Investors in international agricultural research seek sustainable agri-food technologies that can potentially serve multiple objectives, including economic growth, food security, and sustainable use of natural resources. We employ quantitative economic models to examine the potential multi-dimensional impacts of agricultural productivity gains in the Global South. These models take into account behavior responses to agricultural technological change, i.e., how productivity changes may affect decisions on what to produce, trade, and consume. We compare potential impacts of productivity growth in different commodities and regions and assess implications along several impact dimensions, including economic and income growth, the population at risk of hunger, adequacy of protein and micronutrients in human diets, land and water use, and greenhouse gas emissions. Potential impacts vary widely by commodity group and by region. These results reveal strengths and potential tradeoffs of different R&D spending allocations, and can help inform decision-making about an optimal R&D portfolio that takes into account the multiple objectives of agricultural investments.
Introduction
Research investments in agriculture are a primary driver of productivity improvement and contribute significantly to the Millennium Development Goals (MDGs) of reducing poverty, eliminating hunger, and the sustainable use of natural resources. In the Global South, national governments are the primary investors in agricultural research and development (R&D), followed by the private sector and the CGIAR system of international agricultural research centers (Pardey et al., 2016). And while economic studies have found that on average, returns to investment in agricultural research have been high, there is also a wide range in the estimated rates of return across research programs and projects (Alston et al., 2000; Hurley et al., 2018). Since the impacts of the most successful agricultural research investments are large, misallocation of R&D resources to low impact programs or projects carries a high opportunity cost. However, predicting the future impacts of current research investments is highly uncertain. Moreover, the governments, donors and other stakeholders who fund and support agricultural research are usually concerned with more than just maximizing economic returns. They often have multiple objectives for their funding contributions—including equity, food security, nutrition, and environmental sustainability. Nonetheless, any R&D portfolio allocation requires making judgements, however uncertain and ill-informed, about how it will advance these objectives (Ruttan, 1982).
This paper provides a quantitative analysis of the potential impacts of a commodity-oriented R&D portfolio designed to raise the productivity of agricultural systems in the Global South. Commodity-oriented R&D occupies about 65% of the R&D personnel in these national agricultural research systems (ASTI, 2022), nearly 40% of global private spending on food and agricultural R&D (Fuglie, 2016), and about one-third of annual expenditures by the CGIAR (Alston et al., 2020). This analysis can assist in allocating investments in international and national agricultural research by identifying the commodities and production systems where productivity improvements have the greatest potential to advance societal welfare. Using quantitative modeling, the paper describes the potential impacts of commodity- and region-specific productivity growth on incomes, food security, nutrition, land and water use, and greenhouse gas (GHG) emissions from agriculture.
This quantitative analysis is based on simulations from a model of the global agri-food economy to project impacts of agricultural productivity growth out to 2030. It extends Wiebe et al. (2021), which focused on 20 food crops, to a broader set of crop and livestock commodities. Model simulations examine how changes in agricultural productivity might affect output, resource use, and prices, and take into account how producers and consumers respond to these changes. It provides quantitative assessments of how agricultural productivity growth in various commodities could impact incomes, poverty, undernutrition and natural resource use in developing countries in the coming decade. Applying the “parity rule” to these results—in which R&D is allocated among commodities or regions in proportion to anticipated benefits—suggests a way to move toward an efficient R&D portfolio, or one that achieves the greatest impact on desired outcomes given available funding for R&D. The results show that there are likely to be trade-offs among the multiple objectives for international agricultural R&D. Accelerating productivity growth (and R&D investment) in some commodities will likely have stronger effects on some objectives, like income growth, while productivity growth in other commodities may have stronger effects on other objectives, such as reducing hunger, saving land and water resource use or curbing greenhouse gas emissions from agriculture. Policy makers may need to balance R&D allocation decisions among these competing objectives or rely on other policy instruments to address them. Alston et al. (1995), for example, argue that an R&D reallocation that sacrifices economic growth to achieve more equity (or some other socially desirable objective) may not be efficient if other policy instruments can more effectively address the equity concern. The World Resources Institute (2019), for example, lays out a menu of policy options -including but not limited to raising agricultural productivity—that are likely to be needed to meet MDGs. In a recent paper, Fuglie et al. (2022a) show that while accelerating agricultural productivity growth in developing countries is likely to reduce land use change and greenhouse gas emissions, it would work better if done in conjunction with land policies that protected especially carbon-rich lands from conversion to agricultural uses. Similarly, food policies may be more effective than R&D investment in achieving nutritional goals for vulnerable populations (Gomez et al., 2013; Alston et al., 2016). Nonetheless, robust R&D spending that kept food prices low would likely reduce the cost of both environmental and food assistance interventions (Gomez et al., 2013; Fuglie et al., 2022a).
Materials and methods
As Ruttan (1982) noted, any research resource allocation process involves making judgements about two central questions: (1) What is the feasibility of developing technology or advancing knowledge if research resources are allocated to a particular commodity, resource, or problem area, and (2) What will be the value to society of the new technology or knowledge if the research is successful? The first question deals with the supply of technology with the second question focused on the demand for technology. While judgements about technical feasibility can best be answered by scientists working at the leading edge of these issues, informed answers about its demand and its potential societal impact and value require the use of formal economic analysis. The quantitative models and analysis in this paper provide information of particular relevance to the second question—the value of research if it successfully develops technologies and knowledge that are widely adopted.
One approach that has been used to allocate R&D resources across commodities is the parity model (Ruttan, 1982; Alston et al., 1995). According to the “parity rule,” R&D is allocated among commodities in proportion to their market value. 1 Since the highest returns to agricultural research will likely be for technologies that have wide potential use, it stands to reason that commodities, production systems, and problem areas with the largest economic significance should generally receive greater attention from (public or private) research and other investments. To reflect objectives other than economic growth, weighted-parity rules have sometimes been used. For example, Wiebe et al. (2021) and Fuglie et al. (2022b) weighted the value of commodities by the country-level prevalence of extreme poverty and child stunting to give greater weight to commodities important to countries with high measures of those attributes. These weighted commodity values were then used to derive weighted-parity rules to inform the allocation of resources in international agricultural research.
While the parity model is straightforward to apply, there are several reasons why it might not result in an efficient allocation of R&D resources. As Ruttan (1982) noted, differences in the technical feasibility of raising productivity across commodities are one reason. On the demand side, current market values of commodities may not fully reflect their social value, especially a decade or more into the future when today's R&D investments come to fruition through widespread technology adoption. For example, as per capita income rises in the Global South, consumer preferences are expected to diversify away from food staples to include more animal products, fruits, vegetables and processed foods. In addition, social and policy preferences value more than just maximizing economic or income growth. If some commodities use up relatively more (unpriced but scarce) environmental resources than others, market valuation may overstate their social value. Similarly, if policy makers have preferences for equity or hunger alleviation, and if some commodities are more important to low income or malnourished populations, then market values may understate their social values.2
This study uses the International Model for Policy Analysis of Agricultural Commodities and Trade (IMPACT) to explore multiple dimensions of impact from raising productivity in different commodities and regions in the Global South. Specifically, the IMPACT model is used to derive estimates of how changes in agricultural productivity in the target regions could affect incomes, the population at risk of hunger, per capita nutrient availability for protein, iron and zinc, use of land and water, and GHG emissions from agriculture. Impacts will depend on the magnitude of a productivity change, where the change takes place, and which commodities are affected. Ultimately, we are interested in observing which agricultural R&D investments are more likely to lower hunger, improve income and favor environmental indicators, whether the same investment scenario may benefit all dimensions, and if not, which scenarios perform better for which indicators.
The IMPACT simulation model is a system of models based on a partial equilibrium, multimarket economic model of the global agricultural economy that simulates national and international agricultural markets. Because increases in agricultural productivity can lead to lower local and global commodity and food prices, it affects behavior and incomes of not only producers but also consumers. Moreover, productivity increases in one country or region can affect welfare in other regions through changes in prices and trade. The IMPACT model accounts for how farmers and households alter their decisions on what to produce and consume, and how commodities are utilized and traded as incomes and prices change. Links to climate models, water models, and crop models support the integrated study of changing environmental, biophysical, and socioeconomic trends, allowing for in-depth analysis of a variety of critical issues of interest to policymakers at national, regional, and global levels. More information can be found at https://www.ifpri.org/project/ifpri-impact-model, and from the main documentation of the model (Robinson et al., 2015).
The analysis focuses on R&D allocation among crop and livestock commodities important to 103 developing countries in the Global South, which we call the “target area” (Figure 1). The target area includes countries in Southeast Asia, South Asia, West and Central Asia (except for Kazakhstan and the high income countries of the Arabian peninsula), Africa, and part of Latin America (excluding Brazil and southern cone countries). These countries are divided into the six regions depicted in Figure 1. The target area encompasses most of the low and middle-income countries in tropical and sub-tropical zones except for China and Brazil, which, because of their strong national agricultural research programs, are less dependent on international agricultural research investments that focus on the Global South.
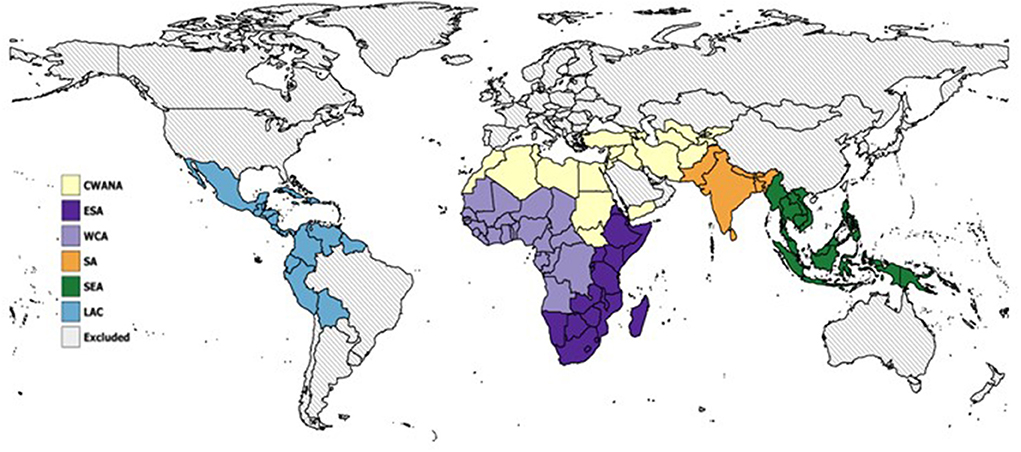
Figure 1. Global map showing countries and regions of interest. LAC, Latin America & Caribbean; CWANA, Central, West Asia & North Africa; WCA, Western & Central Africa; ESA, Eastern & Southern Africa; S Asia, South Asia; SE Asia, Southeast Asia & Pacific. The gray-hatched areas are excluded from the quantitative assessment but are part of the simulation framework as documented in Robinson et al. (2015). For some measures, ESA and WCA countries are grouped together into sub Saharan Africa (SSA).
The simulation model forecasts global food demand using income and population changes in 2030 based on the IPCC3 middle-of-the-road GDP and population scenario (SSP2) (O'Neill et al., 2014). In the baseline scenario, agricultural yields are held fixed at 2010 levels. The productivity investment scenarios then assume a 25% increase in productivity by 2030 and compare outcomes against the baseline scenario of no yield change. This rate of yield growth is comparable to what many commodities in this group of countries achieved over 2000–2019 (Table 1). Yield of cereal grains, for example, grew at an average annual rate of 1.46% for a cumulative yield growth of 34% over these 20 years. In livestock, yield of beef cattle increased by 27% and dairy yield per cow increased by 45%, while yield improvement in small ruminant meat and milk was considerably lower.
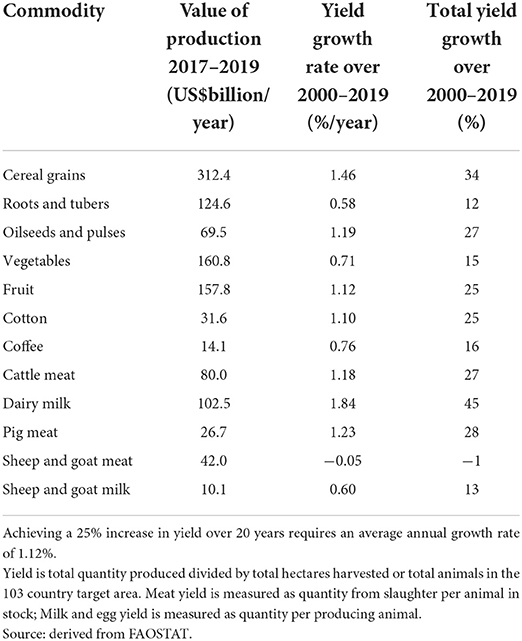
Table 1. Historical rates of commodity yield growth in the target countries.
A first set of scenarios focuses on increased productivity for different commodity groups; the second set simulates increased productivity across all commodities for different regions (Table 2). For example, for the Cereals crop productivity scenario we assume that R&D investments increase yields of cereal grains in the target area by 25% between 2010 and 2030. Yields for other commodities in the target area and yields for all crops in the rest of the world are held constant. Outcomes are compared against the baseline scenario of constant yield for all crops everywhere.4 The goal is to isolate and compare the impact of accelerating productivity growth in particular commodity groups in the target countries. However, final, equilibrium yields may differ from the target levels due to endogenous effects within the model, mainly through price changes and shifts in trade as markets adjust to different scenario conditions.
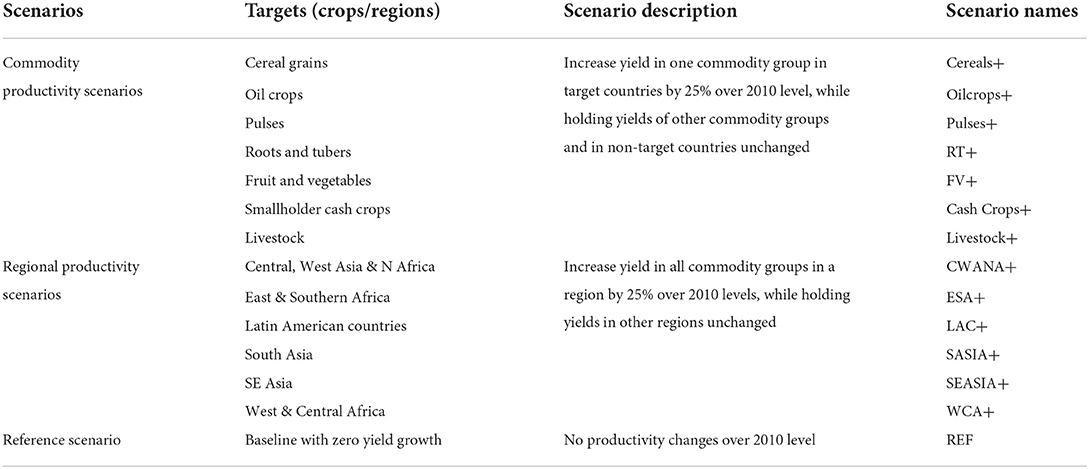
Table 2. Summary of productivity investment scenarios.
The regional productivity scenarios are built in the same general way: they explore the impact of targeting investments to each of the six CGIAR regions (CWANA, ESA, LAC, SA, SEA, WCA), one at a time. For each regional scenario, all the commodity groups in that region experience a 25% yield increase between 2010 and 2030, while yields for all commodities in all the other countries of the world are held constant.
While quantitative impacts are sensitive to the 25% yield growth assumption, the relative impacts across commodities and regions are not. Assuming a common productivity shock higher (lower) than 25% would raise (reduce) projected impacts, but the impacts would change by a similar scale across commodities and regions. Thus, results are robust for the purposes of comparing impacts of alternative R&D allocations among commodities and regions.
Measuring impact on economic or income growth
The IMPACT model is linked to the global dynamic computable general equilibrium model, GLOBE-Energy. The role of GLOBE within the framework of the project is to assess the macroeconomic income and welfare effects associated with the alternative scenarios (Willenbockel et al., 2018). GLOBE captures the multiplier effects of agricultural growth on the rest of the economy. Income in this modeling framework is represented by average annual gross domestic product (total and per capita). In practice, the outputs from a first run of the scenarios in IMPACT are used as input into GLOBE as shocks to total factor productivity. GLOBE then simulates the changes in GDP that may be expected when the productivity of agriculture increases, and the effects are transmitted to the wider economy. In turn, the changes in GDP act as exogenous input back into another iteration in IMPACT, thereby affecting agricultural production, demand, and ultimately food security.
Measuring impacts on the population at risk of hunger
Estimates of the population at risk of hunger are the main food security metric produced through IMPACT simulations. It is the share of a population consuming below a minimum caloric requirement. The estimation uses the FAO methodology (FAO, 2008), which is based on a strong empirical relationship between per capita food availability and the share of undernourished within a population. The methodology postulates a distribution of per capita caloric intake around the mean per capita caloric availability and integrates this density function up to the minimum caloric requirement. This gives the population share consuming below the minimum requirement. An increase in mean per capita caloric availability shifts the distribution and reduces the estimated share of the population consuming below the minimum requirement.
Measuring impacts on protein and micronutrient availability in human diets
Micronutrient modeling follows the nutrient accounting framework established in the IMPACT model described in Beach et al. (2019). The approach translates the GENuS database (Smith et al., 2016) into commodity-level nutrient content coefficients that represent average availability through per capita consumption. The core components of this accounting framework provide per capita nutrient availability at the country level (which can be aggregated up to larger geographies with population weights) and ratios of this availability to country-specific recommended nutrient intakes (RNI) across modeled scenarios. Data availability issues force a focus on protein, iron, and zinc, which are useful indicator nutrients to assess diets beyond simple calorie measures.
For this analysis, we extend the availability numbers from the Beach et al. (2019) approach into an additional metric intended to be more easily interpretable for policymaking. We used data and models established by Wessels and Brown (2012) to construct an estimate of the share of a country's population at risk of inadequate supply of dietary zinc5. The construction of zinc estimates in Wessels and Brown (2012) provides a consistent model of population level availability of dietary zinc compared to physiological requirements (“% [of] mean physiological requirement”), which is comparable to the RNI ratios from the Beach et al. (2019) approach. We estimate an elasticity (−0.84) of the relationship between the Wessels and Brown's (2012) “estimated % of population with inadequate zinc intake” with IMPACT's RNI ratio and use this to project the change in country level population at risk of inadequate dietary zinc intake.
Measuring impacts on land and water use
In IMPACT, cropland is estimated as harvested area, that is total area planted and harvested within a year (it may include multiple harvests on the same land in a year). The total land supply over time is driven by exogenous trends in the availability of area for agriculture, as well as endogenous responses to changes in area demand, which in IMPACT is a function of changes in commodity prices (Robinson et al., 2015). The exogenous trends in harvested area include changing land use intensity that allows for multicropping. The scenarios of increasing productivity used in this analysis are focused on yield per hectare (or animal) per year.
Estimates of water use rely on the communication between the core IMPACT multimarket model, the IMPACT water basin simulation model (IWSM), and the crop water allocation and stress (ICWASM) model (Robinson et al., 2015). Briefly, a global hydrology model (IGHM) simulates rainfall, evapotranspiration and runoff in each basin. These hydrologic outputs are fed into IWSM, which manages water basin storage, and optimizes irrigation water distribution in a watershed. The information on irrigated water supply enters ICWASM, and the model provides the IMPACT multimarket model with water stress-induced crop yield reductions for both irrigated and rainfed crops. In these steps, the model keeps track of the blue and green water use across rainfed and irrigated systems.
Measuring impacts on greenhouse gas emissions
The focus of this analysis is on direct on-farm agricultural emissions and emissions from land use change and the ensuing loss of carbon storage in soils and forests. All emissions estimates are converted to CO2 equivalents by multiplying the amount of GHG by the respective global warming potential.
For each scenario, we estimate CO2 emissions from loss of forested area due to the expansion of cropland, methane emissions (CH4) from rice cultivation and enteric emissions from livestock, and emissions of nitrous oxide (N2O) from the application of manure and synthetic fertilizer to cropland. The results are reported in terms of change from the baseline scenario. The calculations are based on the methodology developed by Rosegrant et al. (2017). We provide some description of the process below and refer to the methodology sections of these two references for additional details.
Emissions are estimated by post-processing the outputs of the IMPACT model. To estimate N2O emissions we used the IPCC Tier 1 default factors for direct N2O emissions arising from mineral N fertilizer application to managed soils (0.01 kg N2O-N per kg N fertilizer applied) and to irrigated rice (0.003 kg N2O-N per kg N fertilizer applied) (IPCC, 2006; Yan et al., 2009). These factors were multiplied by the N fertilizer consumption projected in IMPACT for each country and each crop/commodity (see Appendices F and H in Rosegrant et al., 2017). It is important to note that our estimates exclude the indirect N2O emissions from nitrogen leaching and runoff, and from atmospheric nitrogen deposition.
Estimates of CH4 emissions from rice cultivation derive from the combination of IPCC Tier 1 and 2 emission factors (as in Yan et al., 2009), with the crop yields projected by IMPACT. The CH4 emissions from rice production are first calculated for a unit of area and then multiplied by the rice production areas projected by IMPACT.
To estimate CH4 emissions from ruminants we multiplied the animal numbers projected in IMPACT (both slaughtered cattle and dairy animals) by the per-head emission value obtained from the enteric fermentation section of FAOSTAT (see also Appendix F in Rosegrant et al., 2017).
Finally, CO2 emissions were estimated from changes in land cover driven by expansion (or contraction) of crop harvested area and pastureland. We used simulations that linked IMPACT and the Landshift model to derive the relationship between changes in crop area and forest area (see especially Schaldach et al., 2011; Rosegrant et al., 2017). The estimated changes in land use driven by changes in area and livestock production were then combined with the Tier 1 GHG emissions coefficients for the relevant land use types to compute the estimated GHG emissions changes.
Results
The commodity productivity scenarios assume R&D investment generates a 25% increase in yields (kg of crop/ha, kg of meat/animal or kg of milk/animal/year) by 2030 compared with yields in 2010. In this first set of scenarios, the increase is simulated in one commodity group at a time across the entire set of target countries that are the focus of this analysis. Productivity of other commodity groups and in countries outside the target area is held fixed. The 25% yield increase affects the market price of the affected commodities as well as other commodities through substitution effects. As noted earlier, the simulation model takes into account how producers and consumers respond to the changes in prices and profitability induced by the increase in productivity. Following these adjustments, actual farm yields of affected commodities may change by more or less than 25%. Farm yields of commodities where productivity is held constant may also change since prices of those commodities are also affected. The purpose of this analysis is to determine the relative impacts of increasing productivity on one commodity group vs. another.
Table 3 summarizes results from the simulation model on the multi-dimension impacts of increasing agricultural productivity in seven commodity groups listed in Table 2. The columns show the impacts of commodity productivity on total income, the population at risk of hunger, GHG emissions from agriculture, land use and water use in the target area. For comparison, reference scenario values (projections in 2030 of income, population at risk of hunger, land use, etc., assuming no productivity growth) are provided in Appendix Table A1.
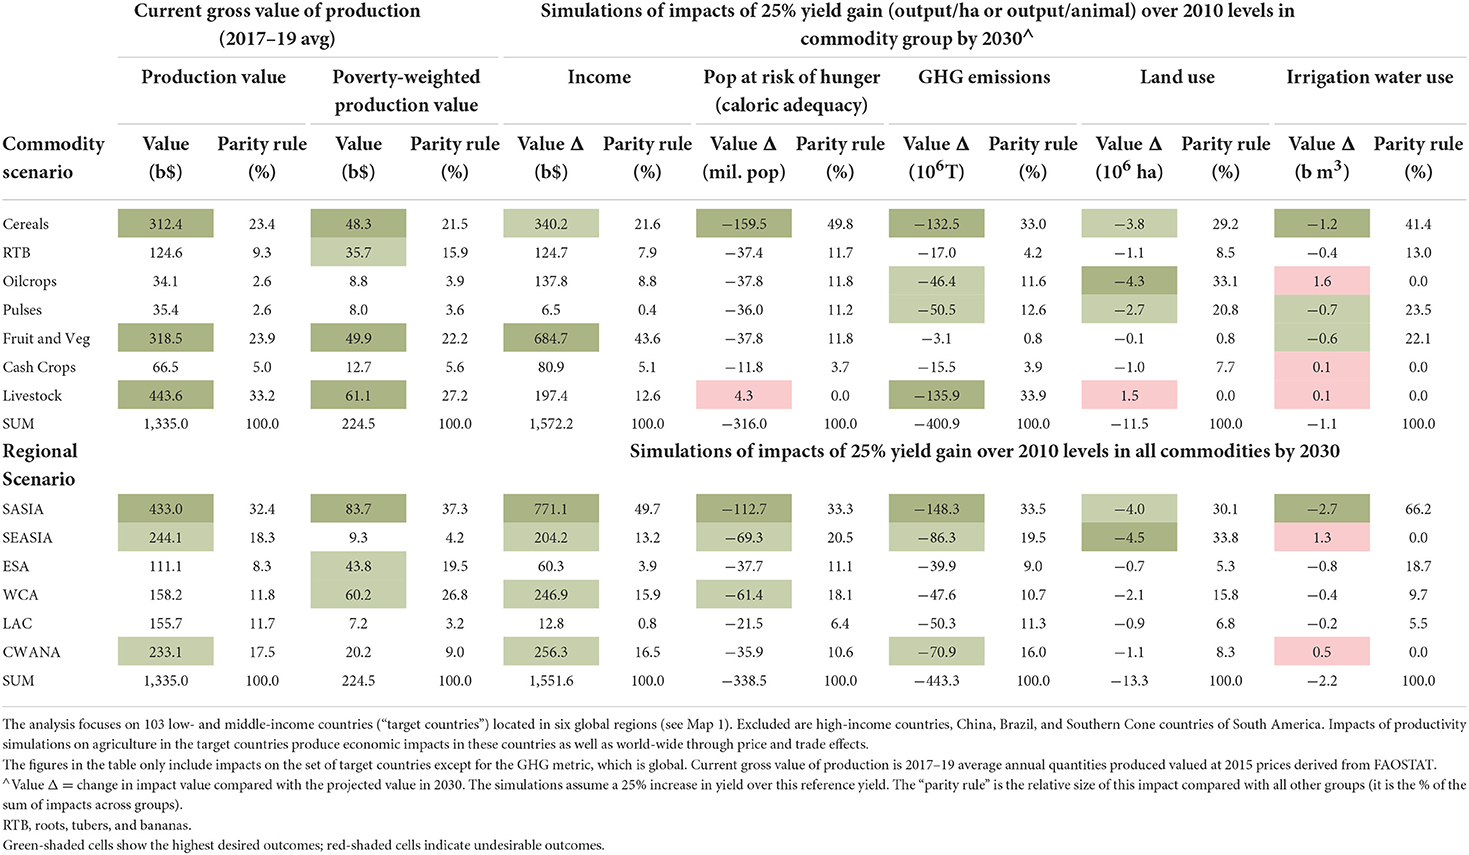
Table 3. Multi-dimensional impacts of increasing commodity and regional agricultural productivity in the target countries.
For comparative purposes, Table 3 includes the current value of production and poverty-weighted value of production from the parity model as reported in Fuglie et al. (2022b)6. If the economic impacts of commodity research are strongly correlated with the current economic value of the commodities, and if the R&D costs of raising productivity are roughly similar among commodities, then the value shares from the parity model indicate an efficient R&D allocation rule that is likely to maximize economic returns across the commodity R&D portfolio. With a couple of exceptions, the value shares of the commodity groups from the parity model are strongly correlated with the share of projected income gains from the simulation model. However, the simulation model indicates a relatively greater potential value for fruits and vegetables and less for livestock than the parity model. The higher potential value for fruits and vegetables may arise because of the strong growth in demand projected by the simulation model for these commodities. For livestock, the simulation model may better reflect the income gains from value-added activities in this sector. Since a large share of the final value of livestock is from crops used for animal feed, using the gross value of livestock output (which the parity model uses) may overstate the economic importance of this sector.
Impacts on income growth, population at risk of hunger, and natural resources
From the simulation model, the largest impacts on economic or income growth arise from an increase in the productivity of fruits and vegetables, followed by cereal grains. Productivity increases in fruits and vegetables are projected to make only small improvements in the other dimensions of impact, however. Productivity improvement in cereal grains is projected to have much larger impacts on decreasing the population at risk of hunger and conserving natural resources—reducing agricultural land, water use, and GHG emissions.
For each of these impact dimensions, the “parity rule” is applied to the simulation results to indicate how R&D might be allocated across commodity programs in order to maximize the impact of R&D on that objective. Figure 2 depicts the “R&D allocation parity rule” graphically for each of the impact dimensions. For example, an R&D allocation to maximize economic or income growth would allocate 22% of funds to cereal grains, 44% to fruits and vegetables, and the rest shared among the other commodities; a focus on hunger reduction would allocate nearly 50% of R&D just to cereals and only 12% to fruits and vegetables, while a sole emphasis on reducing GHG emissions would allocate 34% of R&D funds to livestock, 33% to cereal grains, and less than 1% to fruits and vegetables. A decision-maker wishing to address several of these objectives at once would need to balance the R&D portfolio allocation accordingly.
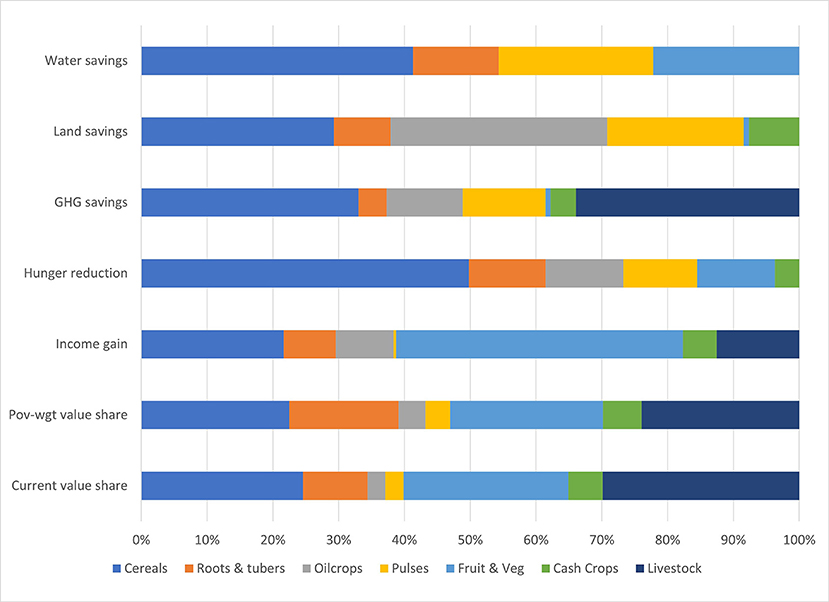
Figure 2. R&D allocation parity rule from commodity productivity increases. The parity rule is to allocate R&D in proportion to anticipated benefits or positive impacts. The colors of the bar chart show the relative size of the impacts from productivity growth in the respective commodity groups. The R&D allocation across commodities implied by the parity rule varies depending on policy preferences over type of impact. The figure draws from the estimates reported in Table 2.
The bottom half of Table 3 shows the effects of raising productivity of all commodities within a region. In these scenarios, productivity is increased in one region at a time and compared against the baseline scenario of no productivity change. This allows a comparison across regions of where agricultural productivity will have a relatively greater or lesser impact on the outcomes of interest. Although productivity growth is confined to one region, the resulting effects will be worldwide due to markets (e.g., price changes) and trade. The impacts reported in Table 3 include the total impact on the 103 countries in the target area but exclude impacts on the rest of the world. Note that the sum of the simulated impacts of the commodity scenarios is not equal to the sum of the impacts across regions. This is because the commodity and regional scenarios have different implications for prices, utilization and trade.
Agricultural productivity growth in South Asia has by far the largest impact on income growth and hunger reduction among the six regions, due to its relatively large agricultural sector and the size of its low-income, rural population. The South Asia scenario also resulted in a greater reduction in agricultural GHG emissions compared. Next in importance for food security impacts were West & Central Africa and Southeast Asia.
Some other results from Table 3 are worth highlighting:
• Productivity gains in livestock are projected by the simulation model to substantially reduce GHG emissions but could increase the population at risk of hunger. Ruminant livestock especially are a major source of GHG emissions from enteric fermentation, manure, and fertilizers used on feed crops. Productivity improvement in livestock lowers the prices of animal products while raising the prices for feed and food crops. Overall, the productivity gains reduce the number of animals needed to meet market demand, resulting in significantly fewer GHG emissions. The higher prices for crops, however, make these staples less affordable.
• Productivity growth in smallholder cash crops like coffee, cocoa and cotton is more important for income generation than hunger reduction. Since these crops are principally for export, they have little or no effect on domestic prices of food staples. Thus, beneficiaries of the income gains are primarily local producers rather than local consumers.
• The most significant reductions in agricultural land use come from productivity gains in crops that are grown over wide areas: namely, oilcrops, cereal grains, and pulses. Productivity gains in livestock, however, are projected to increase cropland in order to produce more feed.
• The most significant savings in water use come from productivity gains in crops that dominate irrigated areas: cereal grains, fruits and vegetables, and pulses. Productivity gains in oilcrops are projected to increase water use: higher productivity leads to less area in oilcrops which are then replaced by more water-intensive crops in irrigated areas.
The relative size of the impacts of agricultural productivity on income, hunger reduction and natural resource use is likely to vary by region and country (see the Appendix Tables A2–A7 for the regional breakdown of the impacts from the commodity productivity scenarios). These table allocate the impacts of the commodity scenarios among the six regions. Some highlights from the regional results include:
• Although improving agricultural productivity saves natural resources overall in the 103 countries, in some regions and for some crops, productivity gains increase emissions, land use, or water use;
• Productivity gains in fruits and vegetables are projected to be particularly important sources of income growth in South Asia, SE Asia, and CWANA;
• For West & Central Africa, improving the productivity of root and tuber crops ranks first for income growth and second for hunger reduction, behind cereal grains.
• For the Latin American countries included in the target area, raising the productivity of cash crops (primarily smallholder coffee) is more important than cereals as a source of income growth and for saving land.
Impacts on nutrient availability
Besides caloric intake (used to measure the population at risk of hunger), the simulation model assessed the impact of agricultural productivity on dietary intake of zinc, iron and protein across the commodity productivity scenarios. Zinc and iron are micronutrients, while protein along with carbohydrates and fat is classified by nutritionists as a macronutrient. Significant numbers of people in the target countries suffer adverse health consequences from inadequate dietary intake of all three nutrients (Global Nutrition Report, 2021). For protein, not only quantity but also quality (i.e., content of essential amino acids) is important for dietary health. However, this analysis only considers the quantity of protein in the diet.
The primary measure we use to assess the impact of productivity on nutrition is the change in its RNI ratio: the ratio between per capita daily availability of a nutrient in average diets and its Recommended Nutrient Intake (RNI). An RNI ratio of 1.00 implies that the per capita nutrient availability in the average diet just equals its RNI. For a population with an RNI ratio of 1.00, it is likely that half the population (those consuming less than average quantities of food per capita) will have inadequate nutrient availability and half the population (those consuming above average quantities of food) will have at least adequate availability of the nutrient in their diet. As RNI rises, a smaller share of the population will experience inadequate nutrient availability in their diet. For some nutrients, consuming significantly above the RNI may have harmful effects on health. For other nutrients, excess nutrients are either stored in the body or passed out as body waste.
For all three of these nutrients, increasing the productivity of cereal grains has by far the largest impact on raising dietary adequacy in the target area (Table 4). A 25% increase in cereals productivity increased the RNI ratio by more than 3% in the target countries, compared with less than 1% for productivity gains in the other commodities (Figure 3). For zinc, changes in dietary intake were also translated into changes in the population at risk from dietary inadequacy of this nutrient. Increasing the productivity of cereal grains was projected to reduce the population at risk from inadequate zinc by 40 million persons, about four times higher than the next best alternative, pulses, which would reduce the population at risk by just over 10 million people.
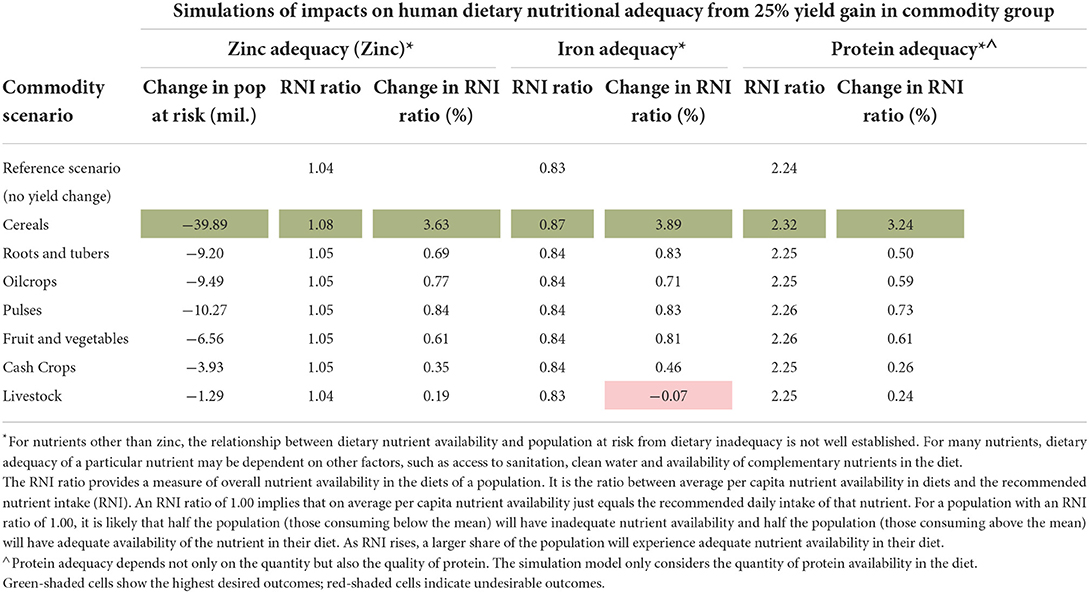
Table 4. Agricultural productivity and nutritional change in target countries.
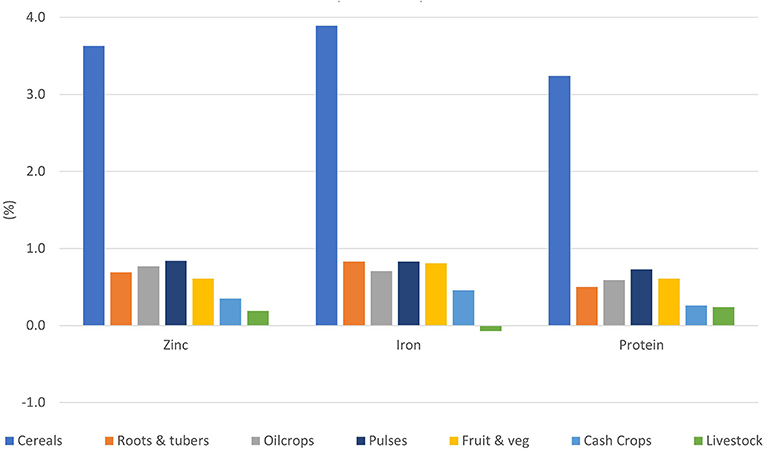
Figure 3. Changes in RNI ratios for protein, iron and zinc from increases in commodity productivity. The figure shows the percentage change in RNI ratios for three nutrients resulting from productivity growth in the respective commodity groups. The figure draws from results reported in Table 3.
One reason for the relatively large impact of cereals on nutrition is because these crops are a major source of not only carbohydrates but also protein and many micronutrients in diets. Another reason is that cereal grains typically account for share of expenditures by low-income households. Raising the productivity of staple foods lowers their price, making these foods more affordable and thus increasing real household purchasing power. This enables households to diversify their diets away from food staples to more income-elastic products like meat, dairy, fruits, and processed foods. For food staples with a high household expenditure share, a given percent decline in its price will have a larger effect on household purchasing power compared with other foods purchased by the household and allow for more dietary diversification.
How commodity productivity affects dietary composition is illustrated in Figure 4. The reference case (REF) shows the contribution of each food group to total calories consumed in an average diet in the target area assuming no productivity gains by 2030. The other bars show how diets change when the productivity of each commodity group is increased by 25% above the reference case. This estimate is derived by using empirical evidence on how consumers are likely to respond to changes in the relative prices of foods.
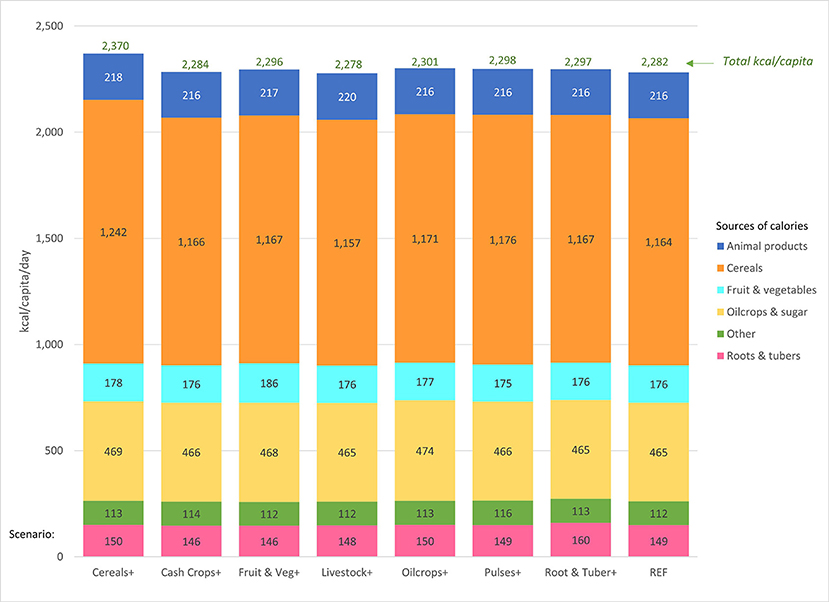
Figure 4. Sources of calories in the average consumer diet under commodity productivity scenarios. Scenario: commodity demand is based on population and income projections for 2030. The reference scenario (REF) holds commodity yields at 2010 levels. The other scenarios increase the yield of each commodity group by 25% over the 2010 yield level while holding yields of other commodities unchanged. Consumers adjust food consumption in response to relative price changes among commodities.
In all scenarios, cereal grains contribute about 51% of total calories, which rises to 52.4% (or 1,242 kcal/capita/day from cereals) when cereals productivity alone is increased. Note that raising productivity in one food group increases the consumption of all food groups. Raising cereals productivity, for example, increases the caloric contribution of fruits and vegetables from 176 kcal/capita/day to 178 kcal/capita/day.
Raising fruit and vegetable productivity has an even larger effect on that food group, raising its contribution to 186 kcal/capita/day. This is because the fruit and vegetable productivity gain lowers the relative price of these foods compared with other food groups. But because the expenditure share of fruits and vegetables is less than that of cereals, it has a smaller effect on the consumption of other food groups. Overall, productivity growth in fruits and vegetables results in a smaller increase in the RNI ratios of carbohydrates, protein, zinc and iron compared with the cereals scenario. Similarly, the livestock productivity scenario raises the number of calories from livestock products more than the other scenarios, but with a reduction in total calories compared with the reference scenario.
Simulated impacts of agricultural productivity on average dietary composition were also estimated for each region. In all regions, raising the productivity of cereal grains had the largest impact on total calories, protein, zinc, and iron consumed. Because results were similar across regions, results for individual regions are not included in the paper.
Essentially, the largest impacts on reducing macro and micronutrient inadequacy in diets occur when the average price of food declines the most. Since cereal grains make up the largest component of overall food price (and household expenditure share), raising productivity in cereals generates the largest gains in nutritional adequacy.
For middle- and upper-income countries, overconsumption of calorie-rich foods is contributing to rising rates of obesity and related health problems. These foods are often highly processed and designed for their convenience and taste. Food and nutrition policies and regulations can encourage the consumption of nutrient dense foods (defined as foods that have high nutrient content per calorie). For low and lower-middle income countries, underconsumption of macro and micronutrients affects a large share of the population and is the major driver of food insecurity and malnutrition. Agricultural R&D funding to lower the cost of the foods with the largest household budget share can significantly improve dietary adequacy and quality.
Discussion
Quantitative economic analysis provides a powerful set of tools for informing decisions about agricultural R&D priorities and funding allocation. While investment in international agricultural R&D has been shown to generate high returns on average, impacts are multidimensional and vary depending on the focus of the research undertaken. The analysis in this paper shows there are significant differences in potential impacts of productivity growth (and R&D investment) across agricultural commodities and regions in the Global South. Some commodities offer greater potential to increase economic or income growth, while productivity improvement in other commodities might have relatively greater effects on food security, nutrition or natural resource conservation. Which commodities offer the greater potential to advance objectives also depends on the region for which the research is undertaken.
Simulations of projected impacts from increasing productivity in different commodity groups in the target area (103 low- and middle-income countries spanning six regions covering Africa and parts of Asia and Latin America) reveal potential tradeoffs among research objectives of maximizing income growth, reducing hunger, improving nutrition, and conserving natural resources:
• Productivity increases in Fruits and Vegetables offer the highest contribution to income growth, closely followed by Cereal Grains.
• Productivity increases in Cereal Grains generate the largest reduction in the population at risk of hunger.
• Productivity increases in Cereal Grains result in the largest increase in per capita nutrient availability for protein, zinc, and iron (the only nutrients other than calories analyzed in the simulations).
• Productivity increases in Cereal Grains and Livestock offer the largest potential for reducing agricultural greenhouse gas emissions.
• Productivity increases in crop commodities are land sparing, with the largest land savings obtained by raising productivity of area-extensive crops (i.e., Cereal Grains, Oilcrops and Pulses).
• Comparing the R&D allocations suggested by the parity rule, productivity increases in Fruits and Vegetables, Livestock and smallholder Cash Crops have relatively greater potential to generate income growth than to reduce hunger: their parity percentages are higher under the “income” outcome than under the “population at risk of hunger” outcome.
• In the Latin American countries included in the analysis, Cash Crops (especially coffee) offer greater potential to generate income growth than cereal staples.
• In West & Central Africa, productivity increases in Roots and Tubers offer the highest potential among commodity groups to generate income gains while increasing productivity in Cereal Grains offers the greatest potential to reduce hunger.
Besides informing R&D allocation across programs and projects, the results in this report also shed light on important strategic questions currently facing international agricultural research. For example, one question is whether shifting R&D investment away from crop staples to fruits and vegetables would increase the dietary availability of key micronutrients. The quantitative models used in this study suggest that while demand for fruits and vegetables is growing rapidly and higher productivity of these crops offers significant potential to raise incomes of smallholder producers, investing in the productivity of cereal staples offers significantly greater opportunities to increase nutrient availability of protein, iron, and zinc (and possibly other micronutrients as well) in the diets of low-income consumers, as well as reduce the population at risk from hunger due to inadequate caloric intake.
A second concern facing funders of international agricultural R&D is whether investing in ruminant livestock productivity would exacerbate greenhouse gas (GHG) emissions from agriculture. While raising livestock productivity would likely reduce emissions per unit of meat and milk produced, it would also lower prices and thus stimulate more total demand for these products. Our quantitative analysis indicates that the net effects of raising productivity in ruminant livestock could significantly lower GHG emissions from agriculture. In fact, increasing the productivity of cereal grains and ruminant livestock would likely have the largest impact on reducing GHG emissions from agriculture in the target countries compared with productivity improvement in other commodities.
A third strategic question for international agricultural research is whether investing in small holder cash crops might offer significantly greater opportunities than food crops in raising incomes and reducing poverty and hunger. Our findings suggest that for comparable rates of productivity growth, smallholder cash crops like cocoa, cotton, and coffee generally offer less potential impact on income, nutrition, and natural resource conservation than productivity growth in staple food crops. However, in Central America and the Andes region of Latin America, raising the productivity of cash crops (especially coffee) may have as much or greater potential impact on income as raising the productivity of maize, a major food staple of the region.
The “answers” to these strategic questions are of course conditional on (and limited by) the quality of data and modeling assumptions used in the analysis. Results can be always challenged—and improved upon—with the development of better data and models. A key strength of these models, however, is that they consider how increases in agricultural productivity are likely to affect commodity prices, and how these price changes, in turn, may affect what producers choose to produce and what consumers choose to consume, while assuring that market supply equals market demand. Decision makers also need to consider that R&D investment is not the only policy instrument to address these multiple objectives. If other policies can more effectively address specific environmental concerns (e.g., land and water policies) or nutritional needs of vulnerable populations (such as food assistance policies), then reallocating R&D spending toward these ends may not be the most efficient policy choice, especially if it entails a significant reduction in economic growth (Alston et al., 2016).
One limitation of this analysis is that we only consider commodity-oriented research that raises productivity. We do not consider potential impacts of other kinds of food and agricultural research, including research on policies, food and nutrient, forestry and fisheries. Reardon et al. (2018) argue that rapid transformation of agri-food systems needs to take into account research and innovations in the entire agri-food value chain. However, there are good reasons for our focus on R&D to raise commodity productivity. For one, this is an area where public support is especially needed to develop locally adapted technologies. Innovations in food processing generally have stronger private sector incentives to develop and are easier to transfer across food systems and countries. Second, commodity-oriented international research has repeatedly demonstrated high returns, while evidence on returns to non-commodity agricultural research is considerably thinner (Renkow and Byerlee, 2010).
Another limitation of the approach used in this study to R&D prioritization is its singular focus on demand-side considerations. We have ignored potentially significant differences across commodities and regions in the R&D and extension costs to develop and disseminate new technologies to farmers. Fuglie et al. (2019) outline a number of features of an “enabling environment” that may constrain adoption of farm technologies, including adverse price policies, poor rural infrastructure, insecure land tenure, limited access to financial and insurance services, and low levels of education and extension services. However, these constraints are likely to be highly contextual and location-specific; taking into account these factors in R&D prioritization may be better addressed in the project selection stage of commodity research rather than at the programmatic stage of international R&D resource allocation (see Footnote 2).
A final point on optimizing resource allocation in international agricultural research is that it depends on having a transparent and consistent accounting system to track R&D investments. The CGIAR system, lacks a system for categorizing its research expenditures and it is hard to determine how much is being allocated to any commodity or other problem area (Thorton et al., 2022). Ideally, a research allocation accounting system should classify research expenditure and science-years across several criteria, including by commodity or resource, by problem area or activity, and by field of science, as well as by institution and location where the research is conducted. This would be an invaluable tool for evidence-based decision-making in the planning and management of international agricultural research.
Data availability statement
The raw data supporting the conclusions of this article will be made available by the authors, without undue reservation.
Author contributions
KF and KW contributed to conception and design of the study. KF, TS, NC, and DW performed statistical analysis. KF wrote the first draft of manuscript. KW, TS, and NC contributed to manuscript revision, read, and approved the submitted version. All authors contributed to the article and approved the submitted version.
Funding
This work was supported by the U.S. Agency for International Development and the U.S. Department of Agriculture.
Conflict of interest
The authors declare that the research was conducted in the absence of any commercial or financial relationships that could be construed as a potential conflict of interest.
Publisher's note
All claims expressed in this article are solely those of the authors and do not necessarily represent those of their affiliated organizations, or those of the publisher, the editors and the reviewers. Any product that may be evaluated in this article, or claim that may be made by its manufacturer, is not guaranteed or endorsed by the publisher.
Author disclaimer
The findings and conclusions in this report are those of the authors and should not be construed to represent any official USAID, USDA or U.S. Government determination or policy.
Supplementary material
The Supplementary Material for this article can be found online at: https://www.frontiersin.org/articles/10.3389/fsufs.2022.1031562/full#supplementary-material
Footnotes
1. ^The parity model is sometimes referred to as the “congruence model” where the ratio between commodity value and commodity R&D expenditure is defined as the “congruence ratio.” The parity rule is satisfied when congruence ratios are equated across commodities.
2. ^One approach to R&D prioritization that explicitly takes into account both technology supply and demand is ex ante benefit-cost analysis. This approach requires identification and quantification of location-specific constraints to productivity by commodity and detailed assessments of the cost and likelihood of success of alternative potential technical solutions. For international agricultural research, benefit-cost analysis may be better suited for project selection within commodity and systems research programs. See Pemsl et al. (2022) for an example of the use of ex ante benefit-cost analysis for project prioritization within CGIAR root, tuber and banana research programs.
3. ^IPCC is the Intergovernmental Panel on Climate Change.
4. ^Results for the baseline scenario (assuming no productivity growth between 2010 and 2030) are reported in Appendix Table A1. We do not report results of a scenario in which we shock productivity of all commodities worldwide, as our goal is not to predict world outcomes but rather to compare the relative impacts of raising productivity across commodities and developing regions. See Rosegrant et al. (2022) for an assessment of total agricultural R&D spending that may be needed to meet several MDG and climate goals for developing countries.
5. ^We also investigated the potential for developing this metric based on inadequate iron intake. However, the complexities of interacting co-determinants for iron adequacy for different segments of the population make this a much more complicated model.
6. ^Current gross value of production in Table 3 is the annual average quantity harvested in 2017–2019 in billions of metric tons multiplied by the global average farmgate prices in 2014–2016 international dollars per ton (FAOSTAT, 2021). Poverty-weighted values multiply each country's gross value of production by its $1.9/capita/year poverty rate (World Development Indicators, 2021) and aggregates these values by commodity across the target area and by region.
References
Alston, J. M., Chan-Kang, C., Marra, M. C., Pardey, P. G., and Wyatt, T. J. (2000). A Meta-Analysis of Rates of Return to Agricultural R&D: Ex Pede Herculem? Research Report 113. Washington, DC: International Food Policy Research Institute (IFPRI).
Alston, J. M., MacEwan, J. P., and Okrent, A. M. (2016). Effects of U.S. public agricultural R&D on U.S. obesity and its social costs. Appl. Econ. Perspect. Policy 38, 492–520. doi: 10.1093/aepp/ppw014
Alston, J. M., Norton, G. W., and Pardey, P. G. (1995). Science Under Scarcity: Principles and Practice for Agricultural Research Evaluation and Priority Setting. Ithaca, NY: Cornell University Press.
Alston, J. M., Pardey, P. G., and Rao, X. (2020). The Payoff to Investing in CGIAR Research. Washington, DC: SoAR Foundation.
ASTI (2022). Agricultural Science and Technology Indicators online database. Washington, DC: International Food Policy Research Institute (IFPRI) (accessed September 21, 2022).
Beach, R. H., Sulser, T. B., Crimmins, A., Cenacchi, N., Cole, J., Fukagawa, N. K., et al. (2019). Combining the effects of increased atmospheric carbon dioxide on protein, iron, and zinc availability and projected climate change on global diets: a modelling study. The Lancet Planetary Health 3, e307–e317. doi: 10.1016/S2542-5196(19)30094-4
FAO (2008). FAO Methodology for the Measurement of Food Deprivation Updating the Minimum Dietary Energy Requirements. Rome: Food and Agriculture Organization of the United Nations. Available online at: http://www.fao.org/fileadmin/templates/ess/documents/food_security_statistics/metadata/undernourishment_methodology.pdf (Accessed October, 2018).
FAOSTAT (2021). Agricultural Statistical Time Series. Rome, Italy: Food and Agriculture Organization of the United Nations. Available online at: http://faostat.fao.org/ (accessed January 15, 2021).
Fuglie, K. (2016). The growing role of the private sector in agricultural research and development world-wide. Glob. Food Secur. 10, 29–38. doi: 10.1016/j.gfs.2016.07.005
Fuglie, K., Gautam, M., Goyal, A., and Maloney, W. (2019). Harvesting Prosperity: Technology and Productivity Growth in Agriculture. Washington, DC: World Bank. doi: 10.1596/978-1-4648-1393-1
Fuglie, K., Ray, S., Baldos, U. L. C., and Hertel, T.W. (2022a). The R&D cost of climate mitigation in agriculture. Appl. Econ. Perspect. Policy. doi: 10.1002/aepp.13245
Fuglie, K., Wiebe, K., Prager, S., Sulser, T. B., Cenacchi, N., Bonilla-Cedrez, C., et al. (2022b). Quantitative Analysis to Inform Priorities for International Agricultural Research. IFPRI Discussion Paper 02133. Washington, DC: International Food Policy Research Institute. doi: 10.2499/p15738coll2.136357
Global Nutrition Report (2021). The Status of Global Nutrition. Bristol, UK: Development Initiatives.
Gomez, M. I., Barrett, C. B., Raney, T., Pinstrup-Andersen, P., Meerman, J., Croppenstedt, A., et al. (2013). Post-green revolution food systems and the triple burden of malnutrition. Food Policy 42, 129–138. doi: 10.1016/j.foodpol.2013.06.009
Hurley, T. M., Rao, X., and Pardey P. G. (2018). Reexamining the reported rates of return to food and agricultural research and development. Amer. J. Agric. Econ. 96, 1492–1504. doi: 10.1093/ajae/aau047
IPCC (2006). “Emissions from livestock and manure management,” in 2006 IPCC Guidelines for National Greenhouse Gas Inventories Volume 4: Agriculture, Forestry, And Other Land Use, eds S. Eggleston, L. Buendia, K. Miwa, T. Ngara, and K. Tanabe (Cambridge, United Kingdom: Cambridge University Press), Chapter 10.
O'Neill, B. C., Kriegler, E., Riahi, K., Ebi, K. L., Hallegatte, S., Carter, T. R., et al. (2014). A new scenario framework for climate change research: the concept of shared socioeconomic pathways. Clim. Change 122, 387–400. doi: 10.1007/s10584-013-0905-2
Pardey, P. G., Chan-Kang, C., Dehmer, S. P., and Beddow, J. M. (2016). Agricultural R&D is on the move. Nature 15, 301–303. doi: 10.1038/537301a
Pemsl, D., Staver, C., Hareau, G., Alene, A. D., Abdoulaye, T., Kleinwechter, U., et al. (2022). Prioritizing international agricultural research investments: lessons from a global multi-crop assessment. Res. Policy 41, 104473. doi: 10.1016/j.respol.2022.104473
Reardon, T., Echeverria, R., Berdegue, J., Minten, B., Liverpool-Tasie, S., Tschirley, D., et al. (2018). Rapid Transformation of Food Systems in Developing Regions: Highlighting the Role of Agricultural Research and Innovations. AgEcon Search Open Access Agricultural and Applied Economics Digital Library, University of Minnesota, St. Paul, MN. Available online at: https://E:/3%20Project_CGIAR-USAID%20ag%20RD%20priorities%202021/4_Literature/Reardon_food%20systems%20innovation_2018.pdf (Accessed October, 2022).
Renkow, M., and Byerlee, D. (2010). The impacts of CGIAR research: a review of recent evidence. Food Policy 35, 391–402. doi: 10.1016/j.foodpol.2010.04.006
Robinson, S., Mason d'Croz, D., Islam, S., Sulser, T. B., Robertson, R. D., Zhu, T., et al. (2015). The International Model for Policy Analysis of Agricultural Commodities and Trade (IMPACT): Model description for version 3. Washington, DC: International Food Policy Research Institute (IFPRI). doi: 10.2139/ssrn.2741234
Rosegrant, M. W., Sulser, T. B., Mason-D'Croz, D., Cenacchi, N., Nin-Pratt, A., Dunston, S., et al. (2017). Quantitative Foresight Modeling to Inform the CGIAR Research Portfolio. Project Report for USAID. Washington, DC: International Food Policy Research Institute. Available online at: https://ebrary.ifpri.org/digital/collection/p15738coll2/id/131144 (Accessed April, 2017).
Rosegrant, M. W., Sulser, T. B., and Wiebe, K. (2022). Global investment gap in agricultural research and innovation to meet Sustainable Development Goals for hunger and Paris Agreement climate change mitigation. Front. Sustain. Food Sys. 6, 965767. doi: 10.3389/fsufs.2022.965767
Schaldach, R., Alcamo, J., Koch, J., Kölking, C., Lapola, D. M., Schüngel, J., et al. (2011). An integrated approach to modelling land-use change on continental and global scales. Environ. Model. Software 26, 1041–1051. doi: 10.1016/j.envsoft.2011.02.013
Smith, M. R., Micha, R., Golden, C. D., Mozaffarian, D., and Myers, S. S. (2016). Global expanded nutrient supply (GENuS) model: a new method for estimating the global dietary supply of nutrients. PLoS ONE 11, e0146976. doi: 10.1371/journal.pone.0146976
Thorton, P., Dijkman, J., Herrero, M., Szilagyi, L., and Cramer, L. (2022). Viewpoint: aligning vision and reality in publicly funded agricultural research for development: a case study of CGIAR. Food Policy 107, 102196. doi: 10.1016/j.foodpol.2021.102196
Wessels, K. R., and Brown, K. H. (2012). Estimating the global prevalence of zinc deficiency: results based on zinc availability in national food supplies and the prevalence of stunting. PLoS ONE 7, e50568. doi: 10.1371/journal.pone.0050568
Wiebe, K., Sulser, T. B., Dunston, S., Rosegrant, M. W., Fuglie, K., Willenbockel, D., et al. (2021). Modeling impacts of faster productivity growth to inform the CGIAR initiative on Crops to End Hunger. PLoS ONE 16, e0249994. doi: 10.1371/journal.pone.0249994
Willenbockel, D., Robinson, S., Mason d'Croz, D., Rosegrant, M. W., Sulser, T. B., Dunston, S., et al. (2018). Dynamic Computable General Equilibrium Simulations in Support of Quantitative Foresight Modeling to Inform the CGIAR Research Portfolio: Linking the IMPACT and GLOBE Models. IFPRI Discussion Paper 1738. Washington, DC: International Food Policy Research Institute (IFPRI). Available online at: http://ebrary.ifpri.org/cdm/ref/collection/p15738coll2/id/132757 (Accessed July, 2018).
World Resources Institute (2019). Creating a Sustainable Food Future: A Menu of Solutions to Feed Nearly 10 Billion People by 2050. Washington, DC: World Resources Institute.
Keywords: agricultural productivity, CGIAR, impact assessment, parity model, IMPACT model, research and development (R&D)
Citation: Fuglie K, Wiebe K, Sulser TB, Cenacchi N and Willenbockel D (2022) Multidimensional impacts from international agricultural research: Implications for research priorities. Front. Sustain. Food Syst. 6:1031562. doi: 10.3389/fsufs.2022.1031562
Received: 30 August 2022; Accepted: 17 October 2022;
Published: 03 November 2022.
Edited by:
Julia Compton, Independent Researcher, Cardiff, United KingdomReviewed by:
Mywish Maredia, Michigan State University, United StatesPaul Heisey, United States Department of Agriculture (USDA), United States
Copyright © 2022 Fuglie, Wiebe, Sulser, Cenacchi and Willenbockel. This is an open-access article distributed under the terms of the Creative Commons Attribution License (CC BY). The use, distribution or reproduction in other forums is permitted, provided the original author(s) and the copyright owner(s) are credited and that the original publication in this journal is cited, in accordance with accepted academic practice. No use, distribution or reproduction is permitted which does not comply with these terms.
*Correspondence: Keith Fuglie, keith.fuglie@usda.gov