Heuristic and Hierarchical-Based Population Mining of Salmonella enterica Lineage I Pan-Genomes as a Platform to Enhance Food Safety
 Joao Carlos Gomes-Neto1,2†
  Natasha Pavlovikj3†
  Carmen Cano1† Baha Abdalhamid4,5
  Gabriel Asad Al-Ghalith6,7
  John Dustin Loy8
  Dan Knights6,7 Peter C. Iwen4,5
  Byron D. Chaves1
  Andrew K. Benson1,2*
- 1Department of Food Science and Technology, University of Nebraska-Lincoln, Lincoln, NE, United States
- 2Nebraska Food for Health Center, University of Nebraska-Lincoln, Lincoln, NE, United States
- 3Department of Computer Science and Engineering, University of Nebraska-Lincoln, Lincoln, NE, United States
- 4Department of Pathology and Microbiology, University of Nebraska Medical Center, Omaha, NE, United States
- 5Nebraska Public Health Laboratory, University of Nebraska Medical Center, Omaha, NE, United States
- 6BioTechnology Institute, College of Biological Sciences, University of Minnesota, Minneapolis, MN, United States
- 7Department of Computer Science and Engineering, University of Minnesota, Minneapolis, MN, United States
- 8School of Veterinary Medicine and Biomedical Sciences, University of Nebraska-Lincoln, Lincoln, NE, United States
The recent incorporation of bacterial whole-genome sequencing (WGS) into Public Health laboratories has enhanced foodborne outbreak detection and source attribution. As a result, large volumes of publicly available datasets can be used to study the biology of foodborne pathogen populations at an unprecedented scale. To demonstrate the application of a heuristic and agnostic hierarchical population structure guided pan-genome enrichment analysis (PANGEA), we used populations of S. enterica lineage I to achieve two main objectives: (i) show how hierarchical population inquiry at different scales of resolution can enhance ecological and epidemiological inquiries; and (ii) identify population-specific inferable traits that could provide selective advantages in food production environments. Publicly available WGS data were obtained from NCBI database for three serovars of Salmonella enterica subsp. enterica lineage I (S. Typhimurium, S. Newport, and S. Infantis). Using the hierarchical genotypic classifications (Serovar, BAPS1, ST, cgMLST), datasets from each of the three serovars showed varying degrees of clonal structuring. When the accessory genome (PANGEA) was mapped onto these hierarchical structures, accessory loci could be linked with specific genotypes. A large heavy-metal resistance mobile element was found in the Monophasic ST34 lineage of S. Typhimurium, and laboratory testing showed that Monophasic isolates have on average a higher degree of copper resistance than the Biphasic ones. In S. Newport, an extra sugE gene copy was found among most isolates of the ST45 lineage, and laboratory testing of multiple isolates confirmed that isolates of S. Newport ST45 were on average less sensitive to the disinfectant cetylpyridimium chloride than non-ST45 isolates. Lastly, data-mining of the accessory genomic content of S. Infantis revealed two cryptic Ecotypes with distinct accessory genomic content and distinct ecological patterns. Poultry appears to be the major reservoir for Ecotype 1, and temporal analysis further suggested a recent ecological succession, with Ecotype 2 apparently being displaced by Ecotype 1. Altogether, the use of a heuristic hierarchical-based population structure analysis that includes bacterial pan-genomes (core and accessory genomes) can (1) improve genomic resolution for mapping populations and accessing epidemiological patterns; and (2) define lineage-specific informative loci that may be associated with survival in the food chain.
Introduction
The Centers for Disease Control and Prevention (CDC) estimate that ~48 million people acquire foodborne-associated illnesses annually in the United States (CDC, 2021a). Salmonella is among the top five most common pathogens causing foodborne salmonellosis in the United States (CDC, 2021a), with more than one million infections, over 26,000 hospitalizations, and 400 deaths per year (CDC, 2021b). In general, foods of animal origin are the major source of Salmonella outbreaks, although multiple well-documented outbreaks have shown that plant-based materials, such as leafy greens or peanut butter, can also be vehicles of foodborne salmonellosis (Ferrari et al., 2019; CDC, 2021b).
The genus Salmonella comprises only two species: S. enterica and S. bongori. Salmonella enterica is further sub-divided into six genetically distinct sub-species, but a single subspecies (S. enterica subsp. enterica lineage I—herein referred as S. enterica lineage I) is estimated to be responsible for 99% of zoonotic infections (Achtman et al., 2012). Within the S. enterica, substantial genetic and phenotypic diversity exists, as evidenced by > 2,500 serologically distinguishable variants (Issenhuth-Jeanjean et al., 2014; Alikhan et al., 2018). These variants of S. enterica, termed serovars, are differentiated by their unique cell surface combinations of lipopolysaccharide and flagella-associated proteins, which are detected and classified using sets of anti-sera specific for the 46 different O-antigen structures and the 114 different H-antigens, known as the Kauffman-White scheme (Rowe and Hall, 1989; McQuiston et al., 2011; Achtman et al., 2012).
Serovars represent an important biological unit for epidemiological inquiry because they co-vary with the S. enterica lineage I population structure, and can have unique ecological distributions. Specifically, the co-inheritance of serotypic properties (i.e., phenotype) with genomic backbone (i.e., shared-genomic content; genotype) allows for serovars to be predicted with high accuracy solely using multi-locus sequence typing (MLST) (Achtman et al., 2012). MLST is a portable genotypic platform that classifies genomes into sequence types (ST) using only seven genome-scattered loci, that are ubiquitously spread across isolates (Maiden et al., 1998). Ecologically, serovars can present varying patterns of host tropism, such as host-restriction in the case of S. Dublin, which is prevalent in bovine (Fenske et al., 2019); while generalists such as S. Typhimurium typically colonizes different livestock animals including poultry, swine, and bovine (Leekitcharoenphon et al., 2016; Ferrari et al., 2019). The association of serovars with MLST-based population structures and ecological traits have important consequences for epidemiological surveillance. MLST can be used for predicting serovars, while adding an extra hierarchical layer of genotypic resolution to the population (i.e., different STs of a serovar). Similarly, serovar-specific hierarchically-classified MLST-based genotypes can also reflect distinguishable ecological patterns, providing an additional layer of epidemiological information.
More recently, the use of whole-genome sequencing (WGS) in Public Health laboratories began to improve the accuracy of outbreak investigations (Grad et al., 2012; Worby et al., 2014a,b). The growing volume of WGS data is also beginning to reveal new insights into genetic diversity present in different populations, as exemplified by the varying degree of genotypic diversity reported across serovars of S. enterica lineage I (Joseph and Read, 2010; Achtman et al., 2012; Land et al., 2015; Alikhan et al., 2018; Zhou et al., 2018, 2020). WGS also generates large volumes of publicly available datasets, allowing for population-based scalable studies of Salmonella across environments and geographical locations (Joseph and Read, 2010; Alikhan et al., 2018; Zhou et al., 2018, 2020). However, current epidemiological inquiries broadly focus on tracking ST lineages and cgMLST variants while refining their clustering and traceback strategies through single-nucleotide polymorphisms (SNP) mapping distributed across the shared-genomic backbone (i.e., core-genome content) (Grad et al., 2012; Worby et al., 2014a; Pightling et al., 2018; Saltykova et al., 2018; Yang et al., 2019). Alternatively, studies combining core- and accessory genomic components are providing new levels of understanding of hierarchical and familial genotypic relationships, higher degree of resolution for distinguishing outbreaks, and potentiating the discovery of causative genotypic and phenotypic traits underlying unique niche tropisms (Sheppard et al., 2012, 2013; Chewapreecha et al., 2014; Langridge et al., 2015; Earle et al., 2016; Laing et al., 2017; Yahara et al., 2017; Bawn et al., 2020; Jiang et al., 2020; Rodrigues et al., 2020; Mageiros et al., 2021). Hence, the combined use of ST or cgMLST variant mapping, with accessory genomic information, can substantially enhance the identification and tracking of cryptic populations across reservoirs (Sheppard et al., 2014; Gymoese et al., 2019).
To demonstrate the application of a heuristic and agnostic hierarchical population structure guided pan-genome enrichment analysis (PANGEA), we used populations of S. enterica lineage I to achieve two main objectives: (i) show how hierarchical population inquiry at different scales of resolution can enhance ecological and epidemiological inquiries; and (ii) identify population-specific inferable traits that could provide selective advantages in food production environments. Our results show that such a holistic population genomics approach has the potential to (1) reveal a hidden layer of genotypic resolution that can aid in mapping populations at scale; (2) identify population shifts that are relevant both ecologically and epidemiologically; and (3) define specific loci where genomic variation (i.e., informative loci) confers unique phenotypic traits that can be associated with unique epidemiological and ecological patterns.
Materials and Methods
Bacterial Genome Sequences
Publicly available (convenient samples) Illumina paired-end genome sequences of S. Typhimurium, S. Newport, and S. Infantis were all obtained from NCBI-Sequence Reading Archive (SRA). A list of the genomes downloaded are available in the following Figshare repository (log-in credentials required) (https://figshare.com/account/home#/projects/100139) in their corresponding serovar-specific folders (.txt file includes downloaded SRA identifications for each serovar). Otherwise, the list of genomes is available within each serovar-specific folder (S. Infantis data: https://doi.org/10.6084/m9.figshare.14198984.v12; S. Newport data: https://doi.org/10.6084/m9.figshare.14199410.v4; and S. Typhimurium data: https://doi.org/10.6084/m9.figshare.14199503.v3). All genomic sequences were downloaded in 2019, as part of the development of our computational platform ProkEvo (Pavlovikj et al., 2021). For S. Typhimurium, genomic sequences were selected from “worldwide” data (i.e., not filtered for USA genomes only); whereas, for S. Newport and S. Infantis only USA genomic sequences were downloaded. The primary reason for selecting geographically restricted genomes was to have datasets with a ten-fold difference in size, in order to test the scalability of our computational approach as previously shown (Pavlovikj et al., 2021). SRA identifications were manually downloaded from the NCBI-SRA webpage (https://www.ncbi.nlm.nih.gov/sra). Publicly available genome sequences for each serovar were searched using the following terms: (1) “Salmonella Typhimurium” for S. Typhimurium—the terms “O 1,4,[5],12:i:- or Monophasic” were not used in the search; (2) “Salmonella Newport AND USA” for S. Newport; and (3) “Salmonella Infantis AND USA” for S. Infantis. Only freely available genomic Illumina paired-end sequences were downloaded for this analysis. In order to download all SRA identifications, we used the “Send to” tab, and selected “file” as a “Choose Destination” with the “Accession List” as “Format,” and ultimately pressed the button “Create File.” This .txt file is the only input file needed to run with ProkEvo, a computational genomics platform for population-based analysis of bacterial whole-genomes. As mentioned above, genomic data from 2,870 isolates of S. Infantis, 2,392 isolates of S. Newport, and 23,045 isolates of S. Typhimurium were then processed through ProkEvo. The S. Typhimurium dataset had to be randomly split into 20 evenly distributed subsets (1,076–1,077 genomes each) due to two main algorithm limitations: (1) Generation of core-genome alignment with Roary (Page et al., 2015) in ProkEvo; and (2) Constructing reliable maximum likelihood-based phylogenetic tree with many thousands of genomes. Specifically, the S. Typhimurium dataset was shuffled-split (i.e., randomized) when creating the Roary subsets (a total of 20 evenly distributed subsets) using Prokka (Seemann, 2014) outputs (i.e., genome annotation done inside ProkEvo using Prokka). Prokka outputs are generated independently for each genome that passes through the ProkEvo pipeline.
ProkEvo Processing of Illumina Paired-End DNA Sequences
As abovementioned, all Illumina paired-end genomic sequences were processed using the computational platform ProkEvo (Pavlovikj et al., 2021). In brief, ProkEvo uses a single input file (.txt) containing SRA identifications to generate the following main outputs: (1) ST classification (.csv) using the mlst algorithm that is available here (https://github.com/tseemann/mlst); (2) Hierarchical Bayesian analysis of population structure (BAPS) clustering using fastbaps which used six levels of population stratification (BAPS1-6) and sub-group or haplotype labeling within each level of resolution (.csv) (Cheng et al., 2013; Tonkin-Hill et al., 2019); (3) SISTR-based serotyping and cgMLST classifications (.csv) (Yoshida et al., 2016); (4) Core-genome alignment (.aln) for phylogeny construction using FastTree (Price et al., 2010) (.tree file as the output of FastTree); (5) Antimicrobial resistance (AMR) loci and plasmid mapping (.csv); and (6) Pan-genomic mapping file containing binary data for the presence and absence of loci produced by Roary (.Rtab). One peculiarity of ProkEvo is that it uses SISTR to predict serotypic classification based on core-genome information. Hence, we have used SISTR to identify the proportion of isolates that are potentially misclassified, or those for which the NCBI information did not match what SISTR infers. For this study, across all S. Typhimurium genomes over 20 datasets, the SISTR serovar-classifier estimated a minor fraction (proportion ~ ranging from 1.3 to 3.8%, and ~ mean of 2.4%—calculated based on 20 shuffled-split subsets) to be miscalls. In the case of S. Newport and S. Infantis, only 2.03% and 0.95% of all isolates were misclassified by SISTR as belonging to another serovar, respectively. For all analyses, we accounted for that error rate by either grouping “misclassified” serovars into “Other serovars,” or by completely removing them from the dataset. Unless specified in the figure legend, the SISTR version used for analysis was v1.0 with BLAST v2.5. To account for differences between SISTR versions, a comparative analysis between SISTR v1.0 and v1.1 was also done to demonstrate potential differences in cgMLST variant calling patterns and distributions across all three serovars (https://figshare.com/account/projects/100139/articles/15125190). In the case of S. Infantis (https://figshare.com/account/projects/100139/articles/14198984?file=29069388), a comparative analysis between SISTR outputs was used to demonstrate: (1) distribution of cgMLST variants across Ecotypes; (2) temporal distribution of cgMLST variants across hosts/reservoirs; (3) SNP-based pairwise distance between genomes; (4) distribution of cgMLST variants based on shell-genes or shell-loci; and (5) identification of unique loci present or absent across major cgMLST variants. Of note, more detailed information on how to install, deploy, all parameters used and how to customize them, version of programs, and applications of ProkEvo to conduct a hierarchical-based population structure analysis is available here (https://github.com/npavlovikj/ProkEvo). ProkEvo was run on two different computational platforms - the University of Nebraska high-performance computing cluster (Crane) and the Open Science Grid (OSG), a distributed, high-throughput cluster. Depending on the platform and the dataset size, ProkEvo ran from 3 to 26 days producing up to 1.2 TB of output data (Pavlovikj et al., 2021). If all the analyses would have been run sequentially, on a single-core, and not in a modular and distributed way as provided with ProkEvo, the runtime would have been from 115 days up to 13 years (Pavlovikj et al., 2021).
Serovar-Specific Dataset Repositories
All serovar-specific datasets generated by ProkEvo, and other auxiliary programs, available at the following Figshare link, which requires the user to be logged in: https://figshare.com/account/home#/projects/100139. If the user does not have a Figshare account, then all dataset links are available here: S. Infantis https://doi.org/10.6084/m9.figshare.14198984.v12; S. Newport https://doi.org/10.6084/m9.figshare.14199410.v4; S. Typhimurium—general https://doi.org/10.6084/m9.figshare.14199503.v3; S. Typhimurium—group 1 https://doi.org/10.6084/m9.figshare.14199479; S. Typhimurium—group 2 https://doi.org/10.6084/m9.figshare.14199563.v2; S. Typhimurium—group 3 https://doi.org/10.6084/m9.figshare.14199578.v2; S. Typhimurium—group 4 https://doi.org/10.6084/m9.figshare.14199605.v1; S. Typhimurium—group 5 https://doi.org/10.6084/m9.figshare.14199626.v2; S. Typhimurium—group 6 https://doi.org/10.6084/m9.figshare.14199635.v1; S. Typhimurium—group 7 https://doi.org/10.6084/m9.figshare.14199668.v1; S. Typhimurium—group 8 https://doi.org/10.6084/m9.figshare.14199689.v1; S. Typhimurium—group 9 https://doi.org/10.6084/m9.figshare.14199899.v1; S. Typhimurium—group 10 https://doi.org/10.6084/m9.figshare.14199905.v1; S. Typhimurium—group 11 https://doi.org/10.6084/m9.figshare.14199959.v1; S. Typhimurium—group 12 https://doi.org/10.6084/m9.figshare.14199965.v1; S. Typhimurium—group 13 https://doi.org/10.6084/m9.figshare.14199974.v1; S. Typhimurium—group 14 https://doi.org/10.6084/m9.figshare.14199980.v1; S. Typhimurium—group 15 https://doi.org/10.6084/m9.figshare.14199992.v1; S. Typhimurium—group 16 https://doi.org/10.6084/m9.figshare.14200001.v1; S. Typhimurium—group 17 https://doi.org/10.6084/m9.figshare.14200007.v1; S. Typhimurium—group 18 https://doi.org/10.6084/m9.figshare.14200019.v1; S. Typhimurium—group 19 https://doi.org/10.6084/m9.figshare.14200031.v1; S. Typhimurium—group 20 https://doi.org/10.6084/m9.figshare.14200043.v1.
Phylogenetic Methods
All phylogenies were constructed using the core-genome alignment (.aln) generated by Roary within ProkEvo—(see ProkEvo for program version and specifics at https://github.com/npavlovikj/ProkEvo), and subsequently by using the FastTree program. As previously done, we used the generalized time-reversible model of nucleotide evolution without removing genomic regions putatively affected by recombination (Pavlovikj et al., 2021). The code used for running FastTree is available here https://github.com/jcgneto/Frontiers_Micro_salmonella_Infantis_Newport_Typhimurium_genomics/tree/main/code/fastTree_program. The output is a .tree file that can then be used to visualize the phylogeny using programs such as ggtree (version 2.2.4) and phandango version 1.3.0 (https://jameshadfield.github.io/phandango/#/) (Hadfield et al., 2018). Of note, for the S. Typhimurium dataset, 20 independent phylogenies were constructed due to the random split of the original data.
Core-Genome k-mer and SNP-Based Distance Calculations
Serovar-specific core-genome alignments (.aln files) generated by ProkEvo were used to calculate the following pairwise distance matrices: (1) k-mer based pairwise distances using aKronyMer (Al-Ghalith, 2018), which is available here (https://github.com/knights-lab/aKronyMer); and (2) SNP-based pairwise distances using the snp-dists algorithm (https://github.com/tseemann/snp-dists). Specific scripts used for each program are available here: aKronyMer (https://github.com/jcgneto/Frontiers_Micro_salmonella_Infantis_Newport_Typhimurium_genomics/blob/main/code/akronymer_program) and snp-dists (https://github.com/jcgneto/Frontiers_Micro_salmonella_Infantis_Newport_Typhimurium_genomics/tree/main/code/snp_dist_program). Both programs generate a square matrix that needs to be adjusted or transposed depending on the analysis performed. Of note, for the S. Typhimurium dataset, all pairwise distance calculations were done for each of the individual 20 random subsets.
Dimensionality Reduction Analysis for Population Structure Assessment
A t-distributed stochastic neighbor embedding (tSNE) algorithm was used to visualize serovar-specific core-genome distance matrices in two-dimensions (i.e., the first two tSNE components), in order to identify neighboring clusters as previously shown (Abudahab et al., 2019). For that, we applied the tSNE analysis for both k-mer (produced by aKronyMer) and SNP (produced by snp-dists) pairwise based distance matrices. Distance matrices were generated as described above (see core-genome k-mer and SNP-based distance calculations). Conversion of distance matrices to the appropriate diagonal format, and calculations of the first two tSNE components, were achieved using custom Python (version 3.7.6) scripts compiled on Jupyter notebooks for both k-mer based matrix (https://github.com/jcgneto/Frontiers_Micro_salmonella_Infantis_Newport_Typhimurium_genomics/tree/main/code/k-mer_dist_program), and SNP-based matrix (https://github.com/jcgneto/Frontiers_Micro_salmonella_Infantis_Newport_Typhimurium_genomics/tree/main/code/snp_dist_program). Specifically, k-mer or SNP-based programs were provided in individual folders for each serovar. All Python packages used, in addition to specific tSNE parameters, are provided inside the GitHub links, within each serovar-specific folder, in their corresponding Jupyter lab notebooks. In particular, for the tSNE analysis we used the scikit-learn (version 0.22.1) library in addition to the class sklearn.manifold, and function tSNE within it. Of note, for the S. Typhimurium dataset, tSNE calculations were carried out independently across all 20 random subsets.
Supervised and Non-supervised Population Clustering Using tSNE Core-Genomic Derived Data
As part of a phylogeny-independent analysis, core-genomic distances generated either with k-mers or SNPs (see Dimensionality reduction analysis for population structure assessment), were converted to two tSNE components (i.e., two dimensions), that were subsequently used for 2-dimensional ordination of the data. Supervised clustering was achieved by labeling (color-coding) the data points with either the Bayesian analysis of population structure level 1 (BAPS1), ST, or cgMLST genotypic information, as part of the hierarchical-based population structure analysis. Non-supervised clustering was done by using a k-means approach. The optimal number of k-means clusters was determined using both: (1) the examination of within cluster sum of squares across the number of clusters used by the modeling algorithm; and (2) the Silhouette analysis. Once the optimal number of clusters was determined for the k-mer or SNP approaches, the 2-dimensional tSNE plot was color-coded using the cluster information. The R libraries used were cluster (version 2.1.0), factoextra (version 1.0.7), and NbClust (version 3.0). The R markdown containing all the code for it is available here https://github.com/jcgneto/Frontiers_Micro_salmonella_Infantis_Newport_Typhimurium_genomics/tree/main/code/supplementary_figures/phylogenetic_independent_all_serovars. For the S. Typhimurium dataset, tSNE-based clustering analysis was done independently for each of the 20 random subsets.
Supervised and Non-supervised Population Clustering Using Accessory Genome Information
Clustering using the accessory genomic information for each serovar was achieved by only selecting “shell-genes or shell-loci” from the pan-genomic data. Shell-genes include both annotated and hypothetical proteins associated loci, and are present in ≥15% and <95% of the genomes in the dataset, as defined by Roary within ProkEvo. These genes can be filtered out of the .Rtab file containing a binary matrix for loci distribution across genomes, generated by ProkEvo. A logistic principal component analysis (PCA) was applied to the binary data, and two PCs were used for subsequent data ordination (Fenske et al., 2019). Model deviance was calculated using 2-dimensions. Supervised clustering was achieved by labeling (color-coding) the data points with either BAPS1, ST, or cgMLST genotypic information. Non-supervised clustering was done by using a k-means approach and the optimal number of clusters was determined by examining the within cluster sum of squares across the number of clusters tested by the algorithm. The R library logisticPCA (version 0.2) was used for all analyses. All R markdowns are available here (https://github.com/jcgneto/Frontiers_Micro_salmonella_Infantis_Newport_Typhimurium_genomics/tree/main/code/pca_program). For the S. Typhimurium dataset, all clustering analyses were done independently for each of the 20 random subsets.
BAPS-Based Analysis of Clonality
Core-genome alignments for each serovar and dataset were generated within ProkEvo using Roary. BAPS was used to cluster genotypes heuristically using fastbaps. In brief, fastbaps uses a nested Bayesian clustering approach for population stratification using core-genome sequences as an input. Our usage of fastbaps comprised of using six levels (BAPS1-6) of resolution (i.e., layers or strata) to examine the degree of clonality (i.e., genotypic homogeneity) of a population. Specifically, the relative frequency distribution of sub-groups or haplotypes present in each layer or stratum was used in the final analysis. The R markdown for the S. Infantis ecotype analysis is available here (https://github.com/jcgneto/Frontiers_Micro_salmonella_Infantis_Newport_Typhimurium_genomics/blob/main/code/figure_7/figure_7_sal_paper_final.Rmd); for S. Typhimurium, the code used for ST34 analysis is here (https://github.com/jcgneto/Frontiers_Micro_salmonella_Infantis_Newport_Typhimurium_genomics/tree/main/code/supplementary_figures/Typhimurium); and lastly, the code for S. Newport ST45 analysis is available here (https://github.com/jcgneto/Frontiers_Micro_salmonella_Infantis_Newport_Typhimurium_genomics/tree/main/code/supplementary_figures/Newport).
Haplotype Diversity Analysis
The Simpson's D index of diversity (1- D) was used to calculate the degree of homogeneity or clonality of a population for the following genotypic schemes using their grouped frequencies as data input: ST, cgMLST, and BAPS1-6. Specifically, we used the diversity() function available in the vegan (version 2.5-6) R library (Oksanen et al., 2019). The R markdown code for our implementation of the program for each serovar is available here (https://github.com/jcgneto/Frontiers_Micro_salmonella_Infantis_Newport_Typhimurium_genomics/tree/main/code/figure_2_and_3).
Pan-Genomic Logistic Regression Modeling for Loci Identification
Agnostic PANGEA was achieved with a custom Python program that uses logistic regression modeling, in addition to generating accuracy-based metrics derived from a contingency table, to ultimately identify unique loci differentiating two populations or lineages. This program requires two input files: (1) .csv file containing the SRA identifications for genomes and a “phenotype” column with binary values (0 for absence and 1 for presence), with 1 being designated for the lineage of interest in the phenotype column; (2) .Rtab file containing a binary distribution of loci for that dataset (i.e., each column represents a locus, and either the locus is present and is coded as 1, or absent and is coded as 0). Essentially, each locus is used as a main predictor to run a univariate logistic regression analysis (i.e., no random effects were added to any model), in addition to generating contingency tables to calculate accuracy, sensitivity, specificity, positive and negative predictive values, Chi-squared based p-values, and the proportion for the loci present in either the targeted or non-targeted lineages. Out of each logistic regression model, the program outputs a p-value, the effect size measured by the odds ratio (OR) with 95% confidence intervals, Akaike information criterion (AIC), and model deviance. All calculated p-values are reported as generated by the model, in addition to applying the Bonferroni correction. We have also added a column in the .csv output to facilitate decision making that includes “yes” or “no”, by locus based on the p-value passing the Bonferroni's corrected threshold for significance (i.e., that also applies for both the logistic regression model and Chi-squared associated p-values). Randomization of both outcomes and predictors were used to construct stochastic statistical models and contingency tables, in order to assess whether each locus (i.e., predictor) would be associated with the outcome of interest by chance (i.e., false positives). The Python code for our agnostic PANGEA program is available here (https://github.com/jcgneto/Frontiers_Micro_salmonella_Infantis_Newport_Typhimurium_genomics/tree/main/code/glm_program). Non-supervised PANGEA results identifying unique loci present in ST34 for S. Typhimurium, and ST45 for S. Newport are available here (https://figshare.com/account/projects/100139/articles/14199503?file=26778821) and here (https://figshare.com/account/projects/100139/articles/14199410?file=26778575) respectively. For this study, the following threshold criteria were used to agnostically identify unique loci differentiating STs (i.e., annotated as “Hits”—see below) for both the S. Typhimurium and S. Newport datasets:
& = and
lower_ci_odds_ratio = lower bound of the 95% OR confidence interval needs to be above 1 (focus on finding loci uniquely present in lineage coded as 1 in the phenotype column)
upper_ci_odds_ratio = upper bound of the 95% OR confidence interval needs to be above 1 (focus on finding loci uniquely present in lineage coded as 1 in the phenotype column)
pass_sign_binomial_model = whether or not the locus passed the Binomial model Bonferroni corrected p-value
pass_sign_chi_sq_pvalue = whether or not the locus passed the Chi-squared Bonferroni corrected p-value
accur = accuracy
pos_pred_value = positive predicted value
neg_pred_value = negative predicted value
For the S. Typhimurium dataset, all non-supervised PANGEA was run independently for each of the 20 subsets, and subsequently all outputs were combined at the end of the analysis. Also, only loci present in at least 50% (10 out of 20) datasets were selected to be considered a moderate to strong “signal” in the S. Typhimurium data. The 50% value was determined empirically based on the data characteristics and intrinsic biases (i.e., uneven sampling and spatial-temporal distribution across a country or worldwide).
Loci and Plasmid Mapping Onto the Hierarchical-Based Population Structure
Loci differentiating between ST lineages were identified using our comprehensive PANGEA approach which combines mining of database-derived AMR loci and plasmid mapping (i.e., supervised pan-genomic analysis), and an agnostic search for lineage-differentiating loci using pan-genomic data (see section above). Targeted AMR loci and plasmids preferentially occurring in a serovar-specific ST lineage vs. others, were identified through pattern searching combining the genotypic information with both Resfinder and PlasmidFinder files, respectively; all generated by ProkEvo. Programs used for exploratory data analysis and visualization are described below (see Data processing and visualizations). R markdown files for S. Typhimurium ST34 analysis are available here (https://github.com/jcgneto/Frontiers_Micro_salmonella_Infantis_Newport_Typhimurium_genomics/tree/main/code/figure_5); whereas, the files for S. Newport ST45 are available here (https://github.com/jcgneto/Frontiers_Micro_salmonella_Infantis_Newport_Typhimurium_genomics/tree/main/code/figure_6). For S. Infantis, the R markdown for analysis comparing Ecotypes is available here (https://github.com/jcgneto/Frontiers_Micro_salmonella_Infantis_Newport_Typhimurium_genomics/tree/main/code/supplementary_figures/Infantis). The same approach was applied for both training and validation/testing datasets. Ultimately, .csv files were generated combining the hierarchical-based population structure information, in addition to loci and plasmids, to be visualized onto the core-genome phylogenetic tree. For S. Typhimurium, loci and plasmid mapping onto the population structure was done independently for each of the 20 data subsets.
Whole-Genome Pairwise Distance Calculations
For the S. Infantis data, pairwise SNP-based whole-genomic distances were calculated using Mash (Ondov et al., 2016). The reference genome sequence used for it is available here (https://www.ncbi.nlm.nih.gov/nuccore/NZ_CP016408.1). Our Mash script is available here (https://github.com/jcgneto/Frontiers_Micro_salmonella_Infantis_Newport_Typhimurium_genomics/blob/main/code/mash_program/mash.sh). Mash is freely available program, and can be downloaded or installed using this link (https://github.com/marbl/mash).
Metadata Information for S. Infantis
To extract S. Infantis freely available NCBI-linked metadata for all isolates used herein, Entrez Direct (Kans, 2013) was used as a command-line utility that provides access to the various NCBI databases using different search terms. The SRA identifications from the selected genomic sequences were used as search terms to extract multiple metadata fields such as host disease, isolation source, geographical location, collection date, collected by, among other attributes. Entrez Direct version 11.0 with utilities such as “esearch,” “elink” and “efetch” were used to get the needed metadata (https://github.com/jcgneto/Frontiers_Micro_salmonella_Infantis_Newport_Typhimurium_genomics/tree/main/code/Infantis_metadata). However, the metadata available from NCBI for the selected genomes was incomplete, and while these commands worked for a fraction of all genomes, for others the metadata provided by NCBI needed to be manually curated. After only extracting the collection date and isolation source, the isolation source was further classified into five categories (Environmental/Others, Swine, Bovine, Poultry, Human) using custom Python scripts (https://github.com/jcgneto/Frontiers_Micro_salmonella_Infantis_Newport_Typhimurium_genomics/tree/main/code/Infantis_metadata). By using this approach, the metadata for 2,870 S. Infantis genomes was able to be extracted.
Computational and Phenotypic Validation/Testing Datasets
Given the phenotypic predictions made for either the S. Typhimurium or S. Newport datasets, representative isolates were collected for computational and laboratory validation. A total of 18 S. Typhimurium clinical isolates were used for mapping of the Salmonella-genomic islands 3 or 4 (SGI-3/4) and zinc-resistance conferring loci. Among those, 12 human clinical isolates of known genotypic information obtained from University of Nebraska Medical Center (UNMC) were selected to include: 5 isolates of ST34, 1 isolate of ST2379, 5 isolates of ST19, and 1 isolate of ST2072. Furthermore, 6 genotyped bovine clinical isolates (5 isolates of ST19 and 1 isolate of ST2072) were collected from the Veterinary Diagnostic Center located at University of Nebraska-Lincoln (UNL). All STs belong to the same eBURST Group (eBG), namely eBG1 (i.e., same clonal complex—highly related), which means that they share at least five of the seven MLST loci allelic sequences (Feil et al., 2003). For S. Newport, a total of 13 genotyped human clinical isolates (2 isolates of ST5, 5 isolates of ST118, 1 isolate of ST31, and 5 isolates of ST45) were obtained from UNMC. Only two isolates of ST45 contained an extra copy of the sugE locus, namely sugE-2. STs 5 and 118 belong to eBG2, ST31 belongs to eBG7, and ST45 belongs to eBG3. For both S. Typhimurium and S. Newport, isolates were selected based on the STs of interest, while selecting distinct cgMLST variants, in attempt to avoid the impact of high degree clonality (i.e., identical cgMLSTs) of phenotyping.
Heavy Metal-Based Phenotypic Assays for S. Typhimurium
Frozen stocks of all 18 S. Typhimurium clinical isolates were prepared by aerobically growing each in tryptic soy broth (TSB; Remel, Lenexa, KS) at 37°C for 24 h, and subsequently adding glycerol (IBI Scientific, Dubuque, IA) at 20%, and storing at −80°C. Prior to phenotyping, isolates were streaked onto Mueller Hinton agar (BD Difco, Franklin Lanes, NJ), and incubated for aerobic growth at 37°C for 18–24 h. After incubation, one colony was picked and inoculated into Mueller Hinton broth (BD Difco, Franklin Lakes, NJ) and grown aerobically at 37°C for 18–24 h. The inoculum was adjusted to 105 colony-forming units (CFU)/ml by ten-fold dilutions, and cell counts were verified by plating onto Mueller Hinton agar. Zinc chloride (Sigma-Aldrich, St. Louis, MO) and copper sulfate (Acros Organics, Geel, Belgium) were dissolved in autoclaved de-ionized water to prepare stock solutions. The stock solutions were filter-sterilized using a 0.2 μm pore size, 28 mm sterile syringe filter (Corning, Corning, NY) and diluted with Mueller Hinton Broth (MHB). Then, two-fold serial dilutions of each metal were prepared in MHB in 50 ml centrifuge tubes, ranging from 1 to 640 mM for each metal. Dilutions were prepared at twice the required final concentration and 100 μL were dispensed into sterile 96 well plates (Thermo Fisher Scientific, Waltham, MA). Plates were inoculated with 100 μL of 105 CFU/ml of each bacterial isolate and then incubated at 37°C. Two sets of plates were prepared. One set was incubated aerobically and the other was incubated anaerobically using the Pack-Anaero system (Mitsubishi Gas Chemical America, New York, NY). Aerobic plates were incubated for 24 h; whereas, anaerobic plates were incubated for 48 h. At the end of the incubation period, absorbance (OD—optical density) at 600 nM was measured using a microplate reader (Biotek model Synergy H1, Winooski, VT). Absorbance was also measured at time 0 h to use as blank values and to account for background noise generated by the heavy metal solutions. Growth was defined as present if OD values were >0.20. The minimum inhibitory concentration (MIC) was recorded as the lowest concentration of heavy metal at which growth was not observed (OD600 < 0.20). All assays were performed in triplicate, and MIC values were calculated for each replicate. The mode value across all triplicates was used to report the final MIC value for that sample. Absorbance, or OD600, cut-off points were used as previously described (Branchu et al., 2019).
Cetylpyridinium Chloride Phenotypic Testing for S. Newport
Frozen stocks of 12 out of the 13 S. Newport clinical isolates were prepared by aerobically growing each strain individually in tryptic soy broth (TSB; Remel, Lenexa, KS) at 37°C for 24 h, adding glycerol (IBI Scientific, Dubuque, IA) at 20%, and then storing at −80°C. Although genome sequences for all 13 isolates from UNMC were available, an isolate for one of the five ST118 isolates was not available. Prior to the assay, all 12 isolates were inoculated into Mueller Hinton broth (MHB) (BD Difco, Franklin Lakes, NJ), and grown aerobically at 37°C for 18–24 h. The inoculum was adjusted to 105 CFU/ml by ten-fold dilutions, and cell counts were verified by plating onto Mueller Hinton agar (BD Difco, Franklin Lakes, NJ). A cetylpyridinium chloride (CPC, Spectrum Chemical, New Brunswick, NJ), a cationic quaternary ammonium compound, stock solution (128 mg/ml) was prepared in distilled water and sterilized using a 22 μm syringe filter (Corning, Corning, NY). Equal volumes (25 ml) of CPC stock solution and 2X MHB were mixed to obtain a solution with 640 ug/ml final concentration. Further two-fold dilutions were prepared using single strength MHB (Humayoun et al., 2018). The solutions were dispensed into sterile 96 well plates (Thermo Fisher Scientific, Waltham, MA), using a final volume of 100 μl per well. Plates were inoculated with 100 μl of 105 CFU/ml of each bacterial isolate and then incubated for aerobic growth at 37°C for 24 h. Two sets of plates were prepared. One set was incubated aerobically and the second was incubated anaerobically using the Pack-Anaero system (Mitsubishi Gas Chemical America, New York, NY). OD values were measured at 600 nm every 2 h during the incubation period using a microplate reader (Synergy H1, Biotek, Winooski, VT). An OD600 value >0.20 was considered as growth. The assays were performed in triplicate.
Data Processing and Visualizations
Datasets were processed for quality control all the way to tabular formatting and filtering using base R (version 4.0.3) and tidyverse (version 1.3.0). Quality control of the data was also achieved by using the following R libraries: forcats (version 0.5.0) and naniar (version 0.5.2). All missing values were filtered out from datasets across all serovars, and all R markdowns explicitly show that approach in the code. For phylogenies, misclassified serovars (i.e., serovar predicted by SISTR that did not match the classification based on the downloaded data using that serovar as “key-word”) or missing values/information were coded as “Other serovars,” since ggtree (version 2.2.4) does not accept missing data for phylogenetic plotting. Graphical visualization of quantitative data in tabular formats was achieved using ggplot2 (version 3.3.2), including all analysis done for S. Infantis metadata (source and temporal information—https://github.com/jcgneto/Frontiers_Micro_salmonella_Infantis_Newport_Typhimurium_genomics/tree/main/code/figure_7; https://github.com/jcgneto/Frontiers_Micro_salmonella_Infantis_Newport_Typhimurium_genomics/blob/main/code/supplementary_figures/Infantis/cgmlst_Infantis_temporal.Rmd). Phylogeny-based visualizations were generated by combining trees with genotypic and metadata information, while using both ggtree (version 2.2.4) and phandango version 1.3.0 (https://jameshadfield.github.io/phandango/#/). All R based analysis were done using version 4.0.3, and the necessary R markdown files to generate both main and supplementary figures are available here (https://github.com/jcgneto/Frontiers_Micro_salmonella_Infantis_Newport_Typhimurium_genomics/tree/main/code).
Statistical Analysis
An analysis of variance (ANOVA) was applied to determine the significance of main and interactive effects across factors used in the experimental designed to test for growth of both S. Typhimurium or S. Newport isolates. In the case of the S. Typhimurium dataset, the effect of individual treatments (population size at time 0, oxygen status, and the presence or not of the SGI-3/4 Integrative and Conjugative Element—ICE) and their interactions, for both the zinc and copper data, were accounted for in the model. The ANOVA model was stated as follows for both the zinc and copper S. Typhimurium datasets:
od_values = OD600 (optical density) or absorbance measured at 600 nM as an indicator for population growth
pop_size = inoculum or population size at time zero expressed as CFU/ml
oxygen = growth under aerobic or anaerobic condition
ice = the presence (1) or not (0) of the ICE or SGI-3/4 element in each isolate
concentration = zinc or copper concentration (mM)
st = representative STs used in the experiment
The ANOVA model used for the CPC S. Newport dataset was stated as follows:
absorbance = OD600 (optical density) or absorbance measured at 600 nM as an indicator for population growth
ST = representative STs used in the experiment
Treatments = growth under 0 or 25 μg/ml of CPC
time = hours of growth or incubation
For all ANOVA models, the aov() function of the R stats library (version 4.0.3) was used. ST-based frequency distribution analysis comparing S. Typhimurium Biphasic vs. Monophasic was done using a Chi-squared test (chisq.test function using the R stats library version 4.0.3). Differences between Biphasic vs. Monophasic for their degree of clonality, using the Simpson's D index of diversity, within the S. Typhimurium population was done using a two-sided t-test(y ~ x, where y is a numeric outcome, and x is a categorical predictor) function using the R stats library (version 4.0.3). Differences in growth between STs for the S. Typhimurium dataset, across population sizes vs. oxygen status vs. metal concentration for each timepoint, were calculated using a pairwise t-test using Bonferroni p-value adjustment. In particular, all pairwise t-tests done for the S. Typhimurium datasets were done using a Bonferroni correction. Also, for the S. Typhimurium phenotypic analysis, differences between ST groups were depicted using differing letters for each group (i.e., same letter indicates the absence of significant difference between two ST groups). Growth differences between ST groups for the S. Newport dataset using the treated group (25 μg/ml of CPC) were also examined using a pairwise t-test without p-value adjustment. For the pairwise t-test analysis, a two-sided pairwise.t.test() function of the stats package (version 4.0.3) in R was used. In the case of S. Newport in vitro data, all ST groups were compared to the reference ST45 sugE-2 positive group. Across all analyses, unless a family-wise p-value adjustment was used, a significant effect was determined using a threshold of p < 0.05.
Results
Overview of Hierarchical-Based Population Structure Analyses to Facilitate Mapping and Tracing of Genotypes at Scale
To illustrate the utility of hierarchical-based population genomics approaches that combine mining of core- and accessory genomic contents, populations of S. enterica lineage I (i.e., S. Typhimurium, S. Newport, and S. Infantis) were used to achieve two main goals (Figure 1): (1) demonstrate how hierarchical population inquiry at different scales of resolution can enhance epidemiological surveillance and ecological inquiries by identifying canonical (i.e., MLST-derived genotypes), and cryptic variants (i.e., hidden genotypic units or clusters); and (2) identify population-specific inferable traits that could provide selective advantages in food production environments, and drive the spread of niche-adapted genotypes. For our analyses, ProkEvo, a freely-available, automated, and scalable population genomics platform that generates hierarchical genotypic classifications and pan-genomic data including database-driven annotations of AMR loci and plasmids was used (Pavlovikj et al., 2021).
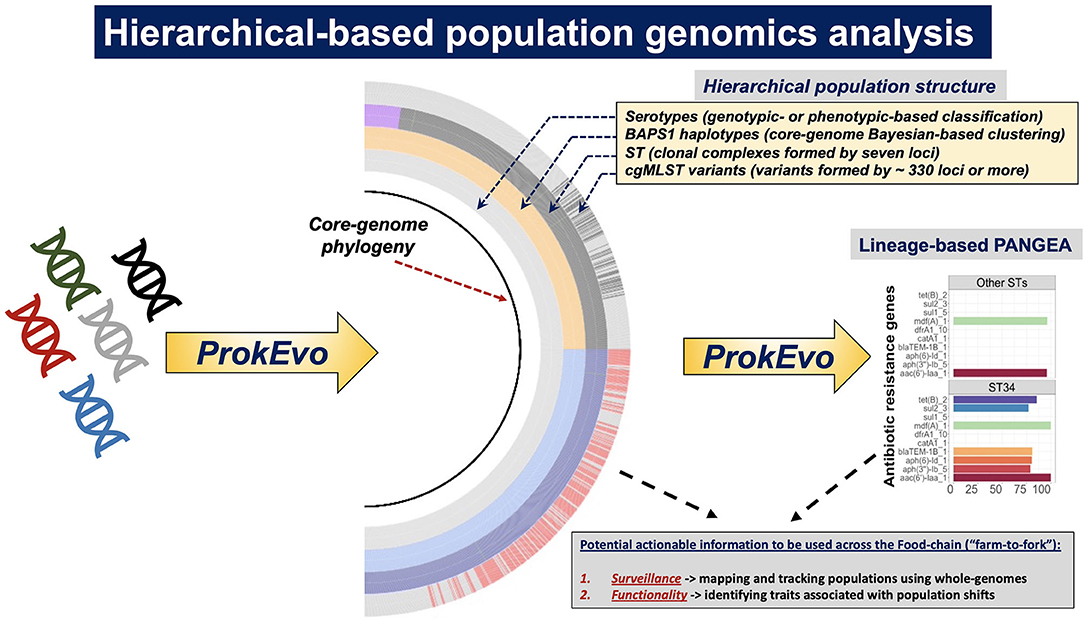
Figure 1. Systems-deployable heuristic and hierarchical-based population genomics analysis of Salmonella whole-genome sequences for discovery of novel actionable food-safety related information. Illumina raw paired-end genomic sequences were processed through the computational pipeline ProkEvo in order to generate two main outcomes: (1) A hierarchical-based population analysis of genotypes, at different levels of resolution, used to reveal unique lineages/variants and their genetic structure and relationships; and (2) Loci and plasmid mapping using pan-genomic information to predict traits of interest. For S. enterica lineage I, we used a top-down hierarchical-based system of classification comprised of serovars at the lowest level, followed by BAPS1 sub-groups or haplotypes, ST, and cgMLST at the highest level of resolution. Unique loci differentiating between lineages were found using our PANGEA approach, and by agnostic and statistically-based pattern searching across pan-genomic data, in addition to outputs from databases such as Resfinder. Lineage-associated plasmids were found by data mining results from genomic mapping using plasmid-related database. Ultimately, genotypic classifications and predicted traits were combined to obtain two levels of potentially actionable information, including (i) surveillance cues for mapping and tracking canonical and cryptic populations; and (ii) phenotypic inference of traits related to food safety that may in turn result in practical applications across the food chain.
An overview of the ProkEvo computational platform is depicted in Supplementary Figure 1. In brief, combinations of core-genomic information and all pan-genomic data were processed and analyzed, in order to generate both a phylogeny-dependent and -independent population structure analysis. Canonical lineages and variants were identified within each serovar, resulting in ST, BAPS1, and cgMLST genotypes being mapped onto phylogenetic trees, followed by a detailed analysis of their distributions, genetic relationships, and degree of clonality. Cryptic clusters were identified with a scalable computational approach by defining population structure using k-mer or SNP-based pairwise distance approaches (i.e., “Kmer-cluster” or “SNP-cluster”). The accessory genomic information was also mined to i) search for co-varying patterns of core-genomic variation and “shell-loci” distribution (genes present in ≥15% and <95% of all genomes); and ii) identify cryptic population structure that was driven by co-inheritance of common sets of accessory genes among distantly-related core-genomic variants.
Of note, the use of publicly-available databases for WGS data from isolates can be inherently biased, as it can occur by an overrepresentation of clinical vs. environmental isolates. While recognizing this limitation, the present work focused on (i) demonstrating how scalable hierarchical-based population structures can potentially inform epidemiological and ecological inquiries; and (ii) illustrating how inferential computational genomics can be used to predict traits associated with specific populations that could influence ecological fitness. Consequently, in the context of biased datasets, these case studies were designed to illustrate the potential value of our unique approaches for informing specific activities of public health and regulatory agencies, where regulatory or surveillance sampling activities are less subject to bias. Indeed, in certain regulatory and surveillance sampling strategies, the frequency of genotypes may directly relate to ecological fitness in production environments or zoonotic potential, which in turn can facilitate the identification of genetic determinants associated with the emergence and spread of such lineages or variants.
Phylogeny-Dependent Mapping of Hierarchical Population Structure Reveals Unique Genetic Relationships Across Serovars
Through our population-based analysis of three distinct zoonotic serovars of S. enterica lineage I (i.e., S. Typhimurium, S. Newport, and S. Infantis), with distinct sample sizes (~2,000–20,000 isolates), our heuristic and agnostic hierarchical-based genotypic mapping illustrated relevant epidemiological applications for each serovar. These serovars were specifically chosen based on the following set of criteria: (1) they were among the serovars recently (last 5 years) associated with well-documented human outbreaks (CDC, 2021c); (2) these serovars have distinct population structures with different degrees of clonality (Alikhan et al., 2018)—factors that can directly confound a hierarchical-based pan-genomic analysis for both genotype and trait-based discoveries (Earle et al., 2016; Power et al., 2017); and (3) these serovars have >10-fold variation (S. Typhimurium being the largest due to genomic sequence availability) in WGS available in the public databases, enabling us to assess the scalability of the ProkEvo platform (Pavlovikj et al., 2021). Serovar-specific core-genomic based phylogenetic mapping of the hierarchical population structures (Serovar -> BAPS1 -> ST -> cgMLST) is presented in Figures 2A–C. Phylogeny-guided population structure visualizations were oriented from less clonal populations of S. Typhimurium and S. Newport, to the highly clonal S. Infantis serovar. Specifically for S. Typhimurium, data generated for subset 1 out of 20 randomly created groups, is presented in Figure 2A; while the remaining phylogeny-guided genotypic mappings are available here (Supplementary Figures 2A–S).
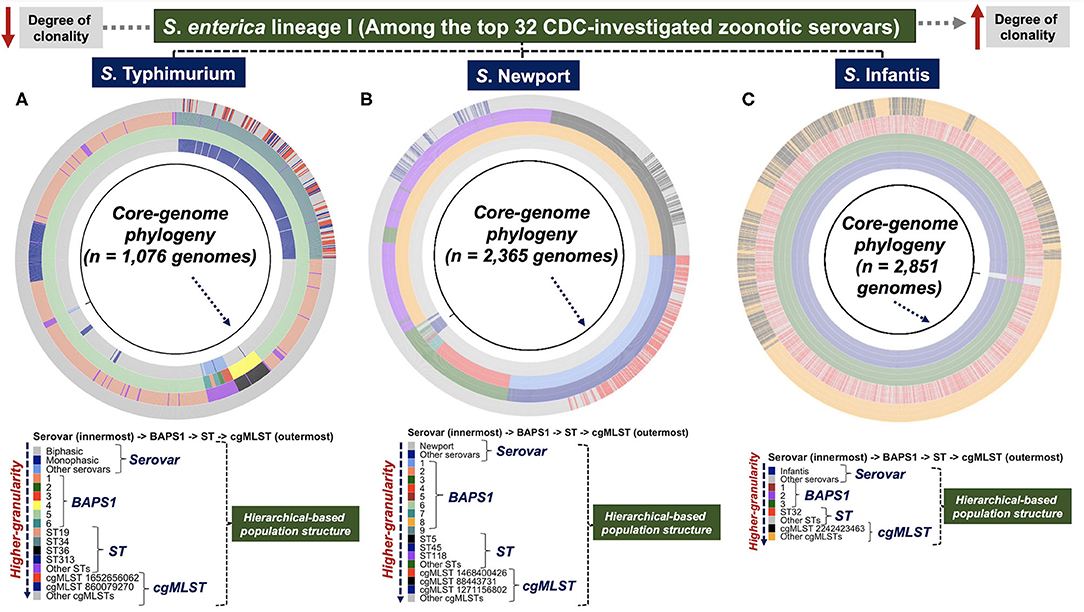
Figure 2. Phylogeny-dependent hierarchical-based population structure analysis of three distinct serovars of S. enterica lineage I showed unique genomic diversity and topology. Three zoonotic serovars of S. enterica lineage I, with varying degree of clonality and population structure, were selected for a heuristic phylogeny-guided population-based genomics analysis, and included: (A) S. Typhimurium (n = 1,076 genomes—group 1 of 20 data subsets) and (B) S. Newport (n = 2,365 genomes) which are less clonal (i.e., higher degree of genotypic heterogeneity); and the highly clonal population of (C) S. Infantis (n = 2,851 genomes). Of note, for S. Typhimurium (A), subset/group 1 out of the 20 randomly generated subsets is shown in the Figure. These serovars belong to a list of the top 32 most investigated populations related to recent human outbreaks, as reported by the CDC. A core-genome phylogeny (black ring) was used as a genomic anchor to position each genome, and show their genetic relationships. Phenotypes and genotypes, comprising a hierarchical-based classification system were mapped onto the phylogenetic tree, including: serovars (1st colored ring) at the lowest level (can be generated phenotypically or predicted genotypically by SISTR), BAPS1 (2nd colored ring), ST (3rd colored ring), and cgMLST (4th colored ring) at the highest level of genotypic resolution. This hierarchical-system used a top-down approach that facilitates visualization of the familial genetic relationships across populations, as well as the degree of clonality based on the distribution of BAPS1, ST, and cgMLST genotypes. A more clonal population depicts lower BAPS1, ST, and cgMLST genetic diversity. As the classification systems moves outward across the tree from serovars to cgMLST, the degree of genotypic resolution increases. The initial NCBI-SRA downloaded genomic sequence sample size (i.e., accession list of SRA identifications selected for analysis) for each serovar was: S. Typhimurium (n = 23,045—“Worldwide”), S. Newport (n = 2,392—“USA only”), and S. Infantis (n = 2,870—“USA only”). The S. Typhimurium dataset was randomly split into 20 subsets containing from 1,076 to 1,077 genomes each. While processing through ProkEvo, low quality assemblies are filtered out, thereby explaining the difference in counts for each serovar from downloaded to ultimately analyzed genomes used for ecological and epidemiological inferences. Of note, “Other serovars” represents serovars that were either not classified as any of the three ones used in this paper, or were misclassified by SISTR within ProkEvo. The groups called “Other STs” or “Other cgMLSTs” corresponded to minor variants present in each respective population. Core-genome phylogenies was visualized using ggtree.
Salmonella Typhimurium was comprised of two divergent lineages (Figure 2A): Biphasic (major STs include ST19, ST36, and ST313) and Monophasic (mostly ST34). The Monophasic lineage, which is a zoonotic pathovar typically found in livestock animals (Sun et al., 2020), was recently shown to harbor a unique integrative and conjugative element (ICE) called Salmonella genomic island (SGI)-3/4 containing loci capable of conferring resistance to heavy-metals such as copper, arsenate, and silver (Arai et al., 2019; Branchu et al., 2019). Below the ST-level, ST34-Monophasic was comprised of two major cgMLST variants (i.e., cgMLST 1652656062 and cgMLST 860079270). By examining the relationships of STs and cgMLST variants above the ST-level, our BAPS1-based haplotype analysis showed that, with the exception of the distinct phylogroup ST36 (BAPS1 sub-group 4), all major STs (ST19, ST34, and ST313) of S. Typhimurium belonged to BAPS1 sub-group 5. Comparably, an eBG-based analysis corroborates our BAPS1 findings, with ST36 belonging to eBG138, while all the other three major STs represent a single clonal complex eBG1 (Zhou et al., 2020). In short, both BAPS level 1 and eBG mapping imply that ST19, ST313, and the Monophasic ST34 have recently shared a common ancestor, most likely derived from an immediate ancestor of ST19.
Although S. Newport population structure was more diverse than S. Typhimurium at the BAPS level 1 (Figure 2B), most of its population was formed by ST5, ST45, and ST118. The ST5 and ST118 populations both belonged to BAPS1 sub-group 8 (eBG2); whereas, ST45 formed a discrete phylogroup that belongs to clonal complex eBG3, represented by BAPS1 sub-group 1 (Figure 2B). Thus, ST5 and ST118 appeared to share a more recent common ancestry, while ST45 likely diverged in a more distant past. Each of the dominant S. Newport STs (ST5, ST45, and ST118) contained a single cgMLST (Figure 2B) that makes up a substantial proportion of all cgMLST variants. In contrast to S. Typhimurium and S. Newport, the S. Infantis population had a higher degree of genotypic homogeneity at all levels, being predominantly represented by: BAPS1 sub-group 3 (eBG31), ST32, and cgMLST 22424223463 (Figure 2C). Examination of the distribution of pairwise SNPs within each serovar also showed an increased degree of clonality of S. Infantis compared to the other serovars (Supplementary Figure 3). Independently, a scalable cluster-based phylogeny-independent approach using either K-mer or SNP pairwise-based distances, combined with a multi-dimensionality reduction analysis (tSNE), revealed topological clustering that largely recapitulated the serovar-specific genetic relationships at all levels of genetic resolution (BAPS1, ST, and cgMLST) (Supplementary Figures 4A–Z, 5:23A–H).
To test for cryptic population structures, a combination of Kmer-clustering and SNP-based clustering with the core-genomic information as input data was used. For S. Typhimurium (Supplementary Figures 4T,Z, 5:23D,H) and S. Newport (Supplementary Figures 4L,P), the Kmer- and SNP-clusters largely overlapped with their respective ST-level distributions (Supplementary Figures 4A–Z, 5:23A–H). In contrast, analysis of the S. Infantis data revealed two (Kmer-clusters) or three (SNP-clusters) distinct sub-populations that were not resolved by BAPS1 or MLST-based genotyping (Supplementary Figures 4D,H). These apparently cryptic clusters of S. Infantis were detectable by k-means analysis, with the optimal number of clusters being defined from the within cluster sum of squares and Silhouette analytical computations (Supplementary Figures 24:26A–D). Importantly, the use of a phylogeny-independent approach becomes advantageous when phylogenies cannot be estimated accurately, or when topological or branching-pattern visualization is difficult due to large sizes of datasets (Abudahab et al., 2019). Altogether, the use of a hierarchical-based population structure analysis revealed serovar-specific genetic relationships, while allowing for mapping and tracing of unique genotypes (i.e., canonical or cryptic), that can ultimately facilitate epidemiological surveillance at different levels of genotypic resolution.
Frequency Distribution of Genotypes at Different Levels of Resolution May Be Used as a Proxy for Ecological Fitness
The use of a hierarchical-based population structure analysis provided a direct basis for quantification and analysis of genotypes at different levels of resolution (Figures 2A–C). Our hierarchical-based approach revealed unique predominant lineages or variants while contextualizing their familial or kinship relationships, for which, frequency distribution becomes a proxy that can relate to ecological characteristics such as founder effects, fitness, and even ecological succession. Of note, previous analyses of the population structure of these three serovars has provided detailed account for genotypic frequencies at different levels of resolution (Pavlovikj et al., 2021). Analysis of the S. Typhimurium population, based on relative frequencies, demonstrated that the Biphasic lineage was predominant when compared with Monophasic (Figure 3A). Below the serotypic-level, BAPS1 proportion-based analysis revealed that BAPS1 sub-groups 4 and 5 are the most dominant ones (Figure 3B). However, BAPS1 sub-groups 4 and 5 (the two most dominant ones) were most often the same haplotype, that simply varied in number across most of the 20 subsets of S. Typhimurium datasets. This stochastic haplotype shifting between BAPS1 sub-groups 4 and 5 was expected due to the intrinsic fastbaps algorithmic randomness derived from using a Bayesian clustering classifier. More specifically, for S. Typhimurium, BAPS1 sub-groups 4 and 5 most often mirrored the ST distribution for eBG1 (Alikhan et al., 2018; Zhou et al., 2020), and were comprised of the most dominant STs including: ST19, ST34, and ST313 (Figure 2A; Supplementary Figures 2A–T). When examining the ST-based distribution, a significant shift (p < 0.05) clearly differentiating between Biphasic (mostly ST19) and Monophasic (mostly ST34) lineages frequencies (Figure 3C) was noted. At the ST-level, Biphasic was more diverse than Monophasic, since the Monophasic contained two other co-dominant STs (ST36 and ST313) along with ST19. Lastly, at the cgMSLT level, the Biphasic lineage distribution was sparse (Figure 3D); whereas, for Monophasic, there were two co-dominant variants, with the following relative frequencies across all cgMLSTs (entire S. Typhimurium population): cgMLST 1652656062 representing an average of 32% of isolates among all cgMLST genotypes, while cgMLST 860079270 averaged 20% of isolates (Figure 3D). Collectively, all Monophasic genotypes formed a distinct lineage that had a significantly higher degree of clonality (p < 0.05), when compared with the Biphasic lineage, at all levels of genotypic resolution (ST, cgMLST, and BAPS1-6) (Figure 3E). It is important to note that sampling bias cannot be excluded as a main confounding factor for population structure and degree of clonality in these studies. However, the ability to detect vastly different degrees of clonality among Monophasic and Biphasic populations does provide an important basis for systematic evolutionary and ecological analyses using unbiased datasets. Indeed, a nested BAPS1-6 analysis of core-genomic composition showed variation in haplotype diversity between Monophasic vs. Biphasic populations (Supplementary Figure 27), which suggests the presence of deeper cryptic variants in the population that can reflect either population drift or ongoing frequency-dependent selection (Fraser et al., 2005; Harrow et al., 2021).
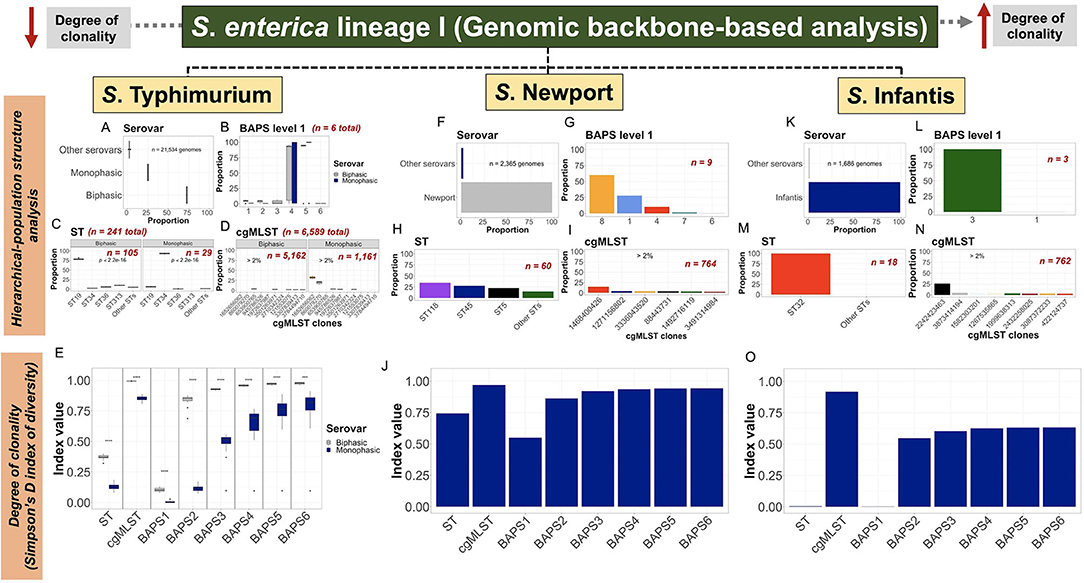
Figure 3. Scalable core-genomic analysis of three zoonotic serovars of S. enterica lineage I linked population structure and genetic diversity with degree of clonality. Core-genomes (i.e., share-genomic content) alignments, generated independently for S. Typhimurium, S. Newport, or S. Infantis dataset, were hierarchically classified into serovar, BAPS1, ST, and cgMLST. Serovar was predicted using the cgMLST-based genotyping done by SISTR within ProkEvo. Frequency distributions were initially produced at each level of classification, and thereafter converted into proportions for population structure analysis; or used as input data (i.e., frequencies) for estimating the degree of clonality using the Simpson's D index of diversity (1—D). (A–D) Proportion of serovar (n = 21,524 genomes), BAPS1 (n = 21,524 genomes), ST (n = 21,309 genomes), and cgMLST (n = 19,226) classifications for S. Typhimurium (initial input of n = 21,534 genomes—“Worldwide”). (E) S. Typhimurium degree of clonality stratified by serotypic classification into: Biphasic vs. Monophasic; across ST (n = 21,309 genomes), cgMLST (n = 19,226 genomes), and BAPS1-6 levels (n = 21,524 genomes for each BAPS layer from 1 to 6). A two-sided t-test was used to determine whether the two serovars significantly differed (p < 0.05) from one another in their degree of clonality across genotypic levels. (F–I) Proportion of serovar (n = 2,365 genomes), BAPS1 (n = 2,365 genomes), ST (n = 2,361 genomes), and cgMLST (n = 2,289 genomes) classifications for S. Newport (initial input of n = 2,365 genomes—“USA only”). (J) Degree of clonality across the S. Newport population across ST (n = 2,361 genomes), cgMLST (n = 2,289 genomes), and BAPS1-6 levels of genotypic resolution (n = 2,365 genomes for each BAPS layer from 1 to 6). (K–N) Proportion of serovar (n = 1,686 genomes), BAPS1 (n = 1,685 genomes), ST (n = 1,683 genomes), and cgMLST (n = 1,659 genomes) classifications for S. Infantis (initial input of n = 1,686 genomes—“USA only”). (O) Degree of clonality across the S. Infantis population using ST (n = 1,683 genomes), cgMLST (n = 1,659 genomes), and BAPS1-6 levels of genotypic resolution (n = 1,685 genomes for each BAPS layer from 1 to 6). For the degree of clonality, the higher the value for the Simpson's D index of diversity (index value), the less clonal or the more diverse the population is, at that specific level of genotypic resolution. Numbers (n) located inside and outside of each plot refers to the total number of sub-groups/haplotypes (BAPS1), ST lineages, and cgMLST variants found within the population, or sub-population (i.e., Biphasic vs. Monophasic), of each serovar. Missing values were dropped for all analyses to keep only genomes correctly classified by SISTR to that specific serovar. Of note, “Other serovars” represents serovars that were either not classified as any of the three ones used in this work, or were misclassified by SISTR within ProkEvo. The groups labeled as “Other STs” corresponded to low-frequency lineages present in each respective population. Across all serovars, only serovar-specific (predicted by SISTR) cgMLSTs for which the proportion was above 2%, were ultimately shown in the graph for aesthetic purposes. For S. Typhimurium plots (C) and (E), asterisks refer to the degree of significance for differences calculated using a Chi-squared test and t-test, respectively (*p < 0.05, **p ≤ 0.01, ***p ≤ 0.001, ****p ≤ 0.0001, and NS = not significant at p ≥ 0.05).
Although there were nearly 10-fold fewer genomes, genetic diversity and population structure of S. Newport (Figure 3F) was quite different from S. Typhimurium. At the BAPS1-level, S. Newport sub-groups or haplotypes 8 (60.1%), 1 (28%), and 4 (10.1%) were the most dominant ones (Figure 3G). BAPS1 sub-group 8 was mostly comprised of ST5 and ST118 (Figure 2B), which represented 22.9% and 34.6% of all genomes across the entire S. Newport population, respectively (Figure 3H). ST45 phylogroup represented 27.8% of all STs (Figure 3H), and belonged to BAPS1 sub-group 1 (Figure 2B). At the highest level of resolution, there were three dominant cgMLST variants across the entire S. Newport population: cgMLST 1468400426 representing 14.3%, cgMLST 1271156802 representing 4.32%, and cgMLST 88443731 representing 3.78% (Figure 3I). Each of the dominant cgMLST variants belonged to a different ST lineage, with cgMLST 88443731 being a dominant variant of ST5 (16.1%), cgMLST 1468400426 being a dominant variant of ST45 (51.2%), and cgMLST 1271156802 dominating the ST118 lineage (12.3%). As expected, S. Newport had a higher degree of clonality at the ST level when compared to cgMLST (Figure 3J). Within major STs, ST45 was the most clonal lineage (Supplementary Figures 28:29). Combined, the S. Newport population structure analysis suggested that most of the population-based core-genomic variation was a direct consequence of the ST-based diversification, with lineage segregation being mostly driven by ST45 discrete phylo-grouping. Hence, the importance of continual ST-based surveillance across the food chain.
For S. Infantis (Figure 3K), BAPS1 sub-group 3 and ST32 represented 99.9% and 99.8% of the entire population, respectively (Figures 3L,M), implying a very high degree of clonality. At the cgMLST-level of resolution, cgMLST 2242423463 comprised 26.3% of the entire S. Infantis population (Figure 3N), and represented 26.4% of the ST32 lineage alone. The high S. Infantis-associated degree of clonality was confirmed in Figure 3O, with almost no diversity detected at the ST and BAPS1 levels, with higher Simpson's D index for cgMLST, followed by a rapid index plateau across BAPS1-6. Although the S. Newport and S. Infantis populations analyzed in this data set were limited to the USA compared to the global population of S. Typhimurium, the population structures of all three serovars appear to be conserved among subsets of the data from their respective levels (national and global) (Alikhan et al., 2018). Thus, despite the geographical bias, the kinship structures revealed by our hierarchical-based approach and the distinct distributions of hierarchical genotypes (e.g., specific STs or cgMLSTs) may still reflect meaningful epidemiological and ecological characteristics of these populations. ST-based surveillance using frequency distributions has been shown to be an effective proxy to understand the ecological fitness of pathogens such as Streptococcus pneumoniae (Azarian et al., 2018). Given the observed variation present in the ST lineages or cgMLST variants across these three S. enterica lineage I serovars, frequency distributions may be used as a proxy for ecological fitness when systematically doing regular sampling across the food chain.
Accessory Genome Mining Can Be Used to Identify Serovar-Specific Cryptic Population Structure
The detailed hierarchical population genomics analyses of S. Typhimurium, S. Newport, and S. Infantis based on the core genomic-backbone (i.e., ST and cgMLST variants) yielded new information regarding kinship of populations (Figures 2A–C, Figures 3A–O) and high-resolution discrimination of potential cryptic populations (Supplementary Figures 4A–Z, 5:23A–H). This was followed up with an integrated approach using different types of pan-genomic analyses. Using agnostic pan-genomic analyses, formal analysis of accessory genomic content demonstrated two important patterns across populations. First, shell-loci that co-varied with the hierarchical-based population structure (BAPS1, ST, and cgMLST) were identified. Second, accessory loci with distinct distributions among MLST or BAPS-based genotypes were defined, showing unique population structures that would not be detectable by MLST, cgMLST, or BAPS-based genotyping alone.
Serovar-specific, accessory genomic content was first ordinated by a two-dimensional logistic PCA, and the distribution of groups were examined using agnostic k-means clustering (Kmer-clusters), or in a supervised manner using core-genomic genotypic labels (BAPS1, ST, cgMLST, Kmer-cluster or SNP-cluster derived from tSNE analysis) (Supplementary Figures 30A–R, 5:23I-N). For S. Typhimurium, the Monophasic lineage (mostly formed by ST34) formed a discrete cluster, reflecting a strong co-inheritance (i.e., linkage disequilibrium) between the core-genome backbone and “shell-loci” (Figures 4A,B; Supplementary Figures 30N,P,R, 5:23J,N). Notably, ST34 appears to have two cryptic sub-clusters in its population (Figures 4A,B). In the case of S. Newport, the ST5 and ST118 lineages shared overlapping accessory genomic composition, predicted by their kinship as members of BAPS1 sub-group 8 and eBG2 (Figures 4C,D; Supplementary Figures 30G,H). In general, both core- and shell-genomic loci of S. Typhimurium and S. Newport shared similar patterns of ST-linked co-inheritance.
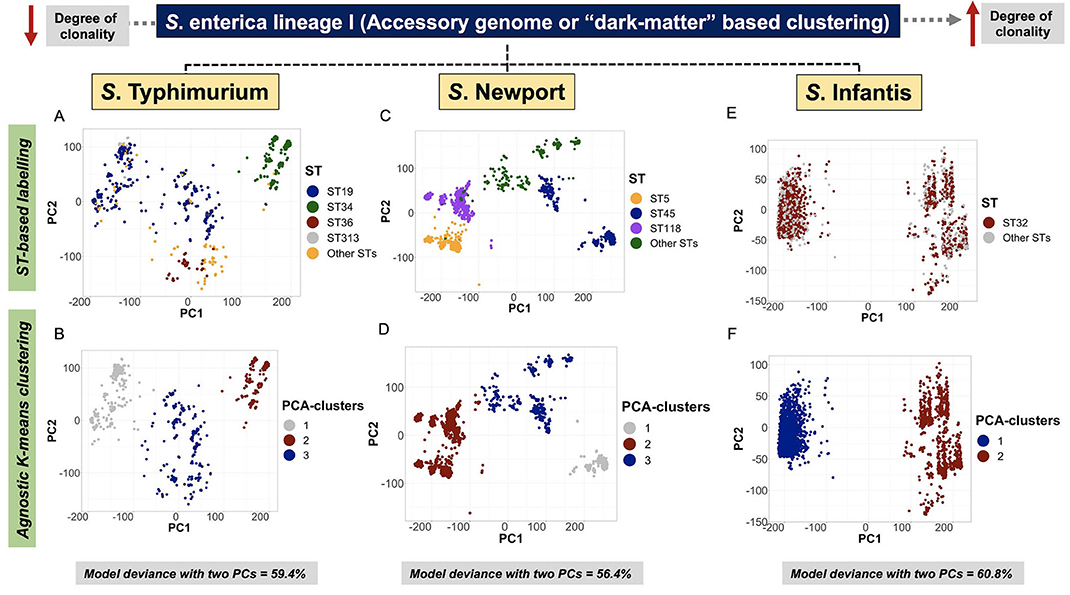
Figure 4. Accessory genome-based clustering revealed a co-inherited pattern with genomic backbone, and unique cryptic clusters across serovars. A logistic PCA was used to ordinate genomes in two dimensions (PC1 and PC2) by only using “shell-genes or shell-loci” (i.e., genes that are present in ≥ 15% and <95% of genomes in the data) as input. The “shell-loci” data are comprised of binary information containing 1 for presence and 0 for absence of each locus. For S. Typhimurium, only data generated for subset 1 (n = 1,076 genomes) out of the 20 random subsets is presented here. (A) ST-based labeling of the PCA ordination showing all four major STs, including ST34 (Monophasic) as a discrete cluster (green color). (B) Agnostic k-means clustering using the two PCs as input, generated three clusters for the S. Typhimurium data, of which cluster 2 overlapped with the ST34-Monophasic sub-population. For S. Newport (n = 2,365 genomes), (C) ST-based labeling showed ST5 and ST118 as neighboring clusters, and a separation of the ST45 lineage with two cryptic sub-clusters within it. (D) Similar to S. Typhimurium, the S. Newport data were clustered into three clusters based on an agnostic analysis, for which cluster 1 overlaps with the topological distribution of ST5 and ST118, reinforcing their high degree of genetic relatedness (i.e., recently shared a common ancestor). As for S. Infantis (n = 2,851 genomes), (E) ST32 is spread across the two cryptic clusters present in this population; whereas, non-supervised clustering of the S. Infantis data revealed two cryptic clusters within it (F). Across all serovars, the optimal number of k-means clusters was determined by examining the within cluster sum of squares across the number of clusters tested by the algorithm. All model deviances were calculated using only the first two PCs.
In contrast to co-inheritance of core-genomic variation and shell loci in S. Newport ST5 and ST118, the phylogenetically distinct ST45 lineage (Figure 2B) contained unique informative “shell-loci” that were not found in ST5 and ST118 (Figure 4C), and distribution of these shell loci in ST45 appeared to define two different cryptic populations within ST45 (Figure 4D). These two ST45 cryptic clusters were both linked to highly-clonal genomic-backbone (mostly cgMLST 1468400426, Kmer-cluster 1, or SNP-cluster 3) (Supplementary Figures 30I–K), which may reflect recent gain or retention of fitness-conferring loci (Cohan, 2019). These data suggested that the evolution of ST45 was largely influenced by selection on the accessory genome content, and posed the hypothesis for the existence of two cryptic Ecotypes in its population (i.e., Ecotypes are a set of strains with similar ecological traits such as metabolic adaptations) (Cohan, 2006, 2019; Cohan and Koeppel, 2008). The most remarkable levels of differentiation based on accessory genomic loci were observed among S. Infantis. In this serovar, the accessory genome clearly showed two distinct patterns of distributions among populations defined by BAPS1, ST, or cgMLST genotypes (Figures 4E,F). Similar to S. Newport ST45, two distinct S. Infantis clusters based on accessory genomic content (Figure 4F), were linked to a common genomic-backbone (Supplementary Figures 30D,E), suggesting the existence of two major Ecotypes in the population (Cohan, 2006; Cohan and Koeppel, 2008). Of note, the results of the analytical procedure used to determine the number of k-means clusters (PCA-clusters shown in Figures 4B,D,F) for all analyses across all serovars is shown here (Supplementary Figures 31–33, 5:23O). In summary, accessory genome mining adds an extra layer of resolution for further population sub-division, thereby potentiating surveillance capabilities, while revealing cryptic clusters, or putative Ecotypes that may reflect unique shifts in ecological and/or epidemiological patterns. Additionally, it appears that the more clonal a population is (i.e., high degree of genotypic homogeneity in the core-genome), the more likely the accessory genome is to be informative for meaningful population structuring whereby hidden genotypic units can be revealed.
Scalable ST-Based PANGEA Identifies Unique AMR-Loci Distribution Across S. Typhimurium and S. Newport Populations
Using the systems-based agnostic PANGEA to computationally infer selectable traits among lineages of S. Typhimurium and S. Newport populations, distinct distributions of ancestrally-acquired or recently-derived AMR-loci, in both ST34 of S. Typhimurium Monophasic and ST45 of S. Newport, were identified. This approach used three consecutive steps that included: (1) discovery of candidate loci based on agnostic mapping to define genomic segments that discriminate different STs among large-scale datasets; (2) a subsequent in silico validation using population-structure guided analysis to define subsets of isolates from each population for phenotypic testing; and (3) in vitro phenotyping of computationally-predicted traits among subsets of isolates from the relevant genotypic lineages. Candidate ST-specific loci were initially identified using a non-supervised univariate logistic regression model approach for filtering out statistically significant loci (see the Pan-genomic logistic regression modeling for loci identification section for our “hits set of criteria”); and ii) utilizing a supervised-based assessment of the distribution of AMR-loci and plasmids predicted within ProkEvo.
In the case of S. Typhimurium (Figure 5A; Supplementary Figures 34:52, 53A), ST34 contained a unique combination of AMR-loci orthologs known to confer resistance to a broad range of antibiotic classes, including tetracyclines (tet genes), sulfonamides (sul genes), aminoglycosides (aph genes), and beta-lactamases (bla family of genes) (McArthur et al., 2013). Additionally, ST34 preferentially contained loci involved in heavy-metal resistance, such as copper/arsenate/silver (sil, pco, cus, and ars genes present in the SGI-3/4), and mercury (mer genes). Linked inheritance of chromosomal and mobile genetic elements (AMR-loci, SGI-3/4, and IncQ1_1 plasmid), suggested that these genetic elements were recently-acquired by ST34, or lost over time by other STs within the S. Typhimurium population (Cohan and Koeppel, 2008). In contrary, zinc-conferring resistance loci (zit and znt genes) appear to be widespread among multiple STs, suggesting an ancestral acquisition by the S. Typhimurium population; a pattern that can either reflect hitchhiking or ongoing adaptive selection (Figure 5A; Supplementary Figure 34:52) (Cordero and Polz, 2014; Shapiro and Polz, 2014).
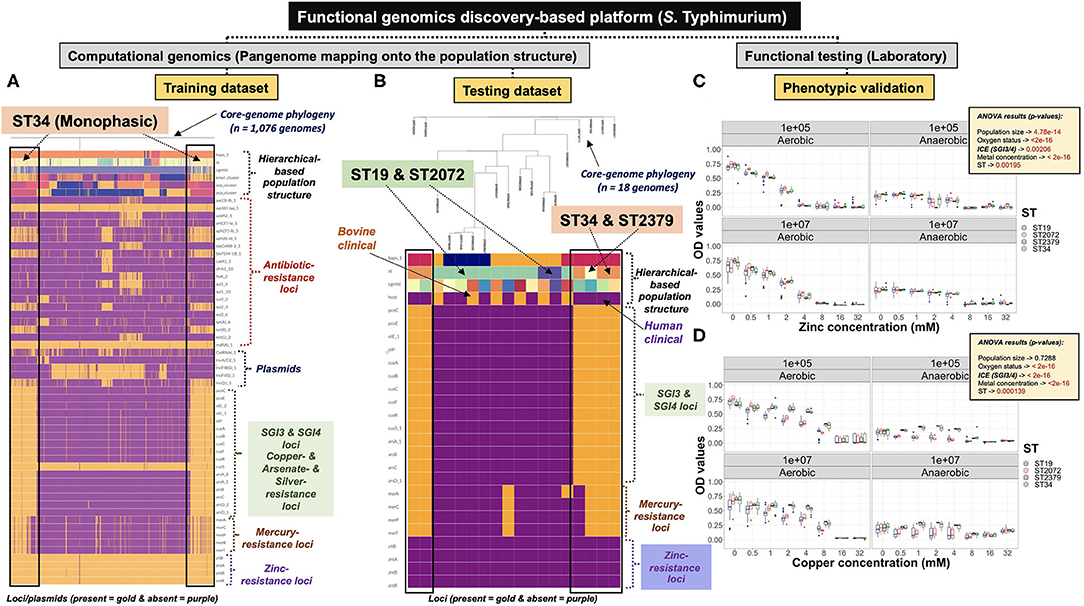
Figure 5. Functional genomics discovery platform combining population genomics and phenotypic validation showed a preferential occurrence of SGI-3/4 in the S. Typhimurium ST34-Monophasic lineage. (A) Core-genome phylogeny-based analysis combining the S. Typhimurium hierarchical population structure, along with loci (e.g., AMR genes) and plasmids, differentiating ST34 from other STs. A training dataset containing 1,076 genomes, representing group 1 of the 20 independent training datasets, was used for discovery of genomic attributes preferentially inherited by ST34. (B) A testing dataset containing representative STs (Biphasic vs. Monophasic) and distinct cgMLSTs, comprised of human (n = 12) and bovine (n = 6) clinical isolates was used for validation of predicted phenotypes. Specifically, ST34 (n = 5) and ST2379 (n = 1) were predicted to be more resistant to heavy metals such as copper than ST19 (n = 10) and ST2072 (n = 2); whereas, all isolates were expected to be comparably susceptible to high doses of zinc. Phenotypic testing for either zinc (C) or copper (D) resistance, using a biological gradient approach, was carried out under aerobic and anaerobic conditions, while considering two different initial population sizes (i.e., 105 or 107 CFU/ml). (C) The pattern of zinc susceptibility was comparable across all isolates, with a significant impact of the oxygen status; for which maximum growth, regardless of the ST-background, was only achieved under aerobic condition, but was negatively impacted by the increasing zinc concentration. (D) On average, STs containing the SGI-3/4 genetic element (ST34 and ST2379) resisted higher concentrations of copper (~ up to 2-8 mM), regardless of the population size and oxygen status. For plots (A) and (B), each column represents a single genome, and each row represents either a locus or plasmid. For either loci or plasmids, presence is depicted by the color gold, and absence by purple. For plots (C) and (D), p-values for each main effect were generated using multivariate ANOVA models. OD values were measured at 600 nM. Core-genome phylogeny guided mapping of population structure and genetic elements were visualized with phandango (A,B).
Based on the ST34-associated predictions, a set of S. Typhimurium clinical isolates originating from either bovine or humans were selected, and upon analysis were confirmed to harbor SGI-3/4-associated and zinc-conferring resistance loci (Figure 5B). Specifically, ST19 and ST2072 lacked the SGI-3/4 element, while isolates from ST34 and ST2379 carried the loci, and all STs lacked zitB, and all three znt genes. Based on this computational validation dataset, isolates of ST34 and ST2379 would be predicted to have higher levels of resistance to copper than ST19 and ST2072, while, isolates from all STs would be similarly susceptible to zinc exposure. Of note, all four STs belonged to BAPS1 sub-group 4 or 5, and eBG1 (i.e., same clonal complex), were represented by distinct cgMLST variants (Supplementary Table 1). To confirm our hypotheses, the same set of validation isolates were used to test for copper and zinc resistance using in vitro growth experiments. As shown in Figure 5C, all STs had similar degrees of susceptibility to zinc under both aerobic and anaerobic conditions (Supplementary Table 2; Supplementary Figures 54–57). However, as predicted, isolates of ST34 and ST2379 were on average significantly (p < 0.05) more resistant to copper and capable of growth at higher copper concentrations (up to 2-8 mM), regardless of the oxygen status or population size (initial inoculum size) (Figure 5D and Supplementary Figures 58–61; Supplementary Table 3). Copper-resistance decreased at concentrations >8 mM (Figure 5D), and the susceptibility pattern was corroborated by MIC results (Supplementary Table 4). Maximum copper resistance in vitro was only achieved under aerobic condition (Figures 5C,D). Differently than all other major STs of the eBG1clonal complex, ST34 appeared to have acquired and maintained a unique composition of quantitative traits such as copper resistance, for which the variation, at least in part, was explained by gene orthologs capable of conferring resistance to an array of heavy-metals.
In the case of S. Newport (Figure 6A), candidate AMR-loci were found uniquely in isolates of ST45 that are orthologous to known resistance genes of multiple antibiotic classes, including: tetracyclines (tet genes), sulfonamides (sul genes), aminoglycosides (neo and aph genes), beta-lactamases (bla family of genes), amphenicols (floR which confers florfenicol resistance) (McArthur et al., 2013). In addition to specific AMR-loci, isolates of ST45 were more likely to harbor plasmids of the CoIRNAI_1 and IncA/C2_1 families (Figure 6A). Other loci putatively involved in genome replication, recombination, transcription/metabolism, intestinal epithelial (IEC) attachment, and folate synthesis were also uniquely co-inherited with AMR genes in ST45 (Figure 6A; Supplementary Figures 53B, 62). In addition to the AMR genes and plasmids, a unique candidate locus was also identified in the genomes of ST45 isolates, all of which carried an additional copy of the gene sugE, referred to as sugE-2. The sugE gene is a known part of a small multidrug transporter family of proteins known to contribute to resistance to quaternary ammonium compounds (i.e., quats or QACs) (Chung and Saier, 2002; Bay et al., 2008). These antimicrobials are typically used in the food industry (Wirtanen and Salo, 2003). Therefore, we focused our predictive computational and phenotypic analysis on the effects of the additional sugE-2 gene in the ST45 background. To account for the S. Newport population structure, unique cgMLST variants (Supplementary Table 5) among human clinical isolates belonging to ST5 and ST118 (BAPS1 sub-group 8 or eBG2), ST31 (BAPS1 sub-group 4 or eBG7), and ST45 (BAPS1 sub-group 1 or eBG3) were selected. The sugE-2 locus was found only among ST45 isolates (present in two of five isolates), but not in isolates of any other ST (Figure 6B).
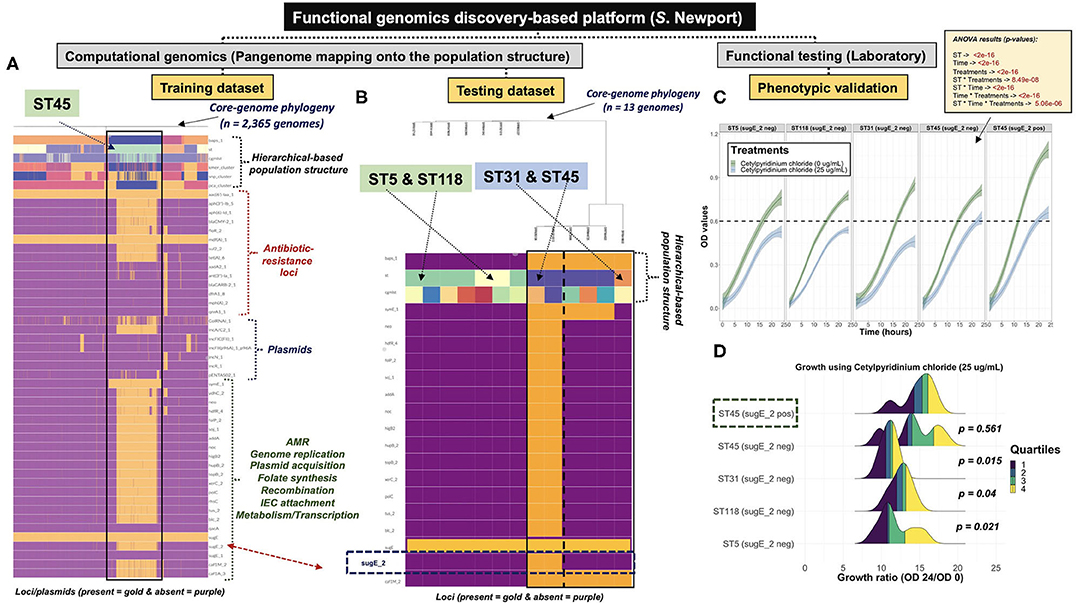
Figure 6. Functional genomics discovery-based platform revealed a quantitative trait preferentially associated in the S. Newport ST45 lineage. (A) Core-genome phylogeny-based analysis combining the S. Newport hierarchical population structure, along with loci (e.g., AMR and metabolic genes) and plasmids, differentiated ST45 from other STs. A training dataset containing 2,365 genomes was used for discovery of genomic attributes preferentially inherited by ST45. (B) A testing dataset containing representative STs and distinct cgMLSTs, selected from human clinical isolates (n = 13) was used for in silico and in vitro validation of predicted phenotypes. Specifically, sugE-2 negative ST5 (n = 2), ST118 (n = 5), ST31 (n = 1), and ST45 (n = 3) were predicted to be more susceptible to cetylpyridinium chloride-CPC (i.e., cationic quaternary ammonium compound—quats) than ST45 sugE-2 positive (n = 2) isolates. All isolates contained sugE-1, named as sugE in plot B. Phenotypic testing was done over time (for 24 h with growth measured every 2 h) under aerobic condition (i.e., quats exposure occurs in the environment), while controlling for the initial population size (105 CFU/ml) across all STs. (C) CPC treatment of 25 μg/ml was used to test for quats resistance. (C) On average both ST45, containing or not the sugE-2 locus, demonstrated higher resistance for CPC over time. Of note, although we had genome sequences for all 13 isolates (B), we lacked an isolate for one of the five ST118 isolates for phenotypic testing (n = 12 isolates). (D) Comparative analysis of growth ratio between OD600 values from 24 h to time 0 (OD600 24/OD600 0), under CPC treatment (25 μg/ml), revealed no significant difference on the average growth between ST45 representatives, but ST45 was more resistant than all other STs. Of note, ST45 sugE-2 positive has a bimodal, rather than trimodal (ST45 sugE-2 negative) distribution, that is right skewed, suggesting an important shift in the resistance phenotype underlying this quantitative trait. For plots (A) and (B), each column represents a unique genome, and each row represents either a locus or plasmid. For either loci or plasmids, presence is depicted by gold, and absence by purple. For plots (C) and (D), p-values were calculated using a multivariate ANOVA model or pairwise t-test (i.e., comparing to the reference group ST45 sugE-2 positive), respectively. Core-genome phylogeny guided mapping of population structure and genetic elements were visualized with phandango (A,B).
Therefore, the prediction was that ST45 sugE-2 positive isolates would be more resistant to quaternary ammonium salts such as CPC. We tested this hypothesis by comparing growth of isolates in the presence and absence of CPC in vitro. On average, ST45 isolates have a higher degree of resistance to CPC compared to other STs (Figures 6C,D). However, there was no difference in the average growth ratio on the ST45 background in the presence or absence of sugE-2 gene (p < 0.05). Notably, ST45 isolates containing sugE-2 showed a larger peak that is right skewed (larger values suggesting higher resistance) than that of ST45 sugE-2 negative isolates (Figure 6D). Notably, sugE-2 negative isolates of ST45 also showed some level of resistance to CPC, suggesting that other loci in this ST may have also contributed to CPC resistance. Thus, while sugE-2 is minorly associated with resistance in ST45, resistance is likely a multigenic trait and additional loci (i.e., genes or SNPs across alleles) may also contribute to resistance. Altogether, our functional genomics approach demonstrated the potential to predict quantitative traits solely on the basis of population structure (STs), while mapping unique loci that could provide a partial mechanistic basis for understanding complex phenotypes such as fitness in different food production environments.
Pan-Genomic Analysis Reveals Two Unique Zoonotic Ecotypes Present in the S. Infantis Population
The results of S. Typhimurium and S. Newport populations demonstrated how combining core- and accessory genomic analyses can reveal cryptic population structures and identify population-specific phenotypes that may contribute to ecological fitness. For S. Infantis, further analyses were done by combining pan-genomic information with epidemiological metadata. As a result, two major cryptic Ecotypes that show distinct ecological patterns were discovered in the S. Infantis population. Using a phylogeny-dependent population structure analysis, the cryptic cluster 1 (Ecotype 1) was found to belong to a phylogroup that was predominantly associated with poultry (Figure 7A). PCA-based data ordination, using only the accessory genomic data (“shell-genes”) as input, showed that poultry isolates were preferentially found in cluster 1—Ecotype 1 (Figure 7B). Approximately 85% of the poultry isolates belonged to Ecotype 1, while 15% were Ecotype 2 (Figure 7C). Human isolates also showed ecotype-specific patterns, representing 25% of Ecotype 1 isolates but 75% of Ecotype 2 isolates (Figure 7C).
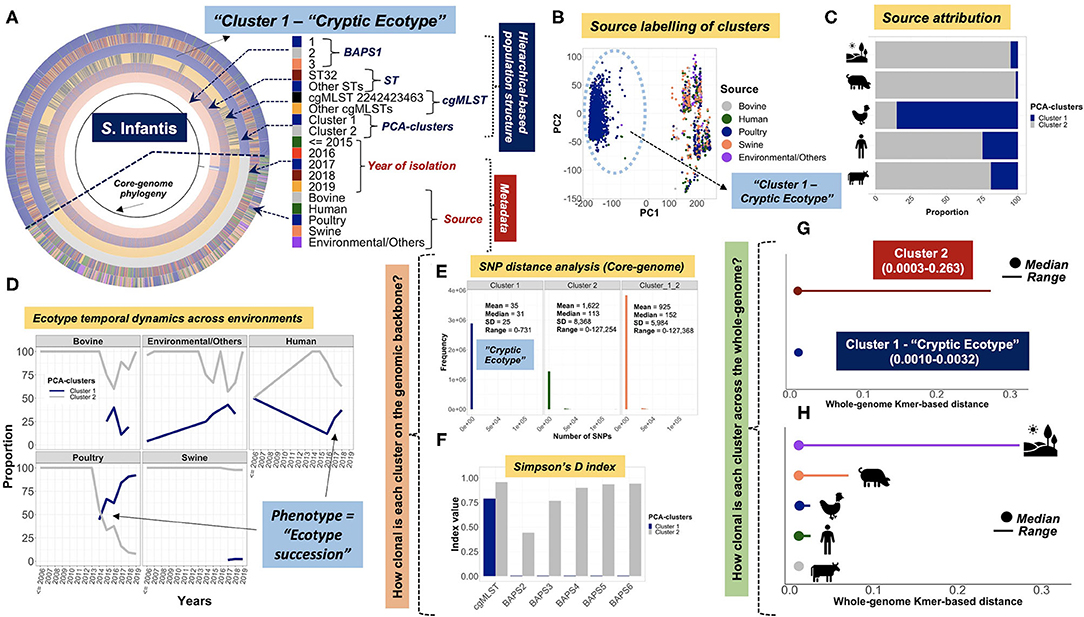
Figure 7. Agnostic mining of S. Infantis pan-genomic data revealed a unique poultry-associated temporal dynamic of putative Ecotypes with potential zoonotic implications. (A) Core-genome phylogeny-guided (black circle) mapping of hierarchical population structure and metadata for S. Infantis (n = 2,851 genomes). Sequentially mapped onto the tree is the hierarchical-based genotypic classifications: BAPS1 (1st colored ring), ST (2nd colored ring), cgMLST (3rd colored ring), and PCA-clusters (4th colored ring) based on the accessory genome (“shell-loci”) data only; in addition to the metadata comprised of: year of isolation (5th colored ring), and potential source (6th colored ring) based on the NCBI freely available metadata. (B) Accessory genome (“shell-loci”) based clustering of S. Infantis data using a logistic PCA analysis, coupled with a supervised labeling of data points based on source information (n = 2,851 genomes). (C) Proportion of PCA clusters (i.e., Ecotypes 1 and 2) across sample source which includes from the top-down (y-axis): environmental/others (n = 139 genomes), swine (n = 352 genomes), poultry (n = 1,842 genomes), humans (n = 433 genomes), and bovine (n = 85 genomes). (D) Proportion-based temporal dynamics of Ecotypes across sources over time. Proportions were calculated by source per year. Years prior or equal to 2006 were aggregated due to small total number of genomes (n = 47 genomes). The predicted phenotype, namely “Ecotype succession,” can be referred as a population-based phenotypic-switching that is primarily observed in poultry. (E) Pairwise SNP-based core-genome distances between genomes calculated using snp-dists. Distances are plotted to examine the distribution of SNPs within and between clusters (i.e., cluster 1 = Ecotype 1). Cryptic ecotype 1, which appears to be poultry-restricted, has a higher degree of clonality due to having a narrower distribution of pairwise SNPs as compared to cluster 2 (e.g., smaller mean and standard deviation). (F) Simpson's D index of diversity, calculated using cgMLST (n = 2,802 genomes) and BAPS2-6 (n = 2,851 genomes per BAPS level) haplotype data, also showed that Ecotype 1 has a higher degree of clonality than Ecotype 2 (i.e., the higher the index value, the more genotypic diverse a population is). Within cluster (G) or across sources (H), pairwise whole-genome k-mer based distances calculated using Mash (n = 2,851 genomes). (G) The number of genomes used per cluster was: cluster 1 (n = 1,699 genomes), and cluster 2 (n = 1,152 genomes). For plot (H), icons represent the following sources for genomes (top-down across y-axis): environment/others (n = 139 genomes), swine (n = 352 genomes), poultry (n = 1,842 genomes), humans (n = 433 genomes), and bovine (n = 85 genomes). For both plots (G) and (H), the dot and bar represent the median and range values, respectively; and the smaller the range, the more clonal the cluster, or Ecotype, is at the whole-genome level. Core-genome phylogeny was visualized using tree.
Given the unique source attributions for Ecotype 1 and Ecotype 2 populations (Figure 7C), a temporal analysis (Figure 7D) was performed, which suggested that Ecotype 1 recently emerged in the poultry population (mid 2010s), and since then has increased dramatically over time, comprising a large fraction of the S. Infantis isolates in poultry (Figure 7D). Ecotype 1 has also shown a similar trend among human isolates (from 2016 onward) (Figure 7D). While the inherent bias in the dataset (e.g., temporal distribution of genome sequences—Supplementary Figure 63) precludes major epidemiological conclusions, the patterns suggested that poultry-associated Ecotype 1 could pose a major zoonotic risk for humans. Core-genome measurements of clonality revealed that Ecotype 1 was a more highly clonal population compared to Ecotype 2. This analysis was supported by pairwise SNP-distances (Figure 7E), Simpson's D index of diversity among cgMLST and BAPS2-6 (Figure 7F), cgMLST variant distribution using SISTR v1.0 (Supplementary Figure 64A), and sub-group or haplotype distributions across BAPS1-6 levels (Supplementary Figure 64B). Nearly 98% of Ecotype 1 belonged to Kmer-cluster 2, while 100% of Ecotype 2 was assigned to Kmer-cluster 1; where Kmer-clusters were detected using core-genomic data (Supplementary Figure 4D). At the cgMLST level (SISTR v1.0), cgMLST 2242423463 comprised 43.7% of the Ecotype 1 population alone (Supplementary Figure 64A). Accordingly, temporal dynamics of cgMLST variants mirrored the results at the Ecotype level; with cgMLST 2242423463 having recently increased in occurrence in both poultry and, to a lower degree, in humans as well (Supplementary Figure 64C). These results provided further evidence that Ecotype 1 was more clonal than Ecotype 2 (Figure 7G), and that poultry and human isolates contained a low degree of genotypic diversity as compared to swine and environmental isolates (Figure 7H).
This ecological distribution of Ecotype 1 and Ecotype 2 populations suggests several non-mutually exclusive scenarios: (1) founder-effects of a new variant (i.e., could be a byproduct of depopulation and repopulation in poultry operations); (2) emergence of a unique niche for which Ecotype 1 has higher levels of fitness; (3) emergence of a strong (periodic) selection for which Ecotype 2 had low fitness (Fraser et al., 2005; Grad et al., 2012; Cordero and Polz, 2014; Cohan, 2019; Gymoese et al., 2019). Potential candidate genes differentiating Ecotype 1 from 2 include several AMR loci, such as: tetracyclines (tet genes), sulfonamides (sul genes), aminoglycosides including streptomycin and spectinomycin (aph, ant, and aac genes), beta-lactamases (bla family of genes), amphenicols (floR which is associated with florfenicol resistance), trimethoprim (dfrA genes), and fosfomycin (fosA genes) (McArthur et al., 2013) (Supplementary Figure 65). The plasmid IncFIB(k)_1_Kpn3 was also uniquely present in Ecotype 1 (Supplementary Figure 65). Unique loci associated with metabolic and physiological pathways were also detected in Ecotype 1 genomes (Supplementary Figure 66). Similarly, cgMLST variant-based analysis of the S. Infantis population, using the updated version of SISTR v1.1, revealed that the population of S. Infantis contains few major cgMLSTs (Supplementary Figure 67). The two predominant cgMLST variants (1206527699 and 1000714926) are part of the Ecotype 1 (poultry Ecotype) sub-population (Supplementary Figure 68A) and appear to be able to co-exist in poultry and pose a risk to humans (Supplementary Figure 68B). Both at the core-genome (SNP-based distance—Supplementary Figure 68C) and accessory genome content (Supplementary Figure 68D), cgMLST 1206527699 and 1000714926 were found to be more clonal and related to one another than other cgMLSTs. Assessment of accessory loci distribution further demonstrated the high degree of relatedness between cgMLST 1206527699 and 1000714926 (Supplementary Figure 69:70). Altogether, our discovery demonstrates the usefulness of combining core-genome and pan-genomic analyses, and further sets the stage for design and implementation of robust, systematic studies of the ecological and epidemiological factors that have contributed to the apparent succession of Ecotype 1 strains.
Discussion
Current foodborne pathogen-based epidemiological inquiries using WGS data broadly focus on tracking genotypes such as ST lineages and cgMLST variants while fine-tunning their population structuring and clustering or phylogenetic clade assignment based on SNP mapping using the core-genomic backbone (Schneider et al., 2011; Grad et al., 2012; Worby et al., 2014a; Leekitcharoenphon et al., 2016; Pightling et al., 2018; Saltykova et al., 2018; Yang et al., 2019). However, the growing volume of WGS data from epidemiological surveillance and regulatory sampling now provides an unprecedented opportunity for population-based inquiry. For instance, recent population-based genomics have revealed ecological adaptations that underlie the distribution of different zoonotic pathogens across the food chain (Joseph and Read, 2010; Power et al., 2017; Sheppard et al., 2018; Pavlovikj et al., 2021). Therefore, population-based mining of WGS data has the capacity to uncover unique features of a given population such as: i) mapping and tracking canonical and cryptic lineages or epidemiological variants capable of causing human outbreaks; and ii) inferring the causative genomic events (e.g., loci and alleles underlying host-switching and spreading across the food chain) (Sheppard et al., 2012, 2013, 2014; Langridge et al., 2015; Yahara et al., 2017; Zheng et al., 2017; Alikhan et al., 2018; Mageiros et al., 2021).
To be highly systematic, robust, and scalable; computational platforms must be combined with methods for associating hierarchical genotypic classifications with patterns of unique genomic content and epidemiologically relevant metadata. These platforms and approaches must also be paired with non-biased methods for sampling to enable genotypic-based frequencies of different populations to be used as a quantitative metric for ecological fitness. As previously demonstrated with the computational platform ProkEvo (Pavlovikj et al., 2021), the use of a scalable hierarchical population structure approaches can facilitate genotypic mapping and associations of unique genetic features with distinct lineages across bacterial species. Of note, ProkEvo is not directly deployable for real-time epidemiological surveillance, but instead, it was designed as a research tool to work in the context of ongoing microbiological testing/surveillance, specifically to study bacterial population genomics using various levels of genotypic resolution, along with pan-genomic mapping to identify (i) informative genotypic units that can be used as genetic markers for populations; and (ii) candidate genomic events (e.g., loci) that are associated with hierarchical genotypes and may reflect past selection or ecological adaptation. As previously demonstrated (Pavlovikj et al., 2021), evaluating the population structure in the context of hierarchical genotypes (BAPS1, ST, and cgMLST) provides a way to contextualize evolutionary relationships, while facilitating analysis at different levels of genotypic resolution. Although this heuristic positioning of BAPS1 and ST appears to be broadly applicable to foodborne pathogens (Pavlovikj et al., 2021), these are some of the factors that could influence the topological hierarchical structure of a population: bacterial species, within-host diversity, and the variation in the rate of mutation or horizontal gene transfer across gene families comprising the genomic backbone which are affected by ecological dispersion and epidemiology (Fraser et al., 2005; Didelot et al., 2011; Croucher et al., 2014; Shapiro and Polz, 2014; Worby et al., 2014b). Another important consideration is that the cgMLST unit defined by SISTR, and utilized here, only considers ~330 loci, while further genetic diversity is expected to be found by applying the Enterobase algorithmic approach that includes ~ 3,000 loci for cgMLST, and can provide whole-genome MLST classifications (Zhou et al., 2018, 2020).
Using Whole Genome for Population-Based Analysis Can Be Epidemiologically and Ecologically Relevant
Mapping and tracking of variants using the genomic-backbone (e.g., cgMLST variants) is essential for epidemiological surveillance of S. enterica lineage I (Mather et al., 2013; Petrovska et al., 2016; Allard et al., 2018; Trinetta et al., 2020). However, core-genomic based analysis can preclude the identification of cryptic variants circulating in a population, such as in the case of S. Enteritidis cryptic lineages capable of causing gastroenteritis and bloodstream-invasion (Feasey et al., 2016; Klemm et al., 2016), or in the case of S. Typhimurium lineages capable of causing Non-Typhoidal Salmonellosis (NTS) (Kingsley et al., 2009; Bawn et al., 2020). Recent studies have also demonstrated the usefulness of enhanced genotypic granularity from inclusion of accessory genomic data (Abudahab et al., 2019; Liao et al., 2020), and such granularity can indeed enhance epidemiological investigations (McNally et al., 2016). Mining of accessory genomes has also proven to be applicable for identifying phylogeographical signatures for S. Dublin (Fenske et al., 2019), and for structuring of S. Infantis population while predicting the existence of discrete lineages linked to unique prophages (Gymoese et al., 2019).
As demonstrated in this study for S. Infantis population, population-specific mining of accessory genomic content, combined with hierarchical genotypes (BAPS1, ST, and cgMLST) adds an extra layer of resolution yielding the identification of poultry-associated cluster, herein named as Ecotype 1. Specifically, our work emphasizes the importance of contextualizing the added resolution from accessory genome mining with the hierarchical population structure, while accounting for the epidemiological context (Supplementary Figure 71). By preserving the hierarchical framework, tracking of populations can be done at different levels of resolution, while their ancestral or kinship relationships can be continuously examined to understand how populations diversify over-time (Croucher et al., 2014; Mitchell et al., 2019; Bawn et al., 2020; Pavlovikj et al., 2021). For instance, Campylobacter jejuni population-based analysis, focused at the ST-level of resolution, revealed that ST21 and ST45 were the most prevalent genotypes associated with human clinical cases potentially originating from poultry (Yahara et al., 2017). Perhaps, this zoonotic pattern would not have been discovered if only cgMLST-based temporal dynamics were assessed, for which the underlying distribution of cgMLST variants is sparse (Alikhan et al., 2018), as shown in this paper for S. Typhimurium Biphasic. Combined, this points toward the frequency distribution of genotypes, across environments and host reservoirs, to be a biologically meaningful proxy for measuring ecological fitness (Leekitcharoenphon et al., 2016; Azarian et al., 2018; Pavlovikj et al., 2021; Tyson et al., 2021). However, for genotype-based frequency distributions to be used as a complex quantitative trait, sampling must be designed to reduce bias (e.g., bias in environments that are sampled—clinical vs. non-clinical isolates) and metadata must be standardized to provide a minimal amount of accurate epidemiological information (e.g., sample type, date, state, country, any phenotyping done such AMR).
Measuring ecological fitness as a phenotype can directly inform epidemiological surveillance, since temporal shifts in population dynamics may reflect, or be caused by significant ecological, or epidemiological events in the production chain, such as animal vaccination, major changes in use of antibiotics, or major shifts in use of disinfectants (Randall et al., 2007; Chang et al., 2015; Azarian et al., 2018; Mitchell et al., 2019). If ecological fitness is a heritable trait of populations, then regular sampling done for S. enterica lineage I by regulatory agencies and Public Health laboratories, should be predictably informative (Tyson et al., 2021). Given that variation in genotypic frequencies can occur across the food chain and be informative about adaptive traits (Yahara et al., 2017), discriminating between variants with and lacking zoonotic potential becomes of more importance. Ranking or risk-assessments of specific genotypes at different levels of resolution (e.g., STs, BAPS1, cgMLST, or even unique Ecotypes based on cgMLST and accessory genome) in terms of degree of their transmission in the animal production environment, and their zoonotic potential, would result in enhanced specificity for both surveillance and mitigation strategies across the food chain.
S. Infantis is also a zoonotic serovar for which poultry appears to be the major reservoir (Mejía et al., 2020; CDC, 2021c; Tyson et al., 2021). Recent epidemiological inquiries have also demonstrated the emergence of multi-drug resistant (MDR) S. Infantis (Burnett et al., 2021), and suggested the existence of cryptic population structure that can only be identified through accessory genome mining (Gymoese et al., 2019; Alba et al., 2020; Mejía et al., 2020; Tyson et al., 2021). Our S. Infantis population-based results have not only confirmed that poultry can be a major zoonotic reservoir, but suggest that, at least in the USA poultry population, a novel ecological succession has recently occurred, with Ecotype 1 displacing Ecotype 2. Importantly, this unique ecological event (“Ecotype succession”) was only detectable by combining hierarchical genotypic groupings with the distribution of the accessory genome and relevant metadata. Furthermore, a recent study demonstrated that S. Infantis ESI clone (most likely Ecotype 1) is predicted to be spreading rapidly across the poultry chain (Tyson et al., 2021). As shown here, Ecotype 1 is a highly clonal population that has singularly acquired a mega-plasmid capable of carrying multiple AMR loci. However, it remains unclear how much this mega-plasmid contributes to the Ecotype 1 fitness and host-restriction, whether it would be essential to displace Ecotype 2 in poultry populations, and what genetics determinants allow for Ecotype 2 to remain as host-generalist as predicted in this work. By using an agnostic kmer-based clustering of core-genomes, the current study also showed that Ecotype 1 and 2 were formed by distinct genomic backbones; suggesting that Ecotype 1 has intrinsic genomic attributes favoring the acquisition and maintenance of this plasmid. Since Ecotype 1 is a highly clonal population both at the core- and whole-genome levels, suggestions are that either a major selective pressure occurred for which the population was adapted to, or a founder-effect drove its emergence (e.g., repopulation of poultry production systems). Remarkably, S. Newport ST45 resembles S. Infantis as two putative cryptic Ecotypes were found in its population, with a strikingly conserved signature comprised of a high core-genomic conservation (i.e., highly clonal genomic backbone) linked to a plastic accessory genome content. This “fixed” genomic backbone coupled with sparse selectable accessory genome loci is suggestive of a strong selective pressure being applied for gain-or-loss of function through protein-coding genes. By consequence, mining of pathways being enriched through accessory genome variation has the potential to be predictive of niche-specifying or niche-transcending genes allowing for Ecotypes to be formed (Cohan and Koeppel, 2008; Cohan, 2019). More broadly, the comparative analysis among three distinct serovars led us to hypothesize that the higher the degree of clonality of a population, the more likely the accessory genome content becomes crucial for tracking cryptic epidemiological variants.
If inferring ecological fitness can be achieved through accurate quantification of genotypes across the food chain, then the combined use of a pan-genome enrichment analysis (PANGEA), much like in bacterial genome-wide association studies (Sheppard et al., 2012, 2013; Earle et al., 2016; Yahara et al., 2017), could reveal candidate loci contributing to phenotypic variation (Power et al., 2017; Sheppard et al., 2018; Cohan, 2019). Quantitative genomic methods are routinely used in animals, plants, and humans as a primary approach to study complex traits (Mackay, 2001; Huang and Han, 2014; Power et al., 2017; Jiang et al., 2019; Cano-Gamez and Trynka, 2020). Such methods have historically been avoided in bacterial population genomics because of the inability to accurately measure the contributions of kinship (Earle et al., 2016; Power et al., 2017; Sheppard et al., 2018). As we and others have shown, combined used of hierarchical genotypic analyses and accessory genomic content, allows for kinship relationships to be accounted for within bacterial populations, paving the way for systematic use of quantitative genomics to study complex traits such as ecological fitness among bacterial species (Sheppard et al., 2012, 2014; Chewapreecha et al., 2014; Earle et al., 2016; McNally et al., 2016; Abudahab et al., 2019; Pavlovikj et al., 2021). Thus, hierarchical mapping of populations using whole-genome information may not only enhance the accuracy of epidemiological investigations, but may also facilitate discovery of traits contributing to ecological fitness and/or zoonotic events leading to human outbreaks.
Notably, the emergence of zoonotic AMR bacteria presents a major category of complex traits that may affect ecological fitness and also pose threats to public health (Chang et al., 2015; Dhingra et al., 2020). Both S. Typhimurium and S. Newport have been shown to harbor MDR conferring-loci (Greene et al., 2008; Schneider et al., 2011; Carroll et al., 2019; Luo et al., 2020). However, by using a more holistic approach to map accessory loci agnostically (i.e., done independently for each serovar-specific dataset) onto the hierarchical population structure, we were able to identify a combination of AMR and other physiological/metabolic-inferred traits differentiating major STs for both S. Typhimurium (ST34) and S. Newport (ST45). Specifically, for both serovars, the computationally predicted and phenotypically validated traits such as heavy-metal (copper) and quats-based resistance, are relevant for food safety. First, ST34 (mostly S. Typhimurium Monophasic) can colonize the gastrointestinal tract of livestock (Ferrari et al., 2019; Sun et al., 2020). The widespread harboring of SGI-3/4 (Mastrorilli et al., 2018; Clark et al., 2020) as confirmed in the present study, is hypothesized to contribute to its spread and persistence due to the utilization of copper in the animal diet (Arai et al., 2019; Branchu et al., 2019; Bearson et al., 2020). However, ST34 can also withstand copper exposure under aerobic conditions as shown here, highlighting the need to understand the importance of environmental (e.g., water reservoirs) contamination in its spread. Of note, our genome sampling strategy did not include retrieving Monophasic (i.e., O 1,4,[5],12:i:-) isolates directly from NCBI (not used in our search terms), but instead, Monophasic isolates comprised a subset of the S. Typhimurium data serotypically classified by the SISTR algorithm within ProkEvo (Pavlovikj et al., 2021). In the case of S. Newport the results presented here suggested that resistance to quaternary ammonium salts may be a contributing factor for the spread and survival of ST45 over other STs in food facilities. Similarly, pan-genomic analysis revealed unique physiological adaptations, such as increased oxygen resistance, that could have contributed to C. jejuni lineages, such as ST21 or ST45, spill-over from poultry to humans (Yahara et al., 2017).
Overall, this hierarchical-based PANGEA approach allows for lineage-specific patterns to be revealed, while accounting for kinship relationships, which in turn facilitate the identification of ancestrally- or recently-acquired, niche-transcending or niche-specifying loci (Cohan and Koeppel, 2008). This association between ST and AMR profiles reflects the degree of linkage disequilibrium between loci across bacterial genomes, and shows the potential of using large-scale genotyping to predict traits of interest (Brinda et al., 2020; MacFadden et al., 2020). Yet we anticipate that, as in the case of copper and quats resistance, many of the food safety relevant traits will behave as quantitative traits, for which multiple genetic determinants (e.g., other loci and allelic variation) interact to explain the phenotype by a mechanism known as epistasis (Mackay, 2001; Power et al., 2017). For instance, the ability to form biofilms can be a contributing factor that alters the capacity to resist disinfectants (Corcoran et al., 2014). Given that quantitative traits are commonly associated with polygenic events (i.e., presence of loci and allelic variation) (Mackay, 2001; Power et al., 2017), our findings in studying Salmonella guard against solely using gene-based epidemiological surveillance of complex traits such as antimicrobial or heavy-metal resistance. Combined, the lineage-based distribution of loci demonstrated the potential to reveal actionable knowledge for mitigation and control of pathogens, such as i) highlighting the need for a risk-assessment analysis to measure the contribution of environmental vs. livestock dietary copper on the spread of ST34 (Monophasic); or ii) predicting the effect of altering sanitation protocols by switching disinfectants within food facilities based on ST-surveillance (Figures 8A–C).
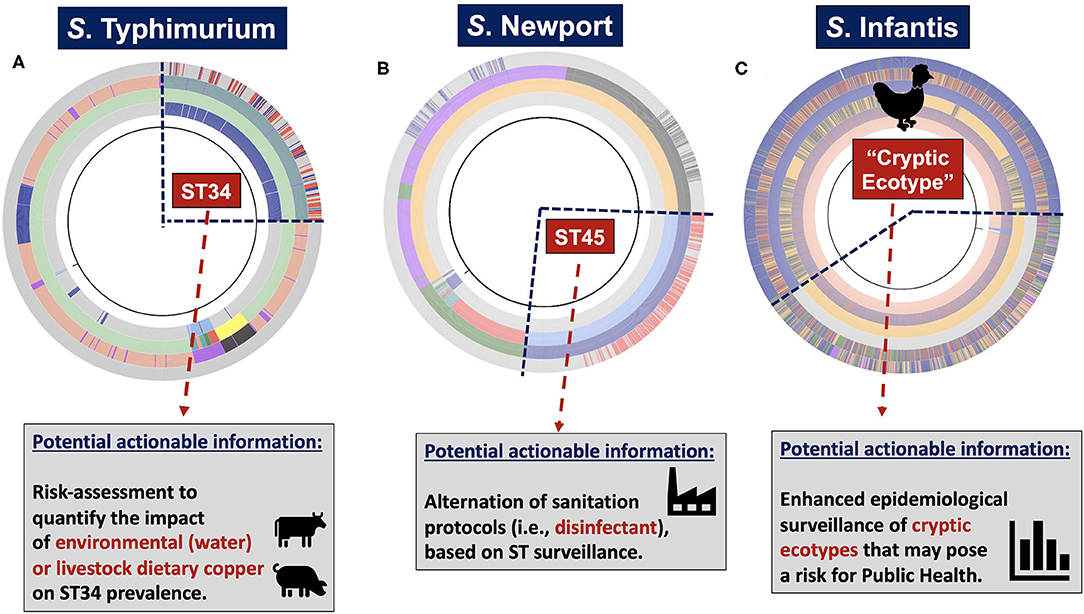
Figure 8. Systems-based heuristic and hierarchical population structure mapping of pan-genomes can generate actionable information to improve food safety. (A) Loci-enrichment analysis, followed by phenotypic testing, confirmed that the S. Typhimurium ST34 (Monophasic) lineage has acquired and maintained the capacity to resist AMR such as heavy-metals (i.e., copper). This information ensues the need for a risk-assessment based analysis to understand the impact of environmental (e.g., water reservoirs) presence or dietary utilization of copper in livestock production systems, on the spread and persistence of ST34. (B) In the population of S. Newport, ST45 appears to be more capable of withstanding population bottlenecks generated by quaternary ammonium compounds (quats). If generalizable, this information suggests that ST-based surveillance of S. Newport would be an indicator for optimization of sanitation protocols in food facilities. In particular, disinfectants others than quats would be more efficacious in decreasing ST45 contamination. (C) Agnostic mining of the accessory genome revealed two cryptic Ecotypes in the population of S. Infantis. Specifically, Ecotype 1 appears to have emerged in poultry population, and yet retains the capacity to spill-over into humans. Importantly, these two cryptic sub-populations would not have been discovered using the canonical MLST-based genotypic analysis. Hence, the combination of an agnostic and heuristic mining of pan-genomic information has the potential to maximize epidemiological surveillance capabilities to pathogenic serovars that may pose a risk for Public Health.
In general, the study of S. enterica lineage I serovars showed how a systematic use of a heuristic and agnostic, hierarchical-based population structure analysis that includes bacterial pan-genomic mining may result in: (1) revealing a hidden layer of genotypic resolution for mapping populations; (2) identifying cryptic population shifts potentially underlying major ecological adaptations; and (3) defining lineage-specific informative loci contributing to the acquisition of traits directly impacting food safety (Figures 8A–C). However, to transform WGS into actionable information that scales for epidemiological surveillance and practical mitigation, some evidence hurdles needed to be overcome. Examples include (i) biased databases preventing frequency from being a meaningful phenotype due to the uneven and underpowered sampling of environmental vs. clinical isolates; and (ii) data privacy concerns held by the livestock and food industry alike. Regulatory agencies already operate with standard protocols and systematic sampling plans that facilitate the application of population genomics. Yet, operational procedures and integrative systems that would allow for sampling done in livestock production systems and Public Health laboratories are lacking. A single and effective platform for comprehensive analysis and integration of data is needed. In conclusion, utilization of the discovery-based ProkEvo platform, for conducting a hierarchical-based pan-genomic analysis of S. enterica lineage I, can be viewed as a proof-of-concept approach for how large-scale genomics can be auxiliary in revealing novel population-based attributes, and testable hypotheses while conducting food safety-related ecological or epidemiological inquiries.
Data Availability Statement
The datasets presented in this study can be found in online repositories. The names of the repository/repositories and accession number(s) can be found in the article/Supplementary Material.
Author Contributions
JCG-N, NP, CC, and AB conceived and designed the project. JCG-N conducted all data analysis and generated all data visualizations. NP carried out all bioinformatics work. BC and CC generated all laboratory results. GA-G and DK developed the aKronyMer algorithm. BA and PI provided all human clinical isolates. JL provided all bovine clinical isolates. JCG-N, NP, and CC wrote the initial manuscript. All authors contributed to the article and approved the submitted version.
Funding
This work was supported by funding provided by the UNL-IANR Agricultural Research Division and the National Institute for Antimicrobial Resistance Research and Education, the Nebraska Food for Health Center at the Food Science and Technology Department (UNL), and by the University of Nebraska Foundation (Layman Award).
Conflict of Interest
The authors declare that the research was conducted in the absence of any commercial or financial relationships that could be construed as a potential conflict of interest.
Publisher's Note
All claims expressed in this article are solely those of the authors and do not necessarily represent those of their affiliated organizations, or those of the publisher, the editors and the reviewers. Any product that may be evaluated in this article, or claim that may be made by its manufacturer, is not guaranteed or endorsed by the publisher.
Acknowledgments
This research could only be completed by utilizing the Holland Computing Center (HCC) at UNL, which receives support from the Nebraska Research Initiative. We are also thankful for having access, through the HCC, to resources provided by the Open Science Grid (OSG), which is supported by the National Science Foundation and the U.S. Department of Energy's Office of Science. This work used the Pegasus Workflow Management Software which is funded by the National Science Foundation (grant #1664162). We would like to once again express our gratitude to Mats Rynge for helping us run ProkEvo on OSG. We also thank Dr. Derek Weitzel and Karan Vahi for their continual technical computational support, and Dr. Peter Evans from USDA-FSIS for his suggestions on data presentation and interpretation. This paper is dedicated to the memory of Dr. David Swanson, who was the director of the HCC at our institution, and has sadly passed away recently. Dr. David Swanson was kind and sincere person, who was an inspiration to us all through his fantastic work in setting the path for scalable and parallel computing in our institution and beyond. Unfortunately, he could not see the completion of this work, but without him we would not have been able to reach our goals.
Supplementary Material
The Supplementary Material for this article can be found online at: https://www.frontiersin.org/articles/10.3389/fsufs.2021.725791/full#supplementary-material
References
Abudahab, K., Prada, J. M., Yang, Z., Bentley, S. D., Croucher, N. J., Corander, J., et al. (2019). PANINI: Pangenome Neighbour Identification for Bacterial Populations. Microb. Genom. 5:220. doi: 10.1099/mgen.0.000220
Achtman, M., Wain, J., Weill, F.-X., Nair, S., Zhou, Z., Sangal, V., et al. (2012). Multilocus sequence typing as a replacement for serotyping in salmonella enterica. PLoS Pathog. 8:e1002776. doi: 10.1371/journal.ppat.1002776
Alba, P., Leekitcharoenphon, P., Carfora, V., Amoruso, R., Cordaro, G., Di Matteo, P., et al. (2020). Molecular epidemiology of Salmonella Infantis in Europe: insights into the success of the bacterial host and its parasitic pESI-like megaplasmid. Microb. Genom. 6:365. doi: 10.1099/mgen.0.000365
Alikhan, N.-F., Zhou, Z., Sergeant, M. J., and Achtman, M. (2018). A genomic overview of the population structure of Salmonella. PLoS Genet. 14:e1007261. doi: 10.1371/journal.pgen.1007261
Allard, M. W., Bell, R., Ferreira, C. M., Gonzalez-Escalona, N., Hoffmann, M., Muruvanda, T., et al. (2018). Genomics of foodborne pathogens for microbial food safety. Curr. Opin. Biotechnol. 49, 224–229. doi: 10.1016/j.copbio.2017.11.002
Arai, N., Sekizuka, T., Tamamura, Y., Kusumoto, M., Hinenoya, A., Yamasaki, S., et al. (2019). Salmonella Genomic Island 3 is an integrative and conjugative element and contributes to copper and arsenic tolerance of Salmonella enterica. Antimicrob. Agents Chemother. 63, e00429–e00519, /aac/63/9/AAC.00429-19.atom. doi: 10.1128/AAC.00429-19
Azarian, T., Mitchell, P. K., Georgieva, M., Thompson, C. M., Ghouila, A., Pollard, A. J., et al. (2018). Global emergence and population dynamics of divergent serotype 3 CC180 pneumococci. PLoS Pathog. 14:e1007438. doi: 10.1371/journal.ppat.1007438
Bawn, M., Alikhan, N.-F., Thilliez, G., Kirkwood, M., Wheeler, N. E., Petrovska, L., et al. (2020). Evolution of Salmonella enterica serotype Typhimurium driven by anthropogenic selection and niche adaptation. PLoS Genet. 16:e1008850. doi: 10.1371/journal.pgen.1008850
Bay, D. C., Rommens, K. L., and Turner, R. J. (2008). Small multidrug resistance proteins: A multidrug transporter family that continues to grow. Biochimica et Biophysica Acta (BBA)—Biomembranes 1778, 1814–1838. doi: 10.1016/j.bbamem.2007.08.015
Bearson, B. L., Trachsel, J. M., Shippy, D. C., Sivasankaran, S. K., Kerr, B. J., Loving, C. L., et al. (2020). The Role of Salmonella Genomic Island 4 in Metal Tolerance of Salmonella enterica Serovar I 4,[5],12:i:- Pork Outbreak Isolate USDA15WA-1. Genes 11:1291. doi: 10.3390/genes11111291
Branchu, P., Charity, O. J., Bawn, M., Thilliez, G., Dallman, T. J., Petrovska, L., et al. (2019). SGI-4 in Monophasic Salmonella Typhimurium ST34 Is a Novel ICE That enhances resistance to copper. Front. Microbiol. 10:1118. doi: 10.3389/fmicb.2019.01118
Brinda, K., Callendrello, A., Ma, K. C., MacFadden, D. R., Charalampous, T., Lee, R. S., et al. (2020). Rapid inference of antibiotic resistance and susceptibility by genomic neighbour typing. Nat Microbiol 5, 455–464. doi: 10.1038/s41564-019-0656-6
Burnett, E., Ishida, M., de Janon, S., Naushad, S., Duceppe, M.-O., Gao, R., et al. (2021). Whole-Genome Sequencing Reveals the Presence of the blaCTX-M-65 Gene in Extended-Spectrum β-Lactamase-Producing and Multi-Drug-Resistant Clones of Salmonella Serovar Infantis Isolated from Broiler Chicken Environments in the Galapagos Islands. Antibiotics 10:267. doi: 10.3390/antibiotics10030267
Cano-Gamez, E., and Trynka, G. (2020). From GWAS to function: using functional genomics to identify the mechanisms underlying complex diseases. Front. Genet. 11:424. doi: 10.3389/fgene.2020.00424
Carroll, L. M., Gaballa, A., Guldimann, C., Sullivan, G., Henderson, L. O., and Wiedmann, M. (2019). Identification of Novel Mobilized Colistin Resistance Gene mcr-9 in a Multidrug-Resistant, Colistin-Susceptible Salmonella enterica Serotype Typhimurium Isolate. mBio 10, e00853–e00919. doi: 10.1128/mBio.00853-19
CDC (2021a). Food Safety. Available online at: https://www.cdc.gov/foodsafety/foodborne-germs.html (accessed April 8, 2021).
CDC (2021b). Salmonella. Available online at: https://www.cdc.gov/salmonella/ (Accessed April 8, 2021).
CDC (2021c). Salmonella Atlas. Available online at: https://www.cdc.gov/salmonella/reportspubs/salmonella-atlas/serotype-reports.html (accessed April 8, 2021).
Chang, Q., Wang, W., Regev-Yochay, G., Lipsitch, M., and Hanage, W. P. (2015). Antibiotics in agriculture and the risk to human health: how worried should we be? Evol. Appl. 8, 240–247. doi: 10.1111/eva.12185
Cheng, L., Connor, T. R., Siren, J., Aanensen, D. M., and Corander, J. (2013). Hierarchical and spatially explicit clustering of DNA sequences with BAPS software. Mol. Biol. Evol. 30, 1224–1228. doi: 10.1093/molbev/mst028
Chewapreecha, C., Marttinen, P., Croucher, N. J., Salter, S. J., Harris, S. R., Mather, A. E., et al. (2014). Comprehensive identification of single nucleotide polymorphisms associated with beta-lactam resistance within pneumococcal mosaic genes. PLoS Genet. 10:e1004547. doi: 10.1371/journal.pgen.1004547
Chung, Y. J., and Saier, M. H. (2002). Overexpression of the Escherichia coli sugE gene confers resistance to a narrow range of quaternary ammonium compounds. JB 184, 2543–2545. doi: 10.1128/JB.184.9.2543-2545.2002
Clark, C. G., Landgraff, C., Robertson, J., Pollari, F., Parker, S., Nadon, C., et al. (2020). Distribution of heavy metal resistance elements in Canadian Salmonella 4,[5],12:i:- populations and association with the monophasic genotypes and phenotype. PLoS ONE 15:e0236436. doi: 10.1371/journal.pone.0236436
Cohan, F. M. (2006). Towards a conceptual and operational union of bacterial systematics, ecology, and evolution. Phil. Trans. R. Soc. B 361, 1985–1996. doi: 10.1098/rstb.2006.1918
Cohan, F. M. (2019). “Transmission in the Origins of Bacterial Diversity, From Ecotypes to Phyla,” in Microbial Transmission, eds.Baquero, Bouza, Gutiérrez-Fuentes, and Coque (American Society of Microbiology), 311–343.
Cohan, F. M., and Koeppel, A. F. (2008). The origins of ecological diversity in prokaryotes. Curr. Biol. 18, R1024–R1034. doi: 10.1016/j.cub.2008.09.014
Corcoran, M., Morris, D., De Lappe, N., O'Connor, J., Lalor, P., Dockery, P., et al. (2014). Commonly used disinfectants fail to eradicate salmonella enterica biofilms from food contact surface materials. Appl. Environ. Microbiol. 80, 1507–1514. doi: 10.1128/AEM.03109-13
Cordero, O. X., and Polz, M. F. (2014). Explaining microbial genomic diversity in light of evolutionary ecology. Nat. Rev. Microbiol. 12, 263–273. doi: 10.1038/nrmicro3218
Croucher, N. J., Coupland, P. G., Stevenson, A. E., Callendrello, A., Bentley, S. D., and Hanage, W. P. (2014). Diversification of bacterial genome content through distinct mechanisms over different timescales. Nat. Commun. 5:5471. doi: 10.1038/ncomms6471
Dhingra, S., Rahman, N. A. A., Peile, E., Rahman, M., Sartelli, M., Hassali, M. A., et al. (2020). Microbial resistance movements: an overview of global public health threats posed by antimicrobial resistance, and how best to counter. Front. Public Health 8:535668. doi: 10.3389/fpubh.2020.535668
Didelot, X., Bowden, R., Street, T., Golubchik, T., Spencer, C., McVean, G., et al. (2011). Recombination and population structure in salmonella enterica. PLoS Genet. 7:e1002191. doi: 10.1371/journal.pgen.1002191
Earle, S. G., Wu, C.-H., Charlesworth, J., Stoesser, N., Gordon, N. C., Walker, T. M., et al. (2016). Identifying lineage effects when controlling for population structure improves power in bacterial association studies. Nat. Microbiol. 1:16041. doi: 10.1038/nmicrobiol.2016.41
Feasey, N. A., Hadfield, J., Keddy, K. H., Dallman, T. J., Jacobs, J., Deng, X., et al. (2016). Distinct Salmonella Enteritidis lineages associated with enterocolitis in high-income settings and invasive disease in low-income settings. Nat. Genet. 48, 1211–1217. doi: 10.1038/ng.3644
Feil, E. J., Cooper, J. E., Grundmann, H., Robinson, D. A., Enright, M. C., Berendt, T., et al. (2003). How clonal is staphylococcus aureus? JB 185, 3307–3316. doi: 10.1128/JB.185.11.3307-3316.2003
Fenske, G. J., Thachil, A., McDonough, P. L., Glaser, A., and Scaria, J. (2019). Geography shapes the population genomics of Salmonella enterica Dublin. Genome Biol. Evol. 11, 2220–2231. doi: 10.1093/gbe/evz158
Ferrari, R. G., Rosario, D. K. A., Cunha-Neto, A., Mano, S. B., Figueiredo, E. E. S., and Conte-Junior, C. A. (2019). Worldwide epidemiology of Salmonella serovars in animal-based foods: a meta-analysis. Appl. Environ. Microbiol. 85, e00591–e00619. doi: 10.1128/AEM.00591-19
Fraser, C., Hanage, W. P., and Spratt, B. G. (2005). Neutral microepidemic evolution of bacterial pathogens. Proc. Nat. Acad. Sci. 102, 1968–1973. doi: 10.1073/pnas.0406993102
Grad, Y. H., Lipsitch, M., Feldgarden, M., Arachchi, H. M., Cerqueira, G. C., FitzGerald, M., et al. (2012). Genomic epidemiology of the Escherichia coli O104:H4 outbreaks in Europe, 2011. Proc. Nat. Acad. Sci. 109, 3065–3070. doi: 10.1073/pnas.1121491109
Greene, S. K., Stuart, A. M., Medalla, F. M., Whichard, J. M., Hoekstra, R. M., and Chiller, T. M. (2008). Distribution of multidrug-resistant human isolates of MDR-ACSSuT Salmonella Typhimurium and MDR-AmpC Salmonella Newport in the United States, 2003–2005. Foodborne Pathog. Dis. 5, 669–680. doi: 10.1089/fpd.2008.0111
Gymoese, P., Kiil, K., Torpdahl, M., Østerlund, M. T., Sørensen, G., Olsen, J. E., et al. (2019). WGS based study of the population structure of Salmonella enterica serovar Infantis. BMC Genom. 20:870. doi: 10.1186/s12864-019-6260-6
Hadfield, J., Croucher, N. J., Goater, R. J., Abudahab, K., Aanensen, D. M., and Harris, S. R. (2018). Phandango: an interactive viewer for bacterial population genomics. Bioinformatics 34, 292–293. doi: 10.1093/bioinformatics/btx610
Harrow, G. L., Lees, J. A., Hanage, W. P., Lipsitch, M., Corander, J., Colijn, C., et al. (2021). Negative frequency-dependent selection and asymmetrical transformation stabilise multi-strain bacterial population structures. ISME J. 15, 1523–1538. doi: 10.1038/s41396-020-00867-w
Huang, X., and Han, B. (2014). Natural variations and genome-wide association studies in crop plants. Annu. Rev. Plant Biol. 65, 531–551. doi: 10.1146/annurev-arplant-050213-035715
Humayoun, S. B., Hiott, L. M., Gupta, S. K., Barrett, J. B., Woodley, T. A., Johnston, J. J., et al. (2018). An assay for determining the susceptibility of Salmonella isolates to commercial and household biocides. PLoS ONE 13:e0209072. doi: 10.1371/journal.pone.0209072
Issenhuth-Jeanjean, S., Roggentin, P., Mikoleit, M., Guibourdenche, M., de Pinna, E., Nair, S., et al. (2014). Supplement 2008–2010 (no. 48) to the White–Kauffmann–Le Minor scheme. Res. Microbiol. 165, 526–530. doi: 10.1016/j.resmic.2014.07.004
Jiang, J., Ma, L., Prakapenka, D., VanRaden, P. M., Cole, J. B., and Da, Y. (2019). A large-scale genome-wide association study in U.S. Holstein Cattle. Front. Genet. 10:412. doi: 10.3389/fgene.2019.00412
Jiang, M., Zhu, F., Yang, C., Deng, Y., Kwan, P. S. L., Li, Y., et al. (2020). Whole-genome analysis of Salmonella enterica serovar enteritidis isolates in outbreak linked to online food delivery, Shenzhen, China, 2018. Emerging Infect. Dis. 26, 789–792. doi: 10.3201/eid2604.191446
Joseph, S. J., and Read, T. D. (2010). Bacterial population genomics and infectious disease diagnostics. Trends Biotechnol. 28, 611–618. doi: 10.1016/j.tibtech.2010.09.001
Kans, J. (2013). Entrez Direct: E-utilities on the Unix Command Line. 2013 Apr 23 [Updated 2021 Apr 15]. Available online at: https://www.ncbi.nlm.nih.gov/journals/NBK179288/.
Kingsley, R. A., Msefula, C. L., Thomson, N. R., Kariuki, S., Holt, K. E., Gordon, M. A., et al. (2009). Epidemic multiple drug resistant Salmonella Typhimurium causing invasive disease in sub-Saharan Africa have a distinct genotype. Genome Res. 19, 2279–2287. doi: 10.1101/gr.091017.109
Klemm, E. J., Gkrania-Klotsas, E., Hadfield, J., Forbester, J. L., Harris, S. R., Hale, C., et al. (2016). Emergence of host-adapted Salmonella Enteritidis through rapid evolution in an immunocompromised host. Nat. Microbiol. 1:15023. doi: 10.1038/nmicrobiol.2015.23
Laing, C. R., Whiteside, M. D., and Gannon, V. P. J. (2017). Pan-genome Analyses of the species Salmonella enterica, and identification of genomic markers predictive for species, subspecies, and serovar. Front. Microbiol. 8:1345. doi: 10.3389/fmicb.2017.01345
Land, M., Hauser, L., Jun, S.-R., Nookaew, I., Leuze, M. R., Ahn, T.-H., et al. (2015). Insights from 20 years of bacterial genome sequencing. Funct. Integr. Genomics 15, 141–161. doi: 10.1007/s10142-015-0433-4
Langridge, G. C., Fookes, M., Connor, T. R., Feltwell, T., Feasey, N., Parsons, B. N., et al. (2015). Patterns of genome evolution that have accompanied host adaptation in Salmonella. Proc. Natl. Acad Sci. USA 112, 863–868. doi: 10.1073/pnas.1416707112
Leekitcharoenphon, P., Hendriksen, R. S., Le Hello, S., Weill, F.-X., Baggesen, D. L., Jun, S.-R., et al. (2016). Global genomic epidemiology of salmonella enterica serovar Typhimurium DT104. Appl. Environ. Microbiol. 82, 2516–2526. doi: 10.1128/AEM.03821-15
Liao, J., Orsi, R. H., Carroll, L. M., and Wiedmann, M. (2020). Comparative genomics reveals different population structures associated with host and geographic origin in antimicrobial-resistant Salmonella enterica. Environ. Microbiol. 22, 2811–2828. doi: 10.1111/1462-2920.15014
Luo, Q., Wan, F., Yu, X., Zheng, B., Chen, Y., Gong, C., et al. (2020). MDR Salmonella enterica serovar Typhimurium ST34 carrying mcr-1 isolated from cases of bloodstream and intestinal infection in children in China. J. Antimicrob. Chemotherap. 75, 92–95. doi: 10.1093/jac/dkz415
MacFadden, D. R., Coburn, B., Brinda, K., Corbeil, A., Daneman, N., Fisman, D., et al. (2020). Using genetic distance from archived samples for the prediction of antibiotic resistance in Escherichia coli. Antimicrob Agents Chemother 64, e02417–e02419. doi: 10.1128/AAC.02417-19
Mackay, T. F. C. (2001). The genetic architecture of quantitative traits. Annu. Rev. Genet. 35, 303–339. doi: 10.1146/annurev.genet.35.102401.090633
Mageiros, L., Méric, G., Bayliss, S. C., Pensar, J., Pascoe, B., Mourkas, E., et al. (2021). Genome evolution and the emergence of pathogenicity in avian Escherichia coli. Nat. Commun. 12:765. doi: 10.1038/s41467-021-22238-5
Maiden, M. C. J., Bygraves, J. A., Feil, E., Morelli, G., Russell, J. E., Urwin, R., et al. (1998). Multilocus sequence typing: a portable approach to the identification of clones within populations of pathogenic microorganisms. Proc. Nat. Acad. Sci. 95, 3140–3145. doi: 10.1073/pnas.95.6.3140
Mastrorilli, E., Pietrucci, D., Barco, L., Ammendola, S., Petrin, S., Longo, A., et al. (2018). A comparative genomic analysis provides novel insights into the ecological success of the monophasic salmonella serovar. Front. Microbiol. 9:715. doi: 10.3389/fmicb.2018.00715
Mather, A. E., Reid, S. W. J., Maskell, D. J., Parkhill, J., Fookes, M. C., Harris, S. R., et al. (2013). Distinguishable epidemics of multidrug-resistant salmonella Typhimurium DT104 in different hosts. Science 341, 1514–1517. doi: 10.1126/science.1240578
McArthur, A. G., Waglechner, N., Nizam, F., Yan, A., Azad, M. A., Baylay, A. J., et al. (2013). The comprehensive antibiotic resistance database. Antimicrob. Agents Chemother. 57, 3348–3357. doi: 10.1128/AAC.00419-13
McNally, A., Oren, Y., Kelly, D., Pascoe, B., Dunn, S., Sreecharan, T., et al. (2016). Combined analysis of variation in core, accessory and regulatory genome regions provides a super-resolution view into the evolution of bacterial populations. PLoS Genet. 12:e1006280. doi: 10.1371/journal.pgen.1006280
McQuiston, J. R., Waters, R. J., Dinsmore, B. A., Mikoleit, M. L., and Fields, P. I. (2011). Molecular determination of H antigens of salmonella by use of a microsphere-based liquid array. J. Clin. Microbiol. 49, 565–573. doi: 10.1128/JCM.01323-10
Mejía, L., Medina, J. L., Bayas, R., Salazar, C. S., Villavicencio, F., Zapata, S., et al. (2020). Genomic epidemiology of salmonella Infantis in ecuador: from poultry farms to human infections. Front. Vet. Sci. 7:547891. doi: 10.3389/fvets.2020.547891
Mitchell, P. K., Azarian, T., Croucher, N. J., Callendrello, A., Thompson, C. M., Pelton, S. I., et al. (2019). Population genomics of pneumococcal carriage in Massachusetts children following introduction of PCV-13. Microb. Genom.5:252. doi: 10.1099/mgen.0.000252
Oksanen, J., Guillaume Blanchet, F., Friendly, M., Kindt, R., Legendre, P., McGlinn, D., et al (2019). vegan: Community Ecology Package. R package version 2.5-5. Available online at: https://CRAN.R-project.org/package=vegan.
Ondov, B. D., Treangen, T. J., Melsted, P., Mallonee, A. B., Bergman, N. H., Koren, S., et al. (2016). Mash: fast genome and metagenome distance estimation using MinHash. Genome Biol. 17:132. doi: 10.1186/s13059-016-0997-x
Page, A. J., Cummins, C. A., Hunt, M., Wong, V. K., Reuter, S., Holden, M. T. G., et al. (2015). Roary: rapid large-scale prokaryote pan genome analysis. Bioinformatics 31, 3691–3693. doi: 10.1093/bioinformatics/btv421
Pavlovikj, N., Gomes-Neto, J. C., Deogun, J. S., and Benson, A. K. (2021). ProkEvo: an automated, reproducible, and scalable framework for high-throughput bacterial population genomics analyses. PeerJ. 9:e11376. doi: 10.7717/peerj.11376
Petrovska, L., Mather, A. E., AbuOun, M., Branchu, P., Harris, S. R., Connor, T., et al. (2016). Microevolution of Monophasic Salmonella Typhimurium during Epidemic, United Kingdom, 2005–2010. Emerg. Infect. Dis. 22, 617–624. doi: 10.3201/eid2204.150531
Pightling, A. W., Pettengill, J. B., Luo, Y., Baugher, J. D., Rand, H., and Strain, E. (2018). Interpreting whole-genome sequence analyses of foodborne bacteria for regulatory applications and outbreak investigations. Front. Microbiol. 9:1482. doi: 10.3389/fmicb.2018.01482
Power, R. A., Parkhill, J., and de Oliveira, T. (2017). Microbial genome-wide association studies: lessons from human GWAS. Nat. Rev. Genet. 18, 41–50. doi: 10.1038/nrg.2016.132
Price, M. N., Dehal, P. S., and Arkin, A. P. (2010). FastTree 2—Approximately maximum-likelihood trees for large alignments. PLoS ONE 5, e9490. doi: 10.1371/journal.pone.0009490
Randall, L. P., Cooles, S. W., Coldham, N. G., Penuela, E. G., Mott, A. C., Woodward, M. J., et al. (2007). Commonly used farm disinfectants can select for mutant Salmonella enterica serovar Typhimurium with decreased susceptibility to biocides and antibiotics without compromising virulence. J. Antimicrob. Chemotherap. 60, 1273–1280. doi: 10.1093/jac/dkm359
Rodrigues, G. L., Panzenhagen, P., Ferrari, R. G., dos Santos, A., Paschoalin, V. M. F., and Conte-Junior, C. A. (2020). Frequency of antimicrobial resistance genes in salmonella from Brazil by in silico whole-genome sequencing analysis: an overview of the last four decades. Front. Microbiol. 11:1864. doi: 10.3389/fmicb.2020.01864
Saltykova, A., Wuyts, V., Mattheus, W., Bertrand, S., Roosens, N. H. C., Marchal, K., et al. (2018). Comparison of SNP-based subtyping workflows for bacterial isolates using WGS data, applied to Salmonella enterica serotype Typhimurium and serotype 1,4,[5],12:i:-. PLoS ONE 13:e0192504. doi: 10.1371/journal.pone.0192504
Schneider, J. L., White, P. L., Weiss, J., Norton, D., Lidgard, J., Gould, L. H., et al. (2011). Multistate outbreak of multidrug-resistant salmonella Newport infections associated with ground beef, October to December 2007. J. Food Prot. 74, 1315–1319. doi: 10.4315/0362-028X.JFP-11-046
Seemann, T. (2014). Prokka: rapid prokaryotic genome annotation. Bioinformatics 30, 2068–2069. doi: 10.1093/bioinformatics/btu153
Shapiro, B. J., and Polz, M. F. (2014). Ordering microbial diversity into ecologically and genetically cohesive units. Trends Microbiol. 22, 235–247. doi: 10.1016/j.tim.2014.02.006
Sheppard, S. K., Cheng, L., Méric, G., Haan, C. P. A., Llarena, A., Marttinen, P., et al. (2014). Cryptic ecology among host generalist Campylobacter jejuni in domestic animals. Mol. Ecol. 23, 2442–2451. doi: 10.1111/mec.12742
Sheppard, S. K., Didelot, X., Meric, G., Torralbo, A., Jolley, K. A., Kelly, D. J., et al. (2013). Genome-wide association study identifies vitamin B5 biosynthesis as a host specificity factor in Campylobacter. Proc. Nat. Acad. Sci. 110, 11923–11927. doi: 10.1073/pnas.1305559110
Sheppard, S. K., Guttman, D. S., and Fitzgerald, J. R. (2018). Population genomics of bacterial host adaptation. Nat. Rev. Genet. 19, 549–565. doi: 10.1038/s41576-018-0032-z
Sheppard, S. K., Jolley, K. A., and Maiden, M. C. J. (2012). A Gene-By-gene approach to bacterial population genomics: whole genome MLST of campylobacter. Genes 3, 261–277. doi: 10.3390/genes3020261
Sun, H., Wan, Y., Du, P., and Bai, L. (2020). The epidemiology of monophasic Salmonella Typhimurium. Foodborne Pathog. Dis. 17, 87–97. doi: 10.1089/fpd.2019.2676
Tonkin-Hill, G., Lees, J. A., Bentley, S. D., Frost, S. D. W., and Corander, J. (2019). Fast hierarchical Bayesian analysis of population structure. Nucleic. Acids Res. 47, 5539–5549. doi: 10.1093/nar/gkz361
Trinetta, V., Magossi, G., Allard, M. W., Tallent, S. M., Brown, E. W., and Lomonaco, S. (2020). Characterization of Salmonella enterica Isolates from Selected U.S. Swine Feed Mills by Whole-Genome Sequencing. Foodborne Pathog. Dis. 17, 126–136. doi: 10.1089/fpd.2019.2701
Tyson, G. H., Li, C., Harrison, L. B., Martin, G., Hsu, C.-H., Tate, H., et al. (2021). A multidrug-resistant Salmonella Infantis clone is spreading and recombining in the United States. Microb. Drug Resist. 27, 792–799. doi: 10.1089/mdr.2020.0389
Wirtanen, G., and Salo, S. (2003). Disinfection in Food processing—efficacy testing of disinfectants. Re/Views Environ. Sci. Bio/Technol. 2, 293–306. doi: 10.1023/B:RESB.0000040471.15700.03
Worby, C. J., Chang, H.-H., Hanage, W. P., and Lipsitch, M. (2014a). The distribution of pairwise genetic distances: a tool for investigating disease transmission. Genetics 198, 1395–1404. doi: 10.1534/genetics.114.171538
Worby, C. J., Lipsitch, M., and Hanage, W. P. (2014b). Within-Host bacterial diversity hinders accurate reconstruction of transmission networks from genomic distance Data. PLoS Comput. Biol. 10:e1003549. doi: 10.1371/journal.pcbi.1003549
Yahara, K., Méric, G., Taylor, A. J., de Vries, S. P. W., Murray, S., Pascoe, B., et al. (2017). Genome-wide association of functional traits linked with C ampylobacter jejuni survival from farm to fork. Environ. Microbiol. 19, 361–380. doi: 10.1111/1462-2920.13628
Yang, X., Wu, Q., Zhang, J., Huang, J., Chen, L., Wu, S., et al. (2019). Prevalence, bacterial load, and antimicrobial resistance of Salmonella Serovars isolated from retail meat and meat products in China. Front. Microbiol. 10, 2121. doi: 10.3389/fmicb.2019.02121
Yoshida, C. E., Kruczkiewicz, P., Laing, C. R., Lingohr, E. J., Gannon, V. P. J., Nash, J. H. E., et al. (2016). The salmonella in silico typing resource (SISTR): an open web-accessible tool for rapidly typing and subtyping draft salmonella genome assemblies. PLoS ONE 11:0147101. doi: 10.1371/journal.pone.0147101
Zheng, J., Luo, Y., Reed, E., Bell, R., Brown, E. W., and Hoffmann, M. (2017). Whole-genome comparative analysis of salmonella enterica serovar Newport strains reveals lineage-specific divergence. Genome Biol. Evol. 9, 1047–1050. doi: 10.1093/gbe/evx065
Zhou, Z., Alikhan, N.-F., Mohamed, K., Fan, Y., the Agama Study G.roup, and Achtman, M. (2020). The EnteroBase user's guide, with case studies on Salmonella transmissions, Yersinia pestis phylogeny, and Escherichia core genomic diversity. Genome Res. 30, 138–152. doi: 10.1101/gr.251678.119
Keywords: Salmonella enterica, whole-genome sequencing, population genomics, foodborne pathogens, pan-genome, food safety
Citation: Gomes-Neto JC, Pavlovikj N, Cano C, Abdalhamid B, Al-Ghalith GA, Loy JD, Knights D, Iwen PC, Chaves BD and Benson AK (2021) Heuristic and Hierarchical-Based Population Mining of Salmonella enterica Lineage I Pan-Genomes as a Platform to Enhance Food Safety. Front. Sustain. Food Syst. 5:725791. doi: 10.3389/fsufs.2021.725791
Received: 15 June 2021; Accepted: 02 September 2021;
Published: 01 October 2021.
Edited by:
Jasna Kovac, The Pennsylvania State University (PSU), United StatesReviewed by:
Scott Van Nguyen, Department of Forensic Sciences, United StatesHenk Den Bakker, University of Georgia, Griffin Campus, United States
Dele Ogunremi, Canadian Food Inspection Agency, Canada
Copyright © 2021 Gomes-Neto, Pavlovikj, Cano, Abdalhamid, Al-Ghalith, Loy, Knights, Iwen, Chaves and Benson. This is an open-access article distributed under the terms of the Creative Commons Attribution License (CC BY). The use, distribution or reproduction in other forums is permitted, provided the original author(s) and the copyright owner(s) are credited and that the original publication in this journal is cited, in accordance with accepted academic practice. No use, distribution or reproduction is permitted which does not comply with these terms.
*Correspondence: Andrew K. Benson, abenson1@unl.edu
†These authors have contributed equally to this work and share first authorship