Direct Evidence of Magnetic Reconnection Onset via the Tearing Instability
 Mayur R. Bakrania1*
  I. Jonathan Rae1,2
  Andrew P. Walsh3
  Daniel Verscharen1
  Andy W. Smith1
  Colin Forsyth1
  Anna Tenerani4
- 1Department of Space and Climate Physics, Mullard Space Science Laboratory, University College London, Dorking, United Kingdom
- 2Department of Mathematics, Physics and Electrical Engineering, University of Northumbria, Newcastle, United Kingdom
- 3European Space Astronomy Centre, ESA, Madrid, Spain
- 4Department of Physics, The University of Texas at Austin, Austin, TX, United States
Magnetic reconnection is a sporadic process responsible for energy release in space and laboratory plasmas. It is believed that the tearing mode instability may be responsible for the onset of reconnection in the magnetotail. However, due to its elusive nature, there is an absence of in-situ observations of the tearing instability prior to magnetic reconnection in our nearest natural plasma laboratory. Using neural network outlier detection methods in conjunction with Cluster spacecraft data, we find unique electron pitch angle distributions that are consistent with simulation predictions of the tearing instability and the subsequent evolution of plasma electrons and reconnection. We evaluate tearing stability criterion for the events identified via our neural network outlier method, and find signatures of magnetic reconnection minutes after the majority of tearing observations. Our analysis of the tearing instability provides new insights into the fundamental understanding of the mechanism responsible for reconnection, a process that is ubiquitous in different astrophysical plasma regimes across the Universe and in laboratory experiments on Earth.
1 Introduction
Magnetic reconnection is a universal plasma process that changes the topology of the magnetic field and converts magnetic energy into particle kinetic and thermal energy (Birn and Priest, 2007). This process is responsible for explosive phenomena in laboratory, astrophysical, and space plasmas, such as planetary magnetospheres. The Earth’s nightside magnetosphere, i.e., the magnetotail, provides an accessible medium to directly measure reconnection with in-situ spacecraft. Although there are in-situ observations of ongoing magnetic reconnection (Nagai et al., 2001; Øieroset et al., 2001; Eastwood et al., 2010; Borg et al., 2012; Hwang et al., 2013), the question remains what triggers this process that sporadically changes the magnetic topology, as this process has not been directly measured (Galeev and Zelenii, 1976; Pellat et al., 1991).
The tearing instability is the central candidate mechanism that creates conditions required for the onset of reconnection (Coppi et al., 1966; Chen et al., 1997). In the magnetotail, this instability may occur for sufficiently thin current sheet and small values of the magnetic field normal to the current sheet, and causes quasi-periodic spatial perturbations of the magnetic field and the associated particle distribution functions (Sitnov et al., 2019). The instability takes place within an externally driven current sheet (current sheet thinning caused by an external factor), which usually occurs during the substorm expansion phase (Bessho and Bhattacharjee, 2014). The result of magnetic reconnection is a rearrangement of the magnetic field topology threading the thin current sheet (Galeev and Zelenii, 1976), leading to the formation of plasmoids and X-lines (Zanna et al., 2016), as well as heating and acceleration of the plasma along the field lines. Using kinetic models, two-dimensional Particle-In-Cell (PIC) simulations (Pellat et al., 1991; Bessho and Bhattacharjee, 2014) have shown that in Earth’s magnetotail, the electron tearing instability is the most relevant instability for the initiation of reconnection. However, observational signatures of such a process are still lacking.
On the other hand, simulations have found electron distributions that exhibit a strong counter-streaming field-aligned distribution as the tearing mode develops (Furth, 1963; Büechner and Zelenyi, 1987; Zeiler et al., 2001; Markidis et al., 2012), followed by an isotropisation across all pitch angles over 5 min (Büechner and Zelenyi, 1987). The counter-streaming electron distributions during the early evolution of tearing correspond with a rapid growth in energy and temperature (Büechner and Zelenyi, 1987; Walker et al., 2018). Following this stage, the perpendicular temperature increases (Liu et al., 2014), driving the onset of magnetic reconnection. Here we hypothesise that these field-aligned distributions and their subsequent evolution can be identified in the magnetotail current sheet in order to locate the tearing instability. We apply a neural network outlier detection method to Cluster spacecraft electron data to identify distributions consistent with the tearing mode. We evaluate the plasma and magnetic field conditions at those locations that would be necessary to initiate the tearing instability, through applying the stability criterion derived by Schindler et al. (1973); Liu et al. (2014), valid for a collision less plasma with a finite normal component. Furthermore, data analyses of the subsequent evolution of particles and magnetic fields confirm the typical features found in reconnection simulations. The present work provides strong observational support to theories predicting tearing mode as the onset mechanism for reconnection in the magnetotail.
These findings will help build a more consistent picture of the reconnection process in magnetospheric substorms (Angelopoulos et al., 2008), solar flares (Giovanelli, 1946), and solar wind formation (French et al., 2020; Pucci et al., 2020). Moreover, our findings also apply to astrophysical plasma processes, in-situ observations of which are not possible. These include the evolution of accretion disks around black holes (Zweibel and Yamada, 2009), the formation of jets in active galactic nuclei (Matthews et al., 2020), and gamma ray flares (Del Zanna et al., 2016). The electron tearing mode is also an important process in nuclear fusion plasmas, where the instability forms plasmoids and degrades stability (Hender et al., 2007) of the tokamak, making this area an important field of study (Walker et al., 2020).
2 Methods
2.1 Data
We use electron data (Laakso et al., 2010) from the Cluster (Escoubet et al., 2001) mission’s PEACE (Johnstone et al., 1997; Fazakerley et al., 2010) (Plasma Electron And Current Experiment) instrument on all of the four spacecraft to detect signatures of the tearing mode in the electron distribution functions. Cluster’s four spacecraft fly in a tetrahedral formation with a spin period of 4 s. We use pitch angle distributions from the PITCH-SPIN data product, which have a 4 s time resolution and are constructed from two instantaneous pitch angle measurements per spin. Each distribution consists of a two-dimensional differential energy flux product with twelve 15° pitch angle bins and 26 logarithmically spaced energy bins ranging from 93 eV to 24 keV. Therefore, each distribution has a dimensionality of 312 (12 × 26). We correct our PEACE measurements with the method presented by Cully et al. (2007) to account for the effect of the spacecraft potential measured by the Cluster-EFW instrument (Gustafsson et al., 2001). We normalise the value of differential energy flux between 0 and 1, based on the value of maximum flux in the dataset, in order to concentrate on the shape of the distribution rather than the flux value, given that the Earth’s magnetotail plasma sheet can vary by five orders of magnitude with different conditions (Artemyev et al., 2014).
We use the ECLAT database (Boakes et al., 2014) to isolate relevant times for detecting the tearing instability. The ECLAT database uses data from PEACE, FGM (Balogh et al., 1997), and CIS (Rème et al., 2001) to construct a list of plasma regions encountered by the four Cluster spacecraft in the magnetotail from July to October, during the years 2001–2009. The ECLAT database associates the measurement intervals with three magnetotail regions: the plasma sheet, the plasma sheet boundary layer, and the lobes (Hughes, 1995), which are defined by their plasma and magnetic field characteristics. The database also lists times of current sheet crossings at the centre of the plasma sheet. We obtain PEACE data from times when the spacecraft has spent at least 30 min in the plasma sheet, as this region is most likely to undergo magnetotail reconnection (Angelopoulos et al., 2008).
2.2 Autoencoder
We employ an autoencoder (Hinton and Salakhutdinov, 2006) to detect anomalous distributions from the entire set of plasma sheet data (Bakrania et al., 2020). Autoencoders are a class of unsupervised neural networks which are trained to learn compressed representations of data. These compressed representations are achieved via a “bottleneck” layer which maps (encodes) the input data to a lower-dimensional latent space, and subsequently reconstructs (decodes) the original input from this latent space. By minimising the reconstruction error, or “loss” between the input and output data, the autoencoder retains the most important characteristics in the compressed version of the data. For an anomalous distribution, its most important features are not present in the latent space, which results in a large reconstruction error between the input and output data. Autoencoders are therefore an effective method for isolating outliers (Kube et al., 2019). Figure 1 illustrates the typical architecture of an autoencoder (Sakurada and Yairi, 2014). A detailed description of autoencoders is provided by Hinton and Salakhutdinov (Hinton and Salakhutdinov, 2006).
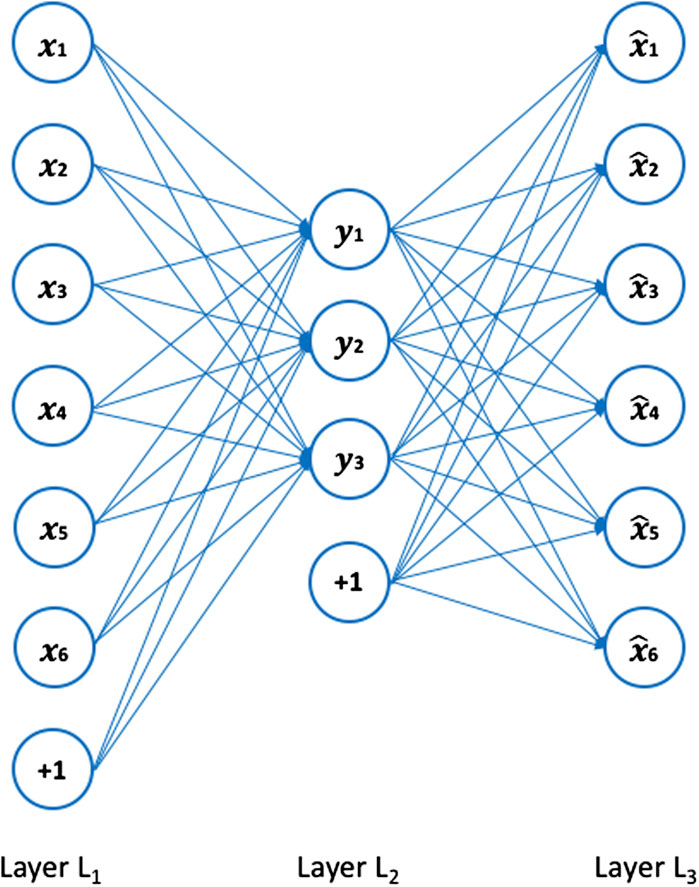
FIGURE 1. The architecture of an autoencoder, adapted from Sakurada and Yairi (2014). Layer L1 represents the input data, with each circle representing a neuron corresponding to a measurement bin, layer L2 is the encoded data in latent space, and layer L3 is the reconstructed data. The circles labelled “+1” are “bias units,” which are parameters the autoencoder adjusts during training to improve its performance.
We construct our autoencoder using the Keras library (Chollet, 2015). Building an autoencoder requires the definition of the number of neurons in each layer. The number of neurons in the input and output layers equals the dimensionality of each distribution: 312 in our case. We set the number of neurons in the bottleneck layer at 32, representing a compression factor of 9.75. Each layer uses an activation function to pass on signals to the next layer (Kube et al., 2019). For the encoder part, we use the ReLU activation function (Hahnioser et al., 2000), and for the decoder part, we use the sigmoid activation function (Chandra and Singh, 2004), which normalises the output between 0 and 1. We then define the loss function and optimiser, which the autoencoder uses to representatively compress and reconstruct the input data. We choose the binary cross-entropy loss function (de Boer et al., 2005) and the Adadelta (Zeiler, 2012) optimiser. All activation functions, loss functions, and optimisers are available in the Keras library. We set the number of epochs to 500 and the batch size, i.e., the number of distributions propagated through the network at each epoch, to 256. The validation split ratio defines the ratio of distributions that remain “unseen” to the autoencoder in order to avoid overfitting. We set this to 1/12. At each epoch a training loss and validation loss value are produced, which both converge to
To isolate the field-aligned tearing distributions from the dataset, we calculate the mean square error (MSE) between each original and reconstructed distribution. We set the MSE threshold to 99.5%, which locates all distributions which have a MSE in the upper 0.5% of the dataset. We subsequently visually inspect each anomalous distribution to find signatures of the tearing instability based on the flux anisotropy, as outlined in Section 1. We then obtain a list of outlier measurements to be studied further.
2.3 Coordinate System
For the intervals which contain a current sheet crossing, we transform the coordinate system from the GSM coordinate system to the local (LMN) coordinate system. This coordinate system provides a more accurate representation of the magnetic field vectors as it takes into account the current sheet tilt. We obtain the local coordinate system from a minimum variance analysis (Sonnerup and Scheible, 1998) of the magnetic field data during a short interval before each instance of tearing. In this coordinate system, L is in the direction of the anti-parallel magnetic field, M is in the direction of the current, and N is in the normal direction to the current sheet. Our algorithm identifies an event on 07/08/2004. For this event, we obtain this coordinate system from the minimum variance analysis of the magnetic field data from 23:26:30 UT to 23:27:30 UT. The vector representations of the local magnetic coordinates are: L = (0.9859, −0.1110, −0.1253), M = (0.1491, 0.9221, 0.3570) and N = (0.0759, −0.3707, 0.9257) in GSM coordinates. We also account for a small out-of-plane (M-direction) guide field of +1.06 nT during this event.
2.4 Tearing Mode Stability Criteria
We evaluate the conditions around outlier events based on the instability criteria set out by Schindler et al. (1973), Liu et al. (2014), and in other studies (see below). Simulations (Bessho and Bhattacharjee, 2014) show that the electron tearing instability only occurs when the magnitude of BN is small (
By applying the energy principle to two-dimensional Vlasov equilibria, Schindler et al. (1973) derived a stability criterion that predicts instability when ζ = kLρe ≥ 1, where kL is the wavenumber of the perturbation in the L direction (along the current sheet) and ρe the electron gyroradius associated with the normal magnetic field component. This criterion can be rewritten as (Liu et al., 2014):
where me is the electron masses, Te is the electron temperature and BN is the normal component of the magnetic field. Introducing f = kLLN and rearranging we get:
where LN is the half-current sheet width. The tearing instability that develops in simulations has been found to have f ∼ 1 Liu et al. (2014). Therefore we set f = 1. Rearranging Eq. 2, we find an expression for the tearing instability threshold as:
where
Therefore, the maximum half-current sheet width at marginal stability LMax is proportional to 1/BN. Eq. 4 provides a limit, below which we expect the tearing instability to develop.
2.5 Hall Quadrupole Field
To link our events to magnetic reconnection, we look for evidence of a Hall quadrupole magnetic field and flow reversals. The Hall quadrupole field shows that BM exhibits a correlation with vL above the current sheet (Northern Hemisphere), and an anti-correlation with vL below the current sheet (Southern Hemisphere). During the intervals in which we observe flow reversals, a small out-of-plane (M-direction) guide magnetic field (Denton et al., 2016) may be present which needs to be accounted for. Averaging BM prior to the flow reversal informs us of the magnitude of this guide field. We therefore correct for this by shifting all BM values in this interval until the average BM vanishes.
In summary, after identifying possible candidate measurement points for tearing, we check the conditions during the event, evaluating:
1. The criterion in Eq. 3, which we determine by comparing the corresponding magnetic field measurements (GSM coordinate system) from the FGM instrument, and electron temperature measurements from the PEACE instrument.
2. The presence of a rapid growth in temperature, in conjunction with an isotropisation, shortly after the algorithm-identified outlier distribution is observed, in line with the results from PIC simulations described in section 1 (Büechner and Zelenyi, 1987; Liu et al., 2014; Walker et al., 2018).
3. The possible presence of a Hall quadrupolar field.
3 Results
In total, we identify 15 separate time intervals, between 2001 and 2009, (see Table 1), that all fulfill the criteria for field-aligned distributions described in Section 1, as well as the magnetic field criteria (see Section 2.4). We refer to these field-aligned distributions as tearing distributions. Figure 2 shows the results of our stability analysis for all events. We create the plot by inputting measurements during each event into Eq. 4 (Liu et al., 2014). Given that we cannot directly confirm LN and BN simultaneously, these lines provide realistic limits on the conditions at the site at which the tearing instability initiates. For example, for a half current sheet width of 0.1 RE (Sergeev et al., 1988), we require a BN between 0.1 and 0.3 nT. We will discuss these values in the context of our observations in the following section.
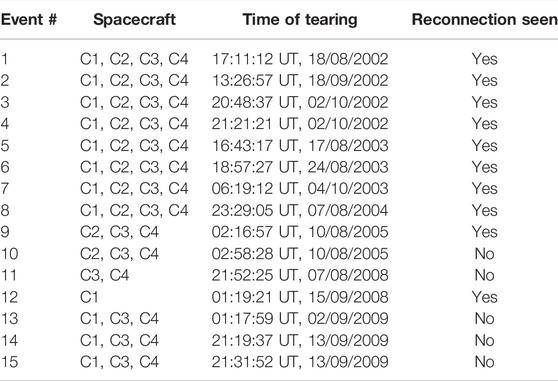
TABLE 1. Times of the 15 tearing events, along with the spacecraft which detected the tearing distributions and the subsequent magnetic reconnection signatures.
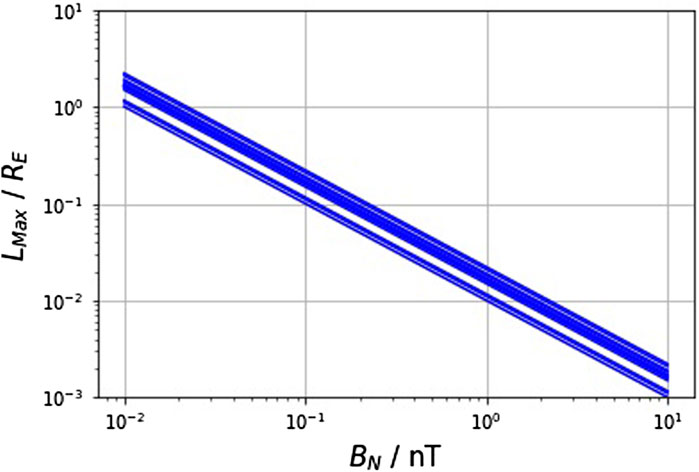
FIGURE 2. Evaluation of the criterion for marginal stability. The blue lines represent marginal stability for each of the 15 events identified by our neural network method, evaluated through Eq. 4. For conditions below these lines we infer the plasma is tearing unstable (Liu et al., 2014).
3.1 Case Study
In this section we discuss the event which occurred on 07/08/2004. We discuss the rest of the events in Section 3.2. In this case study event, Cluster passed from North to South through the magnetotail, crossing the current sheet at 23:27:13 UT before encountering an electron population that shows signatures of the tearing mode instability, followed by a crossing through a diffusion region. The first outlier distribution, or tearing distribution, was detected by the C4 spacecraft at 23:29:05 UT, when the spacecraft was below the current sheet in the position (−16.4, −9.0, 0.1) RE (where 1 RE = 6,371 km) in GSM (Geocentric Solar Magnetospheric) coordinates. The remaining three Cluster spacecraft, which were separated by 0.2 RE from the C4 spacecraft, also observed similar tearing distributions.
Figure 3 shows how the electron temperature, magnetic field, and plasma flow evolve during this particular event. The times of tearing distributions are indicated by red dots. The lines A, B, and C represent the times of the distributions which we show in Figure 4, line A represents a time before the detection of the tearing distribution at which C4 crossed the tail current sheet, line B represents the time of a tearing distribution detection, and line C represents a time after this detection. We note that the BN value preceding the tearing distribution shown is
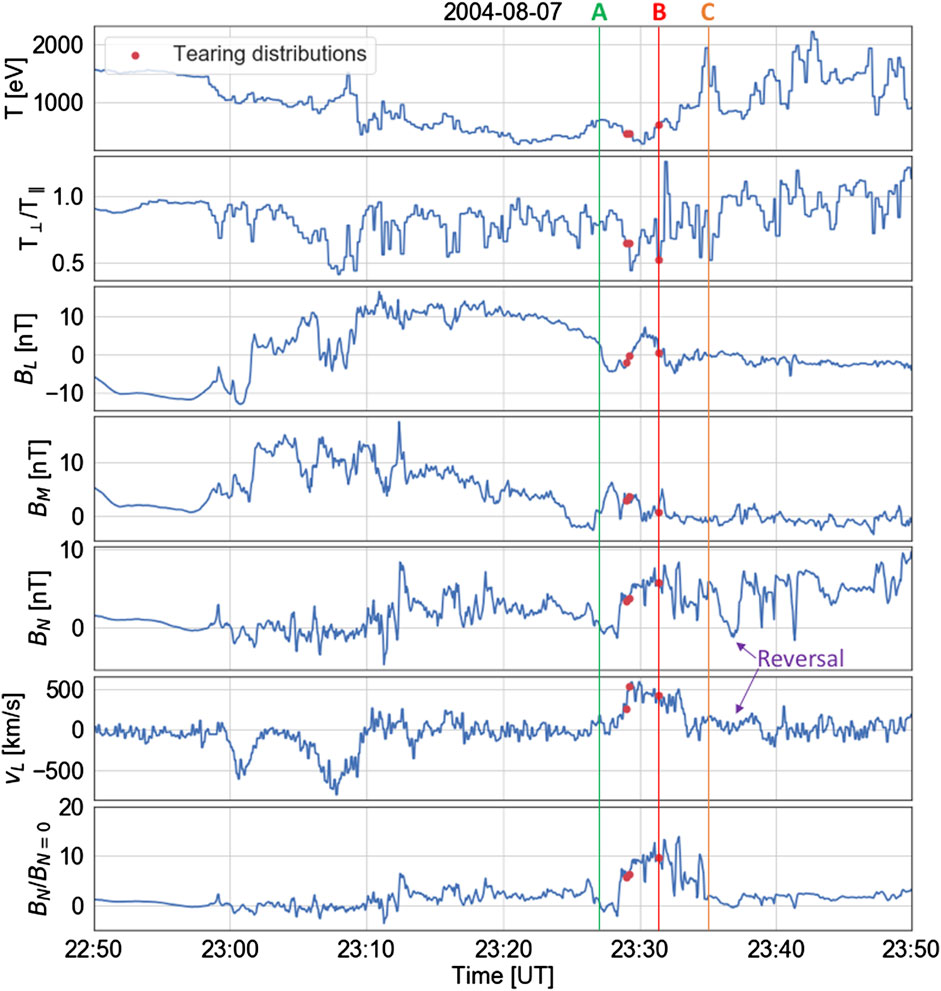
FIGURE 3. Spacecraft measurements indicating the presence of the tearing instability. The plasma and magnetic field parameters obtained by the C4 spacecraft across times 22:50:00–23:50:00 UT on 07/08/2004. From top to bottom: electron temperature, electron T⊥/T∥, magnetic field in the L, M, N-directions respectively (in local magnetic coordinates), plasma flow velocity in the L-direction, and the BN/BN=0 ratio. A flow reversal is highlighted in the BN and vL panels. The red points indicate times of the tearing distributions identified by our outlier detection method. The lines labelled A, B, and C represent times of pre-tearing, tearing, and post-tearing distributions respectively. We show the distributions measured at these times in Figure 4.
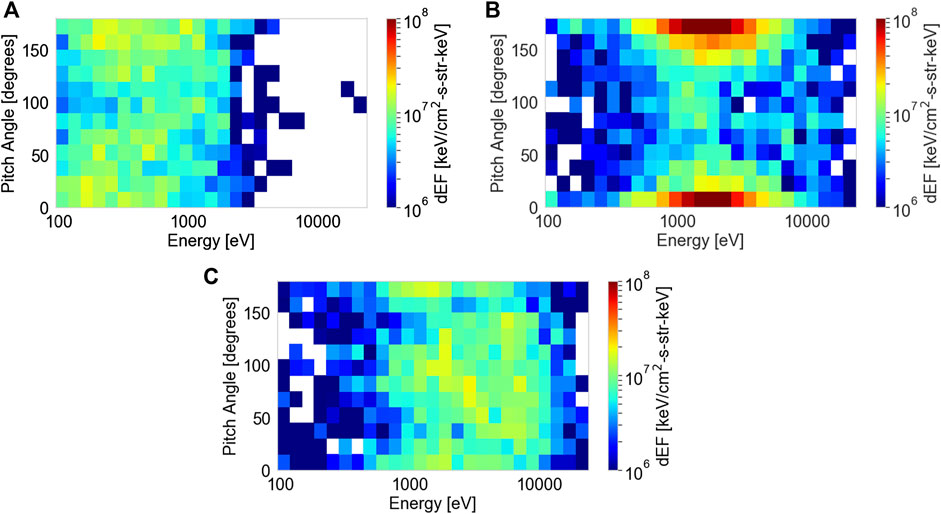
FIGURE 4. The evolution of a tearing distribution into an isotropic distribution with a higher bulk energy. The differential energy flux distributions as a function of pitch angle and energy, which correspond to the times (A) (23:27:13 UT), (B) (23:34:23 UT), and (C) (23:34:41 UT) in Figure 3 as measured by the C4 PEACE instrument.
The temperature increases rapidly after the detection of the tearing distribution, in conjunction with an increase in electron anisotropy (T⊥/T∥) from ∼0.6 to ∼1. These anisotropy changes agree with PIC simulations (Büechner and Zelenyi, 1987; Liu et al., 2014; Walker et al., 2018) that predict that the tearing distribution evolves into an isotropic distribution during the growth of the tearing instability. Figure 4 illustrates this temperature and anisotropy evolution. A low energy isotropic distribution prior to tearing evolves into a strong field-aligned distribution, followed by an isotropic distribution with a higher temperature, as expected from theory.
After noting the close correspondence between the observations and simulations of the tearing mode, we can gain further insight into the time evolution of the tearing mode. Firstly, the field-aligned population lasts for just over 2 minutes, during which the total temperature remains approximately stable at ∼400 eV. After the last tearing distribution is detected, a rapid growth in temperature reaches a peak of 1979 eV, 336 s after the first tearing distribution. As the tearing mechanism is characterised by the evolution of a field-aligned distribution into an isotropic distribution at higher temperatures, we attribute this time of 336 s to the growth time of the instability for this event. After this temperature increase, the spacecraft observes direct evidence of magnetic reconnection at 23:36:52 UT, i.e., 467 s (or 7 min 47 s) after the first tearing distribution, as shown by the simultaneous reversal in BN and vL (from positive to negative values) in Figure 3 after the tearing distributions.
Nagai et al. (2001) find that the reconnection process generates a current system known as the Hall quadrupole magnetic field (Karimabadi et al., 2004). Figure 5 shows the out-of-plane magnetic field (BM) values in the along-current sheet (BL-vL) plane after our 07/08/2004 tearing event, which confirms the presence of this characteristic Hall quadrupolar field (see section 2.5). The scatter of the points in Figure 5 shows that negative BM values dominate in the upper left and bottom right quadrants, while positive BM values dominate in the other two quadrants. This pattern corresponds to the quadrupole signature of correlation (anti-correlation) with vL, i.e., the speed of plasma flow in the L-direction, in the Northern (Southern) Hemisphere (this quadrupole pattern is also illustrated in Figure 6). The bar chart in Figure 5B confirms this quadrupole observation, as there is a clear dominance of positive or negative BM depending on the respective quadrant, in keeping with the expected signatures from magnetic reconnection.
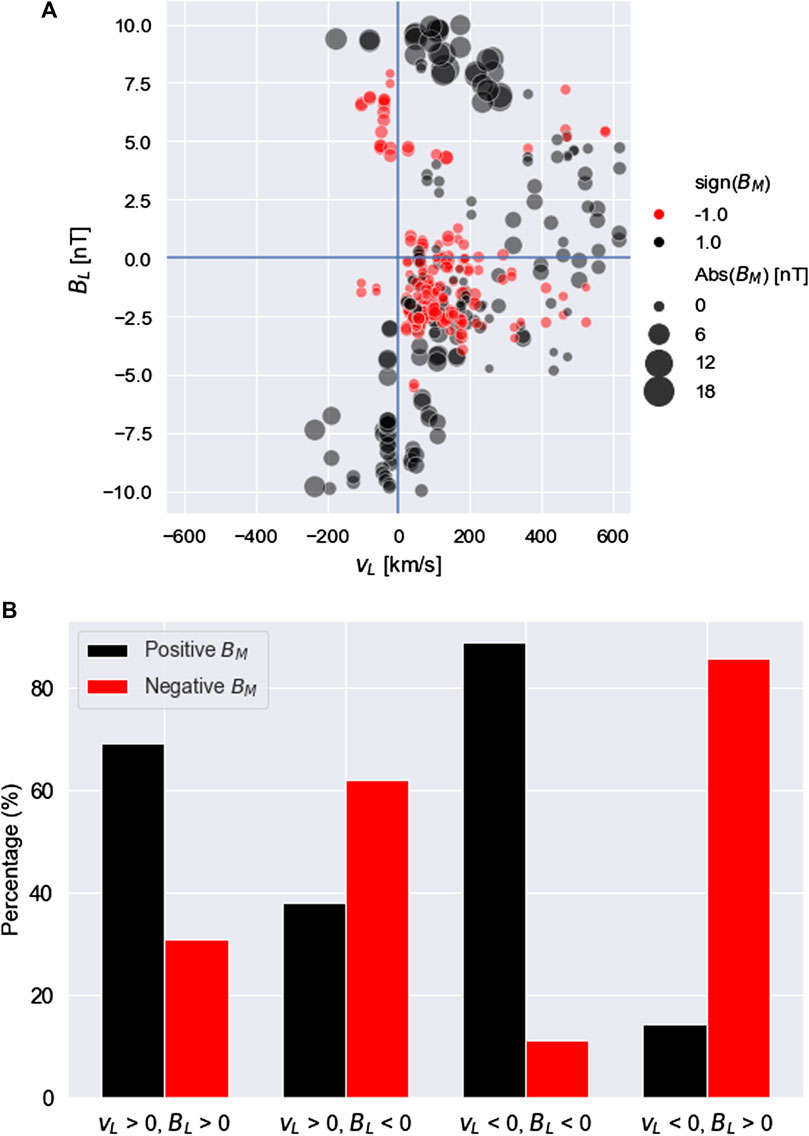
FIGURE 5. (A) Statistical determination of a reconnection site. Quadrupole plot showing BM as a function of BL and vL, across a 10 min window centered on the BN reversal in Figure 3 (at 23:36:52 UT) after the tearing instability distributions. Black dots correspond to BM
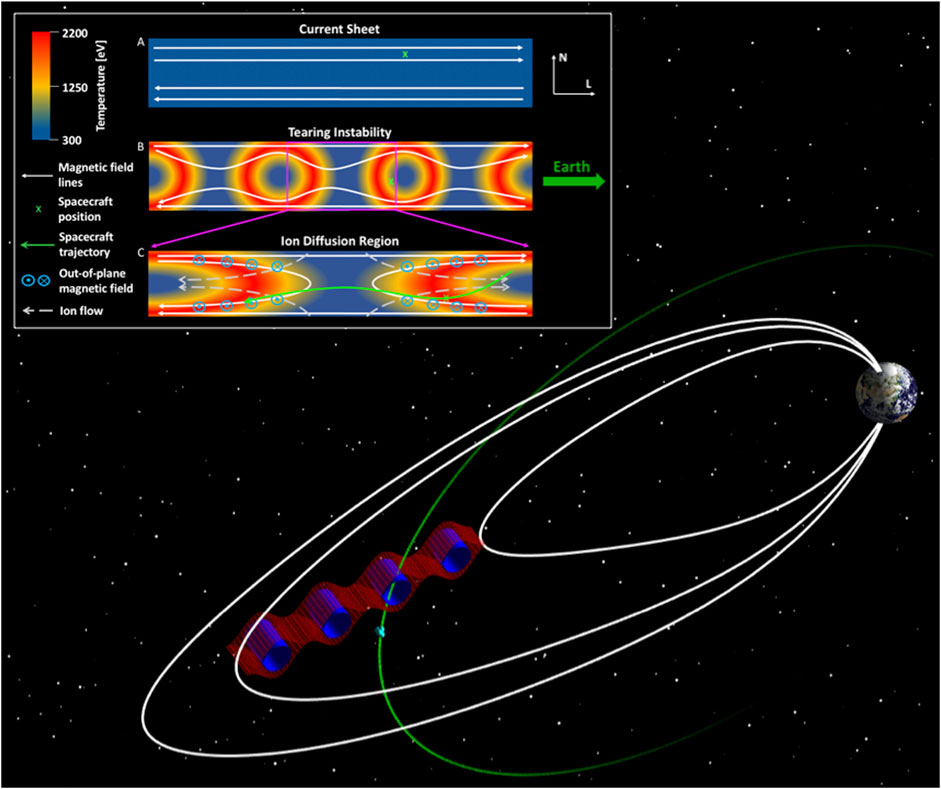
FIGURE 6. Illustration of the evolution of magnetic field lines from a flat current sheet into a reconnection site via the tearing instability, with a 3D representation of the magnetic islands in the Earth’s vicinity. The background colours represent the local electron temperature (Lu et al., 2019), with the scales based on the temperatures observed by the C4 spacecraft during the 07/08/2004 tearing event. The white lines represent the magnetic field lines. The three panels correspond to the times A, B, and C in Figure 3, and the green crosses show the location the C4 spacecraft at each time. The green arrow shows the overall trajectory of the spacecraft across this reconnection region in our case study event. The Hall quadrupole field (blue dots and crosses) and corresponding ion flows (dotted grey arrows) are also displayed.
Figure 6 provides a schematic detailing the evolution of a laminar current sheet into a reconnection site via the tearing instability consistent with the observations of our 07/08/2004 event. We also illustrate the magnetic islands (Ishizawa and Nakajima, 2010) in 3D along with their expected location in near-Earth space. Each panel corresponds to the timestamps A, B, or C in Figure 3. The green crosses show the C4 spacecraft position at each time, and the green arrow shows the overall trajectory, as informed by the magnetic field measurements. The background colours illustrate the electron temperature in the reconnection site and the surrounding magnetic islands (Lu et al., 2019), with the scale informed by temperature measurements in our event. As the diagram shows, the magnetic island formation coincides with an increase in electron temperature, as observed by the spacecraft after time B in Figure 3. The spacecraft then observes the X-point, as signified by the flow reversal in Figure 3, which aligns with a region of lower temperature. Subsequently, the spacecraft observes the second region of high temperature.
From our case study, we construct a picture of the tearing instability, incorporating the temperature profiles and electron distribution functions of a potentially tearing unstable plasma. We also relate the instability to the onset of reconnection. Our statistical survey will allow us to further quantify the tearing instability and its relationship with reconnection, building in analysis from all 15 of our tearing events.
3.2 Statistical Survey of Tearing Events
Our method finds 14 other events that we use to test for consistency with the tearing mode. We carry out a superposed epoch analysis of the SML (SuperMAG Auroral Lower) (Gjerloev, 2012) indices around each of the 15 tearing events, to determine how they relate to substorm phase (Forsyth et al., 2015). At the end of the substorm expansion phase, the SML index is at its maximum magnitude, and subsequently decreases in the recovery phase. Figure 7 shows that the tearing events occur both during the expansion and recovery phases, with the average time located at the end of the expansion phase. As the growth phase is by far the most prevalent phase of a substorm (Forsyth et al., 2015), a chi-squared test (Tallarida and Murray, 1987) between the potential tearing events and plasma sheet distributions shows that the occurrence of all tearing events during the expansion and recovery phase is statistically significant to a p-value of ≪0.05, as the two distributions cannot be derived from the same source. This analysis confirms that our tearing events occur under an externally driven current sheet (which is the case during the expansion phase), which is as expected from simulations (Bessho and Bhattacharjee, 2014).
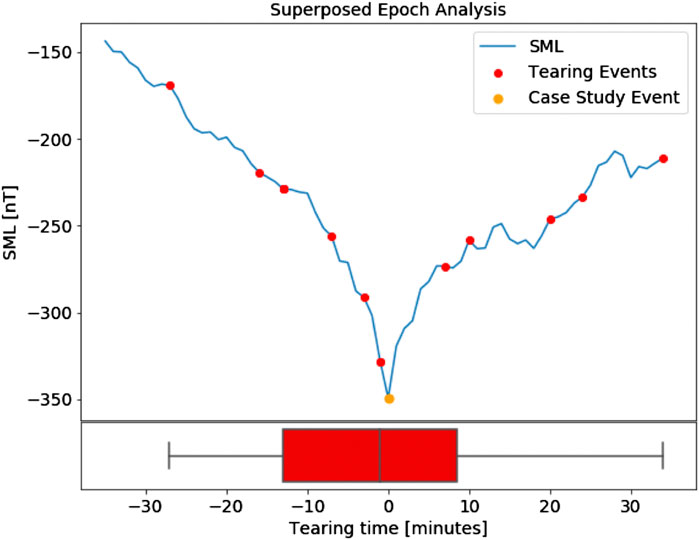
FIGURE 7. Superposed epoch analysis of SML relating tearing to substorms. The spread of tearing times for all 15 events compared to the superposed epoch analysis of SML measurements across each of the 15 events. The blue curve is calculated by averaging the SML peak around each of the 15 tearing events, while the location of the red dots represents the relative timings of each particular tearing event in comparison to the its associated peak in SML. The box plot underneath summarises the distribution of tearing event timings in comparison to the peak in SML. The vertical lines of the red box show the lower quartile, mean, and upper quartile of the relative times, while the two longest lines show the earliest and latest tearing event.
Our calculations of the current sheet thickness (Thompson et al., 2005) using Eq. 5 also reveal evidence of current sheet thinning, further showing that the current sheet is being externally driven by the substorm expansion phase. Saito (2015) find that the average current sheet thickness is roughly 6 RE. Across each of the tearing events, we calculate an average total thickness of 0.6 RE, with a minimum value of 0.39 RE and a maximum value of 0.77 RE. This thickness is a factor of 2-3 higher than the example cited in discussion of Figure 2, meaning a BN smaller than 0.1–0.3 nT would be required for the plasma to be tearing unstable. As discussed above, Sergeev et al. (1988) showed that these values were consistent with the current sheet thickness at the end of the growth phase.
In our statistical survey, we determine the growth times of the instability across all events, based on the time between the first detection of a tearing distribution and the subsequent peak in temperature. In the 15 events, the average growth time is 601 s, with a lower quartile of 348 s and an upper quartile of 766 s. The minimum and maximum growth times are 224 and 1,200 s respectively. The average peak temperature across all events is 2,691 eV, with a lower quartile of 1766 eV and an upper quartile of 2,871 eV. The average change in temperature is 1712 eV. Our analysis shows large variations in the temperature of the tearing unstable plasma. As expected (Galeev and Zelenii, 1976), we do not observe a correlation between the temperature and growth time of the instability.
Using multi-spacecraft techniques by cross-referencing observations of tearing distributions with the positions of each spacecraft, we also constrain the size of the region undergoing tearing. In the 07/08/2004 event (Figure 3), we find that all four Cluster spacecraft observe the characteristic tearing distributions. The maximum distance between the spacecraft is 0.20 RE at this time, and for all events, when the spacecraft are less than 1 RE from an observed tearing distribution, a similar tearing distribution is observed; spacecraft that are more than 1 RE from an observed tearing distribution do not observe tearing distributions. However, all four spacecraft in all tearing events observe the characteristic temperature rise after the tearing distribution, as illustrated by the red bands in Figure 6, suggesting the region of subsequent particle energisation from tearing-initiated reconnection extends to at least 1.36 RE in the surrounding plasma (the largest distance between two spacecraft across all tearing events).
Of the 15 tearing events, we observe signatures of reconnection after 10 of them. For 8 of these 10 events, the spacecraft crosses the current sheet and we observe the characteristic Hall quadrupole magnetic field (Borg et al., 2012). The presence of a reconnection site for 7 of these events was previously confirmed by Eastwood et al. (2010). For the remaining two reconnection events, the spacecraft do not traverse the current sheet; rather they remain below the current sheet and therefore cannot detect all quadrants of the Hall quadrupole field. In these two events, the spacecraft and current sheet are moving closer together, so we observe an anti-correlation between BM and vL, i.e., two of the four expected quadrants, highlighting the presence of a diffusion region associated with reconnection (Eastwood et al., 2010). For the other five tearing events where the spacecraft do not observe a diffusion region, the spacecraft remain in the Southern Hemisphere and the BL field increases in magnitude, indicating that the spacecraft and current sheet are moving apart.
Figure 8 shows a summary of the quadrupolar signatures expected from magnetic reconnection for all 10 of the tearing-reconnection events. It can be seen from Figure 8 that there is a clear average quadrupole signature which the corresponding bar chart confirms. There are similar time delays between the first tearing distribution and the observation of a reconnection X-point across all 8 events where a reconnection X-point is observed. This delay varies between 5 min 32 s and 8 min 20 s, a variation possibly caused by unpredictable current sheet flapping (Sergeev et al., 2003; Forsyth et al., 2009). These findings provide an insight into the characteristic timescale (of a few minutes) of reconnection site formation as a result of the tearing instability.
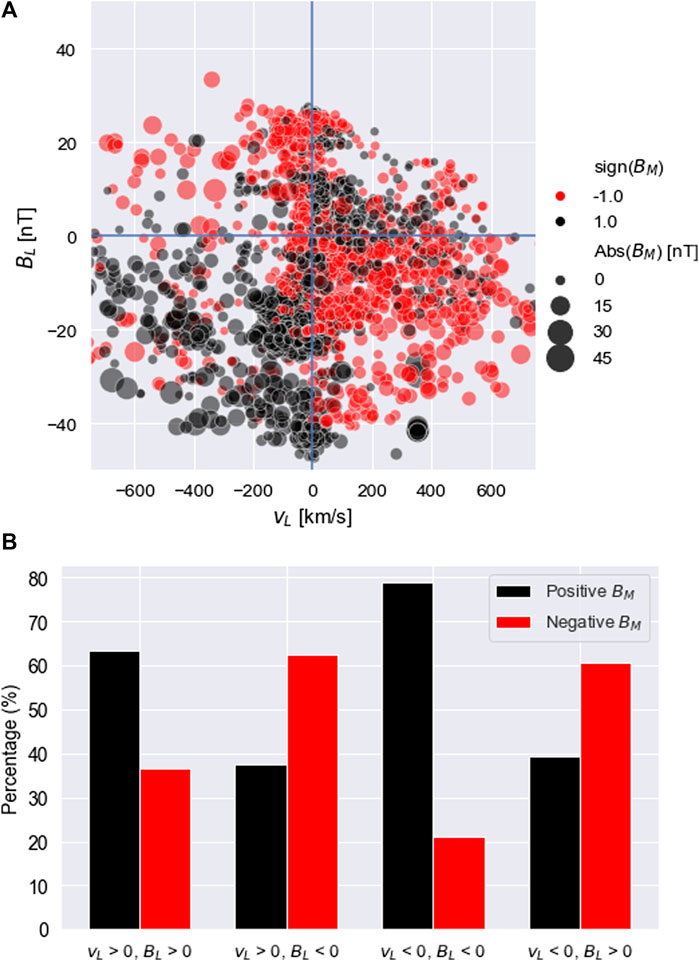
FIGURE 8. (A) Quadrupole plot showing the out-of-plane magnetic field BM in the BL-vL plane, for 10 of our observations where a reconnection signature is observed after the tearing instability distributions. The features of this plot are consistent with those seen in Figure 5. (B) The percentage of instances with BM > 0 and BM < 0 in each quadrant.
4 Discussion
The tearing mode instability is the dominant mechanism responsible for the onset of magnetic reconnection in high-β plasmas (Galeev and Zelenii, 1976). In this study, we present the first in-situ observations of distributions that are consistent with the tearing mode instability in the high-β environment of Earth’s magnetotail plasma sheet. These tearing mode events are discovered by applying a neural network outlier detection method (Bakrania et al., 2020) to Cluster-PEACE data of the electron velocity distribution functions taken within the plasma sheet. These neural network methods have applications in any plasma environment where in-situ measurements are available. We identify 15 separate cases of the tearing mode, evaluate the theoretical tearing instability criteria (Schindler et al., 1973) and match simulations of the evolution of electron anisotropy and temperature.
As magnetotail current sheet plasmas share similarities with other environments in which the tearing instability is important, our observations provide a fundamental understanding of the mechanism responsible for the initiation of magnetic reconnection. We detect signatures of magnetic reconnection after 10 of the 15 events, producing observational evidence for the link between tearing and reconnection, a link which has only been shown in simulations to date (Bhattacharjee et al., 2009). The lack of reconnection signatures after the other five tearing events can be explained by the relative position and trajectory of the spacecraft with respect to the reconnecting current sheet (based on the increase in magnitude of BL).
Our observations enable us to make the first experimental measurements of the growth times of the tearing mode, improving our understanding of the timescales of the instability. The growth time of each tearing event varies between 4 and 20 min, and with no apparent correlation between the tearing growth time and the value of the subsequent peak temperature, which is a measure of the energisation of the plasma following reconnection. Previous simulations (Coroniti, 1980; Brittnacher et al., 1995), which assume a slightly higher L-component of the background magnetic field, have shown that the tearing instability growth time is ∼5 min. In order to understand how the growth of the tearing instability relates to the properties of the surrounding plasma, we calculate the characteristic Alfvén timescales (τA) in Section 6: Appendix A of the system for each event. We find that the ratio between the tearing and Alfvén timescales is ∼100 across all 15 events. These results show that the relative growth rate of the tearing mode is in fact one order of magnitude lower than predicted in simulations by Walker et al. (2018) and Wang et al. (1988), however our relative growth rate is in agreement with results by Shi et al. (1987).
The main source of uncertainty in our estimation of the growth time lies in the assumption that the spacecraft observe the true start and end of tearing, which cannot be unambiguously determined by in-situ observations alone. If the spacecraft are not observing the true start of the tearing instability, then our calculated time delays may actually characterise the physical distance between the potential tearing distribution and isotropic distribution, rather than the growth time. As our calculations of the growth rate are underestimates of the true growth rate, the discrepancy between our calculations and previous studies, regarding the growth time to Alfvén timescales, may not be as large.
With the aid of the SOPHIE dataset, we can link the occurrence of the tearing events, to the substorm phase at the times to our 15 tearing events. We find that the tearing instability is significantly more likely to occur during the expansion and recovery phase, than the growth phase, and on average the tearing instability occurs on the boundary between the expansion and recovery phase. As the expansion phase is initiated due to an externally driven current sheet, we confirm that this externally driven current sheet is also a prerequisite for tearing in the magnetotail, as expected from simulations.
The time delay between the first tearing distribution and the formation of the reconnection site varies within a narrow range of 5 min 32 s–8 min 20 s across our events. This narrow range of times points towards a consistent delay between tearing and reconnection site formation, similar to that found in simulations (Chen et al., 1997). Our multi-spacecraft analysis shows that the size of the tearing region itself is less than ∼1 RE. More high cadence multi-spacecraft measurements, such as measurements from the MMS (Sharma and Curtis, 2005) (Magnetospheric Multiscale Mission) mission, will be important in furthering this investigation into the size and location of tearing regions.
5 Conclusion
Magnetic reconnection is a ubiquitous process in space, laboratory, and astrophysical plasmas that converts magnetic energy to kinetic energy and results in a large variety of energetic events, including aurora, solar flares, astrophysical jets, and tokamak disruptions. Since the start of the space age, reconnection has been widely studied in different physical environments. Relatively little has been known, however, about the process by which reconnection is triggered. Until now, theory and simulations have provided most of the insight into this elusive kinetic plasmoid instability mechanism.
The novel machine learning techniques we employ make our identification of the tearing instability possible on a consistent basis. In 10 years of high-resolution magnetotail plasma sheet crossings, we find 15 clear examples of distributions with features consistent with those expected from the tearing instability, which were observed in magnetotail conditions that are likely to be tearing-unstable. These distributions were measured prior to observations of magnetic reconnection, providing a clear link between these two physical processes. We show that the time delay between the two processes is of the order of a few minutes, which is also similar to the growth time of the instability prior to reconnection. Furthermore, we show that the timing of these events are linked to current sheet thinning, which occurs during the substorm expansion and recovery phases, confirming that tearing instability results from externally driven processes.
Our study serves as the groundwork for future studies that would investigate how tearing mode growth times vary across different plasma environments, from the magnetosphere to the solar corona and beyond. We provide a comprehensive analysis of the temperature profiles and timescales during the tearing instability, taking a significant step in solving the longstanding problem of reconnection initiation with real-world data.
Data Availability Statement
The original contributions presented in the study are included in the article/Supplementary Material, further inquiries can be directed to the corresponding author.
Author Contributions
MB developed the method described in the manuscript, tested it on the magnetotail data and wrote the manuscript. IR was the lead supervisor who guided the direction of the project and provided insight at every stage. AW provided expertise on the magnetotail and the various populations that we observed, aiding the evaluation of our method. DV was also important in classifying the plasma regimes and provided insights into the physical processes governing electrons in space plasmas. AS was key to the development of the method due to his expertise in machine learning. CF provided assistance with figure preparation. AT provided key insights into the tearing instability. All co-authors made important contributions to the manuscript.
Funding
MB is supported by a UCL Impact Studentship, joint funded by the ESA NPI programme. IR the STFC Consolidated Grant ST/S000240/1 and the NERC grants NE/P017150/1, NE/P017185/1, NE/V002554/1, and NE/V002724/1. DV is supported by the STFC Consolidated Grant ST/S000240/1 and the STFC Ernest Rutherford Fellowship ST/P003826/1. AS is supported by the STFC Consolidated Grant ST/S000240/1 and by NERC grants NE/P017150/1 and NE/V002724/1. CF is supported by NERC Independent Research Fellowship NE/N014480/1, NERC grants NE/V002724/1, NE/V002554/2, NE/P017185/2 and NE/P017150/1 and STFC Consolidated Grant ST/S000240/1. IR is supported by STFC grant ST/V006320/1 and NERC grants NE/P017150/1, NE/P017185/2, NE/V002554/2, and NE/V002724/1.
Conflict of Interest
The authors declare that the research was conducted in the absence of any commercial or financial relationships that could be construed as a potential conflict of interest.
Publisher’s Note
All claims expressed in this article are solely those of the authors and do not necessarily represent those of their affiliated organizations, or those of the publisher, the editors and the reviewers. Any product that may be evaluated in this article, or claim that may be made by its manufacturer, is not guaranteed or endorsed by the publisher.
Acknowledgments
We thank the Cluster instrument teams (PEACE, FGM, CIS, EFW) for the data used in this study, in particular the PEACE operations team at the Mullard Space Science Laboratory. We also acknowledge the European Union Framework 7 Programme, the ECLAT Project FP7 Grant no. 263325, and the ESA Cluster Science Archive. We also thank Clare Watt and Sarah Matthews for their advice on this manuscript.
References
Angelopoulos, V., McFadden, J. P., Larson, D., Carlson, C. W., Mende, S. B., Frey, H., et al. (2008). Tail Reconnection Triggering Substorm Onset. Science 321, 931–935. doi:10.1126/science.1160495
Artemyev, A. V., Walsh, A. P., Petrukovich, A. A., Baumjohann, W., Nakamura, R., and Fazakerley, A. N. (2014). Electron Pitch Angle/energy Distribution in the Magnetotail. J. Geophys. Res. Space Phys. 119, 7214–7227. doi:10.1002/2014JA020350
Bakrania, M. R., Rae, I. J., Walsh, A. P., Verscharen, D., and Smith, A. W. (2020). Using Dimensionality Reduction and Clustering Techniques to Classify Space Plasma Regimes. Front. Astron. Space Sci. 7, 80. doi:10.3389/fspas.2020.593516
Balogh, A., Dunlop, M. W., Dunlop, M. W., Cowley, S. W. H., Southwood, D. J., Thomlinson, J. G., et al. (1997). The Cluster Magnetic Field Investigation. Space Sci. Rev. 79, 65–91. doi:10.1023/A:100497090774810.1007/978-94-011-5666-0_3
Bessho, N., and Bhattacharjee, A. (2014). Instability of the Current Sheet in the Earth's Magnetotail with Normal Magnetic Field. Phys. Plasmas 21, 102905. doi:10.1063/1.4899043
Bhattacharjee, A., Huang, Y. M., Yang, H., and Rogers, B. (2009). “Fast Reconnection in High-Lundquist-Number Plasmas Due to Secondary Tearing Instabilities,” in Solar Heliospheric and INterplanetary Environment (Princeton: SHINE), 161.
Birn, J., and Priest, E. R. (2007). Reconnection of Magnetic Fields. Cambridge: Cambridge University Press.
Boakes, P. D., Nakamura, R., Volwerk, M., and Milan, S. E. (2014). ECLAT Cluster Spacecraft Magnetotail Plasma Region Identifications (2001-2009). Dataset Pap. Sci. 2014, 1–13. doi:10.1155/2014/684305
Borg, A. L., Taylor, M. G. G. T., and Eastwood, J. P. (2012). Electron Pitch Angle Distribution during Magnetic Reconnection Diffusion Region Observations in the Earth's Magnetotail. Ann. Geophys. 30, 109–117. doi:10.5194/angeo-30-109-2012
Brittnacher, M., Quest, K. B., and Karimabadi, H. (1995). A New Approach to the Linear Theory of Single-Species Tearing in Two-Dimensional Quasi-Neutral Sheets. J. Geophys. Res. 100, 3551–3562. doi:10.1029/94JA02743
Büchner, J., and Zelenyi, L. M. (1987). Chaotization of the Electron Motion as the Cause of an Internal Magnetotail Instability and Substorm Onset. J. Geophys. Res. 92, 13456–13466. doi:10.1029/JA092iA12p13456
Chandra, P., and Singh, Y. (2004). An Activation Function Adapting Training Algorithm for Sigmoidal Feedforward Networks. Neurocomputing 61, 429–437. doi:10.1016/j.neucom.2004.04.001
Chen, Q., Otto, A., and Lee, L. C. (1997). Tearing Instability, Kelvin-Helmholtz Instability, and Magnetic Reconnection. J. Geophys. Res. 102, 151–161. doi:10.1029/96ja03144
[Dataset] Chollet, F. (2015). Keras. Available at: https://keras.io (Accessed February 21, 2020).
Coppi, B., Laval, G., and Pellat, R. (1966). Dynamics of the Geomagnetic Tail. Phys. Rev. Lett. 16, 1207–1210. doi:10.1103/physrevlett.16.1207
Coroniti, F. V. (1980). On the Tearing Mode in Quasi-Neutral Sheets. J. Geophys. Res. 85, 6719–6728. doi:10.1029/JA085iA12p06719
Cully, C. M., Ergun, R. E., and Eriksson, A. I. (2007). Electrostatic Structure Around Spacecraft in Tenuous Plasmas. J. Geophys. Res. 112, a–n. doi:10.1029/2007JA012269
de Boer, P.-T., Kroese, D. P., Mannor, S., and Rubinstein, R. Y. (2005). A Tutorial on the Cross-Entropy Method. Ann. Oper. Res. 134, 19–67. doi:10.1007/s10479-005-5724-z
Del Zanna, L., Papini, E., Landi, S., Bugli, M., and Bucciantini, N. (2016). Fast Reconnection in Relativistic Plasmas: the Magnetohydrodynamics Tearing Instability Revisited. Mon. Not. R. Astron. Soc. 460, 3753–3765. doi:10.1093/mnras/stw1242
Denton, R. E., Sonnerup, B. U. Ö., Hasegawa, H., Phan, T. D., Russell, C. T., Strangeway, R. J., et al. (2016). Motion of the Mms Spacecraft Relative to the Magnetic Reconnection Structure Observed on 16 October 2015 at 1307 Ut. Geophys. Res. Lett. 43, 5589–5596. doi:10.1002/2016gl069214
Dunlop, M. W., Southwood, D. J., Glassmeier, K.-H., and Neubauer, F. M. (1988). Analysis of Multipoint Magnetometer Data. Adv. Space Res. 8, 273–277. doi:10.1016/0273-1177(88)90141-x
Eastwood, J. P., Phan, T. D., Øieroset, M., and Shay, M. A. (2010). Average Properties of the Magnetic Reconnection Ion Diffusion Region in the Earth's Magnetotail: The 2001-2005 Cluster Observations and Comparison with Simulations. J. Geophys. Res. 115, a–n. doi:10.1029/2009JA014962
Escoubet, C. P., Fehringer, M., and Goldstein, M. (2001). <i>Introduction</i>The Cluster Mission. Ann. Geophys. 19, 1197–1200. doi:10.5194/angeo-19-1197-2001
Fazakerley, A. N., Lahiff, A. D., Wilson, R. J., Rozum, I., Anekallu, C., West, M., et al. (2010). “Peace Data in the Cluster Active Archive,” in The Cluster Active Archive. Editors H. Laakso, M. Taylor, and C. P. Escoubet (Netherlands: Springer), 129–144. doi:10.1007/978-90-481-3499-1_8
Forsyth, C., Lester, M., Fear, R. C., Lucek, E., Dandouras, I., Fazakerley, A. N., et al. (2009). Solar Wind and Substorm Excitation of the Wavy Current Sheet. Ann. Geophys. 27, 2457–2474. doi:10.5194/angeo-27-2457-2009
Forsyth, C., Rae, I. J., Coxon, J. C., Freeman, M. P., Jackman, C. M., Gjerloev, J., et al. (2015). A New Technique for Determining Substorm Onsets and Phases from Indices of the Electrojet (SOPHIE). J. Geophys. Res. Space Phys. 120, 592. doi:10.1002/2015JA021343
French, R., Judge, P., Matthews, S., van Driel-Gesztelyi, L., and Long, D. (2020). “Spectropolarimetric Insight into Plasma Sheet Dynamics of a Solar Flare,” in AAS/Solar Physics Division Meeting (Cambridge), 52, 211.02.
Furth, H. P. (1963). Prevalent Instability of Nonthermal Plasmas. Phys. Fluids 6, 48–57. doi:10.1063/1.1724507
Gjerloev, J. W. (2012). The SuperMAG Data Processing Technique. J. Geophys. Res. 117, a–n. doi:10.1029/2012JA017683
Gustafsson, G., André, M., Carozzi, T., Eriksson, A. I., Fälthammar, C.-G., Grard, R., et al. (2001). First Results of Electric Field and Density Observations by Cluster EFW Based on Initial Months of Operation. Ann. Geophys. 19, 1219–1240. doi:10.5194/angeo-19-1219-2001
Hahnloser, R. H. R., Sarpeshkar, R., Mahowald, M. A., Douglas, R. J., and Seung, H. S. (2000). Digital Selection and Analogue Amplification Coexist in a Cortex-Inspired Silicon Circuit. Nature 405, 947–951. doi:10.1038/35016072
Hender, T. C., Wesley, J. C., Bialek, J., Bondeson, A., Boozer, A. H., Buttery, R. J., et al. (2007). Chapter 3: MHD Stability, Operational Limits and Disruptions. Nucl. Fusion 47, S128–S202. doi:10.1088/0029-5515/47/6/s03
Hinton, G. E., and Salakhutdinov, R. R. (2006). Reducing the Dimensionality of Data with Neural Networks. Science 313, 504–507. doi:10.1126/science.1127647
Hughes, W. J. (1995). “The Magnetopause, Magnetotail, and Magnetic Reconnection,” in Introduction to Space Physics. Editors M. G. Kivelson,, and C. T. Russell (Cambridge: Cambridge University Press). chap. 9. 227–288. doi:10.1017/9781139878296.010
Hwang, K.-J., Goldstein, M. L., Wendel, D. E., Fazakerley, A. N., and Gurgiolo, C. (2013). Cluster Observations Near Reconnection X Lines in Earth's Magnetotail Current Sheet. J. Geophys. Res. Space Phys. 118, 4199–4209. doi:10.1002/jgra.50403
Ishizawa, A., and Nakajima, N. (2010). Turbulence Driven Magnetic Reconnection Causing Long-Wavelength Magnetic Islands. Phys. Plasmas 17, 072308. doi:10.1063/1.3463435
Johnstone, A. D., Alsop, C., Burge, S., Carter, P. J., Coates, A. J., Coker, A. J., et al. (1997). Peace: A Plasma Electron and Current Experiment. Dordrecht, Netherlands: Springer, 351–398. doi:10.1007/978-94-011-5666-0_13Peace: A Plasma Electron and Current Experiment
Karimabadi, H., Huba, J. D., Krauss-Varban, D., and Omidi, N. (2004). On the Generation and Structure of the Quadrupole Magnetic Field in the Reconnection Process: Comparative Simulation Study. Geophys. Res. Lett. 31, a–n. doi:10.1029/2004GL019553
Kube, R., Bianchi, F. M., Brunner, D., and LaBombard, B. (2019). Outlier Classification Using Autoencoders: Application for Fluctuation Driven Flows in Fusion Plasmas. Rev. Sci. Instrum. 90, 013505. doi:10.1063/1.5049519
Laakso, H., Perry, C., McCaffrey, S., Herment, D., Allen, A. J., Harvey, C. C., et al. (2010). “Cluster Active Archive: Overview,” in The Cluster Active Archive. Editors H. Laakso, M. Taylor, and C. P. Escoubet (Netherlands: Springer), 3–37. doi:10.1007/978-90-481-3499-1_1
Landi, S., Zanna, L. D., Papini, E., Pucci, F., and Velli, M. (2015). Resistive Magnetohydrodynamics Simulations of the Ideal Tearing Mode. ApJ 806, 131. doi:10.1088/0004-637x/806/1/131
Liu, Y. H., Birn, J., Daughton, W., Hesse, M., and Schindler, K. (2014). Onset of Reconnection in the Near Magnetotail: Pic Simulations. J. Geophys. Res. Space Phys. 119, 9773–9789. doi:10.1002/2014JA020492
Lu, S., Angelopoulos, V., Artemyev, A. V., Pritchett, P. L., Liu, J., Runov, A., et al. (2019). Turbulence and Particle Acceleration in Collisionless Magnetic Reconnection: Effects of Temperature Inhomogeneity across Pre-reconnection Current Sheet. ApJ 878, 109. doi:10.3847/1538-4357/ab1f6b
Markidis, S., Henri, P., Lapenta, G., Divin, A., Goldman, M. V., Newman, D., et al. (2012). Collisionless Magnetic Reconnection in a Plasmoid Chain. Nonlin. Process. Geophys. 19, 145–153. doi:10.5194/npg-19-145-2012
Matthews, J. H., Bell, A. R., and Blundell, K. M. (2020). Particle Acceleration in Astrophysical Jets. New Astron. Rev. 89, 101543. doi:10.1016/j.newar.2020.101543
Nagai, T., Shinohara, I., Fujimoto, M., Hoshino, M., Saito, Y., Machida, S., et al. (2001). Geotail Observations of the Hall Current System: Evidence of Magnetic Reconnection in the Magnetotail. J. Geophys. Res. 106, 25929–25949. doi:10.1029/2001JA900038
Øieroset, M., Phan, T. D., Fujimoto, M., Lin, R. P., and Lepping, R. P. (2001). In Situ detection of Collisionless Reconnection in the Earth's Magnetotail. Nature 412, 414–417. doi:10.1038/35086520
Pellat, R., Coroniti, F. V., and Pritchett, P. L. (1991). Does Ion Tearing Exist? Geophys. Res. Lett. 18, 143–146. doi:10.1029/91GL00123
Perri, S., Valentini, F., Sorriso-Valvo, L., Reda, A., and Malara, F. (2017). On the Estimation of the Current Density in Space Plasmas: Multi- versus Single-point Techniques. Planet. Space Sci. 140, 6–10. doi:10.1016/j.pss.2017.03.008
Pucci, F., Singh, K. A. P., Tenerani, A., and Velli, M. (2020). Tearing Modes in Partially Ionized Astrophysical Plasma. ApJL 903, L19. doi:10.3847/2041-8213/abc0e7
Rème, H., Aoustin, C., Bosqued, J. M., Dandouras, I., Lavraud, B., Sauvaud, J. A., et al. (2001). First Multispacecraft Ion Measurements in and Near the Earth’s Magnetosphere with the Identical Cluster Ion Spectrometry (CIS) Experiment. Ann. Geophys. 19, 1303–1354.
Saito, M. (2015). THEMIS Two‐point Measurements of the Cross‐tail Current Density: A Thick Bifurcated Current Sheet in the near‐Earth Plasma Sheet. J. Geophys. Res. Space Phys. 120, 6258–6275. doi:10.1002/2015JA021142
Sakurada, M., and Yairi, T. (2014). “Anomaly Detection Using Autoencoders with Nonlinear Dimensionality Reduction,” in Proceedings of the MLSDA 2014 2nd Workshop on Machine Learning for Sensory Data Analysis (Gold Coast: Association for Computing Machinery), 4–11. doi:10.1145/2689746.2689747
Schindler, K., Pfirsch, D., and Wobig, H. (1973). Stability of Two-Dimensional Collision-free Plasmas. Plasma Phys. 15, 1165–1184. doi:10.1088/0032-1028/15/12/001
Sergeev, V. A., Tanskanen, P., Mursula, K., Korth, A., and Elphic, R. C. (1988). Current Sheet Thickness in the Near-Earth Plasma Sheet during Substorm Growth Phase as Inferred from Simultaneous Magnetotail and Ground-Based Observations. Adv. Space Res. 8, 125–128. doi:10.1016/0273-1177(88)90121-4
Sergeev, V., Runov, A., Baumjohann, W., Nakamura, R., Zhang, T. L., Volwerk, M., et al. (2003). Current Sheet Flapping Motion and Structure Observed by Cluster. Geophys. Res. Lett. 30, 1327. doi:10.1029/2002GL016500
Sharma, A. S., and Curtis, S. A. (2005). Magnetospheric Multiscale Mission. Netherlands: Springer, 179–195. doi:10.1007/1-4020-3109-2_8Magnetospheric Multiscale Mission
Shi, Y., Lee, L. C., and Fu, Z. F. (1987). A Study of Tearing Instability in the Presence of a Pressure Anisotropy. J. Geophys. Res. 92, 12171–12179. doi:10.1029/JA092iA11p12171
Sitnov, M., Birn, J., Ferdousi, B., Gordeev, E., Khotyaintsev, Y., Merkin, V., et al. (2019). Explosive Magnetotail Activity. Space Sci. Rev. 215. doi:10.1007/s11214-019-0599-5
Sonnerup, B., and Scheible, M. (1998). “Analysis Methods for Multi-Spacecraft Data,” in ISSI Scientific Report (Bern).
Tallarida, R. J., and Murray, R. B. (1987). Chi-Square Test. New York, NY: Springer, 140–142. doi:10.1007/978-1-4612-4974-0_43
Thompson, S., Kivelson, M., Khurana, K., McPherron, R., Weygand, J., Balogh, A., et al. (2005). Dynamic Harris Current Sheet Thickness from Cluster Current Density and Plasma Measurements. J. Geophys. Res. Space Phys. 110. doi:10.1029/2004ja010714
Walker, J., Boldyrev, S., and Loureiro, N. F. (2018). Influence of Tearing Instability on Magnetohydrodynamic Turbulence. Phys. Rev. E 98, 033209. doi:10.1103/PhysRevE.98.033209
Walker, M. L., De Vries, P., Felici, F., and Schuster, E. (2020). “Introduction to Tokamak Plasma Control,” in 2020 American Control Conference (Denver: ACC), 2901–2918. doi:10.23919/ACC45564.2020.9147561
Wang, S., Lee, L. C., and Wei, C. Q. (1988). Streaming Tearing Instability in the Current Sheet with a Super-alfvénic Flow. Phys. Fluids 31, 1544–1548. doi:10.1063/1.866693
Zanna, L. D., Landi, S., Papini, E., Pucci, F., and Velli, M. (2016). Theidealtearing Mode: Theory and Resistive MHD Simulations. J. Phys. Conf. Ser. 719, 012016. doi:10.1088/1742-6596/719/1/012016
Zeiler, A., Biskamp, D., Drake, J. F., Rogers, B. N., Shay, M. A., Swisdak, M., et al. (2001). “Three-dimensional Particle Simulations of Collisionless Magnetic Reconnection,” in APS Division of Plasma Physics Meeting Abstracts (Long Beach) vol. 43 of APS Meeting Abstracts.
Zweibel, E. G., and Yamada, M. (2009). Magnetic Reconnection in Astrophysical and Laboratory Plasmas. Annu. Rev. Astron. Astrophys. 47, 291–332. doi:10.1146/annurev-astro-082708-101726
Appendix A: Current Sheet Width and Alfvén Speed Calculation
To calculate the current sheet width, a (where a = 2LN), we use the following equation (Thompson et al., 2005):
where B0 is the lobe magnetic field strength, obtained from Bakrania et al. (2020), BL is the local magnetic field in the L direction (depending on the coordinate system), and JM is the local current density in the M direction. We obtain the current density using multi-spacecraft measurements from (Dunlop et al., 1988; Perri et al., 2017):
where i, j, k represent the C1, C3, and C4 spacecraft respectively. Jijk and Bijk are the local current density and magnetic field. For our 07/08/2004 event, we estimate a current sheet width of 0.78 RE, corresponding to 1.2 ion gyroradii. The gyroradius is calculated as:
where mi is the ion mass, q is the ion charge, v⊥ is the perpendicular ion velocity, and B is the total magnetic field strength at the time of the tearing distribution. For our 07/08/2004 event, v⊥ = 238 km/s and B = 0.6 nT.
The local Alfvén speed is calculated as (Landi et al., 2015):
where BL is the L-component of the background magnetic field and ρ0 is the plasma mass density. The magnetic field and ion density used for calculating the Alfvén speed (Eq. 8) are obtained by averaging the measurements across all Cluster spacecraft when they were outside the current sheet, which we determine to be at spacecraft times least 1 min before or after a current sheet crossing, and within ∼30 min of the tearing event. With an average background number density and BL field of 0.14 cm−3 and 13.1 nT respectively and assuming that the plasma sheet is comprised of protons, we calculate an Alfvén speed of 7.6 × 10⁵ m/s for our case study event. This corresponds to an Alfvén time of 6.5 s.
Keywords: space plasma environments, magnetic reconnection, tearing instability, neural network techniques, outlier detection
Citation: Bakrania MR, Rae IJ, Walsh AP, Verscharen D, Smith AW, Forsyth C and Tenerani A (2022) Direct Evidence of Magnetic Reconnection Onset via the Tearing Instability. Front. Astron. Space Sci. 9:869491. doi: 10.3389/fspas.2022.869491
Received: 04 February 2022; Accepted: 23 June 2022;
Published: 14 July 2022.
Edited by:
David Ruffolo, Mahidol University, ThailandReviewed by:
Peera Pongkitiwanichakul, Kasetsart University, ThailandAnatoli Petrukovich, Space Research Institute (RAS), Russia
Copyright © 2022 Bakrania, Rae, Walsh, Verscharen, Smith, Forsyth and Tenerani. This is an open-access article distributed under the terms of the Creative Commons Attribution License (CC BY). The use, distribution or reproduction in other forums is permitted, provided the original author(s) and the copyright owner(s) are credited and that the original publication in this journal is cited, in accordance with accepted academic practice. No use, distribution or reproduction is permitted which does not comply with these terms.
*Correspondence: Mayur R. Bakrania , mayur.bakrania@ucl.ac.uk