Number of Childbearing Partners, Status, and the Fertility of Men and Women in the U.S.
 Rosemary L. Hopcroft
- Sociology, University of North Carolina, Charlotte, NC, United States
Theory from evolutionary biology suggests that status and access to resources will influence the number of mating partners somewhat differently for men and women, yet little previous research has examined the relationship between status and number of childbearing partners for men and women in the U.S. This paper uses newly available data on a large probability sample of the U.S. population (the Survey of Income and Program Participation) to evaluate the relationship between the number of childbearing partners, socioeconomic status, and subsequent fertility for men and women in the U.S. Results show that education (net of income and net worth) is always negatively related to the number of childbearing unions and fertility for both men and women. For men, personal income and personal net worth are positive predictors of both number of childbearing partners and fertility, while for women personal income and personal net worth are negative predictors of number of childbearing partners and fertility. For men, the positive effect of income on number of childbearing partners is because low income men are more likely to have no childbearing partners at all and not because high income men are more likely to have multiple partners. Men with a higher net worth do have more childbearing partners than other men, all else being equal. Both men and women who have a larger number of childbearing partners do have more children, all else being equal, although this effect is stronger for men than for women. Of those with multiple childbearing unions, men and women with both very high and very low incomes have more children than those with middle incomes.
Introduction
Theory from evolutionary biology and evolutionary psychology predicts that resource-rich men will be more attractive as mates for women, and that resources will be less important for women in attracting mates, although the extent of these associations will vary across environmental contexts (Bateman, 1948; Trivers, 1972; Gowaty, 2004; Kokko and Jennions, 2012). Survey research on male and female preferences across a large variety of cultures has confirmed this sex difference in preference, with women preferring spouses with good financial prospects more than men (Buss, 1989; Wiederman and Allgeier, 1992; Buss et al., 2001; Henry et al., 2013). As expected, the strength of this preference varies across national context (Buss et al., 1990) and is related to other national characteristics. For example, the sex difference in preference for good earning capacity in a mate has been shown to be smaller in more gender equitable societies (Eagly and Wood, 1999).
In the U.S., research shows that women not only prefer spouses with good financial prospects, they are also more likely to marry men with access to resources through employment (Oppenheimer, 2000; McHale et al., 2016) and are less likely to divorce them (Sayer and Bianchi, 2000; Killewald, 2016). Research from the U.S. and a variety of other developed societies shows that for men personal income is positively associated with fertility, thus showing that for men earnings from employment are associated not just with marriage but also with fatherhood, whether within or outside of marriage (Hopcroft, 2006, 2015; Fieder and Huber, 2007; Nettle and Pollet, 2008; Goodman and Koupil, 2010; Lappegård and Rønsen, 2013; Stulp et al., 2016; Nisén et al., 2017). In some European countries, it is not just earnings that are positively associated with fertility for men, but also education (Lappegård and Rønsen, 2013; Nisén et al., 2017). Previous research has shown that the primary reason for the positive relationship between socioeconomic status and fertility for men is that low status men are more likely than other men to remain childless (Fieder and Huber, 2007, 2012; Fieder et al., 2011; Barthold et al., 2012; Goodman et al., 2012; Hopcroft, 2015).
Given the attractiveness of high status men on mating markets coupled with serial monogamy, it may also be true that men with higher socioeconomic status achieve higher fertility by having children with more than one partner. Prior research from the U.S. (Jokela et al., 2010; Guzzo, 2014) and other countries shows that being part of multiple childbearing unions is positively associated with number of children for both men and women (Forsberg and Tullberg, 1995; Bereczkei and Csanaky, 1996). Yet previous research suggests that having children with multiple partners is more common among disadvantaged men and women in the U.S. (Guzzo and Furstenberg, 2007; Guzzo, 2014). For example, Guzzo and Furstenberg (2007) found that over one-third of non-Hispanic black men report having children by multiple partners, and they found the prevalence of multi-partnered fertility to be almost twice as high among poor as among non-poor men. They did not, however, look at the resulting fertility of these additional unions. In Norway, Lappegård and Rønsen (2013) found that additional births with new partners were more common among both educationally advantaged and disadvantaged men, despite the fact that having children with more than one person is more common among disadvantaged men (Lappegård et al., 2011). That is, while having multiple childbearing partners is more common among more disadvantaged men in Norway, advantaged men who do have multiple partners do have more children than other men. It may be this same pattern applies in the U.S. for both men and women, but there has been hitherto no research on this issue.
This study uses new data from the U.S. census that includes complete information on the number of partners with which a person has had children to examine how socioeconomic status measured as personal income, personal net worth, and education influences the number of childbearing unions for men and women. Also examined is how the number of childbearing unions influences subsequent fertility and how this varies by socioeconomic status.
2014 SIPP Data
The Survey of Income and Program Participation (SIPP) sample universe is the civilian, noninstitutionalized population of the United States. The sampling universe is based on addresses from multiple sources, chiefly the 2010 Decennial Census, and contains approximately 304.4 million individuals. SIPP sampled housing units from the current Master Address File (MAF), which is maintained by the U.S. Census Bureau and is the source of addresses for the American Community Survey, other demographic surveys, and the decennial census. The MAF is updated using the U.S. Postal Service's Delivery Sequence File and various automated, clerical, and field operations.
The 2014 SIPP sample is a multistage stratified sample of 53,070 housing units from 820 sample areas designed to represent the civilian, noninstitutionalized population of the U.S.
The Census Bureau employs a two-stage sample design to select the SIPP sample. The two stages are (1) selection of primary sampling units (PSUs) and (2) selection of addresses within sample PSUs. Information on all individuals in the sampled households over the age of 15 were collected between February and June 2014, resulting in 67, 994 personal interviews and a response rate of 70.19%. In addition to personal interviews, there are proxy interviews where respondents give information on all individuals over the age of 15 who were not present at the time of the interview. The SIPP data can be found at the Census website, https://www.census.gov/programs-surveys/sipp/data/2014-panel/wave-1.html.
The analysis presented here only uses data on respondents aged 18 and over. The individual person weightings designed by the Census included in the analysis (see below) adjust for the lack of independence between cases because of the clustering in households and allow for the analysis of the data as a representative, probability sample of adults in the U.S.
Variables
The SIPP data contains a wealth of information on the financial situation of all individuals in the sampled households, including income received from all sources including government programs. It also includes information on the number of biological children and the number of childbearing unions of both male and female respondents.
Total children ever born
Number of biological children ever born to the respondent or ever fathered by the respondent.
Total Personal Income (in $1000s)
The sum of reported monthly earnings and income amounts received by an individual from all sources (jobs, businesses, rental property, investments, annuities, trust funds, government programs, alimony, etc.) during the previous year. This is a variable constructed and top-coded by the Census with a ceiling value for privacy reasons. Top coding means that values at the top of the distribution for the variable are replaced by the mean or median of that variable. Because this variable includes business and investment income and loss, it can be negative. For this reason this variable and the net worth variable (below) cannot be logged.
Person-Level Net Worth
This is the value of all assets (bank accounts, retirement accounts, annuities, trusts, property, businesses, stocks and bonds, mutual funds etc.) held by the individual minus that person's debts, so an individual's total net worth can be negative. This is a variable constructed by the Census and top-coded with a ceiling value.
Education in years
Is the respondent's number of years of education, coded as actual number of years.
Number of childbearing unions (Coded 0 = none, 1 = one, 2 = two, 3 = three or more)
Sex (1 = male, 0 = Female)
Control variables for the analysis were Black (1 = black, 0 = non-black), and Age (Respondent's age in years).
Race (measured as black vs. non-black) was controlled for because previous research shows important differences in multi-partner fertility between blacks and non-blacks in the U.S. (Guzzo and Furstenberg, 2007). Hence, it is important to control for race when examining both number of childbearing unions and the effect of multiple partners on number of children. It is important to control for age in a cross sectional analysis such as this, because older individuals have more children than younger individuals.
All variables in each model were tested for multi-collinearity and none had a Variance Inflation Factor >2 or a Condition Index >16 (all well below the recommended limits of VIF of 5 and Condition indexes of 30–see Belsley, 1982; Craney and surles, 2002).
For the variables used in this analysis, the Census Bureau handles missing values either by inferring values based on other information provided by the respondent, or by imputing values for missing values. Information on the imputation techniques used may be found on the SIPP website (https://www.census.gov/programs-surveys/sipp/data.html).
Methods
Data were analyzed using general linear regression methods for stratified samples using SAS 9.4.
While Poisson regression is typically preferred for analysis of count data such as number of childbearing unions and number of offspring, this was not possible in this case given the complex stratified sampling structure of the SIPP (see below). Simply put, the SAS software necessary to analyze this complex sample structure and allow for accurate estimation of variances does not allow for the option of Poisson regression.
An inspection of the residual plots and the Kolmogorov-Smirnov test of normality of residuals (suitable for when there are over 2000 cases as is the case here) show that while the relationship is linear, there are violations of the normality of errors and homoscedasticity assumptions in this data set. Normally this would call for use of other techniques, but given a large data set linear regression has been shown to perform well even when these assumptions of normality and homoscedasticity are violated, while the value of alternative techniques is less clear (Lumley et al., 2002; Sainani, 2012). The data set used here has over 600,000 cases.
The basic model estimated here is as follows:
In the models for Table 3, Ŷ refers to the predicted number of childbearing unions, in the models for Tables 4, 5 Ŷ refers to the predicted number of biological children. All models were estimated for males and females separately. To evaluate significant differences between men and women in the effects of all variables, terms for the interaction of each variable with sex were included in the model and the model was estimated for all cases.
Following recommendations by the Census for the sample structure of the SIPP (see https://www.census.gov/content/dam/Census/programs-surveys/sipp/methodology/2014-SIPP-Panel-Users-Guide.pdf) (see also Rust and Rao, 1996), Fay's modified balanced repeated replication (BRR) method was used for estimating variances in the regression models and for all statistics. Balanced repeated replication methods are used for estimating the variance of a statistic obtained by stratified sampling. The difference between the basic BRR method and Fay's method is that the BRR method uses replicate factors of 0 and 2, whereas Fay's method uses one factor, k, which is in the range (0, 1), with the other factor equal to 2–k. In Fay's method, the introduction of the perturbation factor (1–k) allows the use of both halves of the sample. Thus, Fay's method has the advantage that no subset of the sample units in a particular classification will be totally excluded. The variance formula for Fay's method is:
where
The 2014 panel uses 240 replicate weights. All replicate weights are calculated based on a perturbation factor of 0.5 (k = 0.5). Replicate weights were computed by the Census and are available on the data website.
In addition to the replicate weights, the Census provides individual person weights for use in analyses such as this one (with the person as the unit of analysis) to create unbiased estimates of variances, and these were also included in all analyses.
Results
Table 1 gives means and standard errors for all variables. Table 2 gives zero order correlations for all variables.
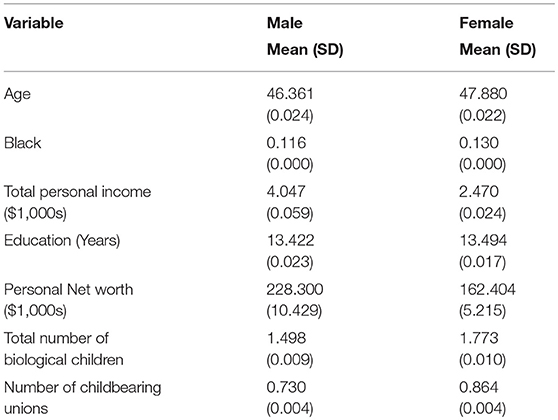
Table 1. Means and standard errors, all variables.
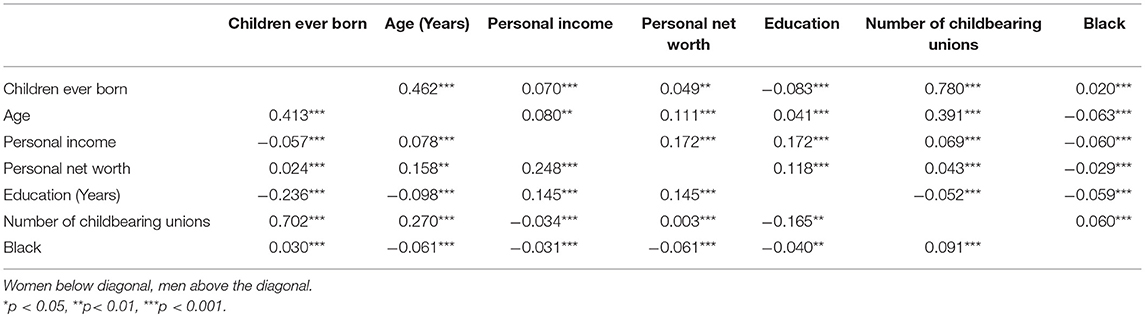
Table 2. Pearson correlation coefficients all cases, all variables.
Table 3 gives the analysis of number of childbearing unions men and women. Models 1 through 3 give the results for all men and women, Models 4 through 6 give the results for only men and women with at least one childbearing partner.
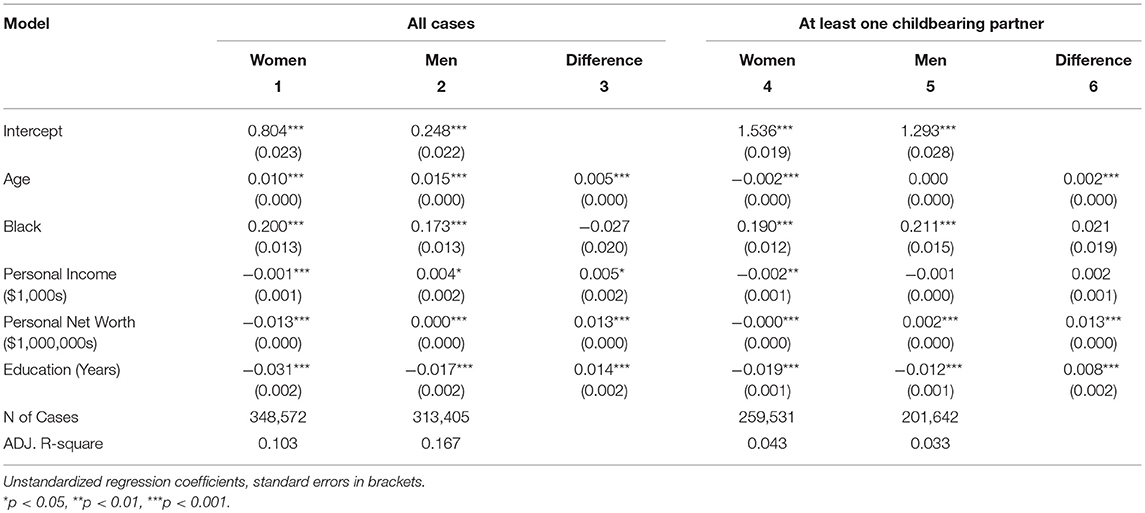
Table 3. Number of childbearing unions by income, net worth, and education.
Models 1 through 3 show that for all men and women, age, race, personal income, personal net worth and years of education are significant predictors of the number of childbearing unions, although the effects of income and personal net worth are opposite for men and women. For women, personal income has a negative effect on number of childbearing unions, for men, personal income has a positive effect on number of childbearing unions, and the sex difference is significant. For women personal net worth has a negative effect on number of childbearing unions, while for men personal net worth has a positive effect on number of childbearing unions, and the sex difference is significant. For both men and women age and being black are positively associated with number of childbearing unions, all else being equal, although the positive effect of age is significantly larger for men than for women. For both men and women years of education has a negative effect on number of childbearing unions, all else being equal, but the effect is significantly larger for women than for men.
These results suggest that men with higher incomes and higher net worth have more childbearing unions than other men, while women with higher incomes and higher net worth have fewer childbearing unions than other women. Education is negatively associated with number of childbearing unions for both men and women, with a larger effect size for women.
Models 4 through 6 in Table 3 include only those individuals with children with at least one childbearing partner. For both men and women with at least one child, race, personal net worth and years of education are significant predictors of number of childbearing unions, although the effects of personal net worth are opposite for men and women. The effect of personal net worth on number of childbearing unions for men is positive, the effect for women is negative, and the sex difference is significant. Of men with at least one childbearing partner, income is no longer significantly associated with number of childbearing unions. Of women with at least one childbearing partner, the effect of income remains a negative predictor of number of childbearing unions. For both men and women years of education have a negative effect on number of childbearing unions but the effect is significantly larger for women than for men.
These results suggest that the positive effect of personal income on number of childbearing partners for men seen in Model 2 is primarily due to the fact that men with low personal incomes are more likely to have no childbearing partners than other men, that is, they are more likely to be childless. Of men with at least one childbearing partner, personal income is not positively associated with number of childbearing partners. However, childlessness does not account for the positive effect of personal net worth on number of childbearing unions for men. These results suggest that men with higher personal net worth do have a greater number of childbearing unions than men with lower personal net worth, on average.
Given that more childbearing partners likely mean more children, the relationship between number of children ever born and number of childbearing partners is examined in Table 4. To examine the effect of the number of childbearing unions on fertility independent of childlessness, this analysis is only for individuals who have at least one child. So as to evaluate the contribution of number of childbearing partners to resulting fertility, Models 1 through 3 of Table 4 give the basic model, while Models 3 through 4 add the variable number of childbearing unions. Model 1 shows that for women, education, personal income and personal net worth are negative predictors of number of children. Model 2 shows that for men, education is a negative predictor of number of children, but personal net worth and personal income are positively associated with number of children. In these models race is positively associated with number of children for both men and women.
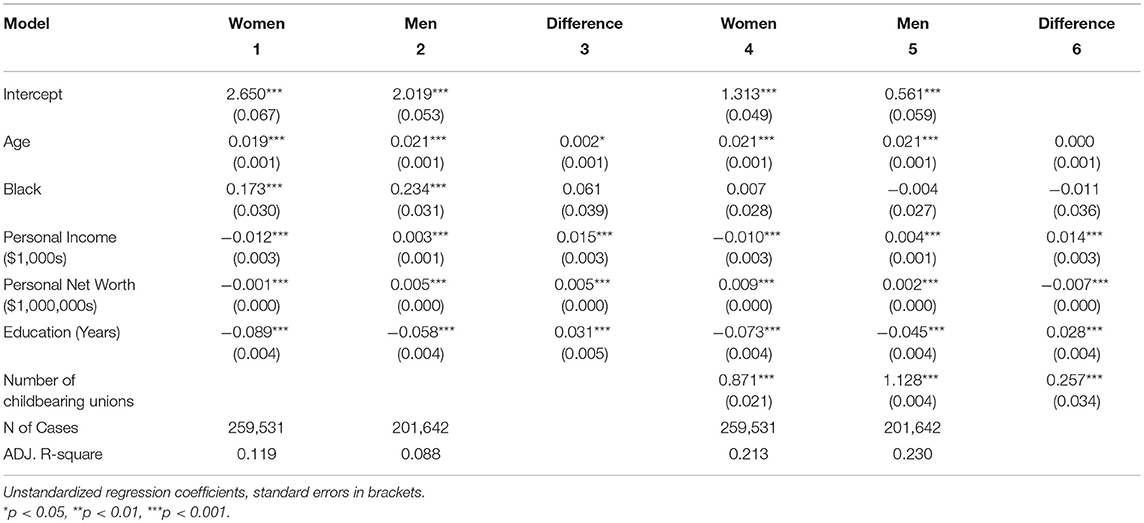
Table 4. Total number of children ever born by income, net worth, education, and number of childbearing unions (only those with at least one childbearing partner).
Models 4 through 6 includes the variable number of childbearing unions. For both men and women who have children, number of childbearing unions is positively associated with number of children ever born, although the effect is significantly larger for men than for women. Personal income is negatively associated with number of children ever born for women, but positively associated with number of children ever born for men, and the sex difference is significant. Personal net worth is positively associated with number of children ever born for both women and men, but the effect is significantly larger for women. This means that the effect of personal net worth changed from being a negative predictor of number of children for women (in Model 1) to a positive predictor when number of childbearing unions is controlled (in Model 4). This is because personal net worth is negatively associated with number of childbearing unions for women and so negatively affects fertility, as seen in Table 3. When number of childbearing unions is controlled, the effect of personal net worth on number of children for women becomes positive. Education is negatively associated with number of children ever born, but the effect is significantly larger for women than for men. For both men and women, age is positively associated with number of children ever born, all else being equal. Race is not a significant determinant of number of children for men and women in this model. Including number of childbearing unions as a predictor in these models improves the explained variance quite dramatically—for women by about 79% and about 161% for men—showing that number of childbearing partners is an important predictor of number of children for both men and women but for men more so than women.
In sum, these results suggest that men with higher incomes and higher net worth (but not more education) have more childbearing partners than other men, on average. For men the effect of personal income on number of childbearing unions is primarily due to low income men having zero childbearing unions. Women with higher incomes, higher net worth and more education have fewer childbearing unions than other women. For those individuals who have at least one child, a greater number of childbearing unions means a greater number of children for both men and women, but the effect is significantly smaller for women than it is for men. The number of childbearing unions is an important predictor of total number of children for both men and women, but much more so for men than for women.
To further examine sex differences in the effect of number of childbearing unions on fertility, Table 5 shows the effect of income alone on number of children for those women and men with children with just one childbearing partner and the effect of income alone on number of children for women and men with more than one childbearing partner. All these models are only for men and women with at least one child. A squared term is also included to capture any non-linear effects of income on fertility, as Lappegård and Rønsen (2013) found non-linear effects in the relationship between status and the probability of an additional birth for those with multipartner fertility using Norwegian data.
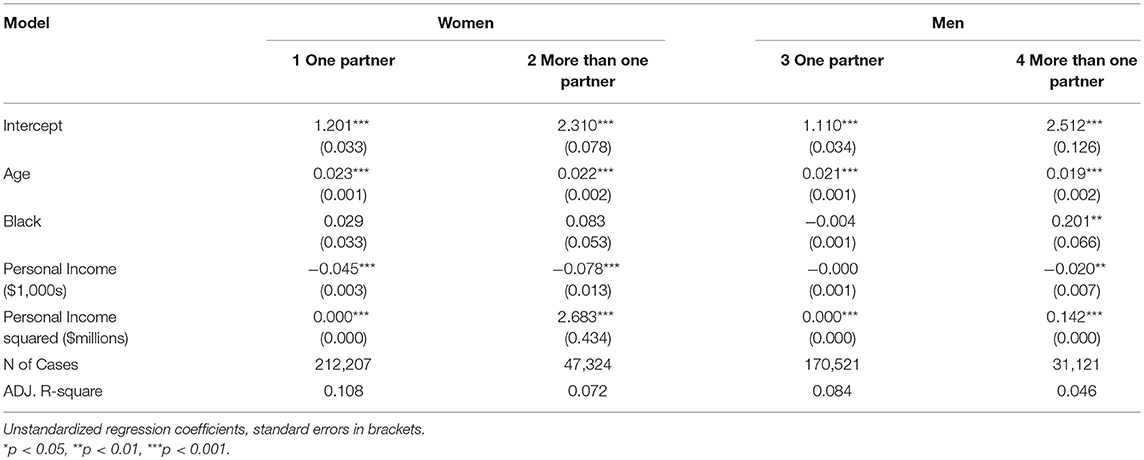
Table 5. Total number of children ever born, by income and income-squared, only those with at least one childbearing partner.
Model 1 in Table 5 shows the results for women with just one childbearing partner. For women with one partner, income has a significant negative effect on number of children. The positive and significant effect for the squared term shows that there is a slight curvilinear up effect of income on number of children for women (depicted graphically in Figure 1). Model 2 shows the results for women with more than one childbearing partner. For women with more than one partner, personal income continues to have a negative effect on number of children. The positive and significant effect for the squared term shows that income has a pronounced u-shaped effect on number of children for women with more than one childbearing partner (see also Figure 1). This shows that both low and high income women with multiple partners have more children than middle income women with multiple partners.
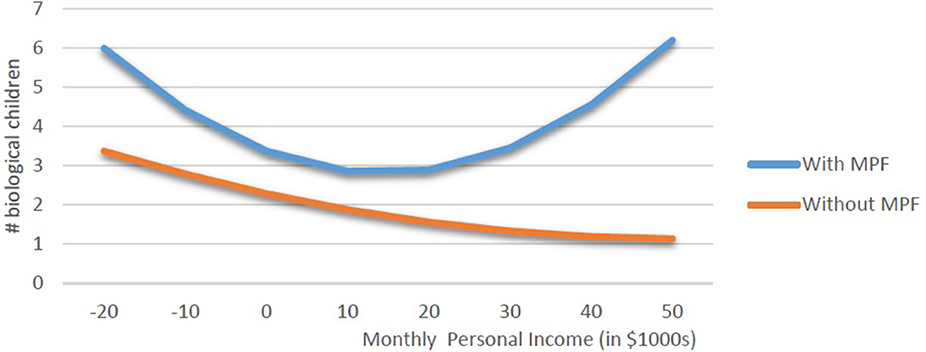
Figure 1. Biological children, women with and without multipartner fertility.
Model 3 in Table 5 shows the results for men with one childbearing partner. For men with one partner, in this model income by itself is not significantly related to number of children, although the squared term for income is positive and significant showing a slight curvilinear up effect (this is depicted graphically in Figure 2). Model 4 shows the results for men with more than one childbearing partner. For men with more than one partner, income has a negative effect on number of children but the effect is u-shaped as the square term is positive and significant (see also Figure 2). This shows that both low and high income men with multiple partners have more children than middle income men with multiple partners, a finding similar to Lappegård and Rønsen (2013) using Norwegian data and education as the measure of status. The scale of the graph for men for personal income is larger in this graph because in this data average personal income for men is higher than it is for women, and the range on personal income is much larger for men than it is for women.
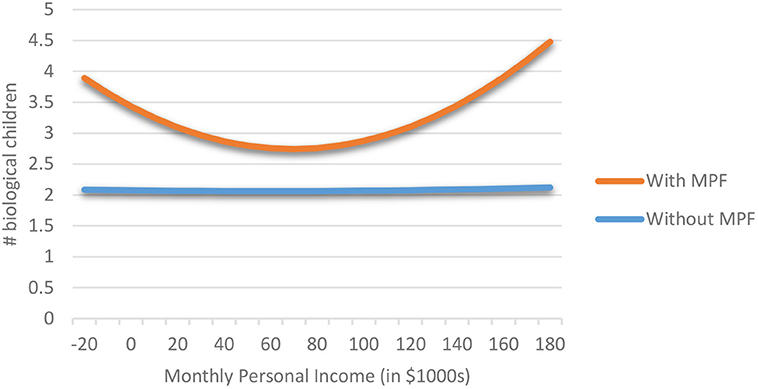
Figure 2. Biological children, men with and without multipartner fertility.
Discussion
For men, this analysis shows that men with both higher income and higher personal net worth have a greater number of childbearing partners on average, while women with higher income and higher personal net worth have fewer childbearing partners on average. For men, the positive effect of income (net of net worth) on number of childbearing partners is largely due to low income men having no childbearing partners at all. For men who have at least one childbearing union, income is not positively associated with number of childbearing partners. However, for men the positive effect of net worth on number of childbearing unions is not due to childlessness among men with low net worth. Men with higher personal net worth have more childbearing unions than less wealthy men, all else being equal. For women, the negative effect of income and personal net worth on number of childbearing partners is not because high income/high net worth women are more likely to remain childless.
As previous studies have shown, those men and women with more childbearing partners do have more children, all else being equal, although this effect is much stronger for men than for women (Forsberg and Tullberg, 1995; Bereczkei and Csanaky, 1996; Jokela et al., 2010; Guzzo, 2014). For both men and women the effect of having children with more than one partner on subsequent fertility depends on income. Of those individuals who have children with more than one person, both low and high income men and women have more children than middle income men and women, as Lappegård and Rønsen (2013) found for low and high educated men in Norway. This is not true of men and women who have children with only one partner. High income men who have children with only one partner have more children than low income men who have children with only one partner. High income women who have children with only one partner have fewer children than low income women with only one partner.
This finding of a differential relationship between income and number of children for those with multiple childbearing partners, such that low income and high income men and women with multiple partners have more children than middle income men and women with multiple partners may be explained by parental concerns with investment in children and is also consistent with theory from evolutionary biology. For low income men and women with little to invest in children, limiting numbers of children will not noticeably improve investments per child. For high income men and women, with more plentiful resources and consequently more to invest, it is less necessary to limit the number of children to maintain a high level of investment per child. For middle income individuals, however, with some access to resources, limiting the number of children can help ensure that each child receives a minimum level of parental investment. Such strategic family planning is also in line with predictions from evolutionary biology, which predicts that investments in offspring will be shaped by the environment, including the social environment, of the individual (Trivers, 1972; Trivers and Willard, 1973; Van den Berghe and Whitmeyer, 1990; Gowaty, 2004).
Unlike personal income and personal net worth, education is uniformly negatively associated with both number of childbearing unions and number of children for both men and women. This is consistent with findings from previous studies of the relationship between education and number of children in the U.S. (Hopcroft, 2006, 2015; Huber et al., 2010). This is unlike in Norway where education is positively associated with the probability of first and subsequent births for men (Lappegård and Rønsen, 2013) and shows that societal context shapes the nature of the relationship between status and fertility for men and women as evolutionary theory predicts. In the U.S., access to resources via personal income and net worth, not education, is particularly related to the fertility of men and women in the contemporary U.S.
Conclusion
The finding that status as measured by personal income and wealth is positively associated with the number of childbearing unions and subsequent number of offspring for men while it is negatively associated with the number of childbearing unions and number of offspring for women, supports the hypothesis from evolutionary biology that status is more important for male mating than female mating (Bateman, 1948; Trivers, 1972; Gowaty, 2004). Also consistent with theory from evolutionary biology is the finding that the number of childbearing partners is a more important predictor of fertility for men than it is for women.
Having children with multiple partners is one route by which men with higher net worth have higher fertility than men with lower net worth. However, having children with multiple partners is not the primary reason why high income men have higher fertility than low income men. As we have seen high income men are not more likely to have children with additional partners than low income men. More important in explaining the higher fertility of high income men is the fact that low income men remain childless and that high income men have more children with a single partner than low income men.
One reason why women with higher incomes and higher personal net worth have lower fertility than other women is because women with higher personal incomes and personal net worth have fewer childbearing unions on average than low income women. This is not because high income/high net worth women are more likely to remain childless. Higher income/higher net worth women also have lower fertility because they tend to have fewer children with a single partner than low income women. Higher income women with multiple childbearing partners do have more children than middle income women with multiple partners, but this is not enough to reverse the overall negative effect of income on fertility for women.
This paper is a cross sectional analysis, and like all cross sectional analyses, does not capture longitudinal dynamics that are likely important in the relationship between social status, number of childbearing unions, and resulting fertility (Stulp and Barrett, 2016; Stulp et al., 2016). Yet a cross sectional analysis is a first step in examining the relationship between number of childbearing partners, status, and fertility, and all that is possible given this data from first wave of the 2014 Survey of Income and Program Participation. Subsequent waves of the study will make longitudinal analysis with this data possible. Further, any data that relies on self reports of personal income and net worth such as this one are likely to involve errors, particularly of underreporting (Moore and Welniak, 2000). However, such measurement errors are likely to be similar for males and females, so should not greatly influence the sex differences in the effects of income and net worth on number of childbearing unions and fertility reported here.
Ethics Statement
This study used publicly available, anonymous data collected by the U.S. Census.
Author Contributions
RH was responsible for the entire content of this paper.
Conflict of Interest Statement
The author declares that the research was conducted in the absence of any commercial or financial relationships that could be construed as a potential conflict of interest.
References
Barthold, J. A., Myrskyl, M., and Jones, O. R. (2012). Childlessness drives the sex difference in the association between income and reproductive success of modern Europeans. Evol. Hum. Behav. 33, 628–638. doi: 10.1016/j.evolhumbehav.2012.03.003
Belsley, D. A. (1982). Assessing the presence of harmful collinearity and other forms of weak data through a test for signal-to-noise. J. Econom. 20, 211–253.
Bereczkei, T., and Csanaky, A. (1996). Mate choice, marital success, and reproduction in a modern society. Ethol. Sociobiol. 17, 17–36.
Buss, D. M. (1989). Sex differences in human mate preferences: evolutionary hypotheses tested in 37 cultures. Behav. Brain. Sci. 12, 1–49.
Buss, D. M., Abbott, M., Angleitner, A., Asherian, A., Biaggio, A., Blanco-Villasenor, A., et al. (1990). International preferences in selecting mates: a study of 37 cultures. J. Cross Cult. Psychol. 21, 5–47.
Buss, D. M. T., Shackelford, K., Kirkpatrick, L. A., and Larsen, R. J. (2001). A half century of mate preferences: the cultural evolution of values. J. Marriage Fam. Couns. 63, 491–503. doi: 10.1111/j.1741-3737.2001.00491.x
Craney, T. A., and surles, J. G. (2002). Model-dependent variance inflation factor cutoff values. Qual. Eng. 14, 391–403. doi: 10.1081/QEN-120001878.
Eagly, A. H., and Wood, W. (1999). The origins of sex differences in human behavior: evolved dispositions versus social roles. Am. Psychol. 54, 408–423.
Fieder, M., and Huber, S. (2007). The effects of sex and childlessness on the association between status and reproductive output in modern society. Evol. Hum. Behav. 28, 392–398. doi: 10.1016/j.evolhumbehav.2007.05.004
Fieder, M., and Huber, S. (2012). An evolutionary account of status, power, and career in modern societies. Hum. Nat. 23, 191–207. doi: 10.1007/s12110-012-9139-7
Fieder, M., Huber, S., and Bookstein, F. L. (2011). Socioeconomic status, marital status and childlessness in men and women: an analysis of census data from six countries. J. Biosoc. Sci. 43, 619–635. doi: 10.1017/S002193201100023X
Forsberg, A. J. L., and Tullberg, B. S. (1995). The relationship between cumulative number of cohabiting partners and number of children for men and women in modern Sweden. Ethol. Sociobiol. 16, 221–232.
Goodman, A., and Koupil, I. (2010). The effect of school performance upon marriage and long-term reproductive success in 10,000 Swedish males and females born 1915–1929. Evol. Hum. Behav. 31, 425–435. doi: 10.1016/j.evolhumbehav.2010.06.002
Goodman, A., Koupil, I., and Lawson, D. W. (2012). Low fertility increases descendant socioeconomic position but reduces long-term fitness in a modern post-industrial society. Proc. R. Soc. Lond. B Biolog. Sci. 279, 4342–4351. doi: 10.1098/rspb.2012.1415
Gowaty, P. A. (2004). “Sex roles, contests for the control of reproduction, and sexual selection,” in Sexual Selection in Primates: New and Comparative Perspectives, eds P. M. Kappeler and C. P. van Schaik (New York, NY: Cambridge University Press), 37–54.
Guzzo, K. B. (2014). New partners, more kids multiple-partner fertility in the United States. Ann. Am. Acad. Pol. Soc. Sci. 654, 66–86. doi: 10.1177/0002716214525571
Guzzo, K. B., and Furstenberg, F. F. (2007). Multipartnered fertility among American men. Demography 44, 583–601. doi: 10.1353/dem.2007.0027
Henry, J., Helm, H. W. Jr., and Cruz, N. (2013). Mate selection: gender and generational differences. N. Am. J. Psychol. 15, 63–70.
Hopcroft, R. L. (2006). Sex, status and reproductive success in the contemporary U.S. Evol. Hum. Behav. 27, 104–120. doi: 10.1016/j.evolhumbehav.2005.07.004
Hopcroft, R. L. (2015). Sex differences in the relationship between status and number of offspring in the contemporary U.S. Evol. Hum. Behav. 36, 146–151. doi: 10.1016/j.evolhumbehav.2014.10.003
Huber, S., Bookstein, F. L., and Fieder, M. (2010). Socioeconomic status, education, and reproduction in modern women: an evolutionary perspective. Am. J. Hum. Biol. 22, 578–587. doi: 10.1002/ajhb.21048
Jokela, M., Rotkirch, A., Rickard, I. J., Pettay, J., and Lummaa, V. (2010). Serial monogamy increases reproductive success in men but not in women. Behav. Ecol. 21, 906–912. doi: 10.1093/beheco/arq078
Killewald, A. (2016). Money, work, and marital stability: assessing change in the gendered determinants of divorce. Am. Sociol. Rev. 81, 696–719. doi: 10.1177/0003122416655340
Kokko, H., and Jennions, M. D. (2012). “Sex differences in parental care,” in The Evolution of Parental Care, eds N. J. Royle, P T. Smiseth, and M. Kölliker (Oxford: Oxford University Press), 484.
Lappegård, T., and Rønsen, M. (2013). Socioeconomic differences in multipartner fertility among Norwegian men. Demography 50, 1135–1153. doi: 10.1007/s13524-012-0165-1
Lappegård, T., Rønsen, M., and Skrede, K. (2011). Fatherhood and Fertility. Fathering 9, 103–120. doi: 10.3149/fth.0901.103
Lumley, T., Diehr, P., Emerson, S., and Chen, L. (2002). The importance of the normality assumption in large public health data sets. Annu. Rev. Public Health 23, 151–169. doi: 10.1146/annurev.publhealth.23.100901.140546
McHale, S., King, V., Van Hook, J., and Booth, A. (2016). Gender and Couple Relationships, 1st Edn. Cham: Springer International Publishing.
Moore, J. C., and Welniak, E. J. (2000). Income measurement error in surveys: a review. J. Off. Stat. 16, 331.
Nettle, D., and Pollet, T. V. (2008). Natural selection on male wealth in humans. Am. Nat. 172, 658–666. doi: 10.1086/591690
Nisén, J., Martikainen, P., Myrskylä, M., and Silventoinen, K. (2017). Education, other socioeconomic characteristics across the life course, and fertility among finnish men. Eur. J. Popul. 1–30. doi: 10.1007/s10680-017-9430-8
Oppenheimer, V. K. (2000). “The continuing importance of men's economic position in marriage formation,” in The Ties that Bind: Perspectives on Marriage and Cohabitation, eds L. J. Waite (New York, NY: Aldine de Gruyter), 283–301.
Rust, K. F., and Rao, J. N. (1996). Variance estimation for complex surveys using replication techniques. Stat. Methods Med. Res. 5, 283–310. doi: 10.1177/096228029600500305
Sainani, K. L. (2012). Dealing with non-normal data. PM&R 4, 1001–1005. doi: 10.1016/j.pmrj.2012.10.013
Sayer, L. C., and Bianchi, S. M. (2000). Women's economic independence and the probability of divorce. J. Fam. Issues 21, 906–943. doi: 10.1177/019251300021007005
Stulp, G., and Barrett, L. (2016). Wealth, fertilty and adaptive behavior in industrial populations. Philos. Trans. R. Soc. 371:20150153. doi: 10.1098/rstb.2015.0153
Stulp, G., Sear, R., Schaffnit, S. B., Mills, M. C., and Barrett, L. (2016). The reproductive ecology of industrial societies part ii the association between wealth and fertility. Hum. Nat. 27,422–444. doi: 10.1007/s12110-016-9272-9
Trivers, R. (1972). Parental Investment and Sexual Selection. Cambridge, MA: Biological Laboratories, Harvard University.
Trivers, R. L., and Willard, D. E. (1973). Natural selection of parental ability to vary the sex ratio of offspring. Science 179, 90–92.
Van den Berghe, P. L., and Whitmeyer, J. (1990). Social class and reproductive success. Int. J. Contemp. Sociol. 27, 29–48.
Keywords: sex differences, fertility, evolutionary theory, SIPP data, status
Citation: Hopcroft RL (2018) Number of Childbearing Partners, Status, and the Fertility of Men and Women in the U.S. Front. Sociol. 3:22. doi: 10.3389/fsoc.2018.00022
Received: 06 March 2018; Accepted: 04 July 2018;
Published: 24 August 2018.
Edited by:
Martin Fieder, Universität Wien, AustriaReviewed by:
Thomas V. Pollet, Northumbria University, United KingdomRonny Westerman, Bundesinstitut für Bevölkerungsforschung, Germany
Copyright © 2018 Hopcroft. This is an open-access article distributed under the terms of the Creative Commons Attribution License (CC BY). The use, distribution or reproduction in other forums is permitted, provided the original author(s) and the copyright owner(s) are credited and that the original publication in this journal is cited, in accordance with accepted academic practice. No use, distribution or reproduction is permitted which does not comply with these terms.
*Correspondence: Rosemary L. Hopcroft, rlhopcro@uncc.edu