 Gordon Aitken
 A. Visser-Quinn1†
 Lindsay Beevers
- 1Water Resilient Cities, Institute for Infrastructure and Environment, Heriot-Watt University, Edinburgh, United Kingdom
- 2Institute for Infrastructure and Environment, University of Edinburgh, Edinburgh, United Kingdom
Human-induced changes in climatic behavior and variations in future river flows has been at the fore-front of recent academic and political discourse. Future climate projections are a vital tool in tackling climate change and supporting future adaptation, however until recently models have been viewed individually with a lack of uncertainty quantification. A multi-model ensemble (MME) with a wide range of general circulation models, regional climate models and emissions scenarios, EURO-CORDEX provides climate projections as well as flow series projections across the European domain from 1950 to 2100. This paper explores the validity of the 68 chain MME flow projections by investigating its ability to match observed flow records in the UK over the period 1975–2004. The work explores magnitude through quantile matching and seasonality matching by time-series decomposition of trends. Two statistical tests [Mann-Whitney, and Mean Average Arctangent Percentage Error (MAAPE)] were used to compare EURO-CORDEX flow projections to observed river flows recorded by the National River Flow Archive (NRFA) across 1,436 UK river catchments. Results indicate a high degree of similarity justifying the application of this dataset for assessing future hydrological changes across a regional scale. Discretizing the flow projections into regional and hydrometric areas highlights the variability in performance between neighboring domains and the strong influence local features may have on climate model performance. The validation of EURO-CORDEX flow projection data regionally enables a wide range of applications including the exploration of future changes in local and national river flows.
Introduction
In 2018, it was reported that human-induced warming had reached ~1 ± 0.2 °C (likelihood of outcome, 66–100% probability) (IPCC, 2018) above “pre-industrial” levels (1,850–1,900; Allen et al., 2018). Changes in climatic behavior driven by anthropogenic influences, in terms of both mean and variability, are projected throughout the twenty-first century (IPCC, 2014). National assessments [such as the Independent Assessment of UK Climate Risk (CCRA3, 2020)] have highlighted to governments that greater urgency is required across society in order to adapt to the climate emergency.
Climate is a major determinant of hydrological processes, where precipitation, temperature and evaporation represent the dominant drivers (Arthington, 2012; Cisneros et al., 2014). Consequently, changes in climate will invariably lead to alterations of river flow regimes (Rahel and Olden, 2008; Arnell and Gosling, 2016). Recent research by the authors have investigated the impact of these changes on the river flow regime in terms of future flood and drought magnitude, duration, and frequency (Collet et al., 2017, 2018; Visser-Quinn et al., 2019a, 2021; Ellis et al., 2021), which is also corroborated by other authors (Kay, 2021; Lane and Kay, 2021). The work on changing extremes in the UK indicates the threats faced at a regional level, as well as more widely across Europe (Marx et al., 2018) are likely to intensify in the coming decades.
Hydrological models serve to bridge the gap between global climate change projections and the need to understand the impact of climate change at a more localized scale (Gleick, 1986) on components of interest such as river flows. Research into this hydrological impact has been ongoing for over two decades (Olsson et al., 2016). A typical hydroclimatological modeling chain is depicted in Figure 1A. Emissions scenario(s), representing potential pathways of future emissions [e.g., representative concentration pathways (RCPs)] serve as input to General Circulation Models (GCMs) or Earth System Models (ESMs), to model climate at the global scale. Note, hereafter we refer to only GCMs for conciseness. Given their coarse scale (>50 km grid; Taylor et al., 2012), these outputs must be downscaled prior to their use in hydrological models. Downscaling is typically dynamical or statistical (Flato et al., 2013). Dynamical downscaling uses a higher resolution model [Regional Climate Model (RCMs)] with GCM outputs as boundary conditions; statistical downscaling develops a relationship between baseline observed and simulated GCM outputs, applying this relationship across the future projections. In order to explore the influence of climate projections on future hydrological processes, the downscaled climate outputs (e.g., precipitation and temperature) are then normally used as inputs for hydrological models.
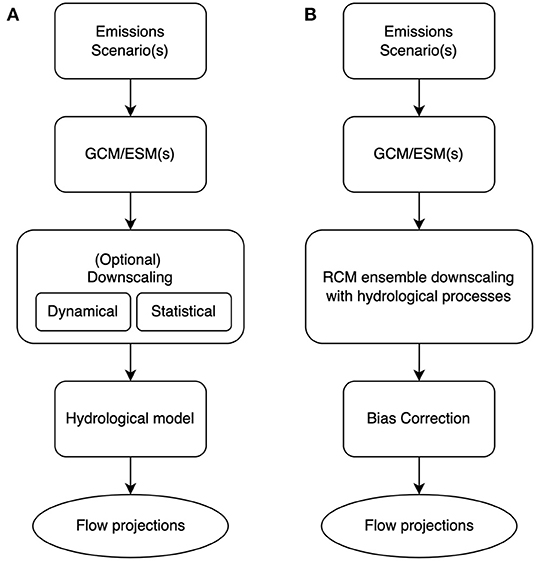
Figure 1. (A) Typical modeling chain; (B) EURO-CORDEX modeling chain.
The complexity of the hydroclimatological modeling chain necessitates the quantification of the uncertainty propagating through the system (Jacob et al., 2020). Uncertainty can be evaluated at each step in the modeling chain through the assessment of input, structural and parameter variations: input uncertainty may be measured through consideration of multiple emissions scenarios; structural uncertainty is captured through the use of a range of GCMs known as a multi-model ensemble (MME); and parameter uncertainty is captured through the systematic variance of model parameters, known as a Perturbed Physics (or Parameter) Ensemble (PPE). The computational demands of climate modeling limit the ability to consider MMEs and PPEs simultaneously. Clark et al. (2016) discusses the characterization and minimization of uncertainty associated with the hydrological impacts of climate change, arguing that much of the focus has been directed toward climate models, and less so on hydrological models and the propagation of uncertainty. Clark et al. (2016) argue that the substantial uncertainty associated with hydrological projections represents a key challenge to practical application. Several authors (Marx et al., 2018; Thober et al., 2018; Visser-Quinn et al., 2019a) have shown that these uncertainties can in certain circumstances be greater than the uncertainty associated with the climate projections. Consequently, this raises questions about the validity of using these flow projections for further impact assessments and policy decisions. There are, however, a number of modeling studies which have found the uncertainty associated with climate models to be far larger than hydrological models (Eisner et al., 2017; Vetter et al., 2017; Hattermann et al., 2018). This highlights the intricacies of multi-model frameworks and necessity to quantify uncertainties at every level.
Understanding uncertainty at each step in the modeling chain is therefore critical to support decision-making. To this end, further assessment of hydroclimatological ensembles is required. The European branch of CORDEX, the Coordinated Regional Downscaling EXperiment. EURO-CORDEX has downscaled global climate projections from 13 CMIP5 GCMs dynamically through the application of 19 Regional Climate Models (RCMs) across the European domain. This is a significant contribution to the climate science community, only possible through large scale collaboration across different science disciplines and institutions, in order to provide robust climate projections which capture different components of uncertainty for the analysis of future change (Jacob et al., 2020). Input uncertainty is further explored using multiple RCPs. Hydrological processes (e.g., soil moisture, snow, precipitation, runoff, and outflow) are captured in the land surface component of climate models, both at global and regional scales (Overgaard et al., 2006). In EURO-CORDEX, global climate projections are dynamically downscaled using RCMs, delivering spatial detail at finer resolutions. The component based structure of climate models allows for explicit representation of river hydrology; for example, CNRM-ALADIN53, one of the RCM's used in EURO-CORDEX and this study (see Figure 3), utilizes the TRIP (Total Runoff Integrating Pathways) model (Oki and Sud, 1998; Sevault et al., 2014). Models from the IPSL modeling center are also known to include substantial land component (included in EURO-CORDEX and this study, see Figure 3). Dynamic coupling within the RCM also allows for consideration of feedbacks in the hydrological cycle through atmospheric and oceanic components (Overgaard et al., 2006). With 68 modeling chains available (Figure 3), EURO-CORDEX represents a unique opportunity to quantify input and structural uncertainties in flow projections at a scale not previously possible.
Climate model outputs such as EURO-CORDEX are typically used as drivers for hydrological models to create river flow time series. Current assessments of climate model outputs use one or more hydrological models for river flow projections under the future climate (Prudhomme et al., 2013; Hannaford et al., In Review). Validation is performed across a chosen domain (Pastén-Zapata et al., 2020) with an ensemble of hydrological models used to account for structural and parameter uncertainty (Thober et al., 2018; Di Sante et al., 2021). However, depending on the accuracy of RCM datasets, hydrological models may be entirely unnecessary for future flow projection studies. Therefore, it is necessary to assess whether this data is fit for hydrological studies. To the best of our knowledge this has not been done before.
In this paper, we assess the validity of using daily flow projections directly from EURO-CORDEX, bypassing the hydrological model requirement (Figure 1), thus removing an additional source of uncertainty and computational cost within the modeling chain. Gridded flow projections from EURO-CORDEX are mapped to UK river catchments, providing time series of daily flow projections for almost all catchments (1,436 out of 1,575). With up to 50 modeling chains available for each catchment, the resultant dataset offers a robust ensemble of future flow projections for the UK which captures modeling uncertainty and is applicable to a wide range of practical applications including assessment of variability in future extremes, engineering vulnerability and community resilience. To understand the skill of the EURO-CORDEX hydrological projections, the performance of the models against observed data must be assessed. For hydrological assessments it is important that the models capture the components of the river flow, for example the range of flow magnitudes experienced in a catchment, and the seasonal occurrence of these. Here the performance of the EURO-CORDEX ensemble daily flow projection data is assessed across 1,436 UK river catchments.
Data Pre-Processing
Data downloaded from EURO-CORDEX has been processed from raw climate model outputs into flow projections following methods outlined in Figure 2. This involves transforming large scale climate data into gridded data for individual flow gauging stations, performing a bias correction to observed historical data and producing flow duration curves. Extreme value analysis and seasonal trends can then be extracted for further impact assessments.

Figure 2. EURO-CORDEX processing method.
EURO-CORDEX Flow Projections
In EURO-CORDEX, the total surface runoff variable, mrro, represents flow. Data was extracted from the Earth Systems Grid Federation (ESGF; https://esgf-data.dkrz.de/projects/esgf-dkrz/) on an 0.11° grid (~12.5 km) across the European domain for 68 RCP-GCM-RCM combinations (Figure 3). To ensure consistency across the dataset, 11 RCP-GCM-RCM combinations using rotated projection on a smaller grid (~12.1 km) were removed (Figure 3). Four RCP-GCM-RCM combinations represented a PPE, consisting of 3-3-3-2 members, respectively. To reduce bias toward these model combinations, only one member from each was utilized. For the remainder of this study, a total of 50 RCP-GCM-RCM combinations were considered—hereafter referred to as modeling chains.
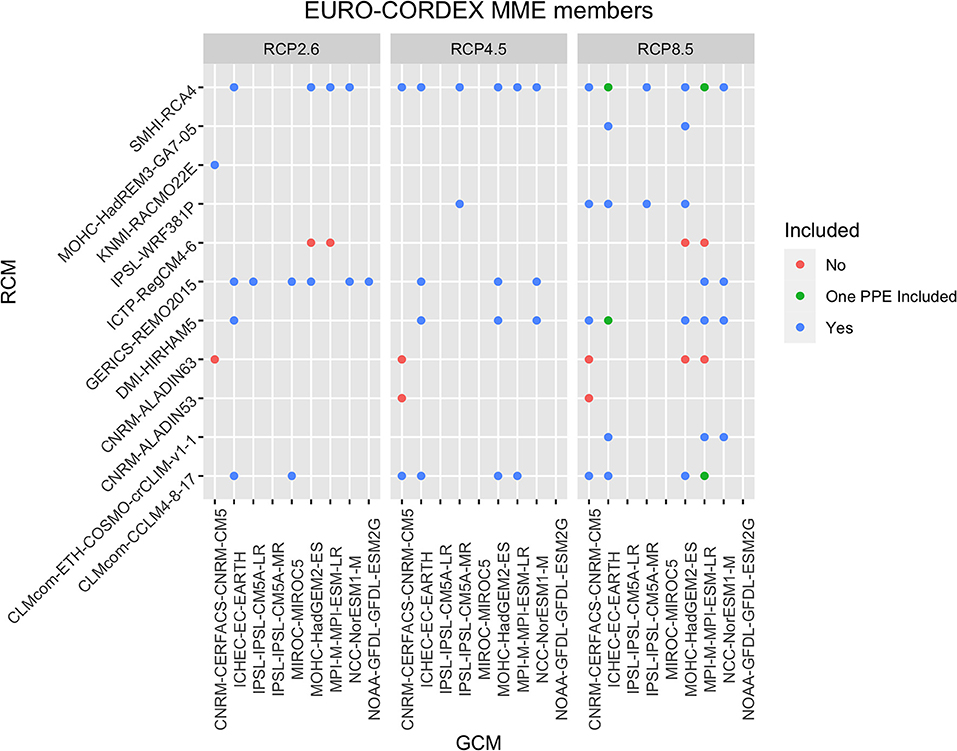
Figure 3. EURO-CORDEX MME members and inclusion/exclusion in the assessed ensemble dataset.
The EURO-CORDEX gridded flow projections were subset to the UK domain: Great Britain and Northern Ireland. These gridded flow projections were mapped to catchments using catchment boundaries provided on request from the National River Flow Archive (NRFA). Flow in each catchment Qcatchment, was determined as the sum of the grid cell fraction Ai, multiplied by the gridded flow projection, Qi (Figure 4).
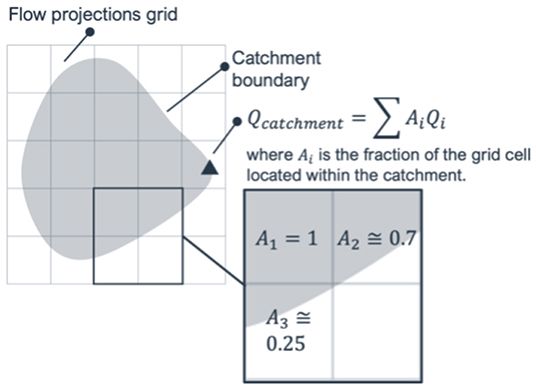
Figure 4. Mapping of gridded flow projections into catchment boundaries.
Observed Flow (NRFA)
A baseline period of 1975–2004 was selected to maximize data availability ensuring the largest number of stations with an acceptable level of missing data across a 30 year time slice. Observed flow data was extracted from the National River Flow Archive (NRFA) for a total of 1,436 gauging stations across 107 hydrometric areas (Figures 5A,B). The NRFA provides observed time flow series for every gauging station in the UK. The measuring authorities vary between UK regions: Environment Agency (EA) in England, the Scottish Environment Protection Agency (SEPA) in Scotland, Natural Resources Wales (NRW) in Wales, and the Department for Infrastructure—Rivers (DfIR) for Northern Ireland. The NRFA processed flows are not naturalized to account for human intervention, therefore calibrating to these observed flows will not account for artificial influences (Hannaford et al., In Review). It should be noted that water abstraction processes upstream of gauging stations are assumed to remain stationary between time periods due to the unquantifiable uncertainty associated with human-interventions.
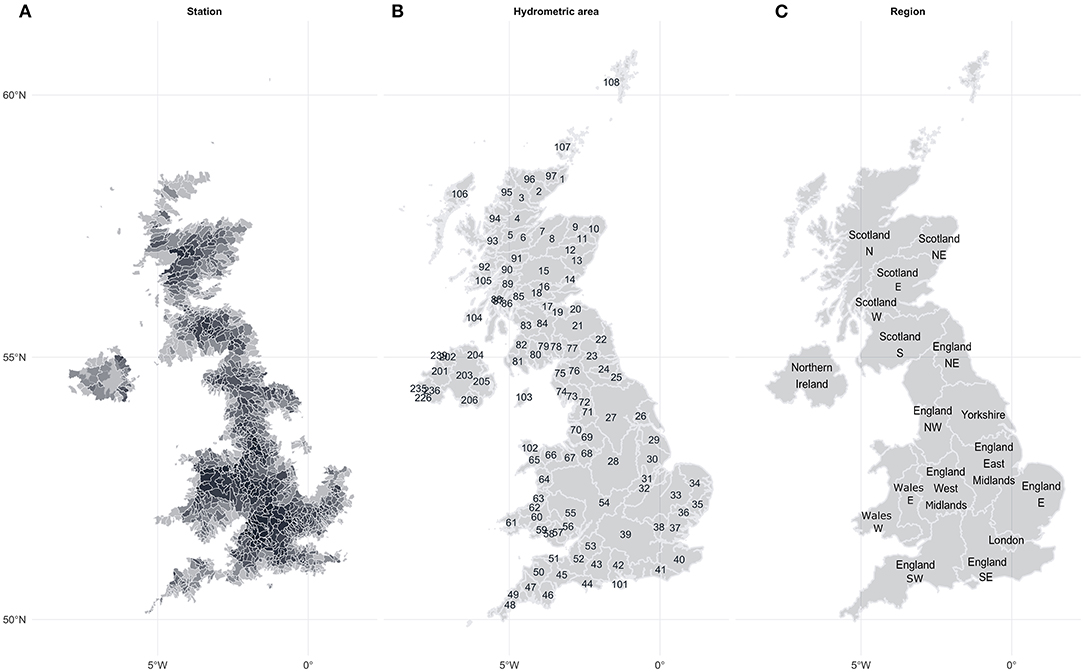
Figure 5. (A) UK station catchments darker shades indicate nested catchments within a parent catchment, (B) NRFA hydrometric areas, (C) UK hydrological regions.
Multivariate imputation via chained equations (MICE) was applied where gaps in the continuous time series were ≤ 3% of this 30-year baseline period. MICE derives multiple imputations for each missing value in the time series (Azur et al., 2011). As such, MICE takes into account the uncertainty around the imputed values and gives accurate standard errors. The principle behind MICE is to analyze a range of possible values for the missing data, pool the results of the imputed values at each time step and create a continuous time series for further analysis. The method was implemented using the mice R package (van Buuren and Groothuis-Oudshoorn, 2011). Where missingness exceeded 3% of the 30-year time period the processed time series represents the longest time series available within the baseline. (See Supplementary Figure A.1 for details of observed flow completeness.)
Bias Correction
Quantile mapping, a well-established bias correction technique in hydrological studies (Gudmundsson et al., 2012; Chen et al., 2013), was applied to improve the fit between modeled flow hindcasts and observations for the baseline period—common practice in hydrological flow projections (Prudhomme et al., 2013; Ellis et al., 2021; Hannaford et al., In Review). To prevent overfitting, 5 equal quantiles were selected (0, 20, 40, 60, 80, 100). For each catchment and modeling chain, baseline flows were split into the five quantiles. These were mapped to the corresponding quantiles from observed data and a linear transformation, to improve the fit of the hindcasts, was determined for each observed-projected pair. This transformation was used to bias correct the flows from 1976 to the end of the projection (up to 2,100). [See Supplementary Figures A.2–A.4 for bias corrected time series flows across each of the 51 modeling chains for the Thames at Kingston (NRFA station id-−39001).]
The application of bias correction directly to RCM river flow series is a novel approach which removes the need for hydrological modeling. Quantile mapping the RCM outputs directly to historical data, enables rapid and direct access to hydrological projections. This provides a more equitable data source, removing the need for specific knowledge of hydrological models, computational costs associated with running these models over national scales and further sources of uncertainty (hydrological model structure, parameter, and input). To our knowledge, this is a novel approach to deriving river flow time series projection which has the potential to improve the process of flood hazard assessments.
Methods
The validity of the bias-corrected EURO-CORDEX daily flow time series was assessed for the baseline period of 1975–2004 per catchment for each modeling chain. Validity was assessed through the application of two tests: Mann-Whitney U-test and the Mean Arctangent Absolute Percentage Error, as described below. These tests were applied to the flow duration curve calculated for each catchment per modeling chain at 1-percentile intervals, and compared to the observed flow duration curve. The tails of the distribution were clipped, 0–5th and 95–100th percentiles, due to known errors associated with the simulation of climatic extremes in climate modeling, particularly with regards to precipitation (IPCC, 2014).
Both methods were selected as a means of testing the similarity between observed and simulated flows with a focus on magnitude and frequency of flood and drought events. Alternative methods may produce more insight into similarities between time series seasonality [cross-correlation analysis (Chandra and Al-Deek, 2008)] but this is out with the scope of this paper.
Mann-Whitney
The Mann-Whitney test (independent two sample Wilcoxon rank-sum test) is applied to determine the similarity between the two populations, the observed and projected flows. The null hypothesis states that there is a 50% probability that any randomly sampled value from former is larger than a value from the latter. The alternative hypothesis is that both samples have the same median and therefore can be said to come from the same population. Larger p-values indicate a stronger statistical similarity between observed and projected flows with a value of 1 indicating exact agreement whereas a value <0.05 is statistically different and the null hypothesis is rejected (Mann and Whitney, 1947).
Maape
The second statistical test, MAAPE, is a measure of the average percentage error between the observed and projected flow (Kim and Kim, 2016). A variant of the mean absolute relative error, MAAPE addresses limitations in infinite/undefined values close to or equal to zero.
Let At and Ft be the actual (observed) and forecast (simulated) values at data point t and N is the number of data points. Then, the error ratio |A-F| over |A| (belonging to [0, ∞]) is equivalent to angle theta:
where θ ∈ [0, 90] and is thus defined for actual values At close to or equal to zero.
Then,
Lower and higher values indicate a better and worse fit, respectively.
To aid in the interpretation of the results, the outcomes of the two tests have been assigned to four quality categories (Table 1). Thresholds have been defined to allow easily understood consistent assessment between tests and across the nation.
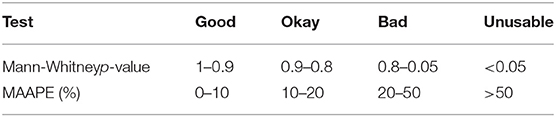
Table 1. Categories for Mann-Whitney and MAAPE tests.
Seasonality
The seasonality component of the flow projections (the timing of flow series peaks and troughs) was assessed through decomposition of the time series (observed flows per catchment, and flow projections per catchment and chain combination). The time series were split into systematic (average, trend and seasonal) and non-systematic (noise) components using R's decompose function which uses moving averages from a symmetric window and equal weights (Kendall and Stuart, 1983). Extracted seasonality trends are then compared to decomposed NRFA observed seasonality trends. Mann-Whitney and MAAPE values were then determined as above.
Results
EURO-CORDEX Verification results have been produced for time-series quantiles and decomposed seasonality trends across 1,436 UK river catchments and 50 climate model chains −71,800 total combinations. Each chain-station combination has been categorized as “Good,” “Okay,” “Bad,” or “Unusable” depending upon the value attained from Mann-Whitney and MAAPE tests. Seasonality trend errors between NRFA and simulated flow quantiles have been compared to examine projection timing. National results have been presented first as a general guide to EURO-CORDEX validity, however, due to the volume of results (up to 50 chains per catchment, 1,436 catchments) understanding generalities at this scale is difficult. As such, results are then presented for each hydrological regional area within the UK to highlight underperforming regions and chains within these reasons. Finally, further discretization to hydrometric areas shows the influence of individual catchments and the highly localized nature of EURO-CORDEX performance. Individual station results can be found for each of the 1,436 stations across the UK (Aitken et al., 2021).
National Results
Mann-Whitney results suggest the majority of simulated data is statistically similar to the observed. Over half of all chain-catchment combinations produce p-values > 0.8, with 53.2% above the threshold indicating good/okay statistical agreement (Table 2). Of the remaining 46.8 only 1.95% are less than the 0.05 null hypothesis threshold, defining statistical differences in flow time series quantiles. Focusing on these unusable combinations, every chain is represented at least once, with 136 stations producing non-agreement with observed data. Upon inspection, 93 of these underperforming stations have <10 years observed data, however 3 stations have over 40% and one spans the entire 30 year period. Median p-values across each chain (Figure 6A) generally remain above the 0.05 threshold. These results indicate a strong correlation between length of observed data and accuracy of bias corrected data, in agreement with previous studies (Lafon et al., 2013), however it is not the singular controlling feature.
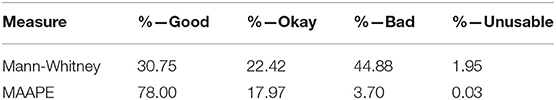
Table 2. National scale statistics of fit across all stations and all chains.
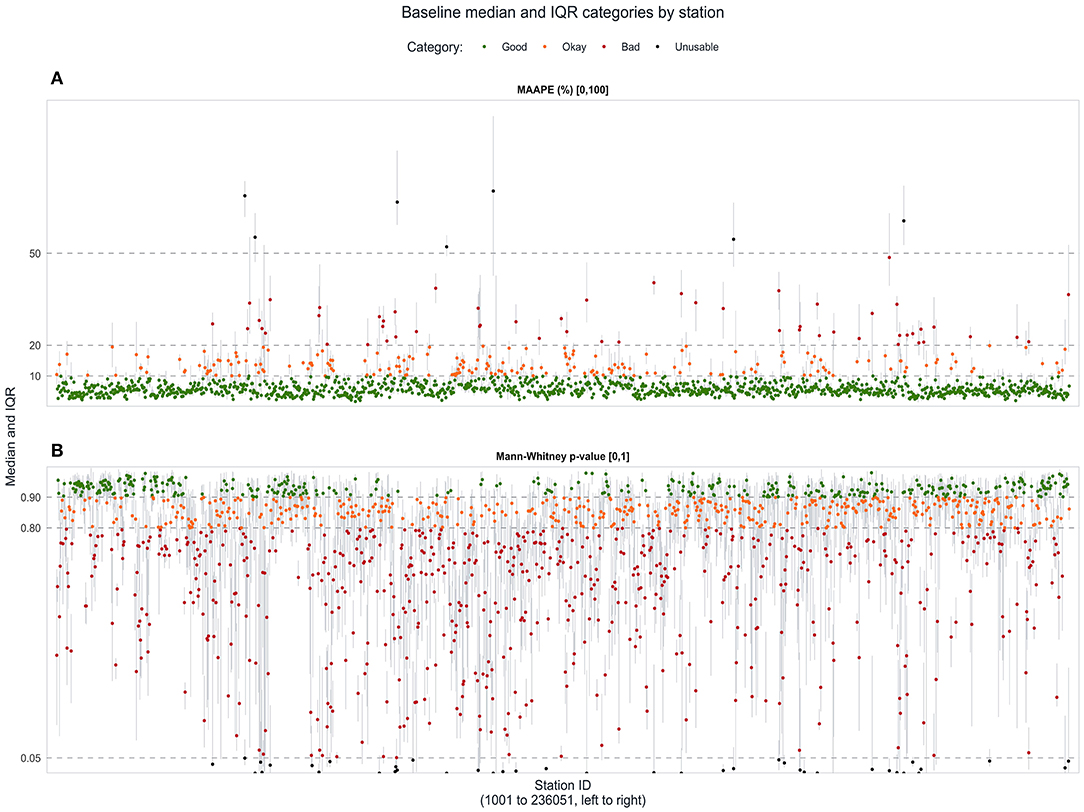
Figure 6. Station ensemble median values with interquartile range (25th and 75th percentiles) (A) Mann-Whitney test and (B) MAAPE.
Station MAAPE error has been investigated to compare station performance (Table 2; Figure 6B) against the observed flows. Low MAAPE values are seen across the ensemble with 78.0% of MAAPE errors <10%, showing a strong agreement between observed and simulated flow quantiles. A further 17.97% of errors are classified as “Okay” and only 3.7% producing MAAPE values >20%. Taking the median MAAPE value across all chains per catchment, over 97% of results are categorized as Good/Okay with only 2.26% producing Bad median values (Figure 6B). Three gauging stations were found to have median MAAPE values >50%: Balder at Balderhead Reservoir (25022), Flore at Experimental Catchment (32029), and Gallica Stream at Gallica Bridge (52020). Each of these stations provided <10 years observed data with none functioning past 1985.
The aggregation of chain performance into a median station value provides a general overview of ensemble performance but reduces the catchment-chain performance detail. The interquartile ranges in Figure 6 demonstrate the difficulty in understanding the performance of individual chains across particular catchments or regions, which is important when assessing the performance of ensemble members for a particular use. Therefore, a regional assessment has been performed.
Regional Results
The spatial variability of MAAPE values have been analyzed over 17 UK regions, defined in Figure 5C. MAAPE was selected as it provides clear, well-defined results which can be easily compared between regions. Cumulative distribution functions (CDFs) of regional MAAPE values identifies variability in national projection performance (Figure 7). Poorly performing regions are typically found in the southeast of England were multiple chains break the 10% threshold before the 50th percentile (indicating a majority MAAPE values out with the well performance threshold). However, due to the large number of chains included in the EURO-CORDEX ensemble, accurate flow time series are still produced in the worst performing regions. Scottish, Welsh, Northern Irish and northern English regions produce lower MAAPE values between observed and simulated data, increasing confidence in regional projections. Within regional performance the controlling factor was found to be the RCM over GCM and RCP. Across every region assessed the worst performing RCM was found to be IPSL-WRF381P from the INSTITUT PIERRE-SIMON LAPLACE research center.
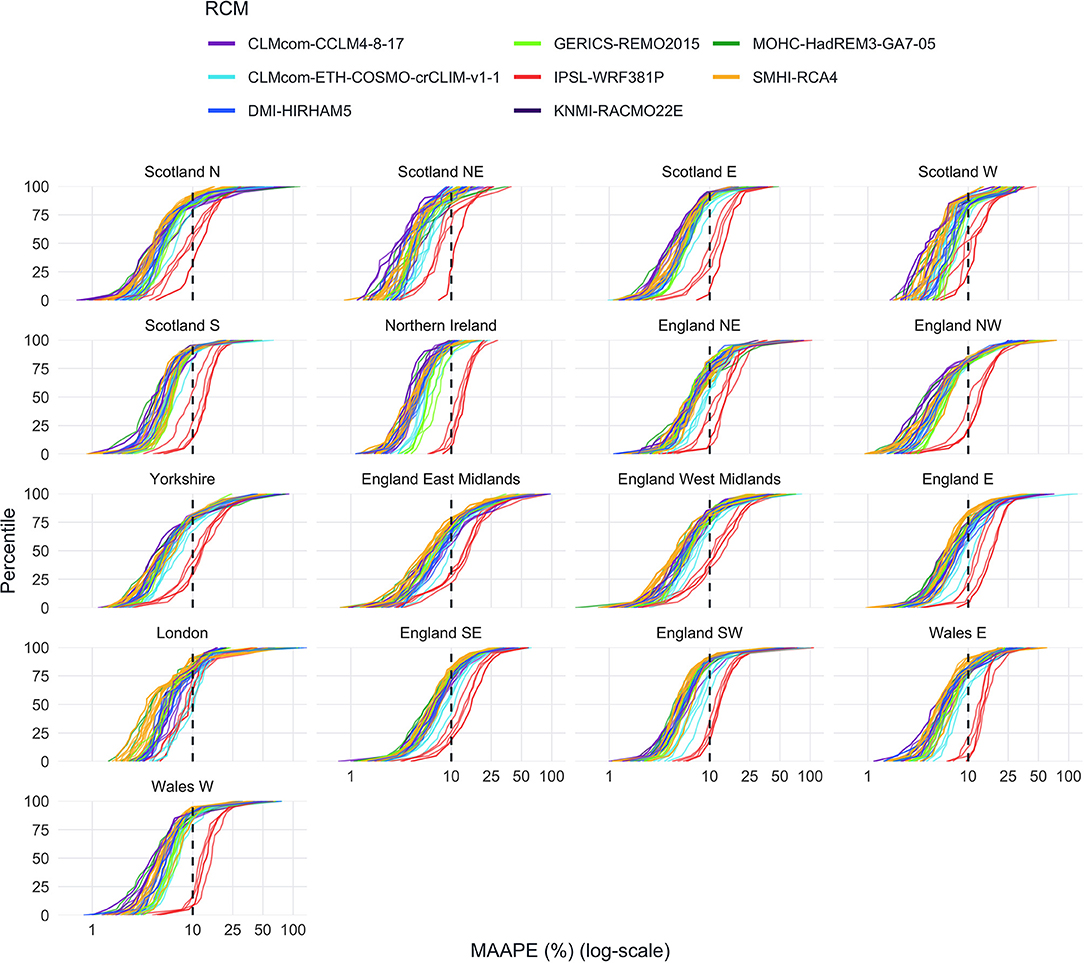
Figure 7. Regional MAAPE CDFs for each chain separated by RCM.
Regional results identify underperforming areas however the large scale limits conclusions as the contributions from each catchment are hidden. Therefore, further discretization to NRFA hydrometric areas has been undertaken.
Hydrometric Areas
The EURO-CORDEX flow time series performance has been considered over 107 NRFA defined hydrometric areas (HA) and 3 RCPs in order to explore spatial differences. MAAPE results have been used to define spatial performance and offer more detailed catchment characteristics and faceting by RCP examines variability in emissions scenarios. The percentage of MAAPE value categories (“Good,” “Okay,” “Bad,” “Unusable”) reveals projection behavior across HAs and RCPs (Figure 8). Differences in HA performance between RCPs is seen to be minimal with the same areas performing well or poorly regardless of emissions scenario. This behavior is mirrored across error categories signaling a larger influence associated with location over climate pathway.
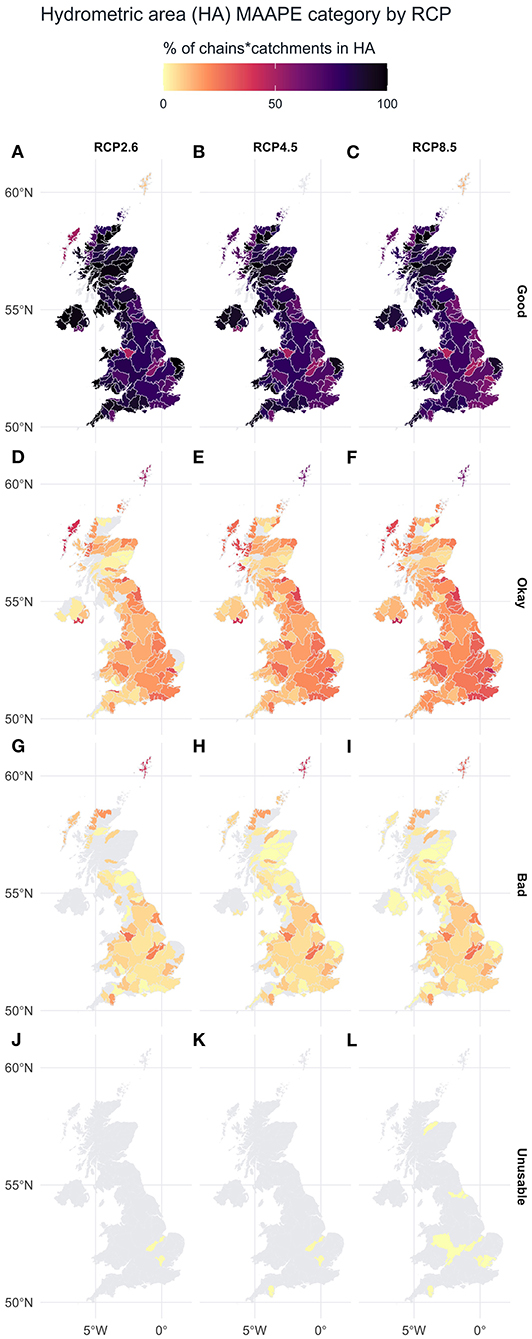
Figure 8. Hydrometric Area flow time series performance by RCP: MAAPE results: RCP 2.6 Good (A), Okay (D), Bad (G), Unusable (J); RCP 4.5 Good (B), Okay (E), Bad (H), Unusable (K); RCP 2.6 Good (C), Okay (F), Bad (I), Unusable (L).
Across HAs, a north-west south-east divide is once more identified however individual MAAPE results are now emphasized. The hydrometric areas of Welland (31) and Nene (32) contribute significantly to the poor performance of southeast regions but some neighboring areas are seen to produce more robust projections, e.g., the Norfolk Rivers Group (34). The individual influence of specific catchments on regional performance shows the need to consider flow projection performance on a highly discretized scale. For example, the Shetlands hydrometric area (108) is the worst performing area over each RCP reporting over 90% of the chains giving a MAAPE value >10%. As a one-catchment HA, flow projections for this area are dependent upon errors from a single gauging station increasing the chance of misrepresentation. Furthermore, as an island catchment in the North Sea the meteorological processes on Shetland will be different from mainland UK. The poor ensemble performance emphasizes the critical need for catchment knowledge when investigating climate model projections.
MAAPE CDFs for each chain separated by RCM for each Hydrometric Area (107 no.) are included in Supplementary Material.
Decomposed Time-Series—Seasonality Component
The calculation of Mann-Whitney and MAAPE on the seasonality component of the time series reveals a limitation of the EURO-CORDEX flow projections. The majority of stations produce median Mann-Whitney p-values less than the 0.8 “Okay” category threshold (Figure 9A). Large interquartile ranges (covering almost the entire range of p-values) indicate low similarity between observed and simulated results. Median MAAPE seasonality values (Figure 9B) suggests difficulties in replicating temporal facets of the flow regime. Large errors are found across stations with only 3 stations with errors <20% and no MAAPE values <19%. The remaining 1,433 median error values suggest a large disparity between observed and simulated time series. In light of the superior performance in replicating the flow duration curve (flow magnitude), the relatively poor replication of the temporal aspect is unsurprising. It is well-established that hydrological models alone are incapable of modeling all, or even multiple, facets of the flow regime concurrently (Blöschl and Montanari, 2010; e.g., magnitude and timing). These difficulties are highlighted in recent efforts by the hydrological modeling community to replicate specific ecologically relevant “hydrological indicators” (Pool et al., 2017; Visser-Quinn et al., 2019b).
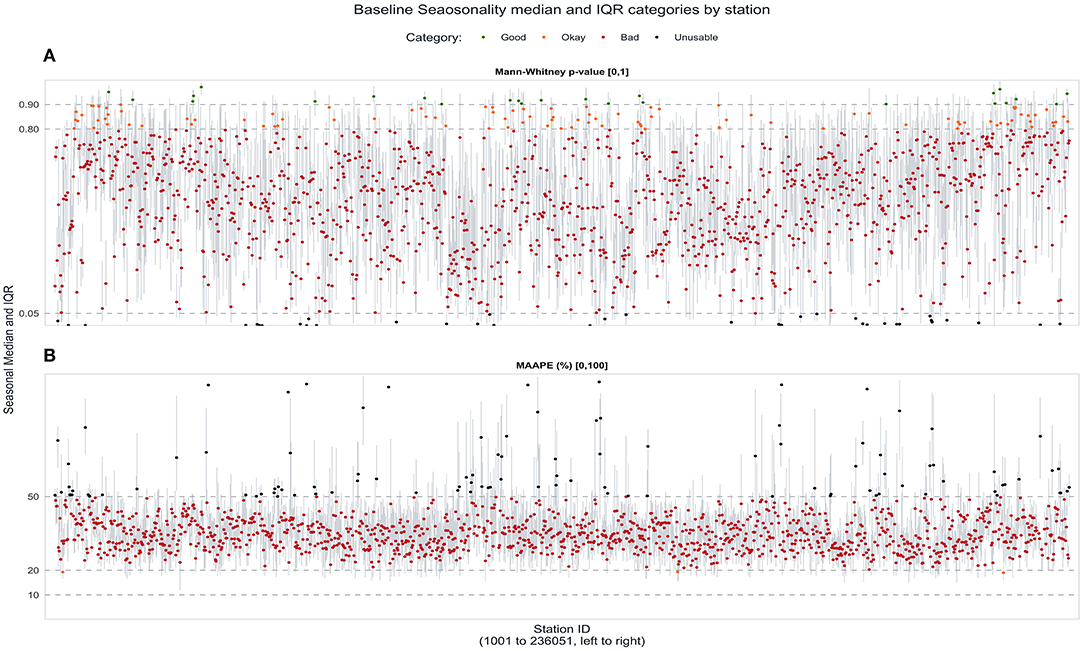
Figure 9. Seasonality trend median values and interquartile ranges across stations. Station ensemble seasonality trend median values with interquartile range (25th and 75th percentiles) (A) Mann-Whitney test and (B) MAAPE.
Discussion
Flow projections extracted from EURO-CORDEX were mapped to 1,436 UK river catchments, bias corrected and validated against observed flows from the NRFA (1975–2004). The bias correction of the data used 5 points in the flow duration curve to adjust the hindcast time series. Then both validation checks were completed on the full flow duration curve, removing the extremes (i.e., on 90% of the data). The validation tests (Mann Whitney and MAAPE) were performed and show that, across the ensemble flow projections available, there are robust, usable flow time series projections in every catchment in the UK. No catchment has all ensemble chains performing badly. Regional variations have been investigated and the results suggest a north-west south-east divide. This work has highlighted southern English regions with a greater proportion of underperforming projections. Increasing the spatial resolution of the analysis to hydrometric area identified specific catchments and localized areas where specific model performance is worse, e.g., the Nene catchment group—West Midlands. In such areas a number of different factors may be influencing the performance, for example the Nene is a fen catchment which may make hydrological processes more difficult to replicate.
The large ensemble dataset produces valid flow projections across the UK domain, allowing exploration of future water availability on a regional level. The size of the ensemble (up to 50 chains per catchment) and the breadth of scenario included (RCP 2.6, 4.5 and 8.5) means that reasonable uncertainty quantification can be undertaken on future analysis in a consistent manner. It must be noted however, that the seasonality of flows is poorly represented across every UK station and caution must be applied to seasonal trends analysis of this dataset. Misrepresentation of timings is a result of GCM complexity and a prioritization of different hydrological interactions which should not hinder the application of EURO-CORDEX future flow projections.
Higher MAAPE values seen with the IPSL-WRF381P RCM reduce confidence in these chains at specific locations however, in general this chain performs poorly across large parts of the UK. The inclusion of underperforming models remains a topic of discussion for climate researchers; is it better to remove the poorly performing models or include every possible projection for maximum uncertainty quantification? Results presented herein suggest that although specific catchments or HAs may be poorly represented by certain chains, this underperformance is highly localized and complete removal of climate models would negatively impact uncertainty quantification across the entire UK domain. Furthermore, large ensembles of data such as EURO-CORDEX reduce individual bias associated with poorly performing chains, allowing accurate flow projections with no loss in uncertainty quantification.
Exploring the role of catchment size on MAAPE values highlights no consistent trend. As the catchments get smaller some display increasing error however this is not universally observed. Figure 10 plots MAAPE vs. catchment area. Given the resolution of RCM models (12.5 km2) there is a chance that catchments under 50 km2 may be poorly represented by this grid. However, the results show an inconsistent message which may be correlated to other factors such as location, topography, and complexity. Therefore, each catchment should be considered independently at the outset of any study.
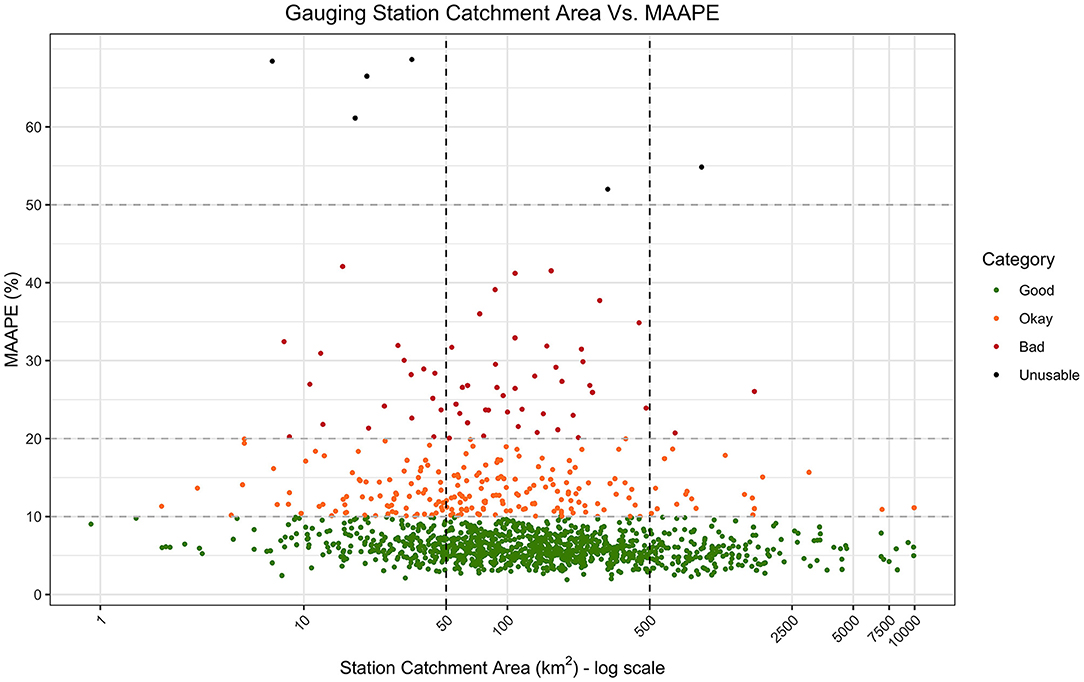
Figure 10. Gauging station catchment area vs. MAAPE values.
Conclusion
The EURO-CORDEX dataset has been shown to produce flow time series for every UK river catchment. Test have been undertaken to examine whether these are statistically significantly different to observed flows, and to examine in more detail the errors (using MAAPE) in the flow projections on the baseline. Across the UK this study has found that in the large majority of catchments the ensemble flow projections available through EURO-CORDEX are useable. The performance of different model chains are explored for both representation of the flow range as well as for flow seasonality. In general the results for the flow range are good across the UK, however representation of seasonality is poor. Climate model uncertainty and parameter uncertainties are quantified within the ensemble which will allow robust uncertainty quantification in future flow availability analysis. EURO-CORDEX outputs, appropriately bias corrected, thus are suitable and available for future climate change impact assessments of water resources across the UK.
Data Availability Statement
Publicly available datasets were analyzed in this study. This data can be found here: DOI: 10.5281/zenodo.5609987, Aitken et al. (2021).
Author Contributions
GA performed the data collection with support from AV. GA and AV performed the statistical analysis. LB, AV, and GA analyzed results. All authors contributed to the article and approved the submitted version.
Funding
This work was supported by EPSRC—EP/N030419/1.
Conflict of Interest
The authors declare that the research was conducted in the absence of any commercial or financial relationships that could be construed as a potential conflict of interest.
Publisher's Note
All claims expressed in this article are solely those of the authors and do not necessarily represent those of their affiliated organizations, or those of the publisher, the editors and the reviewers. Any product that may be evaluated in this article, or claim that may be made by its manufacturer, is not guaranteed or endorsed by the publisher.
Acknowledgments
Data from the UK National River Flow Archive.
Supplementary Material
The Supplementary Material for this article can be found online at: https://www.frontiersin.org/articles/10.3389/frwa.2022.804146/full#supplementary-material
References
Aitken, G., Visser-Quinn, A., and Beevers, L. (2021). EURO-CORDEX: Station Analysis. Zenodo. doi: 10.5281/zenodo.5609987
Allen, M. R., Shine, K. P., Fuglestvedt, J. S., Millar, R.J., Cain, M., Frame, D.J., et al. (2018). A solution to the misrepresentations of CO2-equivalent emissions of short-lived climate pollutants under ambitious mitigation. npj Clim. Atmos. Sci. 1, 16. doi: 10.1038/s41612-018-0026-8
Arnell, N. W., and Gosling, S. N. (2016). The impacts of climate change on river flood risk at the global scale. Climatic Change 134, 387–401. doi: 10.1007/s10584-014-1084-5
Arthington, A. H. (2012). Environmental Flows: Saving Rivers in the Third Millennium. Berkeley, NSW: University of California Press.
Azur, M. J., Stuart, E. A., Frangakis, C., and Leaf, P. J. (2011). Multiple imputation by chained equations: what is it and how does it work? Int. J. Methods Psychiatr. Res. 20, 40–49. doi: 10.1002/mpr.329
Blöschl, G., and Montanari, A. (2010). Climate change impacts – throwing the dice?, Hydrol. Process. 24, 374–381. doi: 10.1002/hyp.7574
CCRA3 (2020). Third UK Climate Change Risk Assessment: Future flood risk: Final Report prepared for the Committee on Climate Change, UK/Sayers, Paul; Horritt, Matt; Carr, Sam; Kay, Alison L.; Mauz, Jane; Lamb, Rob; Penning-Rowsell, Edmund. London: Committee on Climate Change 121.
Chandra, S. R., and Al-Deek, H. (2008). Cross-correlation analysis and multivariate prediction of spatial time series of freeway traffic speeds. Transp. Res. Rec. 2061, 64–76. doi: 10.3141/2061-08
Chen, J., Brissette, F. P., Chaumont, D., and Braun, M. (2013). Finding appropriate bias correction methods in downscaling precipitation for hydrologic impact studies over North America. Water Resour. Res. 49, 4187–4205. doi: 10.1002/wrcr.20331
Cisneros, B. E., Oki, T., Arnell, N. W., Benito, G., Cogley, J. G., Doll, P., et al. (2014). “Freshwater resources,” in C. B. Field, V. R. Barros, D. J. Dokken, K. J. Mach, M. D. Mastrandrea, T. E. Bilir, M. Chatterjee, K. L. Ebi, Y. O. Estrada, R. C. Genova, B. Gimma, E. S. Kissel, A. N. Levy, S. MacCracken, P. R. Mastrandrea, and L. L. White, eds. Climate Change 2014: Impacts, Adaptation and Vulnerability. Part A: Global and Sectoral Aspects. Contribution of Working Group II to the Fifth Assessment Report of the Intergovernmental Panel on Climate Change. (Cambridge: Cambridge University Press), 229–269.
Clark, M. P., Wilby, R. L., Gutmann, E. D., Vano, J. A., Gangopadhyay, S., Wood, A. W., et al. (2016). Characterizing uncertainty of the hydrologic impacts of climate change, Curr. Clim. Change Rep. 2, 55–64. doi: 10.1007/s40641-016-0034-x
Collet, L., Beevers, L., and Prudhomme, C. (2017). Assessing the impact of climate change and extreme value uncertainty to extreme flows across Great Britain. Water 9, 103. doi: 10.3390/w9020103
Collet, L., Harrigan, S., Prudhomme, C., Formetta, G., and Beevers, L. (2018). Future hot-spots for hydro-hazards in Great Britain: a probabilistic assessment. Hydrol. Earth Syst. Sci. 22, 5387–5401. doi: 10.5194/hess-22-5387-2018
Di Sante, F., Coppola, E., and Giorgi, F. (2021). Projections of river floods in Europe using EURO-CORDEX, CMIP5 and CMIP6 simulations. Int. J. Climatol. 41, 3203–3221. doi: 10.1002/joc.7014
Eisner, S., Flörke, M., Chamorro, A., Daggupati, P., Donnelly, C., Huang, J., et al. (2017). An ensemble analysis of climate change impacts on streamflow seasonality across 11 large river basins. Clim. Change 141, 401–417. doi: 10.1007/s10584-016-1844-5
Ellis, C., Visser-Quinn, A., Aitken, G., and Beever, L. (2021). Quantifying uncertainty in the modelling process; future extreme flood event projections across the UK, Geosciences. 11, 33. doi: 10.3390/geosciences11010033
ESGF. (2021). Available online at: https://esgf-data.dkrz.de/projects/esgf-dkrz/ (accessed October 21, 2021).
Flato, G., Marotzke, J., Abiodun, P., Braconnot, S. C., Chou, W., Collins, P., et al. (2013). Evaluation of Climate Models. Available online at: https://www.ipcc.ch/site/assets/uploads/2018/02/WG1AR5_Chapter09_FINAL.pdf (accessed October 20, 2021).
Gleick, P. H. (1986). Methods for evaluating the regional hydrologic impacts of global climatic changes. J Hydrol. 88. 97–116. doi: 10.1016/0022-1694(86)90199-X
Gudmundsson, L., Bremnes, J. B., Haugen, J. E., and Engen-Skaugen, T. (2012). Technical Note: Downscaling RCM precipitation to the station scale using statistical transformations – a comparison of methods. Hydrol. Earth Syst. Sci. 16, 3383–3390. doi: 10.5194/hess-16-3383-2012
Hannaford, J., Mackay, J., Ascott, M., Bell, V., Chitson, T., and Cole, S. (In Review). eFLaG: enhanced future FLows Groundwater. A national dataset of hydrological projections based on UKCP18. Earth Syst. Sci. Data Discuss [Preprint]. doi: 10.5194/essd-2022-40.
Hattermann, F. F., Vetter, T., Breuer, L., Buda, S., Daggupati, P., Donnelly, C., et al. (2018). Sources of uncertainty in hydrological climate impact assessment: a cross-scale study. Environ. Res. Lett. 13, 015006doi: 10.1088/1748-9326/aa9938
IPCC (2014). Climate Change: Synthesis Report. Contribution of Working Groups I, II and III to the Fifth Assessment Report of the Intergovernmental Panel on Climate Change; Technical Report. Geneva: IPCC.
IPCC. (2018). “Summary for policymakers,” in Global Warming of 1.5°C. An IPCC Special Report on the Impacts of Global Warming of 1.5°C Above Pre-Industrial Levels and Related Global Greenhouse Gas Emission Pathways, in the Context of Strengthening the Global Response to the Threat of Climate Change, Sustainable Development, and Efforts to Eradicate Poverty, eds V. Masson-Delmotte, P. Zhai, H. -O. Pörtner, D. Roberts, J. Skea, P. R. Shukla, A. Pirani, W. Moufouma-Okia, C. Péan, R. Pidcock, S. Connors, J. B. R. Matthews, Y. Chen, X. Zhou, M. I. Gomis, E. Lonnoy, T. Maycock, M. Tignor, and T. Waterfield (Cambridge; New York, NY: Cambridge University Press), 3–24. doi: 10.1017/9781009157940.001
Jacob, D., Teichmann, C., Sobolowski, S., Katragkou, E., Anders, I., Belda, M., et al. (2020). Regional climate downscaling over Europe: perspectives from the EURO-CORDEX community. Reg. Environ. Change 20, 51. doi: 10.1007/s10113-020-01606-9
Kay, A. L. (2021). Simulation of river flow in Britain under climate change: baseline performance and future seasonal changes. Hydrol. Proc. 35, 4. doi: 10.1002/hyp.14137
Kendall, M., and Stuart, A. (1983). The Advanced Theory of Statistics. Vol. 3: Distribution Theory. London: Griffin Publishing. p. 410–414.
Kim, S., and Kim, H. (2016). A new metric of absolute percentage error for intermittent demand forecasts. Int. J. Forecast. 32, 669–679. doi: 10.1016/j.ijforecast.2015.12.003
Lafon, T., Dadson, S., Buys, G., and Prudhomme, C. (2013). Bias correction of daily precipitation simulated by a regional climate model: a comparison of methods. Int. J. Climatol 33, 1367–1381. doi: 10.1002/joc.3518
Lane, R. A., and Kay, A. L. (2021). Climate change impact on the magnitude and timing of hydrological extremes across Great Britain. Front. Water 3, 684982. doi: 10.3389/frwa.2021.684982
Mann, H. B., and Whitney, D. R. (1947). On a test of whether one of two random variables is stochastically larger than the other. Ann. Math. Stat. 18, 50–60. doi: 10.1214/aoms/1177730491
Marx, A., Kumar, R., Thober, S., Rakovec, O., Wanders, N., Zink, M., et al. (2018). Climate change alters low flows in Europe under global warming of 1.5, 2, and 3 °C, Hydrol. Earth Syst. Sci. 22, 1017–1032. doi: 10.5194/hess-22-1017-2018
Oki, T., and Sud, Y. C. (1998). Design of total runoff integrating pathways (TRIP)—a global river channel network. Earth Interact. 2, 1–36.
Olsson, J., Arheimer, B., Borris, M., Donnelly, C., Foster, K., Nikulin, G., et al. (2016). Hydrological climate change impact assessment at small and large scales: key messages from recent progress in Sweden. Climate 4, 39. doi: 10.3390/cli4030039
Overgaard, J., Rosbjerg, D., and Butts, M. B. (2006). Land-surface modelling in hydrological perspective – a review. Biogeosciences 3, 229–241. doi: 10.5194/bg-3-229-2006
Pastén-Zapata, E., Jones, J. M., Moggridge, H., and Widmann, M. (2020). Evaluation of the performance of Euro-CORDEX Regional Climate Models for assessing hydrological climate change impacts in Great Britain: a comparison of different spatial resolutions and quantile mapping bias correction methods. J. Hydrol. 584, 653. doi: 10.1016/j.jhydrol.2020.124653
Pool, S., Vis, M. J. P., Knight, R. R., and Seibert, J. (2017). Streamflow characteristics from modeled runoff time series – importance of calibration criteria selection. Hydrol. Earth Syst. Sci. 21, 5443–5457. doi: 10.5194/hess-21-5443-2017
Prudhomme, C., Haxton, T., Crooks, S., Jackson, C., Barkwith, A., Williamson, J., et al. (2013). Future Flows Hydrology: an ensemble of daily river flow and monthly groundwater levels for use for climate change impact assessment across Great Britain. Earth Syst. Sci. Data 5, 101–107. doi: 10.5194/essd-5-101-2013
Rahel, F. J., and Olden, J. D. (2008). Assessing the effects of climate change on aquatic invasive species. Conserv. Biol. 22, 521–533. doi: 10.1111/j.1523-1739.2008.00950.x
Sevault, F., Somot, S., Alias, A., Dubois, C., Lebeaupin-Brossier, C., Nabat, P., et al. (2014). A fully coupled Mediterranean regional climate system model: design and evaluation of the ocean component for the 1980–2012 period. Tellus A Dyn. Meteorol. Oceanogr. 66, 1. doi: 10.3402/tellusa.v66.23967
Taylor, K. E., Stouffer, R. J., and Meehl, G. A. (2012). An Overview of CMIP5 and the Experiment Design. Bull. Am. Meteorol. Soc. 93, 485–498. doi: 10.1175/BAMS-D-11-00094.1
Thober, S., Kumar, R., Wanders, N., Marx, A., Pan, M., Rakovec, O., et al. (2018). Multi-model ensemble projections of European river floods and high flows at 1.5, 2, and 3 degrees global warming. Environ. Res. Lett. 13, 01400. doi: 10.1088/1748-9326/aa9e35
van Buuren, S., and Groothuis-Oudshoorn, K. (2011). Mice: multivariate imputation by chained equations in R. J. Stat. Softw. 45, 1–67. doi: 10.18637/jss.v045.i03
Vetter, T., Reinhardt, J., Flörke, M., Van Griensven, A., Hattermann, F., Huang, S., et al. (2017). Evaluation of sources of uncertainty in projected hydrological changes under climate change in 12 large-scale river basins. Climatic Change 141, 419–433. doi: 10.1007/s10584-016-1794-y
Visser-Quinn, A., Beevers, L., Collet, L., Formetta, G., Smith, K., Wanders, N., et al. (2019a). Spatio-temporal analysis of compound hydro-hazard extremes across the UK, Adv. Water Resour. 130, 77–90. doi: 10.1016/j.advwatres.2019.05.019
Visser-Quinn, A., Beevers, L., Lau, T., and Gosling, R. (2021). Mapping future water scarcity in a water abundant nation: near-term projections for Scotland. Climate Risk Manag. 32, 100302. doi: 10.1016/j.crm.2021.100302
Keywords: climate model, climate—change, MME, uncertainty, EURO-CORDEX, MAAPE, Mann-Whitney
Citation: Aitken G, Visser-Quinn A and Beevers L (2022) EURO-CORDEX: A Multi-Model Ensemble Fit for Assessing Future Hydrological Change? Front. Water 4:804146. doi: 10.3389/frwa.2022.804146
Received: 28 October 2021; Accepted: 22 June 2022;
Published: 19 July 2022.
Edited by:
Mohammad Shamsudduha, University College London, United KingdomReviewed by:
Subimal Ghosh, Indian Institute of Technology Bombay, IndiaMikolaj Piniewski, Warsaw University of Life Sciences, Poland
Copyright © 2022 Aitken, Visser-Quinn and Beevers. This is an open-access article distributed under the terms of the Creative Commons Attribution License (CC BY). The use, distribution or reproduction in other forums is permitted, provided the original author(s) and the copyright owner(s) are credited and that the original publication in this journal is cited, in accordance with accepted academic practice. No use, distribution or reproduction is permitted which does not comply with these terms.
*Correspondence: Gordon Aitken, ga41@hw.ac.uk
†ORCID: Gordon Aitken orcid.org/0000-0003-2235-2325
Annie Visser Quinn orcid.org/0000-0003-1787-6239
Lindsay Beevers orcid.org/0000-0002-1597-273X