Spatial Orientation in Cardiac Ultrasound Images Using Mixed Reality: Design and Evaluation
 Dharani Maddali
  Henrik Brun
 Gabriel Kiss
 Jon Mikkelsen Hjelmervik5
  Ole Jakob Elle
- 1Digital Signal Processing and Image Analysis, Department of Informatics, University of Oslo, Oslo, Norway
- 2The Intervention Centre, Oslo University Hospital, Oslo, Norway
- 3Department of Pediatric Cardiology, Division of Pediatric and Adolescent Medicine, Oslo University Hospital, Oslo, Norway
- 4Department of Computer Science, Norwegian University of Science and Technology, Trondhiem, Norway
- 5Mathematics and Cybernetics, SINTEF Digital, Oslo, Norway
- 6Robotics and Intelligent Systems, Department of Informatics, University of Oslo, Oslo, Norway
Spatial orientation is an important skill in structural cardiac imaging. Until recently, 3D cardiac ultrasound has been visualized on a flat screen by using volume rendering. Mixed reality devices enhance depth perception, spatial awareness, interaction, and integration in the physical world, which can prove advantageous with 3D cardiac ultrasound images. In this work, we describe the design of a system for rendering 4D (3D + time) cardiac ultrasound data as virtual objects and evaluate it for ease of spatial orientation by comparing it with a standard clinical viewing platform in a user study. The user study required eight participants to do timed tasks and rate their experience. The results showed that virtual objects in mixed reality provided easier spatial orientation and morphological understanding despite lower perceived image quality. Participants familiar with mixed reality were quicker to orient in the tasks. This suggests that familiarity with the environment plays an important role, and with improved image quality and increased use, mixed reality applications may perform better than conventional 3D echocardiography viewing systems.
1 Introduction
Ultrasound is the most widely used imaging modality in heart diagnostics because of its high availability, low cost, and real-time nature. In recent years the use of 3D/4D (3D + time) structural cardiac ultrasound data has increased, owing to improved image quality and the ability to visualize complex structures in three dimensions. 3D provides depth to structures. All systems currently on the market present visualizations on a flat screen, thus not taking full advantage of the data. This problem could be overcome with stereoscopic visualization technologies, such as virtual reality (VR) and mixed reality (MR). Hamacher et al. (2016) gave an overview of such technologies and their use in medical applications with a focus toward urology and also touched upon the importance of interaction in such systems in their review paper. The advantages of using MR are ease of interaction and the ability to perceive both the real world and virtual objects simultaneously, opening the future for use during procedures, such as catheter-based interventions. It enables ease of portability and use in a sterile clinical setting, and necessary awareness of surroundings is possible, such as bedside with patients or in operating rooms.
The feasibility of holographic echocardiograms in surgical planning and guidance was first demonstrated by Bruckheimer et al. (2016). The holographic images were generated using either 3D transesophageal echocardiography (TEE) or 3D rotational angiography in the catheterization lab to demonstrate the feasibility of holograms in the treatment of congenital heart disease. A free-standing holographic display connected to a 3D rotational angiography workstation was used for rendering the holograms, which makes it less portable and more costly than a head-mounted display. Kasprzak et al. (2020) were the first to demonstrate real-time echocardiography in an MR environment using a head-mounted display during a mitral balloon commissurotomy. In recent years, there have been other studies in MR using segmented organ models generated from other imaging modalities, such as magnetic resonance imaging (MRI) Pelanis et al. (2019); Perkins et al. (2017) or computed tomography (CT) (Pratt et al., 2018; Brun et al., 2019). Gehrsitz et al. (2021) showed that MR virtual objects using Cinematic rendering performed better for preoperative planning of pediatric heart surgery compared to 2D images or 3D prints generated from CT and MRI data.
With regards to user evaluation studies, there have been a few in recent years that evaluated 3D echocardiography visualizations using the latest head-mounted technologies in VR (Narang et al., 2020; Deng et al., 2021; Pushparajah et al., 2021). Deng et al. (2021) described a system for complex cardiac procedures and evaluated its clinical acceptability using three different user studies. A study of clinical usability and immersive experience, a study of clinical measurements, and finally, a study of clinical benefit were conducted. They concluded that their system was easy to use, clinically acceptable, and may improve procedure planning. Narang et al. (2020) also described a system with a focus toward measurements and designed it for both cardiac CT and 3D echocardiography. They looked at variability in measurements done on mitral valves using VR and conventional analysis tools with total data of over a thousand measurements. The findings included lower variability in VR compared to conventional analysis for both 3D echocardiography and CT. To the best of our knowledge, no publications have evaluated 4D echocardiography in MR with a focus on spatial orientation.
The aim of this study was to design and assess the potential benefits of an MR-based visualization system for 4D echocardiography for ease of spatial orientation by comparing it with a standard viewing system in clinical use. The system was evaluated for four main aspects: image quality, ease of interaction, ease of spatial orientation, and morphological understanding. The primary objective was to compare a subjective rating of ease of spatial orientation between the two visualization technologies for 4D echocardiographic image data. We hypothesized that visualizing the data with true depth perception would make it easier for a cardiologist to spatially orient and spend less time on a given task within an MR environment when compared to images shown on a 2D display, which is the current standard of clinical practice.
In this paper, we describe the development and design of a visualization system for 4D echocardiography using an MR environment named “HoloUSCardio.” Furthermore, a user study was conducted to evaluate the system and ease of spatial orientation in MR. Henceforth in the paper, the terms orient and orientation are used to mean spatial orientation for convenience.
2 Spatial Orientation in 3D Echocardiography
Orienting oneself in a complex image is an essential skill for a cardiologist. It can be described as the process through which one performs a mental spatial alignment of the rendered image data with a mental picture of a full heart model of the patient. This skill is required in both diagnostic and interventional imaging, where the cardiologist, for example, is required to align the image to a predefined surgeon’s view.
There are two main reasons why orienting is needed. First, the orientation of the acquired image is dependent on the position of the probe and the direction of the beam during acquisition. Second, based on the depth and location of acquisition, most 3D echocardiographic images only show a partial image of the heart, reducing the number of anatomic landmarks for recognition of anatomy. In congenital heart defects, the complexity further increases due to the high variability of malformed anatomies, such as when defining the location and borders of a large ventricular septal defect (VSD), which is a hole in the interventricular septum, which is the wall between the left and right ventricle.
Another example of clinical orientation is TEE examination of the mitral valve with 3D echocardiography which is not annotated. No information is provided on which leaflet is anterior and posterior, and neither their subdivisions in scallops. One way to identify the leaflets is to align the 3D echocardiography such that one is looking from the left atrium toward the left ventricle and then looking for the aorta. Once the aorta is identified, the leaflet closest to it is identified as the anterior, and the other is posterior. In a similar manner, different anatomic structures require different alignment and orientation. Orientation is crucial to ensure unequivocal communication between imagers and surgeons to address valve and other pathologies correctly.
There are three basic actions that are performed in the process of orienting oneself in 3D images. These are manipulation, clipping/cutting, and frame traversal. Figure 1, gives a pictorial representation of the actions and the cyclic nature of the order of execution of the three actions. Manipulation is described as the ability of rotation and translation, i.e., moving the model around. Clipping is the ability to cut away structures of less interest to better perceive structures of interest. Frame traversal is the ability to pause at a specific frame and be able to traverse through the recorded frames for a better temporal understanding of heart structures during motion. This is common to both 2D video (2D + time) and 4D (3D + time) echo. The frames are usually recorded in times of heart cycles, and traversal is done between systole (period of contraction of the heart muscles) and diastole (period of relaxation of the heart muscles). There is no specific order in which these actions are carried out, and one can be followed by any of the others.
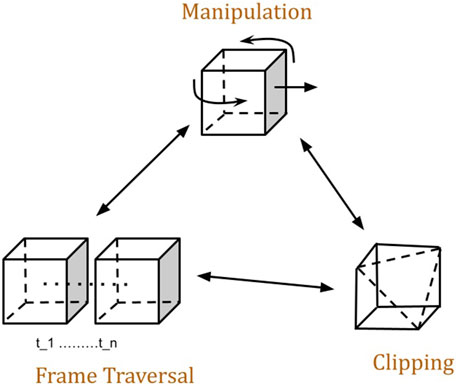
FIGURE 1. Actions performed during Orientating in virtual 3D echocardiography and order of execution. Any of the actions could be the first action of a user. Manipulation encompasses translation, rotation, and scaling.
On the Vivid E95 using EchoPACTM (GE Healthcare, Chicago, Illinois, United States) software, all these three actions are supported using buttons and the trackball. The only action that is not supported is the translation part of the manipulation action, as there is no need for moving the 3d echocardiography around in a flat-screen environment. The rotation action is supported by the use of a trackball. For clipping, there are multiple features (e.g., 2-click crop, flexiview, etc.) that allow the user to define various planes that clip away uninteresting data. In a similar manner, frame traversal is supported using buttons and knobs, where the user can pause and traverse through the recorded frames.
3 Visualization of 4D Echocardiograms
Visualization of 4D cardiac ultrasound volume data is challenging due to the presence of different types of noise and its time-varying nature. Noise in the images occludes tissue, making it difficult to perceive structures of interest. Combined with the time-varying nature, this requires that the rendering algorithm is able to process data changes in real time. In addition, rendering in MR use stereoscopic display which requires the volume rendering algorithm to be fast, as it has to render an image twice, once per eye.
3.1 Noise Filtering
Ultrasound image data have a relatively low signal-to-noise ratio, with noise deriving from electrical and acoustical sources. In 2D ultrasound, noise reduces image quality and hinders image interpretation, whereas in 3D ultrasound, noise may occlude important structures, making them less visible. Especially in 3D, cardiac ultrasound signals from the blood appear as noise, obscuring the tissue and also making it difficult to delineate the boundary between heart tissue and the blood pool.
To reduce the presence of noise, a two-step process was adopted. In the first step, a threshold was applied, where all voxels below the threshold were set to zero. A common threshold value was manually tuned for the models for maximum noise removal without loss of structural information. In the second step, a Gaussian-based bilateral filter was used for smoothing. The bilateral filter tends to smooth by preserving regions of similar intensity within a range and eliminating those that are not similar to the intensity at the center of the kernel, leading to edge preservation. This aids in reducing the noise on the boundary of tissue and blood to better visualize tissue. An advantage of using bilateral filter is that it is separable (Pham and van Vliet, 2005) along each dimension, making it suitable for acceleration using a GPU.
3.2 Volume Rendering
There are two main approaches to rendering 3D ultrasound data, one is surface-based, and the other is ray tracing-based. Generating an accurate representation of the surface for data with high noise and temporal change is not trivial. Thus, a ray tracing-based direct volume rendering (DVR) approach was adopted. In a basic form, DVR traces rays outwards from each pixel on the viewing plane into a volumetric scalar field. The volume is sampled at every point along the ray and pixel intensity I is determined by evaluating a rendering integral of the form
Where d represents the distance along the ray fired from each pixel (x, y) on the rendered image. I0 represents the background intensity. L(s) is the local illumination and T given by
is the absorption of the light between (s, d) within the volume which determined with the help of a transfer function (τ). τ maps a scalar value to opacity. In practice, a transfer function is stored either as a look-up table or an image.
4 Interaction and Interface
Interaction is a crucial factor for a complete understanding and utilization of virtual objects in an MR environment. The clinical ultrasound system has an interaction scheme using a physical interface, such as a trackball and buttons. The HoloLens 2 offers a wide variety of interactions with objects in 3D using hand gestures, voice control, and eye-tracking, of which only hand-based interactions were enabled to keep the interaction scheme simple. The following are four common interactions used in the application. First, to manipulate virtual objects, a “non-affordance based manipulation” was used where users could grab a bounding box represented in blue color (see Figure 2) and move it. Second, a “palm-up” gesture was used to present the menu shown as a rectangular virtual object and could be placed anywhere in the visualization space. Third, a “one-finger press” gesture was used to interact with “pressable buttons” presented on the menu, as shown in Figure 3. Different icons and text were used on the buttons to represent features that users could access. Fourth, an “air-tap” gesture was used to enable the selection of 3D cross-like virtual objects called “pegs” for measuring distances. Microsoft’s documentation on mixed reality1 provides further details and pictorial representations of interactions available on HoloLens 2.
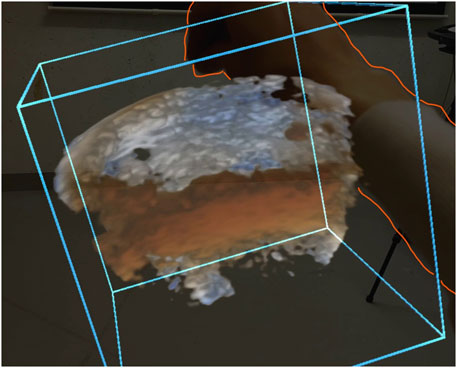
FIGURE 2. A camera capture of a user manipulating by grabbing a blue bounding box. The orange line is drawn to outline the user’s hand in the picture.
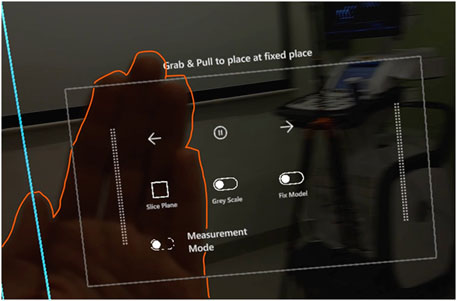
FIGURE 3. A camera capture of the menu with icons representing features available for the users. The user activates the menu using a palm-up gesture. The orange line is drawn to highlight the users palm in the picture.
A common practice in medical augmented reality research is to register the rendered image to its specific anatomy, which has its benefits but it restricts the users’ ability to interact with the virtual object. It also limits the viewing direction, and for an ultrasound, the 3D rendering could be partially obscured by the probe, and in the case of TEE, the probe is inside the body, making the probe invisible. Thus, registration was not considered.
4.1 Free-Moving Slice Plane
To clip away features of less interest, a slice plane was used, see Figure 4. A virtual object made up of a 2D rectangle represented the slice plane. The slice plane could be manipulated freely in space just like any other virtual object, making the interaction smooth and natural, leading to a reduced need for extra training for the usage of the plane.
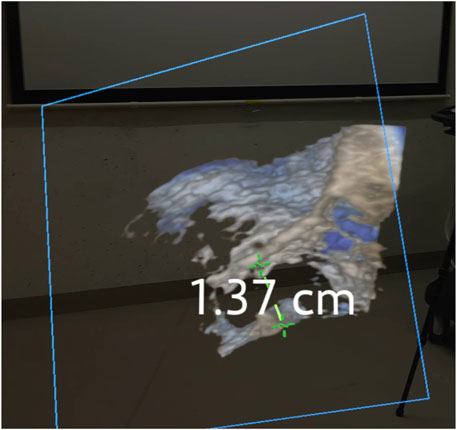
FIGURE 4. A camera capture of a slice plane and a measurement of the VSD height using pegs.
An advantage of having a free-moving slice plane is it allows users to examine the 3D ultrasound by sweeping across the volume. According to Lai and Wheatley (2021), in their examination principles for pediatric echocardiograms, sweeps are a necessary part of the examination to rule out abnormalities. It is recommended that a recording of an examination consists of multiple complete sweeps. When a user slices the rendered volume while sweeping, it mimics a similar action with additional information by presenting both a 2D slice on the plane and the extended 3D structure, aiding in the interpretation of the image.
4.2 Scenario 1: Spatial Orientation in Virtual 4D Echocardiograms
As mentioned above in section 2, the spatial orientation of 3D echocardiograms consists of three actions manipulation, frame traversal, and clipping. Manipulation, i.e., translation and rotation, the user would have to grab the bounding box with a single hand and move it to a different spatial location. In addition, users could grab the box using both hands at two different locations and then either stretch or shrink it. This scaling in size generated a zoom effect. Frame traversal consists of browsing through frames and was achieved using buttons, such as Play/Pause and forward and backward. Figure 3 depicts the design of the menu where all the buttons in the scene appeared. The menu also consists of a button for activating a slice plane.
4.3 Scenario 2: Measuring Structures of Interest
Another common clinical application is measuring structures using a caliper tool for linear distances, such as diameters of valves. As shown in Figure 4, to do a measurement, a user would first have to find a suitable plane using the slice tool. Add two “pegs” into the scene using the menu and place them at the desired location on the slice plane. Users would then have to select the pegs using an “air-tap” gesture to display the distance between them.
Initially, the pegs were allowed to be placed anywhere in the visualization space. This meant that the user would have to pinpoint the location of the structure of interest on the rendered heart. During pilot testing, it appeared that this took a lot of time, as placing an object in 3D on structures is ambiguous by nature as there is no touch feedback like in the real world. Hence, to simplify the use of the pegs, the placement was restricted to be on the slice plane.
5 Implementation
The HoloUSCardio application was developed using MRTK in Unity for the HoloLens 2. The volume rendering algorithm used in this work is based on the algorithm described by Kiss et al. (2010) for visualizing 3D echocardiograms. It is extended to render stereoscopic view by having the algorithm render twice using perspective projection. Figure 5, shows a rendering of a 3D echocardiography in the four-chamber view. The image processing and rendering algorithms were implemented using C++ and OpenCL. The network communication was implemented using a reliable user data protocol.
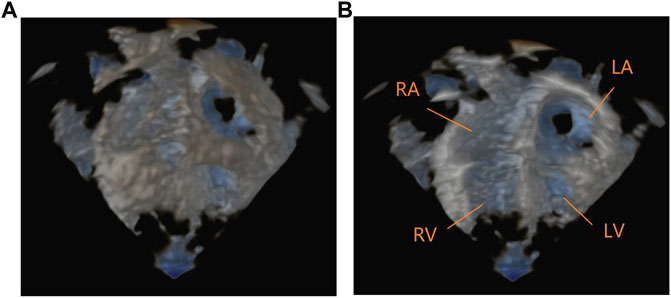
FIGURE 5. A camera capture of the volume rendering of a four-chamber 4D echocardiography from the HoloLens 2. (A) shows a front view as seen from the top of the person. (B) shows the same image sliced and annotated to show LA, Left Atrium; RA, Right Atrium; RV, Right Ventricle; LV, Left Ventricle.
5.1 Data Acquisition and Format
The ultrasound images were acquired with the 6VTD TEE probe on a GE Vivid E95 system. The acquired data is in a custom GE Dicom format and can be read using AppAPI, software provided by GE as part of their Edison Developer Program. The software provides data in Cartesian space as a 3D volume of voxel data. The volume is then placed in the visualization space and rendered using perspective projection. The transfer function and color maps used in the volume rendering algorithm were those generated by the Vivid E95 scanner when acquiring data.
5.2 Remote Rendering Architecture
Due to the stereoscopic nature of MR, the volume rendering algorithm is required to be approximately 60 fps as it has to render an image once per eye. Figure 6, shows the overall architecture of the rendering pipeline. Due to the limited processing power available on the MR device, a remote rendering based architecture was adopted to execute the computationally heavy volume rendering remotely.
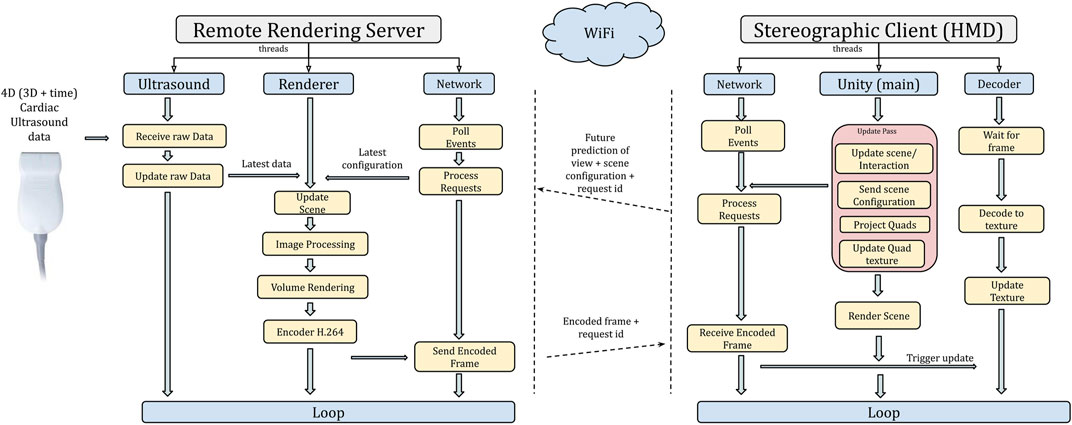
FIGURE 6. Architecture diagram of the remote rendering pipeline.
In a remote rendering scheme, the computationally intensive rendering is offloaded to a separate high-power computer with a GPU called a rendering server. Our approach is image-based (Shi and Hsu, 2015), where the client sends information about the virtual object’s position, orientation, and view configuration to the remote rendering server, and the corresponding rendered images are streamed back. An advantage of using image-based architecture is that the rendering pipeline on the server can be different from that of the client. In our setup, the rendering on the HoloLens 2 is rasterization based, whereas the rendering on the remote server is ray tracing based, thereby facilitating separation of the workload. This allows for volume rendering to be processed by the server and the interaction with the virtual objects to be processed by the client, i.e., HoloLens 2. The final image displayed to the user is a blending of the server output image with the client image.
The server renders a side-by-side stereo image in RGBA format (32-bit) set to the desired resolution. An image resolution of 720p (1,280 × 720) would have a resultant data size of ∼29 Mbits per frame, and at 60 fps, this would be ∼1.7 Gbits/s which was over the capacity in our setup of WiFi 802.11 ac (833 Mbits/s) connection on the HoloLens 2. Having a WiFi connection was vital to allow unrestricted movement of the user in the sterile space. Hence, the rendered images were encoded using H.264 video encoding format as it is supported for hardware-accelerated decoding on the HoloLens 2 device. On the server side, the encoding was done using NVidia’s NVPipe.
5.2.1 Stereo Projection and Image Stabilization
Once a connection to the render server is established, requests are sent by the client for a rendered image once per update frame. Each request contains scene configuration that is needed for rendering along with a serial identifier. The identifier serves two purposes. One is to maintain a record of the corresponding configuration and the order of the request. Each received frame contains with it the identifier, which is then used by the client to retrieve the corresponding configuration and project two quads (one for each eye) onto the viewport of that specific configuration. The position of the quads prior to the projection is based on the distance to the virtual model that represents the rendered volume from their specific eye configuration. The quads then draw the received image as textures into the scene once for each eye. The diagram in Figure 6 illustrates the communication between the client and server.
One potential challenge that occurs as a result of remote rendering is the difference between the current viewer configurations to that of the rendered image. Depending on the delay, it could show up as lag or unstable images, causing discomfort to the user. To overcome this, a synchronization of view configuration is needed; this happens through a predictive model built into the HoloLens 2 system. When a request for the view configuration of the device is made using Unity, the returned values are a future prediction of the user’s head movement. This future prediction is based on a continual tracking of the user’s head in relation to the surroundings and the render update rate of the specific application. In the remote rendering setup, it results in the server rendering to a future predicted configuration, thus mitigating data transfer delays and minor fluctuations that could occur in the network creating a stable and smooth image to the user. The specific mechanics of the prediction model is hidden by the HoloLens 2 system.
5.2.2 Performance Considerations
The overall performance of the system is determined by the sum of different components in the processing chain, such as the time taken to render images for both eyes, the time it takes to encode plus decode, and network communication. The performance of the components is influenced two factors: the resolution of the rendered image and the size of the volume. The resolution of the video determines the render time as it dictates how many rays are fired in the volume rendering stage. For example, a 720p (1,280 × 720) resolution video would require one ray fired per pixel leading to 921600 (1,280 × 720) rays. Another aspect where the resolution of the image impacts performance is during encoding and decoding of the rendered images; the higher the resolution, the longer it takes. The size of the volume (2563) determines the resolution of the samples, directly affecting the quality of the image and the time taken for the smoothing kernel to smooth out the data.
6 User Study
A user study was conducted using the HoloUSCardio application on the HoloLens 2 and the EchoPAC software on the GE Vivid E95 scanner. The aim was to compare ease of orientation, image quality, and morphological understanding between the MR visualization and the standard analysis software. In addition, depth perception and interaction were assessed for the MR application. Data relating to the participants’ expertise, familiarity with MR, and age were also collected.
6.1 Participants
A total of eight participants took part in the study, seven males and one female between the ages of 29–56, all of whom were cardiologists. Half the participants were familiar with MR/VR, meaning had tried a virtual or MR environment at least once, and the other half were not. All those familiar with MR had experience with the HoloLens 2 device prior to the user study. None of the participants were acquainted with the HoloUSCardio application prior to the study, and all had experience using the clinical viewing system (EchoPAC, GE Vingmed), some with extensive years in clinical practice.
6.2 Experiment Setup and Ultrasound Images
The experiment was conducted in a separate room with access to EchoPAC on a GE E95 scanner and HoloLens 2 with HoloUSCardio loaded. A camera was used to record the scanner screen, while an onboard camera on the HoloLens 2 was used to record the participants’ interactions with the virtual objects. In total, three 4D echocardiography images were used that had been acquired using the GE E95 system with the 6VTd TEE probe. All data were anonymized, and participants were not shown the images before the study. A stock 3D ultrasound image (courtesy GE Healthcare ⓒ) was used for a tutorial at the start.
6.3 Procedure
Participants were first briefed about the user study and the type of tasks they would be performing. A standardized tutorial of the HoloUSCardio application was then given. The purpose of the tutorial was to give an introduction to the application and use of tools. It was also a way for participants who had not experienced a MR to get introduced to it. The tutorials lasted approximately 10–25 min depending on users’ familiarity with MR and confidence to do the tasks.
All participants were required to perform three different timed tasks twice, once in the MR application and once on the scanner. The tasks required the participant to perform measurements of specific structures of the heart: transverse and anterior-posterior diameters of the mitral valve, the distance between three commissures of the aortic valve, and lastly long axis height of a VSD. The choice of the structures was made to have a variation in task complexity, with the aortic valve being the least complex, followed by the mitral valve and the VSD being the most complex structure in terms of orienting in the echocardiogram. The order in which the tasks were assigned was randomized. During the tasks, participants were encouraged to speak out loud about their thought processes to gather potential insights in a more qualitative manner. In the end, participants filled in a questionnaire to rate their experience.
6.4 Data Recorded
Three sets of data were recorded during the study. These include the times to perform tasks, measurements of structures, and finally, user experience ratings from the questionnaire. The times recorded for the tasks were categorized into two, first was the “time to orient,” which was the time taken from the start of the task to when the caliper tool was selected, and the second was the “time to finish,” which was the total time taken to finish the task, i.e., to orient and measure the specified structures on the echocardiogram. A total of 10 questions were rated per participant, and each of the questions had a rating scheme of 1–6 on the Likert scale. The answer options were Hard-Moderate-Easy, Bad-Moderate-Good, and Low-Medium-High. General feedback was also registered, sometimes leading to interesting discussions.
The times and rating data presented below are for all eight participants, but due to insufficient video recording quality, the caliper measurements performed by one of the participants could not be harvested. Hence, measurement data for only 7 participants are presented.
7 Results
7.1 Performance Tests
A series of performance tests were done on an NVidia Quadro RTX 3000 laptop GPU using 720p and 1080p (1920 × 1080) for rendered image resolutions and 1283 and 2563 for volume data sizes. Table 1, provides the details of the performance stats in milliseconds. There was a significant increase in time for all parameters between 720p and 1080p, which was expected. What is worth noting is the increase in decoding times on the HoloLens 2 for 1080p when compared to 720p. This contributes to the round-trip times leading to a potential lag in interaction with the virtual object. The effect of increase in volume size on performance was not as significant as that of the rendered image resolution for 2563 on the HoloLens 2 between 720p and 1080p. Hence, a choice to go with 2563 and 720p was made to balance quality and performance.
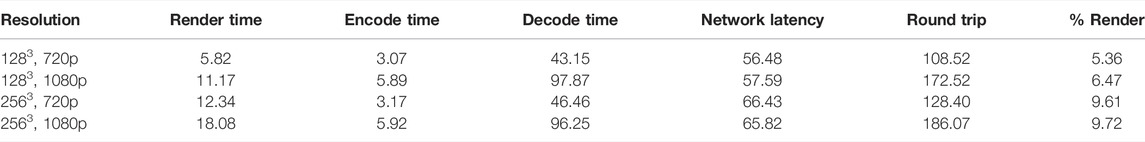
TABLE 1. Performance Stats (in milliseconds).
It is important to note that the “Render time” presented in Table 1 is a sum of both image processing and volume rendering times, which is the reason for the increase in time between 1283 and 2563 for the same render image resolution. Also, the percentage of time taken for rendering the image is considerably less when compared to decode time on the HoloLens 2, which is the bottleneck for performance in our case. For both 720p and 1080p, it occupies less than 10% of the round trip, indicating more potential for advanced rendering algorithms.
7.2 User Evaluation
All task times recorded as part of the user evaluation were converted to seconds and all means presented are geometric means (GM), rounded off to the nearest second decimal. Measurements were recorded in centimeters, and all ratings from questionnaires were recorded as numbers from 1 to 6.
7.2.1 Task Times
Table 2 shows that for all three tasks, the mean time to finish on the EchoPAC (100.20, 186.15, 168.99 s) was lower than with HoloUSCardio (241.5, 216.71, 284.86 s), respectively, which was not the case for time to orient. The mean time to orient for the mitral valve task was more on the EchoPAC (164.85 s) when compared to HoloUSCardio (136.03 s). An interesting observation was that the task that took the longest mean time for both times to orient and time to finish was different for EchoPAC and HoloUSCardio. On EchoPAC, the mitral valve task (164.85 s, 186.15 s) took more time as compared to the aortic valve (71.94 s, 100.20 s) and VSD (148.35 s, 168.99 s). While on HoloUSCardio, the VSD (223.31 s, 284.86 s) task took more time than the aortic valve (132.01 s, 241.15 s) and mitral valve (136.03 s, 216.71 s).
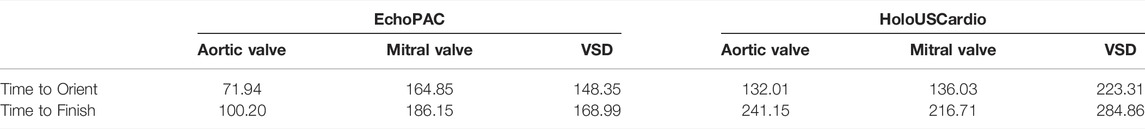
TABLE 2. Geometric means of task times (in seconds) for all participants.
Familiarity With Mixed Reality
A comparison of means of task times between participants familiar and unfamiliar with MR is presented here. Participants familiar with MR were cumulatively quicker to orient on HoloUSCardio. The cumulative time to orient on HoloUSCardio was 383.76 s as compared to 417.55 s on EchoPAC. Figure 7A, provides a graphical representation of the times to orient those familiar with MR with the tasks ordered in increasing complexity. Participants were quicker to orient on the HoloUSCardio for all tasks, with the exception being the aortic valve task. For participants unfamiliar with MR, there is a substantial difference in the time to orient between EchoPAC (362.20 s) and HoloUSCardio (680.81 s). From Figure 7B, we can see that times to orient on the HoloUSCardio were slower than EchoPAC. Participants performed quicker on the EchoPAC for all three tasks, with the VSD taking the longest. A similar comparison of time to finish for all participants showed that the performance was quicker on the EchoPAC for all tasks.
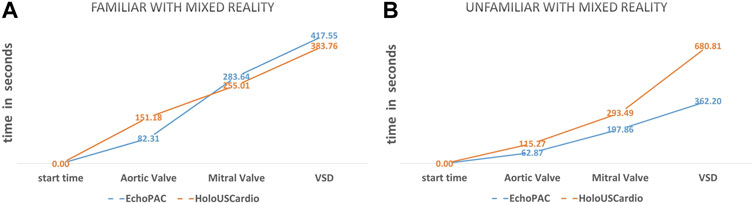
FIGURE 7. Geometric means of “times to orient” (seconds) shown as a graph of data between HoloUSCardio and EchoPAC for familiar (A) and unfamiliar (B) with mixed reality.
7.2.2 Measurements
A total of 6 structures were required to be measured, generating 12 measurements per participant. The measurement data for seven participants is presented in Figure 8 in the form of a bar graph with GM and standard deviation. We see that measurements performed in the HoloUSCardio have a bias of being either smaller or close to their corresponding measurements on the EchoPAC. The bias seen in mitral valve structures (AP and transverse diameters) was measured to be 0.05 cm higher on HoloUSCardio than EchoPAC; all other structures were measured smaller on the HoloUSCardio compared to EchoPAC.
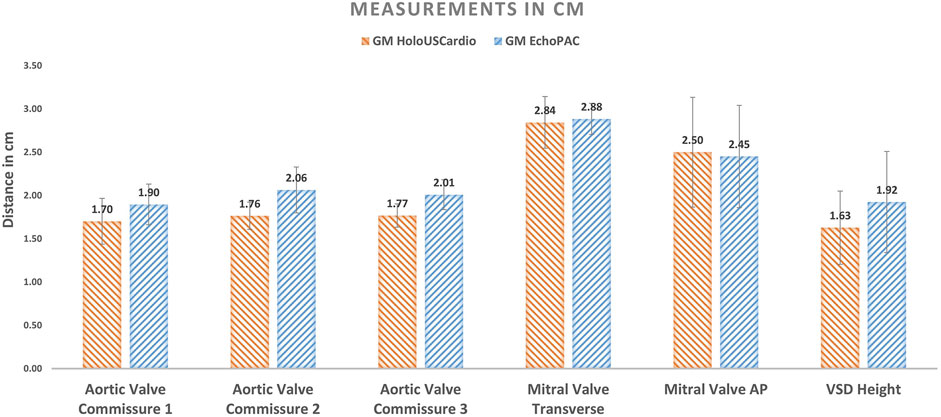
FIGURE 8. Geometric means of distances measured per structure (7 participants). The error bars represent the standard deviation (SD).
7.2.3 User Experience
Table 3 gives a full list of the questions asked and their corresponding means of the ratings. The table also shows the four categories of questions and their corresponding adjectives used for ratings on a Likert scale of 1–6. A comparison of ratings for the image quality of the 4D echocardiography on HoloUSCardio (GM = 3.6, standard deviation [SD] = 1.3) with EchoPAC (GM = 4.2, SD = 1.1) suggests that participants perceived the visualization in HoloUSCardio to be of lower quality than that of EchoPAC. While morphological understanding was seen to be better on HoloUSCardio (GM = 4.3, SD = 09) and was rated higher than EchoPAC (GM = 3.8, SD = 1.0).
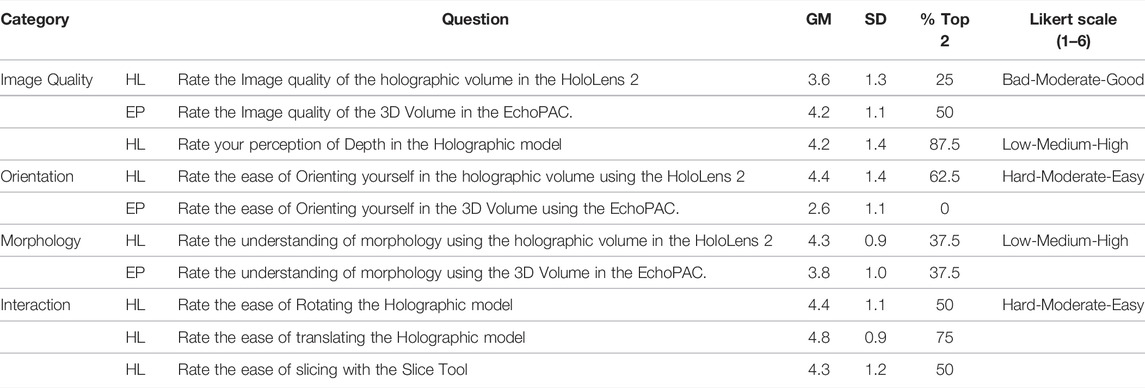
TABLE 3. Geometric means of ratings (Likert scale of 1–6) for all questions over all participants. HL refers to questions regarding HoloUSCardio and EP refers to questions regarding EchoPAC. Values in % Top 2 column refer to the percentage of participants giving a rating of 5 or above for that question.
In the case of ease of orientation, participants rated HoloUSCardio as being easier to orient in comparison to EchoPAC. HoloUSCardio was rated at GM = 4.3 and SD = 1.4, whereas the EchoPAC was a significantly lower with GM = 2.6 and SD = 1.1 (p-value = 0.031, single tail t-test for two paired-sample means). This is further supported by observing the distribution of top 2 ratings with 5 or above (Easy) by participants. Where on the HoloUSCardio, 67.5% rated it as being easy to orient, while on EchoPAC (0%), none rated it as easy to orient. In a similar manner, 87.5% of the participants rated depth perception to be high (5 or above) on the HoloUSCardio.
A regression analysis on the various user ratings for HoloUSCardio related questions showed a high correlation of r = 0.748 between ease of orientation and depth perception with a statistical significance of p-value = 0.033. In a similar manner, morphological understanding (r = 0.738, p-value = 0.037) and ease of interaction (r = 0.576 and p-value = 0.003) had a statistically significant correlation with depth perception. No statistically significant correlation was found between image quality and ease of orientation (r = 0.32, p-value = 0.43), depth perception (r = 0.53, p-value = 0.17) or morphological understanding (r = 0.38, p-value = 0.34).
8 Discussion
The aim of this study was to describe a new application for MR visualization of 4D echocardiography and compare it to standard visualization, focusing on spatial orientation. In brief, the results indicate that there is a benefit with the use of MR in 4D echocardiography in terms of ease of orientation and morphological understanding, despite the fact that the image quality was subjectively assessed as lower with the MR system than the standard rendering.
The discussion of the results of the user study is divided into factors related to first morphological understanding and ease of orientation in the MR environment. Second, the factors that influence user performance, and third, factors influencing the bias in the measurements on the MR device.
8.1 Morphological Understanding and Ease of Orientation
Morphological understanding in MR is impacted by the image quality and depth perception. Gehrsitz et al. (2021) concluded that a greater understanding of morphology is achieved using photo-realistic rendering of 3D CT images in MR. In our study, image quality was perceived to be lower in HoloUSCardio than EchoPAC, albeit using the same transfer function. One reason could be the differences in the image processing pipeline, as the choice of the methods for smoothing and noise removal influences the quality of the image.
Despite lower perceived image quality, participants found HoloUSCardio to provide better morphological understanding than standard visualization, which could be related to a high level of depth perception. Morphological understanding correlated significantly with depth perception (p-value = 0.037) but not with image quality (p-value = 0.34). This indicates that depth perception influences the utility more than image quality does, thus making MR attractive already with the currently available quality. Improving image quality in this MR environment for 4D echocardiography may not be of major importance for morphological understanding but will probably widen the potential use case scenarios substantially.
Ease of orientation depends on the ability to comprehend morphology in order to orient oneself in complex 4D echocardiography images. As discussed above, if depth perception has more influence than image quality for morphology understanding, which in turn makes it easier to orient, it may be concluded that a true 3D depth environment like MR provides a greater advantage for 4D echocardiography.
8.2 User Performance
Familiarity and interactions play an important role in the performance of the users. Cardiologists train for a substantial period of time using an ultrasound scanner, and all our participants have spent time using the EchoPAC, some with extensive experience. In contrast, even those who have been familiar with MR did not have much training in the MR environment, and none of the participants were previously exposed to the HoloUSCardio application. Results showed that participants familiar with MR performed better than those who were unfamiliar with HoloUSCardio, suggesting that with practice, the MR environment could become more efficient.
An area where interaction design influenced performance was during the completion of tasks. The discrepancy in participants’ performance between “time to finish” and “time to orient” is due to the difference in usage of the caliper tool to do measurements. On the EchoPAC, the mechanism to measure is “click-drag-click,” where one clicks a button to mark the start location of the caliper tool, then drags it using the trackball and clicks at the final location to measure the distance. In comparison, the mechanism in the HoloUSCardio involves more steps, as explained above in interaction scenario 2.
Another important factor that influences performance in MR space is the diversion of attention. In the case of EchoPAC, the user’s attention is focused on a fixed space on the screen, and due to extensive training, users do not always have to divert their attention to use different tools. In HoloUSCardio, the menu needed to be accessed to perform different actions, leading the user to divert attention away from the rendered volume multiple times. This meant that during frame traversal actions, participants could not see the changes to the 3D echocardiography while using the menu. While on the EchoPAC, participants did not need to divert attention as it was based on the turning of a knob on the scanner. The extra effort to analyze the changes led to an increase in the time to orient.
This is a drawback in our design of the interactions in the HoloUSCardio application. A potential method to improve the design is to use an attention optimization strategy. This could be studied by tracking the eye movements of the user and analyzing where the user’s gaze has been focused.
8.3 Bias in Measurements
Results show a bias in measurements done in the HoloUSCardio being smaller when compared to EchoPAC. This bias could be a result of participants being less confident in locating the boundary of the tissue walls on the rendered volume. On the EchoPAC, participants could see the 2D image of the selected plane where they could see the gradation in brightness across the tissue wall. The absence of such information could have led to a conservative measurement.
Another factor that influences measurement in 3D is the parallax effect, which leads to a difference in the way one perceives distance between objects as one moves their viewing position. To reduce the uncertainty, the placement of the pegs was limited to the 3D slice plane. But this does not eliminate the effect completely, as one is not always orthogonal to the slice plane, potentially leading the participants to place the 3D markers in the empty space in front of the perceived tissue wall. An important limitation is that the sample size of the measurements is small and were not compared to 2D gold standard. Thus, the distances measured should not be considered a representation of accurate measures.
9 Future Work
4D echocardiography is gaining more regular use, and we believe that MR will be able to aid in quicker and better interpretation and use. One area where we see a huge scope for improvement is to be able to bring in advanced dynamic lighting-based visualization to the rendering, which could greatly improve the image quality and enable users to interact in innovative ways using lighting with 3D echocardiograms. There is also space to improve the interaction by adding additional modes of interaction, such as eye-tracking and voice commands. These would prove valuable in environments where there is limited space to move around and sterile locations. Another interesting area to explore is a fusion of 3D ultrasound with data from different modalities, such as CT and MRI in MR, and their potential uses in guiding cardiac interventions.
10 Conclusion
In this work, we found that users benefited from improved morphological understanding and ease of spatial orientation in 4D echocardiographic images presented in MR using a stereoscopic visualization, even though the perceived image quality of the rendering was rated lower than that of the standard clinical system. It was observed that participants familiar with the MR environment performed better, and the overall interaction and ease of use of tools were rated to be high. This indicates that the learning curve for the MR environment is relatively short, making its use for 4D echocardiography a more beneficial alternative.
Data Availability Statement
The original contributions presented in the study are included in the article/Supplementary Material. Further inquiries can be directed to the corresponding author.
Author Contributions
DM, HB, and OE contributed to the concept, design, and methodology. DM and GK contributed to the software. DM, HB, and JH contributed to the analysis. DM and HB did writing and editing. All authors contributed to manuscript revision, and read and approved the submitted version.
Conflict of Interest
The authors declare that the research was conducted in the absence of any commercial or financial relationships that could be construed as a potential conflict of interest.
Publisher’s Note
All claims expressed in this article are solely those of the authors and do not necessarily represent those of their affiliated organizations or those of the publisher, the editors, and the reviewers. Any product that may be evaluated in this article or claim that may be made by its manufacturer, is not guaranteed or endorsed by the publisher.
Acknowledgments
The authors would like to thank GE Healthcare for the collaboration in the development of the technology part through the Edison Developer Program.
Supplementary Material
The Supplementary Material for this article can be found online at: https://www.frontiersin.org/articles/10.3389/frvir.2022.881338/full#supplementary-material
Footnotes
1Microsoft Mixed Reality Documentation. Design/Interactions Accessed Friday 29th April, 2022.
References
Bruckheimer, E., Rotschild, C., Dagan, T., Amir, G., Kaufman, A., Gelman, S., et al. (2016). Computer-Generated Real-Time Digital Holography: First Time Use in Clinical Medical Imaging. Eur. Heart J. Cardiovasc. Imaging 17, 845–849. doi:10.1093/ehjci/jew087
Brun, H., Bugge, R. a. B., Suther, L. K. R., Birkeland, S., Kumar, R., Pelanis, E., et al. (2019). Mixed Reality Holograms for Heart Surgery Planning: First User Experience in Congenital Heart Disease. Eur. Heart J. Cardiovasc. Imaging 20, 883–888. doi:10.1093/ehjci/jey184
Deng, S., Wheeler, G., Toussaint, N., Munroe, L., Bhattacharya, S., Sajith, G., et al. (2021). A Virtual Reality System for Improved Image-Based Planning of Complex Cardiac Procedures. J. Imaging 7, 151. doi:10.3390/jimaging7080151
Gehrsitz, P., Rompel, O., Schöber, M., Cesnjevar, R., Purbojo, A., Uder, M., et al. (2021). Cinematic Rendering in Mixed-Reality Holograms: A New 3D Preoperative Planning Tool in Pediatric Heart Surgery. Front. Cardiovasc. Med. 8, 633611. doi:10.3389/fcvm.2021.633611
Hamacher, A., Kim, S. J., Cho, S. T., Pardeshi, S., Lee, S. H., Eun, S.-J., et al. (2016). Application of Virtual, Augmented, and Mixed Reality to Urology. Int. Neurourol. J. 20, 172–181. doi:10.5213/inj.1632714.357
Kasprzak, J. D., Pawlowski, J., Peruga, J. Z., Kaminski, J., and Lipiec, P. (2020). First-in-Man Experience with Real-Time Holographic Mixed Reality Display of Three-Dimensional Echocardiography During Structural Intervention: Balloon Mitral Commissurotomy. Eur. Heart J. 41, 801. doi:10.1093/eurheartj/ehz127
Kiss, G., Steen, E., Asen, J. P., and Torp, H. G. (2010). “GPU Volume Rendering in 3D Echocardiography: Real-Time Pre-Processing and Ray-Casting,” in 2010 IEEE International Ultrasonics Symposium (San Diego, CA, USA: IEEE), 193–196. doi:10.1109/ULTSYM.2010.5935485
Lai, W. W., and Wheatley, J. (2021). “The Normal Pediatric Echocardiogram,” in Echocardiography in Pediatric and Congenital Heart Disease (Hoboken, NJ, US: John Wiley & Sons), 47–66. Section: 4 _eprint: https://onlinelibrary.wiley.com/doi/pdf/10.1002/9781119612858.ch4. doi:10.1002/9781119612858.ch4
Narang, A., Hitschrich, N., Mor-Avi, V., Schreckenberg, M., Schummers, G., Tiemann, K., et al. (2020). Virtual Reality Analysis of Three-Dimensional Echocardiographic and Cardiac Computed Tomographic Data Sets. J. Am. Soc. Echocardiogr. 33, 1306–1315. doi:10.1016/j.echo.2020.06.018
Pelanis, E., Kumar, R. P., Aghayan, D. L., Palomar, R., Fretland, Å. A., Brun, H., et al. (2019). Use of Mixed Reality for Improved Spatial Understanding of Liver Anatomy. Minim. Invasive Ther. Allied Technol. 29, 154–160. doi:10.1080/13645706.2019.1616558
Perkins, S. L., Lin, M. A., Srinivasan, S., Wheeler, A. J., Hargreaves, B. A., and Daniel, B. L. (2017). “A Mixed-Reality System for Breast Surgical Planning,” in 2017 IEEE International Symposium on Mixed and Augmented Reality (ISMAR-Adjunct), Nantes, France, 9-13 October 2017, 269–274. doi:10.1109/ISMAR-Adjunct.2017.92
Pham, T., and van Vliet, L. (2005). “Separable Bilateral Filtering for Fast Video Preprocessing,” in 2005 IEEE International Conference on Multimedia and Expo (ICME), Amsterdam, Netherlands, July 6-8, 2005, 4. ISSN: 1945-788X. doi:10.1109/ICME.2005.1521458
Pratt, P., Ives, M., Lawton, G., Simmons, J., Radev, N., Spyropoulou, L., et al. (2018). Through the HoloLens Looking Glass: Augmented Reality for Extremity Reconstruction Surgery Using 3D Vascular Models with Perforating Vessels. Eur. Radiol. Exp. 2, 2. doi:10.1186/s41747-017-0033-2
Pushparajah, K., Chu, K. Y. K., Deng, S., Wheeler, G., Gomez, A., Kabir, S., et al. (2021). Virtual Reality Three-Dimensional Echocardiographic Imaging for Planning Surgical Atrioventricular Valve Repair. JTCVS Tech. 7, 269–277. doi:10.1016/j.xjtc.2021.02.044
Appendix A: Full Data of Task Times and Ratings
Appendix Table A1 presents recorded times to orient for all participants and tasks, along with participant familiarity information.
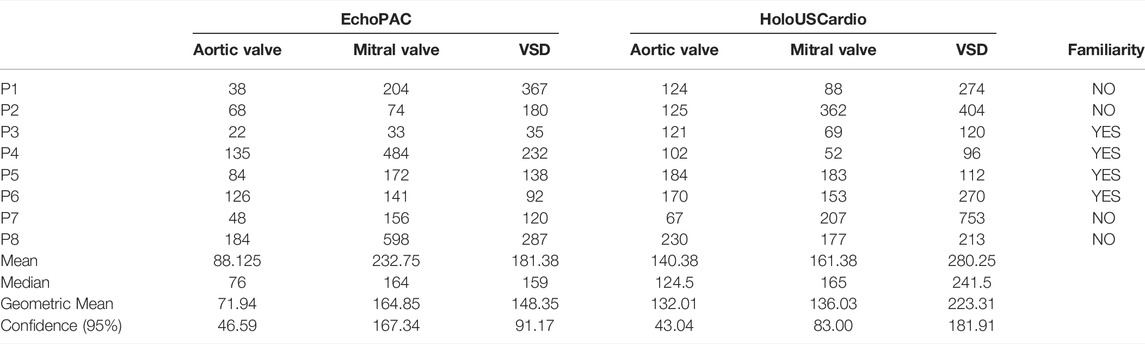
TABLE A1. Complete data of “times to orient” (seconds) of all tasks along with the mean, median, geometric means, and confidence intervals of 95% rounded off to 2 decimals. The familiarity column shows participants’ familiarity with mixed reality/virtual reality.
Appendix Table A2 presents recorded times to finish for all participants and tasks, along with participant familiarity information.
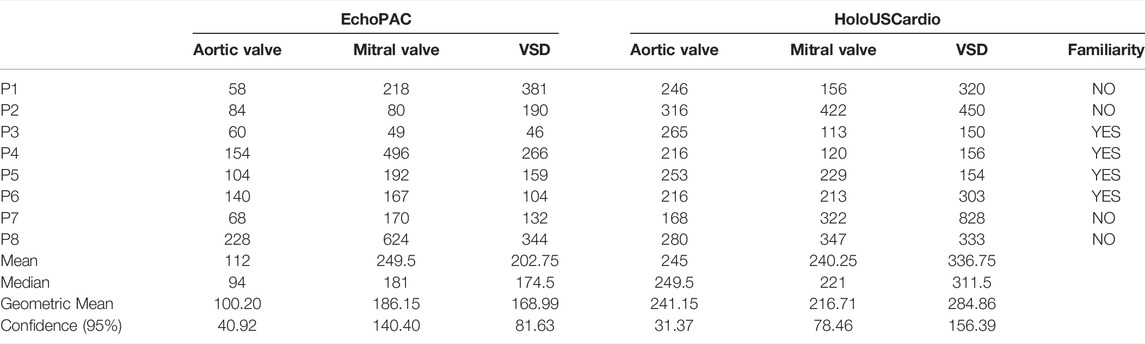
TABLE A2. Complete data of “times to finish” (seconds) of all tasks along with the mean, median, geometric means, and confidence intervals of 95% rounded off to 2 decimals. The familiarity column shows participants’ familiarity with mixed reality/virtual reality.
Appendix Table A3 presents all ratings by participants for all 10 questions.
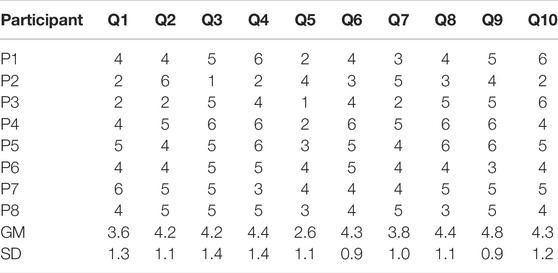
TABLE A3. Data of user ratings for each participant per question with their respective geometric means (GM) and standard deviation (SD).
Keywords: ultrasound, mixed reality, 3D echocardiography, orientation, medical visualization
Citation: Maddali D, Brun H, Kiss G, Hjelmervik JM and Elle OJ (2022) Spatial Orientation in Cardiac Ultrasound Images Using Mixed Reality: Design and Evaluation. Front. Virtual Real. 3:881338. doi: 10.3389/frvir.2022.881338
Received: 22 February 2022; Accepted: 31 May 2022;
Published: 25 July 2022.
Edited by:
Abhishek Gupta, Shri Mata Vaishno Devi University, IndiaReviewed by:
Sergey Shoydin, Siberian State University Geosystems and Technology, RussiaPierre Boulanger, University of Alberta, Canada
Copyright © 2022 Maddali , Brun, Kiss, Hjelmervik and Elle. This is an open-access article distributed under the terms of the Creative Commons Attribution License (CC BY). The use, distribution or reproduction in other forums is permitted, provided the original author(s) and the copyright owner(s) are credited and that the original publication in this journal is cited, in accordance with accepted academic practice. No use, distribution or reproduction is permitted which does not comply with these terms.
*Correspondence: Dharani Maddali , dharandm@ifi.uio.no