Are there limits to growth of tourism on the Caribbean islands? Case-study Aruba
 Sharona S. Jurgens
 Eric Mijts
 Anton Van Rompaey2
- 1Sustainable Island Solutions through Science, Technology, Engineering and Mathematics or (SISSTEM), Faculty of Arts and Sciences, University of Aruba, Oranjestad, Aruba
- 2Division of Geography and Tourism, Department of Earth and Environmental Sciences, Faculty of Sciences, KU Leuven, Leuven, Belgium
Mass tourism is a major driver of economic growth in the Caribbean. One major trade-off of this economic growth model is the loss of natural areas due to tourism activities and increasing urbanization. Aruba is one of the most tourist intense destinations within the region with a total of 1.1 million stay-over tourists in 2019. Moreover, this island has one of the largest population densities in the Caribbean and high-speed urbanization takes place in this formerly rural island state. Therefore, this study aims to assess the islands' carrying capacity in relation to its limited land resources by means of a geospatial methodological analysis coupled with a correlation analysis between socio-economic indicators and statistics. First, the past and present drivers and characteristics of urbanization are analyzed. Second, the correlation between socio-economic indicators and the number of tourists was assessed. Third, two future scenarios were developed to assess the maximum carrying capacity. From 1986 till 2020, Aruba's built environment increased from ~29–60 km2 and translates to one-third of the island. Expansion was characterized by sprawl in the earlier years and changed to infilling in the latter. Furthermore, the results indicate that all socio-economic indicators are strongly positive correlated to tourism. Lastly, the possible maximum physical carrying capacity for yearly visitors and number of inhabitants was calculated to be ~1.7 million and 150.000, respectively. We conclude that the proposed methodological framework is robust and adequate to serve as a low budget decision-making tool for sustainable tourism development on islands.
1 Introduction
Sustainable tourism, a field that emerged about three decades ago in response to the detrimental impacts of the rapidly expanding travel and tourism industry (Zolfani et al., 2015), has grappled with a persistent lack of consensus regarding its definition since its inception (Butler, 1999; Higgins-Desbiolles, 2018). The ongoing ambiguity in defining sustainable tourism stems from diverse perspectives within key disciplines and frameworks that address this multifaceted subject (Hardy et al., 2002; Lu and Nepal, 2009; Zolfani et al., 2015; Budeanu et al., 2016). Consequently, the interpretation of sustainable tourism relies heavily on the theoretical lenses and methodologies applied within various scholarly contexts. Within this study the definition by Butler (1999) – “tourism which is in a form which can maintain its viability in an area for an indefinite period of time” – is used. This definition implies a balance between economic development, environmental protection, and social equity.
While sustainable tourism has been a prevailing topic for over three decades, recent years have brought forth two novel concepts that have become critical issues for the world's major tourist destinations: overtourism and mass tourism. As defined by Capocchi et al. (2019), overtourism pertains to a tourism model that adversely affects the quality of life for local residents, with congestion and environmental degradation being directly linked to the level of visitation (Peeters et al., 2018; Dodds and Butler, 2019). On the other hand, mass tourism involves accommodating a substantial number of tourists, and though it doesn't inherently imply negative impacts, poorly managed mass tourism can still lead to environmental and cultural degradation (Vainikka, 2013; Hernández et al., 2016). These concepts universally suggest the necessity of defining limits for various tourism models to achieve sustainability. To address the associated concerns, one effective approach is to evaluate the carrying capacity.
The concept of carrying capacity relates to early approaches of the “limits to growth” theory (Meadows et al., 2005), which refers to the maximum level of visitor activity that an area can sustainably accommodate without causing irreversible environmental degradation or compromising the quality of the visitor experience (Saarinen, 2015). In destinations experiencing high tourist influxes there is a strong strain on natural resources, infrastructure, and local communities. This can lead to overcrowding, environmental degradation, and social tensions (Chakraborty, 2021). The theory highlights the necessity of recognizing and respecting the finite capacity of destinations to absorb tourism pressures, advocating for responsible tourism practices that prioritize environmental conservation, and socio-cultural integrity (Saarinen, 2015; Bambrick, 2018; Hayward, 2021). By acknowledging and managing these limits to growth, destinations can strive toward achieving sustainable tourism development that balances economic gains with the carrying capacity of the natural and cultural environment.
The Mediterranean region stands out as a focal point where the previously mentioned concepts have undergone thorough examination. Diverse studies within this region encompass a broad spectrum of topics, such as the study conducted by Leka et al. (2022). Their work delves into the Tourism Carrying Capacity (TCC), proposing it as a decisive tool for the sustainable management of densely populated coastal areas in Mediterranean islands. Utilizing the Pressure-State-Response framework, the suggested TCC method primarily focuses on environmental and manmade dimensions, incorporating predominantly tourism-specific variables.
Similarly, Vandarakis et al. (2023) utilized 17 indicators to evaluate and enhance the tourism attractiveness of the South Aegean region in Greece. These indicators were strategically categorized to represent physical-ecological, social-demographic, and political-financial contexts, aiming to address over-tourism's impact, alleviate natural environmental degradation, and foster sustainable development.
Other notable studies, such Zacarias et al. (2011) and Cupul-Magaña and Rodríguez-Troncoso (2017), have concentrated on Carrying Capacity (CC) within specific locations, such as protected areas or beaches. Their focus is on assessing potential impacts on ecological, social, and cultural environments. Tejada et al. (2009) employed geomorphological and socio-economic indicators, including beach stability, coastal morphodynamics, land use, and land use change, to evaluate the physical carrying capacity of coastal tourist destinations.
Given the maturity of the Mediterranean as a tourist destination, extensive data has been accumulated, resulting in data-driven and qualitative CC models. However, these models, while straightforward, are not directly applicable to the Caribbean region due to a scarcity of data. Hence, this paper introduces a robust and low-budget geospatial methodological analysis, specifically tailored to assess the carrying capacity of islands and regions heavily reliant on tourism in the Caribbean utilizing existing satellite data, socio-economic indicators and statistics.
1.1 The Caribbean
Mass tourism is a major driver of economic growth in the Caribbean (Cannonier and Burke, 2019). According to the World Tourism Organization (2018) tourism accounts overall for more than forty percent of the GDP shares in the Caribbean. This started after World War II when most of the islands strived toward self-sufficiency and self-reliance by reducing the export of agricultural crops with “high value” export services such as tourism, domestic manufacturing, or exploiting mineral resources like bauxite or petroleum (Marshall, 1982). Additionally, aviation accessibility to middle-class North Americans and Europeans expanded in the 1980s and expanded further in the 1990s with the availability of sea cruises (Wong, 2015). In 2019 the Caribbean islands hosted a total of 24 million stay-over tourists (World Tourism Organization, 2023), Figure 1 depicts the total stay over visitors per country.
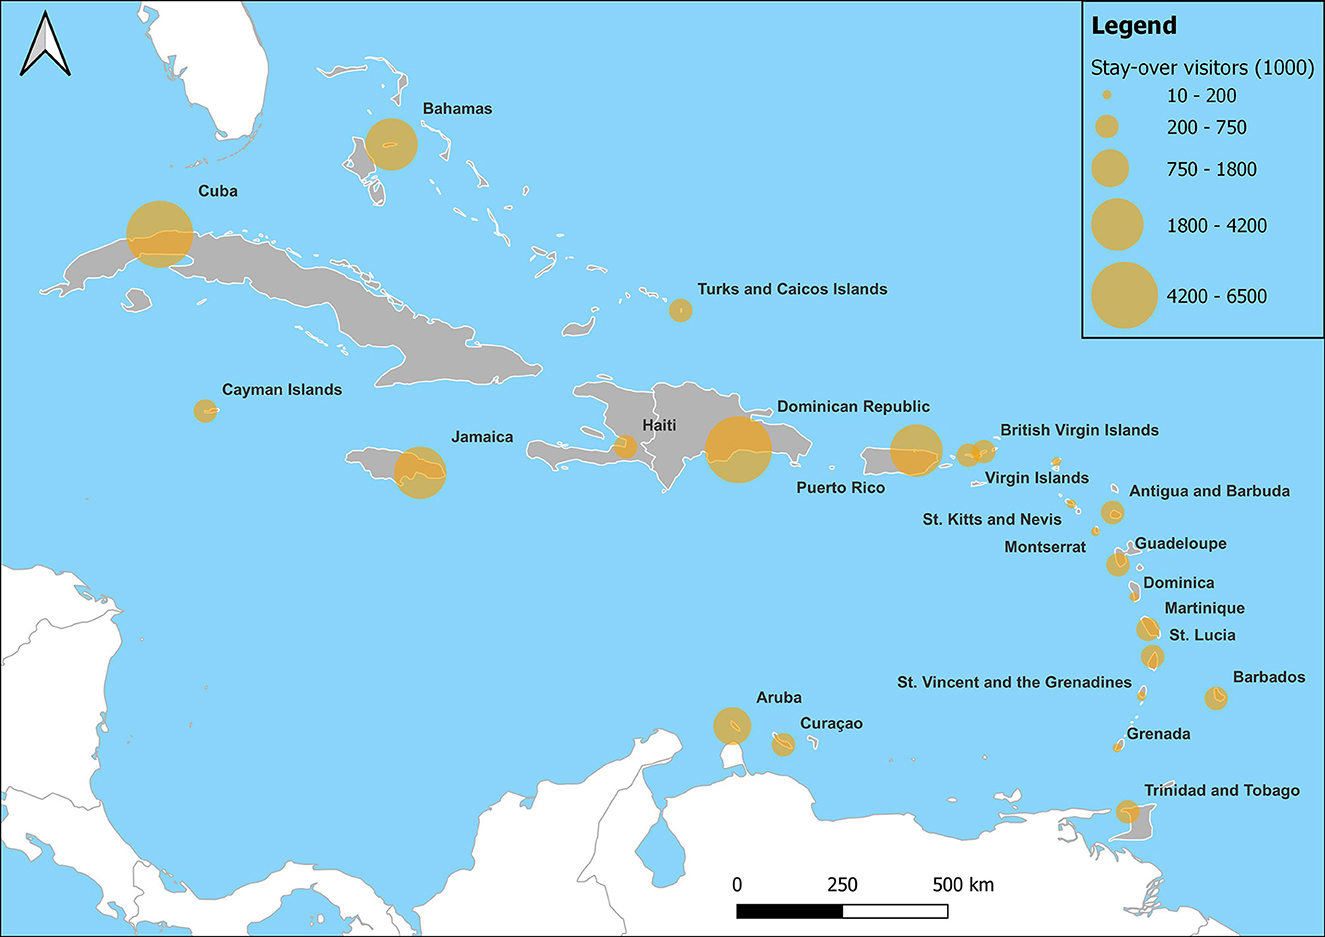
Figure 1. Overview of the total number of stay-over visitors in Caribbean countries in 2019.
Unfortunately, economic growth caused by tourism is often accompanied by negative social and environmental impacts (García-Ayllón, 2015; Briguglio and Avellino, 2019). One major trade-off is urbanization and the loss of natural areas, especially in small island states (SIS). Most islands environments have been largely impacted by their colonial history of serving as agricultural supplier for their colonizers. So, the islands are already at a disposition regarding environmental degradation (Pantin, 1999).
With tourism, islands unbeknownst continued extracting valuable resources from their environment. Unlike other well-known extractive activities such as mining and logging, tourism exhibits both direct and indirect impacts. The direct impact manifests as ecological damage, while the indirect impact manifests as the loss of cultural heritage (Bambrick, 2018; Hayward, 2021). For instance, the construction of hotels, resorts, and transportation infrastructure often requires significant land use changes. This can result in the displacement of communities, loss of agricultural land, and changes to the natural landscape (García-Ayllón, 2015; Drius et al., 2019). Similarly, the influx of tourists contributes to increased waste generation, including plastic waste, litter, and pollution, which in the case of islands can lead to further environmental degradation (Mohee et al., 2015). The work by, both, Loperena (2017) and Herva et al. (2020) provide great examples of tourism as extractive activity. With the extractive tourism activities the focus is often more on the economic outputs and less on the environmental impact (Hayward, 2021). According to Loperena (2017) this includes activities like outward-oriented production or marketing of natural and cultural resources for external consumption.
The present study focuses on Aruba as one of the smallest islands in the Caribbean. In 2019 Aruba received a total of ~1.1 million stay-over visitors (Centrale Bank van Aruba, 2022). Combined with a size of ~180 km2, the island ranks as one of the most tourist intense destinations of the region (Figure 2). During COVID-19 Aruba was one of the hardest hit economies, due to its strong reliance on tourism (International Monetary Fund. Western Hemisphere Dept, 2023). Over the past 2 decades multiple scholars have addressed the question whether the island has reached its carrying capacity due to the employed tourism model. In early 2000, the focus was on developing an environmental assessment method to preserve the natural landscape from further degradation by tourism activities (Schilstra and van Belle, 2003). Next, the carrying capacity was addressed in relation to sustainable tourism (Cole and Razak, 2009; Department of Economic Affairs, C. and I. of A., 2020). In 2020, Peterson addressed the carrying capacity from a political-economic perspective in relation to community wellbeing and over-tourism. The main conclusion drawn from those studies is that Aruba's mass tourism model needs to be adapted to combat further environmental and cultural degradation. The carrying capacity was never addressed in relation to limited land resources. According to Ratter (2018), the overshot of an island's carrying capacity can result from over-exploitation or degradation of already limited natural capital. Therefore, this research addresses the island's carrying capacity through a comprehensive approach that integrates geospatial analysis with correlation assessments of socio-economic indicators and statistics concerning available land resources. Here we consider available land as a finite natural resource and focus on the morphological aspect of urbanization, thus concentrating on the urban form in terms of total square kilometers of manmade structures. The research poses three key questions: (1) What are the past and present drivers and characteristics of land use change in Aruba? (2) How do different socio-economic indicators correlate to the influx of stay-over tourists? (3) What constitutes the potential maximum capacity for tourists on the island under different development scenarios?
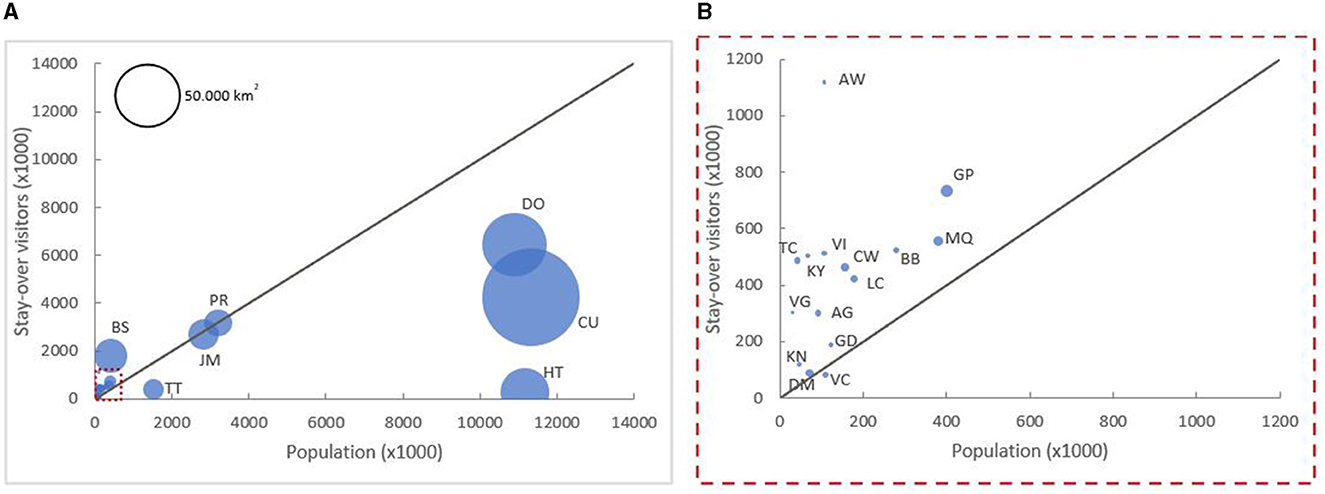
Figure 2. (A) Bubble plot relating total number of stay over visitors to population per Caribbean country in 2019. The bubble size represents the relative area. (B) Demonstrating the relatively high number of stay over tourists per head of the population and per surface unit (AI, Anguilla; AG, Antigua and Bermuda; AW, Aruba; BS, The Bahamas; BB, Barbados; VG, British Virgin Island; KY, Cayman island; CU, Cuba; DM, Dominica; DO, Dominican Republic; GD, Grenada; GP, Guadeloupe; HT, Haiti; JM, Jamaica; MQ, Martinique; MS, Montserrat; CW, Curaçao; PR, Puerto Rico; KN, St. Kitts and Nevis; LC, St. Lucia; VC, St. Vincent and the Grenadines; TT, Trinidad and Tobago; TC, Turks and Caicos islands; VI, Virgin Islands).
The initial question aims to unravel the island's developmental trajectory by quantifying the expansion of manmade structures over the years. The second question delves into understanding the catalysts behind these changes and how they align with the evolution of tourism on the island. Building on these insights, the final question seeks to assess the plausible maximum capacity, providing valuable perspectives for sustainable tourism planning and management.
Based on aforementioned discussion, this paper is structured as follows: Section 2 presents the study area, encompassing Aruba's, natural landscape, the tourism system, and the historical land use changes. Subsequently, Section 3 attempts to establish the proposed methodological framework, while Section 4 presents the obtained results. Finally, section 5 discusses the results and draws key conclusions.
2 Study area
2.1 Natural landscape
Aruba is a small island state situated in the Caribbean Sea at ~20 miles north of the coast of the Paraguaná Peninsula, Venezuela. Its latitudes are 12°25' - 12°25'30” and longitudes 69°52' - 70°04'. The island is 31 km long and 9 km wide and has a surface area of ~180 km2. The climate is semi-arid and largely characterized by varying annual rainfall between 400 to 900 mm. The average temperature fluctuates between 27° in the coldest months, December to February, and 32° in the summer months from July to August (Van Den Oever, 2000; Derix, 2016).
The Northeastern coastline is characterized by a rocky coast alternating between cliffs, dry riverbeds, and small sandy beaches, whilst the Southwestern coastline is characterized by beautiful long sandy beaches and fossilized limestone terraces (Schmutz et al., 2017). Furthermore, the island is continuously exposed to the north-east trade winds, resulting in higher wave energy on the rocky coast compared to the calmer southeastern sandy beaches (Van Den Oever, 2000; Fitzpatrick, 2015; Schmutz et al., 2017).
2.2 Tourism model
According to Cole and Razak (2009), Aruba's tourism has long been centered on the irresistible appeal of “sun, sand, and sea.” This allure is fostered by a harmonious blend of favorable climate, pristine beaches, a well-established tourism sector, robust public security measures, local entrepreneurial initiatives, a warm and welcoming atmosphere, and a substantial migrant population. With a notable level of foreign investment and control, Aruba has successfully developed a competitive tourism industry, underscored by its distinctive “One Happy Island” branding slogan (Schmutz et al., 2017; Peterson, 2020a).
The island's activities and attractions predominantly revolve around outdoor experiences, featuring a spectrum of watersports such as snorkeling, scuba diving, and windsurfing. Additionally, visitors can partake in off-road sightseeing tours, explore natural wonders like Arikok National Park, and visit cultural sites like Alto Vista Chapel.
In terms of tourism source markets, the United States holds a prominent position, serving as the primary source and contributing to 84% of the total stay-over visitors in 2021. Other key source markets include Venezuela, the Netherlands, and Canada (Centrale Bank van Aruba, 2022). Notably, Aruba's tourism sector experienced its most substantial growth from 1986 to 1996, surpassing the Caribbean's overall tourism growth rate 2-fold (Aruba Tourism Authority, 2021). During this period, the number of hotel rooms more than doubled, increasing from 2,776 to 5,625 (Cole and Razak, 2009; Murphy, 2011). Subsequently, the sector maintained consistent growth, occasionally experiencing brief slowdowns in response to various crises (Aruba Tourism Authority, 2021).
2.3 Historical land use change
Land us change in Aruba has been shaped by a complex interplay of historical events, economic transformations, and strategic government initiatives. The island's spatial development is characterized by key phases that reflect a shift in economic priorities and population dynamics.
The initial settlements in Aruba, influenced by geology and geomorphology, were geared toward facilitating subsistence agricultural practices, leading to limited urbanization on fertile soils (Derix, 2016; Pan et al., 2016). The 1920s marked a pivotal shift as Aruba transformed into a multiethnic society with the establishment of the Lago Refinery, attracting a large influx of immigrants to San Nicholas which is located relatively close to the southeastern tip of the island (Ridderstaat, 2007; Derix, 2016; Bowen, 2019). This resulted in a transition from a predominantly agricultural population living in rural settlements to a urban-based population engaged in industrial and service activities. The 1980s was characterized by negotiations for independence and the closure of the refinery, prompting a substantial outmigration (Ridderstaat, 2007; Central Bureau of Statistics, 2010). In response, the Aruban government strategically turned toward tourism as the main economic pillar, further diversifying the island's demographic landscape through attraction of migrant workers (Cole and Razak, 2009; Department of Economic Affairs, C. and I. of A., 2019). Although Aruba was not extensively used for agriculture during colonization, it followed the broader Caribbean trend of concentrated development concentrated along coastal strips, often encroaching upon ecologically sensitive and productive areas (Thomas, 2013). Land transformation, including deforestation, resource depletion, and monocultivation has led to the loss of natural capital (Derix, 2016; Ratter, 2018). Overtime, the continued immigration, population growth experienced, and rural to urban migration have increased fragmentation of the island's natural landscape (Cole and Razak, 2009; Derix, 2016; Central Bureau of Statistics, 2022).
3 Materials and methods
The proposed methodology involves an initial geospatial analysis of various land use classes, primarily aimed at delineating the morphological urban extent of the area. Subsequently, a correlation analysis of socio-economic indicators and statistics is conducted. Building upon the insights derived from this analysis, the potential maximum physical carrying capacity is calculated. This computation integrates existing population projections, tourism growth aspirations, and spatial plans, offering a comprehensive perspective on the sustainable development and capacity assessment of the island (Figure 3).
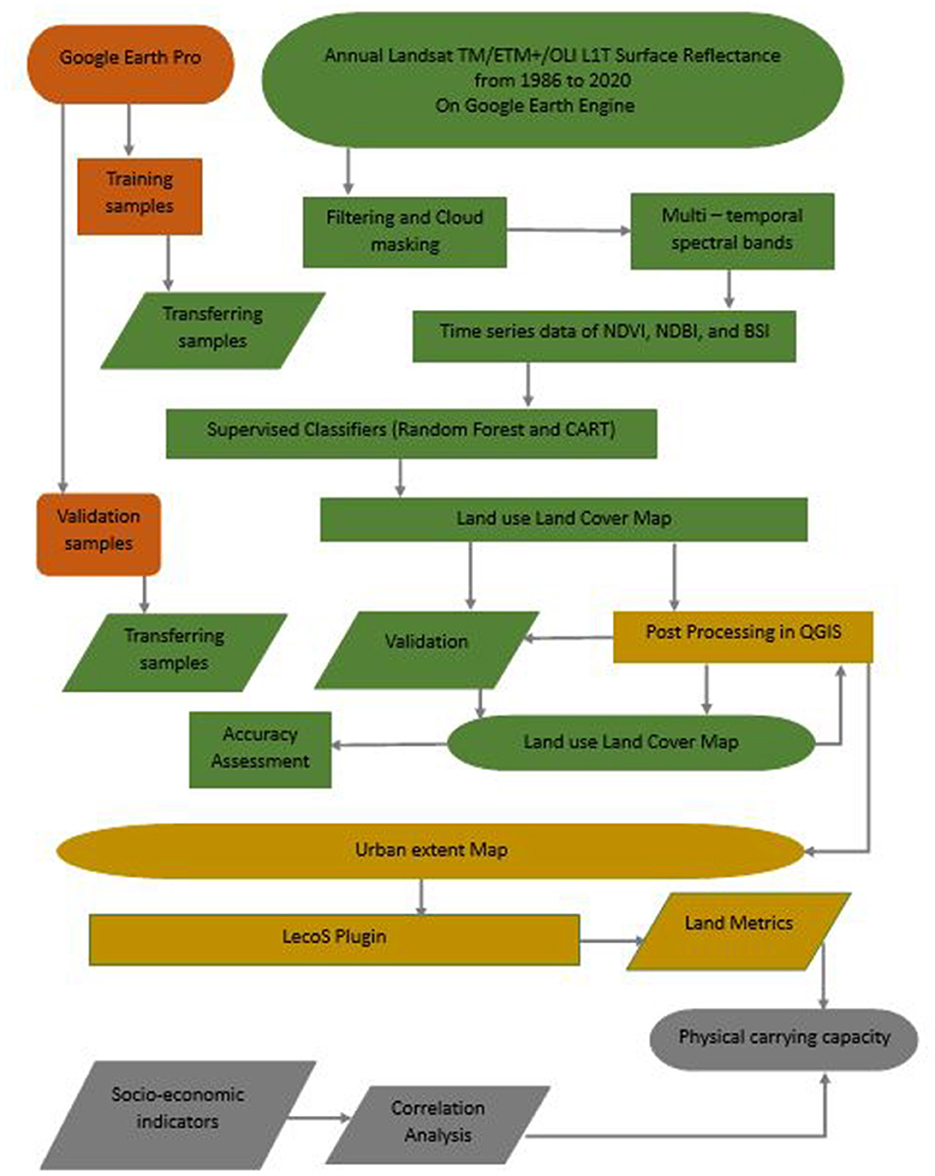
Figure 3. Schematic overview of methodological framework.
3.1 Geospatial analysis
Geographical data was obtained from United Nations Geological Survey (USGS) through the Google Earth Engine software and used to map urban extent for Aruba from 1986 until 2020. Since the study is aimed to include historical urban extent, we decided to use images obtained by the Landsat satellites. For this study, the most advanced sensor was used during an assessment window of 10 years. Thus, resulting in 4 time slots namely, 1980–1990, 1991–2000, 2001–2010, and 2011–2020. The land-use classes distinguished are urban, vegetation, water, and bare ground (including beaches).
The methodology used to produce the maps is derived from Liu et al. (2020) and adapted to suit the purpose of this study. The main adjustment is the creation of both training and validation data. Instead of using Open Street Maps (OSM) we use Google Earth Pro as a reference to accommodate the production of historical training and validation data by utilizing google earth's historical imagery. In addition, 3 indices are included to improve classification of the built environment, namely Normalized Difference Vegetation index (NDVI; Eq. 1), Normalized Difference Built-up Index (NDBI; Eq. 2), and the Bare Soil Index (BSI; Eq. 3). Finally, the data is classified by means of Random Forest (RF) and Classification and Regression Trees (CART).
Post processing is predominantly performed in QGIS (Białowieża, version 3.22.8) and Microsoft Excel. Within QGIS change maps are analyzed to create urban extent maps. From these maps total land cover (Aurban), urban intensity index (UIindex), urban growth (Ugrowth), and the average annual expansion rate (R) are determined. The Urban Intensity Index measures the built-up density of the study area (Eq. 4), whilst urban growth calculates the absolute growth percentage (Eq. 5), and rate (R) calculates the yearly expansion rate over a given period(n) (Eq. 6).
Furthermore, the LecoS plugin in QGIS (Jung, 2016) was used to calculate various land metrics providing important insights on the organization of space. The metrics were selected to obtain 3 main characteristics of urban areas, namely absolute size, relative size, and complexity. The corresponding selected features are listed in Table 1.
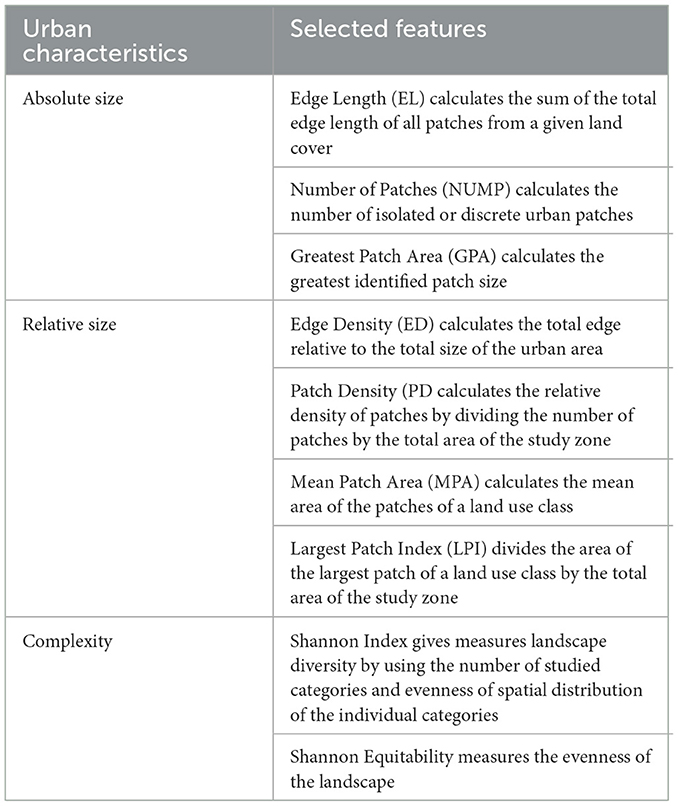
Table 1. Selected urban characteristics and corresponding features.
3.2 Correlation analysis
Socio – economic data was obtained from the Central Bureau for Statistics (CBS), the Centrale Bank van Aruba (2022), World Tourism Organization (2023), and World Bank. Correlation was analyzed through descriptive statistics and tested with the Spearman correlation method. This method computes the correlation between the rank of tourism numbers and the rank of socio-economic indicators and statistics. The data range is from 1986 till 2020.
3.3 Scenario development
To assess the maximum carrying capacity of the islands in relation to the available land, two future scenarios were developed based on the land allocations within the Spatial Development Plan 2019 (Directie Infrastructuur en Planning, 2019). Scenario 1 represents a conservative approach by restricting expansion beyond the currently developed areas, whilst Scenario 2 moderately expands allowing low-intensity build-up considering current population and infrastructure growth scenarios. The scenarios were developed for the year 2030. The numbers used for the population projections by 2030 are based on the 20-year revised outlook performed by CBS in 2014. The outlook projected a total of 3 population scenarios: low – 102,768, moderate – 132,225, and high – 146,674 (Central Bureau of Statistics, 2014). To establish the maximum number of stay-over visitors by 2030, the growth rate recommended by the Sustainable Travel International (2018) was employed, as it was derived from inputs derived from stakeholders. The two suggested models were the desired model and the threshold model. The desired model is sustainable in nature and strives toward a desirable ideal in which the number of visitors that visit at the same time does not cause destruction to local resources or negatively impact the living experiences of the inhabitants. Contrarily, the threshold model strives for the maximum economic benefit by continuing the already unsustainable growth model. For the desired model a 1% “Year Over Year” (YOY) growth was selected for stay-over visitors vs. a 3.7% YOY growth for the threshold model. These growth rates were used to calculate the projected number of stay-over visitors by 2030 with the formula listed in Eq. 7, with Y representing the number of stay-over visitors, parameter a corresponding to the growth rate, t0 representing the reference year, and ti corresponding to the target year. The different projections were then used to calculate the possible population and tourism densities.
4 Results
4.1 Geospatial analysis
Land use/Land cover maps were classified for the years 1986, 2000, 2010, and 2020. Table 2 presents the performance of the Random Forest (RF) and Classification and Regression Tree (CART) supervised classification models by means of the overall accuracy and kappa index. The results clearly indicate that the RF classifier outperformed the CART model. Therefore, the RF classifications were used to calculate urban extent of the different years depicted in Figure 4.
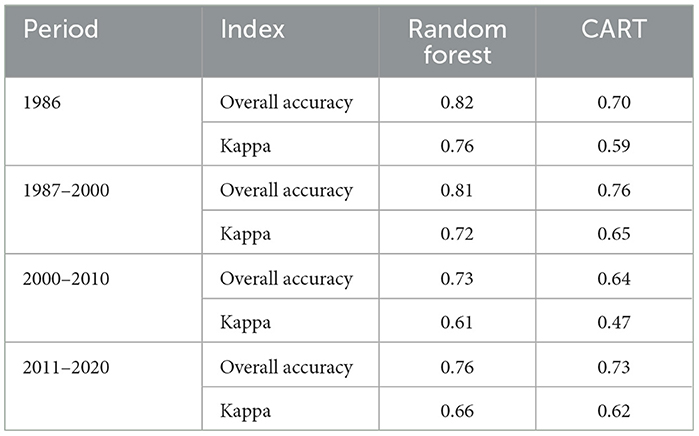
Table 2. Accuracy and Kappa index for produced land use/land cover maps.
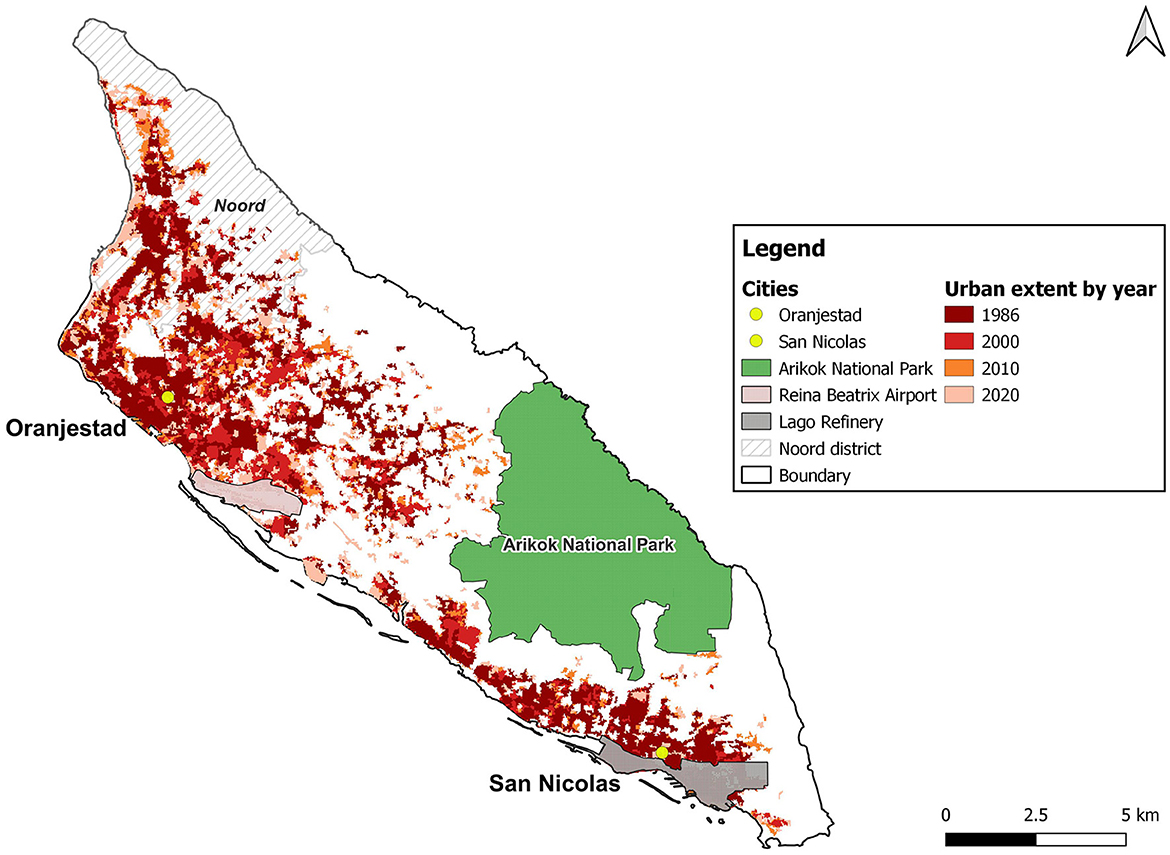
Figure 4. Urban extent map of Aruba from 1986 till 2020.
Only two compatible images over the period 1980–1990 are available. This puts the starting point of our analysis in 1986, when only 29.03 km2 was developed (see Table 3). Between 1987 and 2000 ~12 km2 in built-up was added, followed by 5.55 km2 over the next decade and 12.14 km2 between 2011 and 2020. Hence, urban intensity (UI) doubled over 40 years. Table 3 further illustrates varying absolute urban growth (Ugrowth) percentages, from 39% in 2000, to 13% in 2010, and 26% in 2020. The average annual expansion rate (R) varies similarly to Ugrowth.
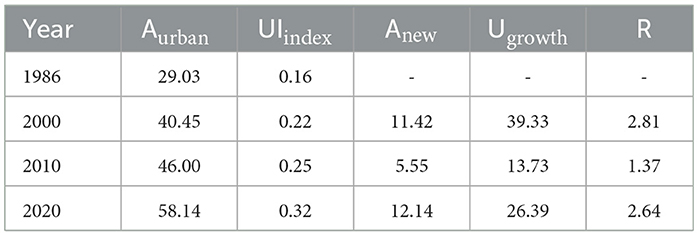
Table 3. Urban extent metrics.
Although expansion between 1987–2000 and 2011–2020 is roughly equal, the absolute growth and expansion rate contribute differently to urbanization. Urban development increased faster over the first period. Interestingly, this corresponds to the population change depicted in Figure. From this Figure 5 can be deduced that the population increased considerably over the studied period, with the largest change observed between 1984 and 1995. Noticeable are the large outmigration from 1984 to 1985 and the huge influx from 1986 to 1998. Moreover, in the third and fourth decades the population continued to increase but growth diminished proportionally compared to the previous intervals. Altogether Figure shows that population growth is largely controlled by migration, as natural growth stays relatively constant over the years.
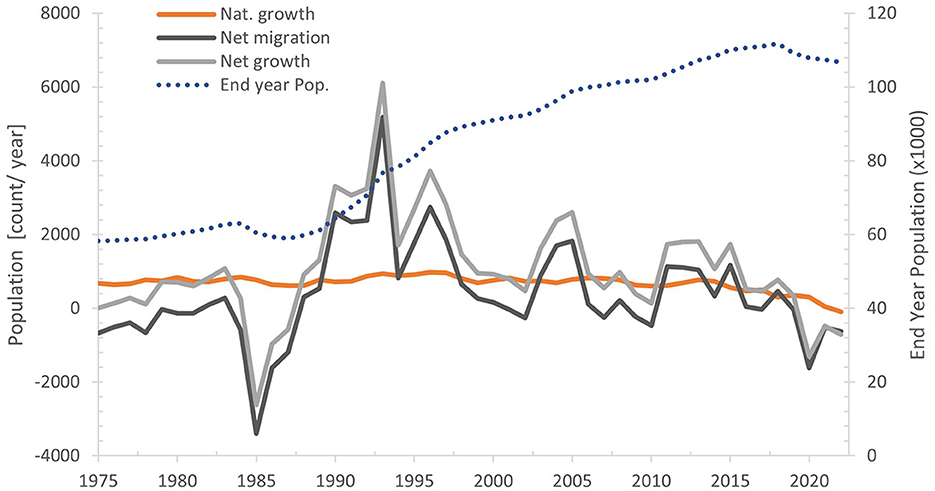
Figure 5. Population change from 1972 to 2020: presented are natural growth, net migration (immigration – emigration), net growth (Nat growth + Net migration), and the total population at the end of the year excluding the ~17,000 undocumented (HIAS Aruba staff, 2022).
Upon inspection of urbanization characteristics summarized in Table 4, various trends are revealed. The characteristics related to absolute size, Edge Length (EL) and Greatest Patch Area (GPA) increased over the years, whilst Number of Patches (NUMP) decreased. Likewise, the features related to relative size, Mean Patch Area (MPA) and Largest Patch Index (LPI) increased, whilst Edge Density (ED) and Patch Density (PD) decreased. In contrast, both features related to the complexity of landscape imprint increased over the years.
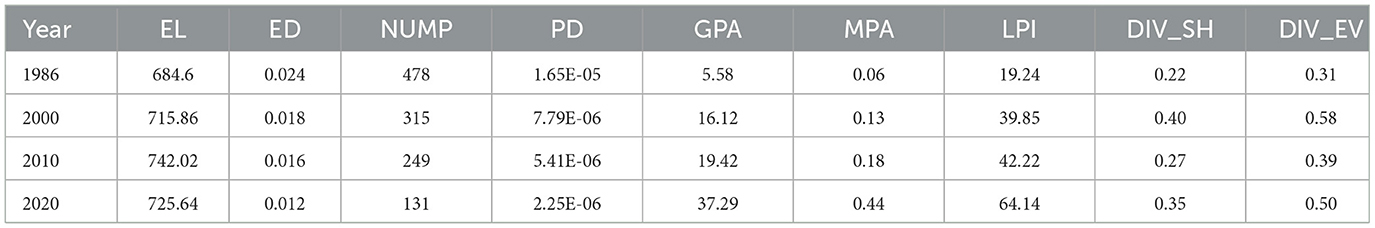
Table 4. Land metrics.
The trends observed in GPA and NUMP both indicate that urbanization occurred close to already existing areas. Additionally, the increase in MPA and LPI further strengthens this trend. Correspondingly, Figure 4 illustrates a patchy landscape in 1986 filled in with build-up from the consecutive years, thus, moving from a relatively sprawled landscape to a more compacted one.
The third and final characteristics which determine landscape complexity, the Shannon index (Div_SH) and the Shannon Equiability (Div_EV), corroborate the observed trend that the landscape improved in uniformity between 1986 and 2020, thus is less complex.
Despite the increased landscape uniformity, Figure 4 still shows an increase in new built-up distant from existing, especially in 2020.
4.2 Correlation analysis
The correlation analysis is used to assess the relation between socio-economic indicators and the number of annual stay-over visitors (Figure 6). In plot A, the annual mid-year population is plotted as a function of annual stay-over visitors. Obvious from this graph is that tourism started quite slowly in 1986 and intensified quickly between 1990 and 2000. From 2000 onwards, the number of tourists continued increasing at a slower rate and is currently moving toward a plateau. The outlier in this plot coincides with 2020, which clearly demonstrates the impact of the COVID-19 pandemic as travels abruptly ceased after the first quarter of that year.
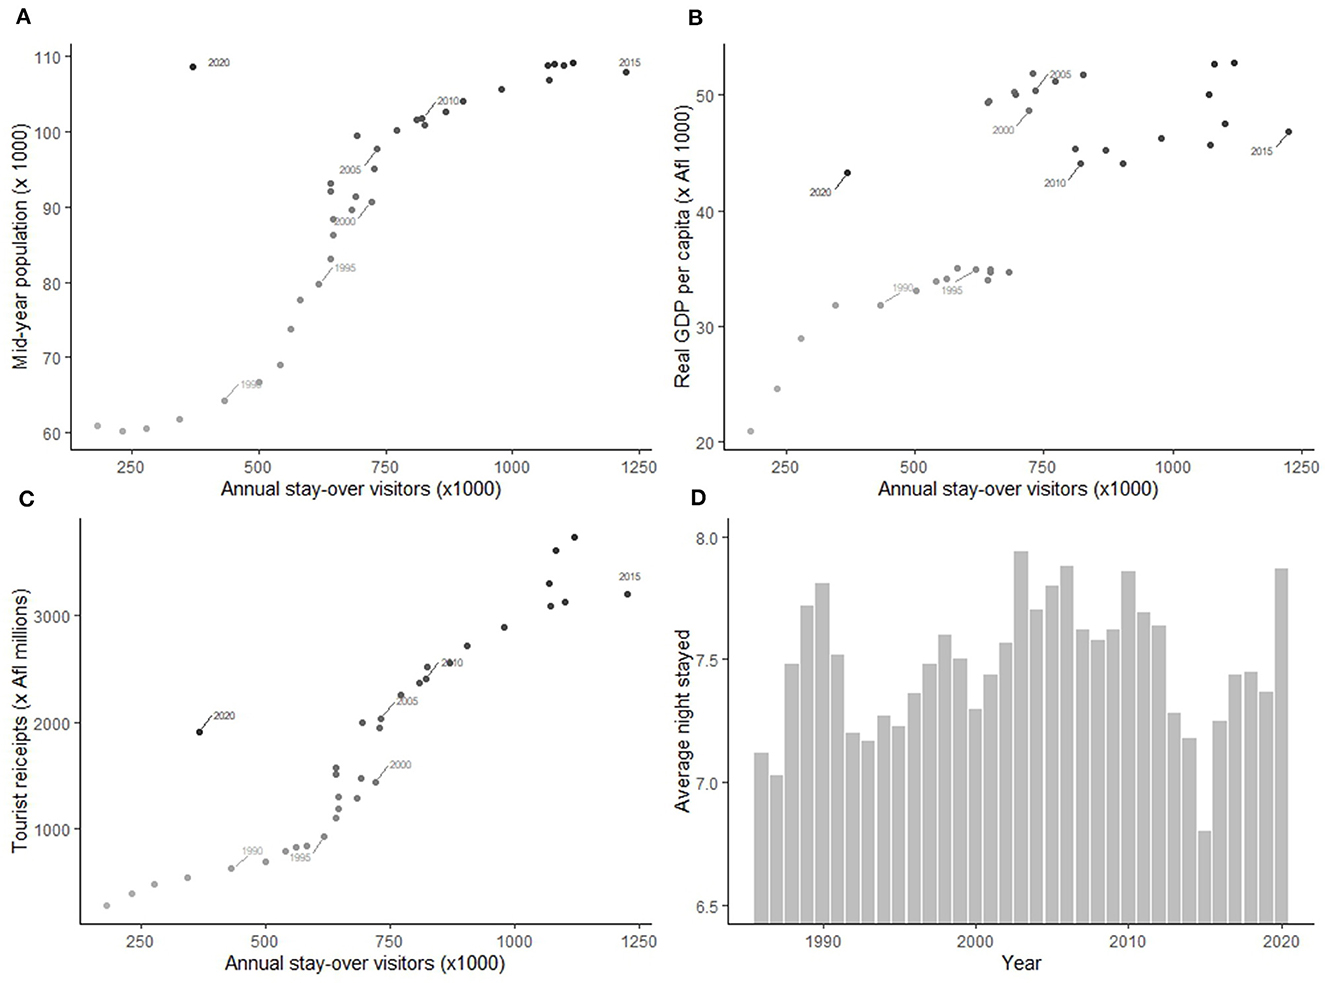
Figure 6. (A–C) Overview of socio-economic indicators vs. corresponding annual number of stay-over visitors from 1986 until 2020. (D) Overview of annual averaged nights logged by stay-over tourists.
Graph B illustrates the relationship between annual stay-over visitors and Real GDP per capita. The graph reveals four distinct clusters. In the initial 4 years, Real GDP per capita surged from Afl 20,950 to Afl 31,880. Moving to the second cluster (1990–1999), GDP fluctuated within the range of Afl 31,880 and Afl 35,000. The third cluster (2000–2008) saw GDP fluctuations between Afl 48,660 and Afl 51,730. Lastly, in the fourth cluster (2010–2019), the range varied from Afl 43,130 to Afl 55,220. Overall, the presented graph does not reveal any discernible relationship.
When it comes to the relation between stay-over visitors and their expenditure (plot C) the observed trend is quite continuous compared to the trends observed in plot B. Despite this continuous pattern, four distinct periods can be distinguished. In the initial decade, tourism income steadily increased from Afl200 million to Afl900 million in 1995, followed by a faster growth rate in the subsequent decade from Afl1 billion to Afl2 billion in 2006. The next increment is from 2007 to 2013, starting from Afl2.2 billion in 2007 to Afl2.8 billion in 2013. From 2014 onwards the income increased from Afl3 billion to Afl3.7 billion in 2019. Although 2020 is an outlier, the tourism income in that year still was Afl1.9 billion, indicating that the changes observed over the different periods are probably due to an increase in disposable income.
Although all socio-economic variables shown in Figures 6A–D exhibited significant correlations with the number of stay-over tourists, the analysis above clearly indicates that the relation between Real GDP per capita and the annual influx of stay-over tourist is not straightforward. The final graph in Figure 6D depicts the average number of nights visitors spend on the island. Although this plot can also be divided in 4 distinct periods, the periods do not align with those observed in Figure 6C. Here the average duration of stay on the island increased over the first 6 years, followed by a relatively low and fluctuating trend between 1991 and 2000. From 2001 the time spend on the island increased again until 2012, peaking in 2003 at an average of 7.9 nights per visit. Between 2013 and 2019 the average fluctuates around 7.3 nights per visit. Like the other graphs, 2020 can be considered an outlier because in that year the average length tourists stayed on the island increased substantially to 7.8. This ranks second over the entire studied period from 1986 to 2020.
4.3 Future urban scenarios
The two scenarios explored are based on the development plan of 2019, taking into consideration the different allocations. In Scenario 1, the emphasis is on preserving existing ecosystems by confining urban development to extensively built areas. This scenario allocates ~72 km2 for urban areas and 107 km2 for nature conservation. On the other hand, Scenario 2 is much more lenient, preserving ~74 km2 of nature and designating 104 km2 to urban development (Figure 7). The second scenario is comparatively more permissive than the first, as it assigns an extra 34 km2 for urban development.
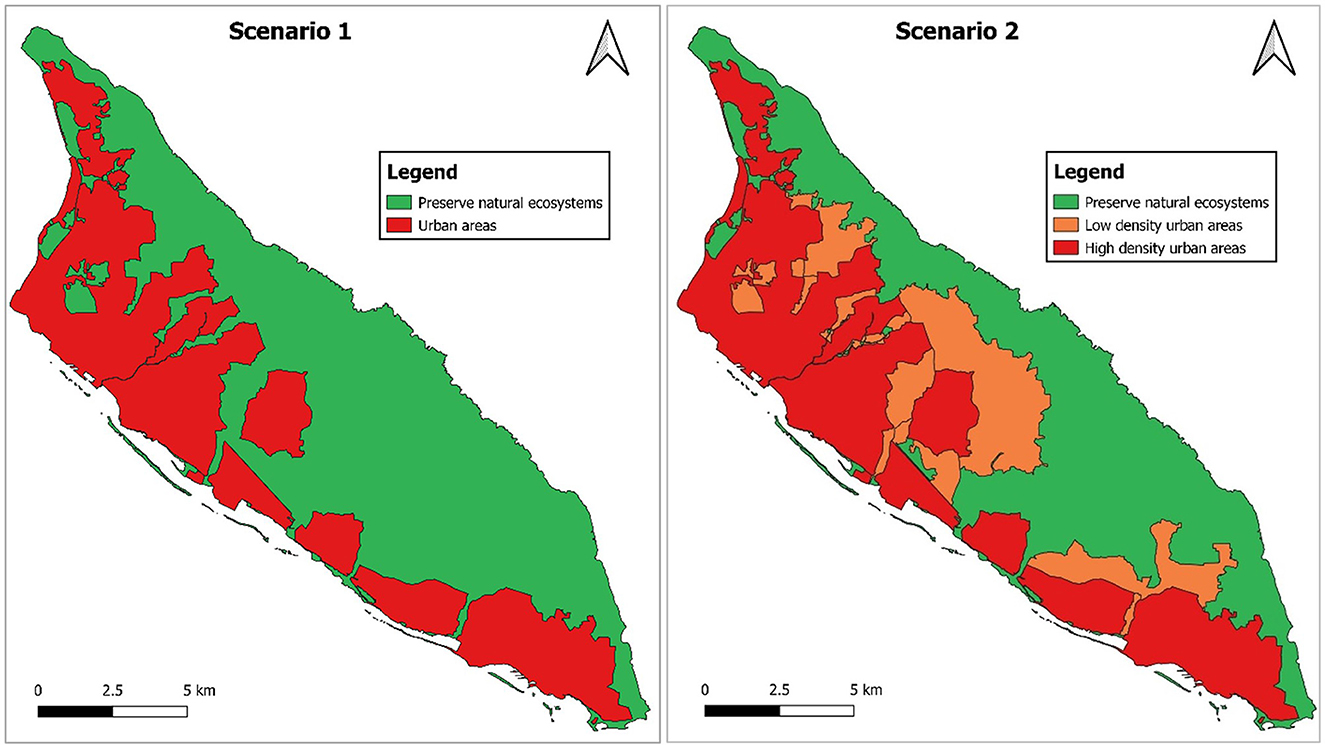
Figure 7. Restrictive (Scenario 1) and conservative (Scenario 2) built-up scenarios by 2030.
Table 5 displays the calculated population densities in urban areas for both Scenario 1 and Scenario 2. As mentioned before these 3 projections are based on demographic extrapolations of CBS. Under Scenario 1, a moderate population projection of 132,225 translates to a population density of 1836 p/km2. Conversely, under Scenario 2, the same projection corresponds to a density of 1271 p/km2. Likewise, a high population projection of 146,674 equates to 2036 p/km2 and 1410 p/km2 respectively. In perspective, the population density in urban areas was ~1862 p/km2 in 2020.
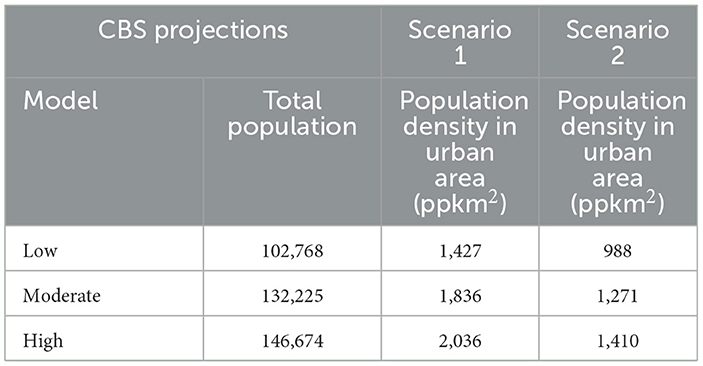
Table 5. The calculated possible population densities in urban areas for the different scenarios by 2030.
The maximum projections for tourism are based on two growth models, namely the desired model and the threshold model. Using 2017 as the reference year, the possible growth by 2030 for both models equates to 1,218,383 and 1,716,841 stay-over visitors for the desired and the threshold model, respectively. This translates to a stay-over visitors density of 6769 and 9538 tourists/km2 respectively. In perspective, the tourism density in 2019 was 6217 tourists/km2.
5 Discussion and conclusions
The results presented in this study indicate that ~29 km2 Aruba was built in 1986. Over four decades Aruba's urban area increased to one-third, 60 km2 out of 180 km2.Combined with the area occupied by the National Park, around 36 km2, half of the island is already designated. Furthermore, the calculated land metrics used to characterize the built environment, show that the morphological characteristics of urbanization changed over time from a highly sprawled landscape to a more homogeneous landscape. The absolute size of features like Greatest Patch Area (GPA) increased while the Number of Patches (NUMP) decreased over time, indicating that new built-up was created near existing areas (Table 4). However, the landscape still reflects sprawled built-up toward the northeastern coast. The reason is that the government purposefully designated those areas as countryside, an area to be used for both agriculture and sprawled built-up (Directie Infrastructuur en Planning, 2019). Noteworthy is that in the Spatial Development Plan the government also designated other areas containing important ecological structures to urban areas and explicitly mentioned that those structures must be preserved. From this we can deduce that some leniency is offered to facilitate new built-up in areas high in biodiversity to deal with the limited available land.
Inspection of demographic change shows that urbanization in Aruba is mostly driven by migration. Contrary to mainland countries, urbanization in Aruba is not defined by a rural – urban dichotomy (McGranahan and Satterthwaite, 2014), but controlled by in- and outmigration of economic prosperity and high quality of life seekers (Cole and Razak, 2009; Peterson, 2020a). From the literature it is apparent that these venturers are indispensable since the initial settlement of Aruba (Ridderstaat, 2007; Fitzpatrick, 2015; Derix, 2016). Moreover, Figure 5 clearly illustrates the impact of tourism as economic growth model on the demographic changes from 1986 onwards. Especially, the first peak around 1993 demonstrates the direct impact of tourism growth on demography. This relation between migration and the number of stay-over tourists is further corroborated by the plot in Figure 6A. From this graph it is obvious that the population increased concordant with the number of tourists. However, the plot also indicates that both at the onset as well as further down the line there are tipping points to consider. This observed S-trend is typical for small island tourism destinations (Pantin, 1999).
Although tourism numbers continued to increase after 2012, the population reached a plateau. Furthermore, an inspection of Figure 5 shows that after 1993 net migration decreased overall over time with 2020 as the major pit. The COVID-19 pandemic ceased all tourism activities resulting in a considerable outmigration. Nevertheless, the end-year population also indicates a decreasing trend from 2018 onwards, suggesting a threshold has been reached between population and the number of stay-over tourists (Vanegas and Croes, 2003).
The results presented in Figure 6B suggest that there is no clear relation between annual stay-over tourists and Real GDP per capita, while the relation between annual stay-over visitors and tourism receipts show a relation of the S-curve. Because of the data limitations it is difficult to pinpoint the exact cause of this fluctuating trend, but based on literature we can state that Aruba's tourism is volatile, highly competitive, and unforgiving (Kempadoo, 1999; Vanegas and Croes, 2003; Murphy, 2011; Ridderstaat et al., 2014; Peterson, 2020b). According to Peterson (2020b), Aruba is experiencing an exhaustion effect. Various studies by Sustainable Travel International (2018) conclude that Aruba has reached or surpassed its carrying capacity, overstretching its resources beyond sustainable levels. Continuing this path will lead the island to deterioration on both social and environmental levels (Stoffelen and Ioannides, 2022).
Although the alarm regarding Aruba's tourism had been sounded over a decade ago already (Croes, 2006; Cole and Razak, 2011), the tourism growth model still prevails to this day. Since 2018 plans have been made to shift the model to one that attracts high value – low impact tourists, yet instead of working toward increasing the revenue by encouraging economic linkages with other local industries (Sinclair-Maragh and Gursoy, 2015), growth models are discussed by various tourism entities (Sustainable Travel International, 2018; Aruba Tourism Authority, 2021). Therefore, we have presented two scenarios to provide an overview of developmental possibilities. Based on analysis of the scenarios presented, both the high population and threshold model will most definitely lead to deterioration of the island's ecosystems. For the demographic projections, the goal should be to strive for a moderate growth model under either scenario because the population density in scenario 1 is closest to the current density. Furthermore, when evaluating the overall population trend observed in Figure 5, it is obvious that the projected population growth by 2030 might be extreme as from 2018 onwards total population has been declining. The same is observed for the desired tourism growth model. Based on the desired growth model the number of stay-over tourists by 2030 would be 1.2 million, which is relatively close to the 1.1 million reached in 2019. The scenarios presented in this study are simplistic in nature, yet still provide valuable insight into possible future prospects. The models provide a good example that can be used as targets for sustainable tourism management and land use management in general.
Finally, besides the aforementioned shortcomings, this study has some additional limitations such as the low spatial resolution of the satellite data, causing under and over-classification of land-use due to the presence of mixed pixels. Higher data resolution would have resulted in less uncertainty and higher accuracy, especially in the earlier classifications. Furthermore, the direct impact of tourism on the landscape was not addressed. Such an analysis requires more detailed data such as the space visitors need, and the average time spent on the beach or other attractions. Assessing the carrying capacity entails much more than calculating population and tourism density, the psychology of the tourism crowd must also be considered (Stoffelen and Ioannides, 2022). Likewise, a deeper assessment is needed of forces driving changes at the urban level than only observing the change in demography (Thomas, 2013).
This study demonstrated that by 2020, approximately one-third, 60 km2, of Aruba consisted of built environment. From 1986 till 2020, expansion was characterized by urban sprawl in the earlier years and changed to infilling in the latter. Furthermore, the results indicated that all socio-economic indicators were strongly positive correlated to tourism. Based on extrapolation, the island's possible maximum physical carrying capacity for annual stay-over visitors and the number of inhabitants were calculated to be ~1.7 million and 150.000, respectively. To conclude, through the performed analysis all research questions were answered demonstrating that the proposed method allows for a comprehensive understanding of the impact of tourism on the physical carrying capacity of an island without having access to richness in data that similar studies (Tejada et al., 2009; Zacarias et al., 2011; Leka et al., 2022; Vandarakis et al., 2023) had access to.
Data availability statement
The raw data supporting the conclusions of this article will be made available by the authors, without undue reservation.
Author contributions
SJ: Conceptualization, Investigation, Methodology, Writing—original draft, Visualization, Formal analysis. EM: Funding acquisition, Supervision, Writing—review & editing. AV: Conceptualization, Supervision, Writing—review & editing.
Funding
The author(s) declare that financial support was received for the research, authorship, and/or publication of this article. This research was conducted with the financial support of the European Union through the 11th European Development Fund (FED/2019/406-549) for the Sustainable Islands Solutions through Science, Technology, Engineering, and Mathematics (SISSTEM) project. Its contents are the sole responsibility of the authors and do not necessarily reflect the views of the European Union.
Acknowledgments
The authors wish to extend their gratitude to Dr. Lisa-Marie Hemerijckx from KU Leuven (Belgium) for her constructive feedback on a previous version of this manuscript.
Conflict of interest
The authors declare that the research was conducted in the absence of any commercial or financial relationships that could be construed as a potential conflict of interest.
Publisher's note
All claims expressed in this article are solely those of the authors and do not necessarily represent those of their affiliated organizations, or those of the publisher, the editors and the reviewers. Any product that may be evaluated in this article, or claim that may be made by its manufacturer, is not guaranteed or endorsed by the publisher.
References
Aruba Tourism Authority (2021). Corporate Plan: Tourism Recovery Marketing Plan 2021. Oranjestad: Aruba Tourism Authority.
Bambrick, H. (2018). Resource extractivism, health and climate change in small islands. Int. J. Clim. Change Strat. Manage. 10, 272–288. doi: 10.1108/IJCCSM-03-2017-0068
Bowen, D. S. (2019). In the shadow of the refinery: an American oil company town on the Caribbean island of Aruba. J. Cult. Geograph. 36, 49–77. doi: 10.1080/08873631.2018.1502398
Briguglio, L., and Avellino, M. (2019). “HAS OVERTOURISM REACHED THE MALTESE ISLANDS?” in Occasional Papers on Islands and Small States 01, 1–27.
Budeanu, A., Miller, G., Moscardo, G., and Ooi, C. S. (2016). Sustainable tourism, progress, challenges and opportunities: an introduction. J. Clean. Prod. 111, 285–294. doi: 10.1016/j.jclepro.2015.10.027
Butler, R. W. (1999). Le tourisme durable: un état de la question. Tourism Geograph. 1, 7–25. doi: 10.1080/14616689908721291
Cannonier, C., and Burke, M. G. (2019). The economic growth impact of tourism in small island developing states—evidence from the Caribbean. Tourism Econ. 25, 85–108. doi: 10.1177/1354816618792792
Capocchi, A., Vallone, C., Pierotti, M., and Amaduzzi, A. (2019). Overtourism: a literature review to assess implications and future perspectives. Sustainability 11, 3303. doi: 10.3390/su11123303
Central Bureau of Statistics (2010). The Social Atlas of Aruba 2010. Available online at: chrome-extension://efaidnbmnnnibpcajpcglclefindmkaj/https://cbs.aw/wp/wp-content/uploads/2015/10/Social_Atlas_Aruba_2010.pdf (accessed April 13, 2020).
Central Bureau of Statistics (2014). Population Projections Revised 3. Available online at: www.cbs.aw (accessed June 23, 2022).
Central Bureau of Statistics (2022). Mapping Census 2020: Social-Demographic Diversity in Aruba. Available online at: https://storymaps.arcgis.com/stories/0f88c5a5462e4a37906fdae232490de4 (accessed February 7, 2022).
Centrale Bank van Aruba (2022). Annual Statistical Digest 2021. Available online at: chrome-extension://efaidnbmnnnibpcajpcglclefindmkaj/https://www.cbaruba.org/readBlob.do?id=11992 (accessed July 14, 2022).
Chakraborty, A. (2021). Can tourism contribute to environmentally sustainable development? Arguments from an ecological limits perspective. Environ. Dev. Sust. 23, 8130–8146. doi: 10.1007/s10668-020-00987-5
Cole, S., and Razak, V. (2009). How far, and how fast? Population, culture, and carrying capacity in Aruba. Futures 41, 414–425. doi: 10.1016/j.futures.2008.11.013
Cole, S., and Razak, V. (2011). Island awash–sustainability indicators and social complexity in the Caribbean. Q. Life Commun. Indic. Parks Recr. Tour. Manage. 21, 141–161. doi: 10.1007/978-90-481-9861-0_8
Croes, R. R. (2006). A paradigm shift to a new strategy for small island economies: embracing demand side economics for value enhancement and long term economic stability. Tourism Manage. 27, 453–465. doi: 10.1016/j.tourman.2004.12.003
Cupul-Magaña, A. L., and Rodríguez-Troncoso, A. P. (2017). Tourist carrying capacity at islas marietas national park: an essential tool to protect the coral community. Appl. Geograph. 88, 15–23. doi: 10.1016/j.apgeog.2017.08.021
Department of Economic Affairs C. and I. of A. (2019). Sustainable Tourism. https://www.deaci.aw/wp-content/uploads/2020/11/FINAL-Report-Sustainable-Tourism.pdf (accessed June 23, 2022).
Department of Economic Affairs C. and I. of A. (2020). Nos Plan, Nos Futuro: National Strategic Plan 2020-2022. Avaialable online at: https://www.deaci.aw/wp-content/uploads/2020/11/FINAL-NSP-REPORT-STRATEGY-10202020.pdf (accessed June 23, 2022).
Derix, R. R. (2016). Landscape series No.4: The suburbanization of the Aruban landscape. https://cbs.aw/wp/wp-content/uploads/2016/12/H4_LandscapeSeries_Urbanization_10-10-2016-2.pdf (accessed June 23, 2022).
Directie Infrastructuur en Planning (2019). Ruimtelijk Ontwikkelingsplan Aruba 2019. Available online at: https://www.dip.aw/wp-content/uploads/2021/06/20190722-ROP-2019-definitief-1.pdf
Dodds, R., and Butler, R. (2019). The phenomena of overtourism: a review. Int. J. Tour. Cities 5, 519–528. doi: 10.1108/IJTC-06-2019-0090
Drius, M., Bongiorni, L., Depellegrin, D., Menegon, S., Pugnetti, A., Stifter, S., et al. (2019). Tackling challenges for Mediterranean sustainable coastal tourism: an ecosystem service perspective. Sci. Total Environ. 652, 1302–1317. doi: 10.1016/j.scitotenv.2018.10.121
Fitzpatrick, S. M. (2015). The pre-columbian caribbean: colonization, population dispersal, and island adaptations. PaleoAmerica 1, 305–331. doi: 10.1179/2055557115Y.0000000010
García-Ayllón, S. (2015). La Manga case study: consequences from short-term urban planning in a tourism mass destiny of the Spanish mediterranean coast. Cities 43, 141–151. doi: 10.1016/j.cities.2014.12.001
Hardy, A., Beeton, R. J. S., and Pearson, L. (2002). Sustainable tourism: An overview of the concept and its position in relation to conceptualisations of tourism. J. Sust. Tour. 10, 475–496. doi: 10.1080/09669580208667183
Hayward, P. (2021). Embodying the anthropocene: Embattled crustaceans, extractivism, and eco-tourism on christmas island (indian ocean). Island Stu. J. 16, 229–248. doi: 10.24043/isj.145
Hernández, J. M., Suárez-Vega, R., and Santana-Jiménez, Y. (2016). The inter-relationship between rural and mass tourism: the case of Catalonia, Spain. Tour. Manage. 54, 43–57. doi: 10.1016/j.tourman.2015.10.015
Herva, V. P., Varnajot, A., and Pashkevich, A. (2020). Bad Santa: cultural heritage, mystification of the Arctic, and tourism as an extractive industry. Polar J. 10, 375–396. doi: 10.1080/2154896X.2020.1783775
HIAS Aruba staff (2022). HIAS Aruba Opens Community Center, Foster Local Integration. HIAS Aruba Opens Community Center, Foster Local Integration. Available online at: https://hias.org/news/hias-aruba-opens-community-center-fosters-local-integration/ (accessed April 20, 2022).
Higgins-Desbiolles, F. (2018). Sustainable tourism: Sustaining tourism or something more? Tour. Manage. Persp. 25, 157–160. doi: 10.1016/j.tmp.2017.11.017
International Monetary Fund. Western Hemisphere Dept (2023). Kingdom of the Netherlands-Aruba: 2023 Article IV Consultation Discussion-Press Release; and staff Report.
Jung, M. (2016). LecoS—A python plugin for automated landscape ecology analysis. Ecol. Inf. 31, 18–21. doi: 10.1016/j.ecoinf.2015.11.006
Kempadoo, K. (1999). Sun, Sex, and Gold : Tourism and Sex Work in the Caribbean. Lanham: Rowman and Littlefield Publishers.
Leka, A., Lagarias, A., Panagiotopoulou, M., and Stratigea, A. (2022). Development of a tourism carrying capacity index (TCCI) for sustainable management of coastal areas in mediterranean islands – case study Naxos, Greece. Ocean Coast. Manage. 216, 105978. doi: 10.1016/j.ocecoaman.2021.105978
Liu, D., Chen, N., Zhang, X., Wang, C., and Du, W. (2020). Annual large-scale urban land mapping based on Landsat time series in Google Earth Engine and OpenStreetMap data: a case study in the middle Yangtze River basin. ISPRS J. Photogr. Remote Sens. 159, 337–351. doi: 10.1016/j.isprsjprs.2019.11.021
Loperena, C. A. (2017). Honduras is open for business: extractivist tourism as sustainable development in the wake of disaster? J. Sust. Tour. 25, 618–633. doi: 10.1080/09669582.2016.1231808
Lu, J., and Nepal, S. K. (2009). Sustainable tourism research: an analysis of papers published in the journal of sustainable tourism. J. Sust. Tour. 17, 5–16. doi: 10.1080/09669580802582480
Marshall, D. (1982). Migration as an agent of change in Caribbean island ecosystems. Int. Soc. Sci. J. 34, 451–467.
McGranahan, G., and Satterthwaite, D. (2014). Urbanisation Concepts and Trends. Available online at: chrome-extension://efaidnbmnnnibpcajpcglclefindmkaj/https://www.iied.org/sites/default/files/pdfs/migrate/10709IIED.pdf (accessed June 1, 2023).
Meadows, D. H., Randers, J., Meadows, D. L., and Meadows, D. H. (2005). Limits to Growth : the 30-Year Update. London: Earthscan.
Mohee, R., Mauthoor, S., Bundhoo, Z. M. A., Somaroo, G., Soobhany, N., Gunasee, S., et al. (2015). Current status of solid waste management in small island developing states: a review. Waste Manag. 43, 539–549. doi: 10.1016/j.wasman.2015.06.012
Murphy, K. S. (2011). An exploratory study of global issues impacting the future of tourism in Aruba. ARA Caribb. J. Tour. Res. 3, 5–18.
Pan, Y., Zhai, M., Lin, L., Lin, Y., Cai, J., Deng, J. S., and Wang, K. (2016). Characterizing the spatiotemporal evolutions and impact of rapid urbanization on island sustainable development. Habitat Int. 53, 215–227. doi: 10.1016/j.habitatint.2015.11.030
Pantin, D. A. (1999). The challenge of sustainable development in small island developing states: case study on tourism in the Caribbean. Nat. Res. Forum 23, 221–233. doi: 10.1111/j.1477-8947.1999.tb00911.x
Peeters, P., Gössling, S., Klijs, J., Milano, C., Novelli, M., Dijkmans, C., et al. (2018). Research for TRAN Committee - Overtourism: Impact and Possible Policy Responses. Available online at: chrome-extension://efaidnbmnnnibpcajpcglclefindmkaj/https://www.europarl.europa.eu/RegData/etudes/STUD/2018/629184/IPOL_STU(2018)629184_EN.pdf (accessed January 14, 2024).
Peterson, R. R. (2020a). Over the caribbean top: community well-being and over-tourism in small island tourism economies. Int. J. Commun. Well-Being 18, 1–38. doi: 10.1007/s42413-020-00094-3
Peterson, R. R. (2020b). Whence the twain shall meet: Weathering over-tourism and climate change in small island tourism economies. Available online at: chrome-extension://efaidnbmnnnibpcajpcglclefindmkaj/https://www.cbaruba.org/readBlob.do?id=7674 (accessed September 8, 2023).
Ratter, B. M. W. (2018). Geography of Small Islands: Outposts of Globalisation. Cham: Springer International Publishing.
Ridderstaat, J. (2007). The Lago Story, The Compelling Story of an oil Company on the Island of Aruba, 1st Edn. Lebanon: Editorial Charuba.
Ridderstaat, J., Croes, R., and Nijkamp, P. (2014). Tourism and long-run economic growth in Aruba. Int. J. Tourism Res. 16, 472–487. doi: 10.1002/jtr.1941
Saarinen, J. (2015). Conflicting limits to growth in sustainable tourism. Curr. Issues Tour. 18, 903–907. doi: 10.1080/13683500.2014.972344
Schilstra, A. J., and van Belle, J. (2003). Development of an Environmental Assessment Method for Aruba. Groningen: IVEM Center for Energy and Environmental Studies.
Schmutz, P. P., Potter, A. E., and Arnold Modlin, E. (2017). “Aruba, Bonaire, and Curaçao,” in Landscapes and Landforms of the Lesser Antilles, ed. C. D. Allen (Springer), 293–317. doi: 10.1007/978-3-319-55787-8_18
Sinclair-Maragh, G., and Gursoy, D. (2015). Imperialism and tourism: the case of developing island countries. Annal. Tour. Res. 50, 143–158. doi: 10.1016/j.annals.2014.12.001
Stoffelen, A., and Ioannides, D. (2022). Handbook of Tourism Impacts: Social and Environmental Perspectives. London: Edward Elgar Publishing.
Sustainable Travel International (2018). A study on the Tourism Carrying Capacity for the Island of Aruba. Seattle, WI: Sustainable Travel International.
Tejada, M., Malvarez, G. C., and Navas, F. (2009). Indicators for the assessment of physical carrying capacity in coastal tourist destinations. J. Coastal Res. 1, 1159–1163.
Thomas, S. (2013). “The Future is Urban” Challenge of Sustainable Urban Development in the Caribbean: the Search for Sustainable Urban Forms,” in 49th ISOCARP Congress. Available online at: chrome-extension://efaidnbmnnnibpcajpcglclefindmkaj/https://www.isocarp.net/Data/case_studies/2328.pdf (accessed April 13, 2020).
Vainikka, V. (2013). Rethinking mass tourism. Tourist Stu. 13, 268–286. doi: 10.1177/1468797613498163
Van Den Oever, F. (2000). Aruba - A geochemical baseline study. Netherlands J. Geosci. 79, 467–477. doi: 10.1017/S001677460002196X
Vandarakis, D., Malliouri, D., Petrakis, S., Kapsimalis, V., Moraitis, V., Hatiris, G. A., et al. (2023). Carrying capacity and assessment of the tourism sector in the South Aegean region, Greece. Water 15, 16. doi: 10.3390/w15142616
Vanegas, M., and Croes, R. R. (2003). Growth, development and tourism in a small economy: evidence from Aruba. Int. J. Tour. Res. 5, 315–330. doi: 10.1002/jtr.441
Wong, A. (2015). Caribbean island tourism: pathway to continued colonial servitude. Études Caribéennes 22, 31–32. doi: 10.4000/etudescaribeennes.7524
World Tourism Organization (2018). UNWTO Annual Report 2017. Geneva: World Tourism Organization (UNWTO).
World Tourism Organization (2023). UNWTO Tourism Statistics Database. Geneva: World Tourism Organization (UNWTO).
Zacarias, D. A., Williams, A. T., and Newton, A. (2011). Recreation carrying capacity estimations to support beach management at Praia de Faro, Portugal. Appl. Geograph. 31, 1075–1081. doi: 10.1016/j.apgeog.2011.01.020
Keywords: tourism, extractivism, carrying capacity, land use land cover change, urbanization, Caribbean, small island states
Citation: Jurgens SS, Mijts E and Van Rompaey A (2024) Are there limits to growth of tourism on the Caribbean islands? Case-study Aruba. Front. Sustain. Tour. 3:1292383. doi: 10.3389/frsut.2024.1292383
Received: 11 September 2023; Accepted: 13 February 2024;
Published: 07 March 2024.
Edited by:
Michael O'Regan, Glasgow Caledonian University, United KingdomReviewed by:
Salvador García-Ayllón Veintimilla, Polytechnic University of Cartagena, SpainRyan Peterson, Central Bank Aruba, Aruba
Copyright © 2024 Jurgens, Mijts and Van Rompaey. This is an open-access article distributed under the terms of the Creative Commons Attribution License (CC BY). The use, distribution or reproduction in other forums is permitted, provided the original author(s) and the copyright owner(s) are credited and that the original publication in this journal is cited, in accordance with accepted academic practice. No use, distribution or reproduction is permitted which does not comply with these terms.
*Correspondence: Sharona S. Jurgens, sharona.jurgens@ua.aw