The Impact of Variable Renewable Energy Penetration on Wholesale Electricity Prices in Japan Between FY 2016 and 2019
 Makishi Sakaguchi
 Hidemichi Fujii
- Faculty of Economics, Kyushu University, Fukuoka, Japan
The merit order effect (MOE), which renewable energy sources can decrease wholesale electricity prices, plays an important role in establishing low-carbon societies. After the liberalization of the electricity market, the trade volume of the Japan Electric Power Exchange (JEPX) day-ahead spot market drastically increased between 2016 and 2019; however, price spikes still occur often. Ordinary least squares and quantile regression analyses were applied in this study to investigate how wind and solar photovoltaics (PV) energy generation affect the JEPX day-ahead spot price by time, price range, and area, and we concluded that the MOE of wind increased between 2016 and 2019 while that of PV decreased during this time. In regard to the high price ranges, although wind generation is not significant in terms of reducing price spikes, PV had this effect in 2016 and 2017 but not during the other years covered. The study area was divided into four regions, and each area followed trends that were different from those of the national analysis. Overall, the key finding of our study is that wind power has more potential to reduce electricity prices than PV.
Introduction
Man-made greenhouse gases (GHGs) from burning fossil fuels are causing climate crisis worldwide. The Intergovernmental Panel on Climate Change (IPCC, 2018) said that global net anthropogenic CO2 emissions must decline by ~45% from 2010 levels by 2030 and reach net zero by ~2050 to limit global warming to 1.5 degrees Celsius. Since then, many countries have set a target of net zero emissions by 2050, as Japan did in 2020 (Cabinet of Japan, 2020). Japan has a major responsibility to cut emissions because it ranks fifth in terms of GHG emissions worldwide. Approximately 40% of Japan's GHG emissions in 2018 came from the electricity generation sector. Therefore, the 5th Japanese strategic energy plan identifies renewable energy sources as the main power supplies that will be used to achieve the net zero emissions goal (Ministry of Economy, 2018). The Japanese Ministry of the Environment (Ministry of the Environment, 2020) reported that variable renewable energy (VRE), such as wind and solar photovoltaics (PV), has greater future growth potential than other renewable energy sources. However, wind and PV contribute a small part of electricity generation (1 and 8%, respectively, in 2020). Since the implementation of the feed-in-tariff system in 2012, the use of PV power has drastically increased; however, wind power is used less often.
In terms of the electricity market, in 1995, the first institutional reform launched the wholesale electricity market, bringing competition to the power generation sector; this was followed by a partial liberalization of electricity retailing in 2000, and the full liberalization of retailing began in April 2016. In addition, the JEPX, which is the only wholesale power exchange in Japan, was established in 2003, and trading began in 2005. Most trading happens in the day-ahead spot market, although the JEPX comprises several markets, such as intraday and forward markets. The day-ahead spot market has two types of prices: system (national) prices and area prices. First, the supply and demand curves are set to determine the system price by considering only bids from all over Japan. The country is then divided into nine areas, and the price for each area is determined after taking into account the capacity of each interregional interconnection line. If the system can operate without exceeding the capacity of the interregional interconnection lines, the system price will equal the respective area price, but if the capacity of an interconnection line is exceeded, market divisions occur, and each area aggregates bids and sets its own price. These market divides often occur; for example, only 5% of the day-ahead spot prices of 2019 did not divide a market price. During the research period, two policies were applied to increase trade volume (see Appendix). The first was gross bidding, which was launched on 1st April 2017. This represents an initiative to buy and sell electricity on the JEPX, including that of the former general electric utility's own supply (in-house trading), and engage in exchange trading (net bidding), which was previously conducted mainly for surplus electricity. Second, implicit auctions were introduced on 1st October 2018; implicit auctions allocate power that passes through interregional interconnection lines to inexpensive power sources through the spot market, and they have enabled the efficient use of power sources across wide areas. As a result of these policies, the trade volume on the JEPX day-ahead spot market increased, and in 2019, 30–40% of all Japan's generated electricity was sold through JEPX transactions. Additionally, price spikes, namely, temporary and sudden increases in electricity prices mainly due to demand increases or supply shortages, became a problem, and this phenomenon can represent a major risk for market customers.
In the context of the effect of renewable energy penetration, the merit order effect (MOE) has been researched around the world, as shown in Figure 1. According to Marshall (1890), in a perfectly competitive market, it is socially optimal when marginal costs create supply curves, and prices are equal to the points where supply curves and demand curves intersect. Incidentally, the marginal cost of renewable energy is theoretically zero because, unlike thermal plants, it does not require fuel. Therefore, the more renewable electric energy is generated, the lower the electricity price becomes because the supply curve (or marginal cost of each power plant) shifts to the right, which lowers the equilibrium price. The point is that the penetration of renewable energies has a price reduction effect on wholesale electricity market, and this effect is called MOE.
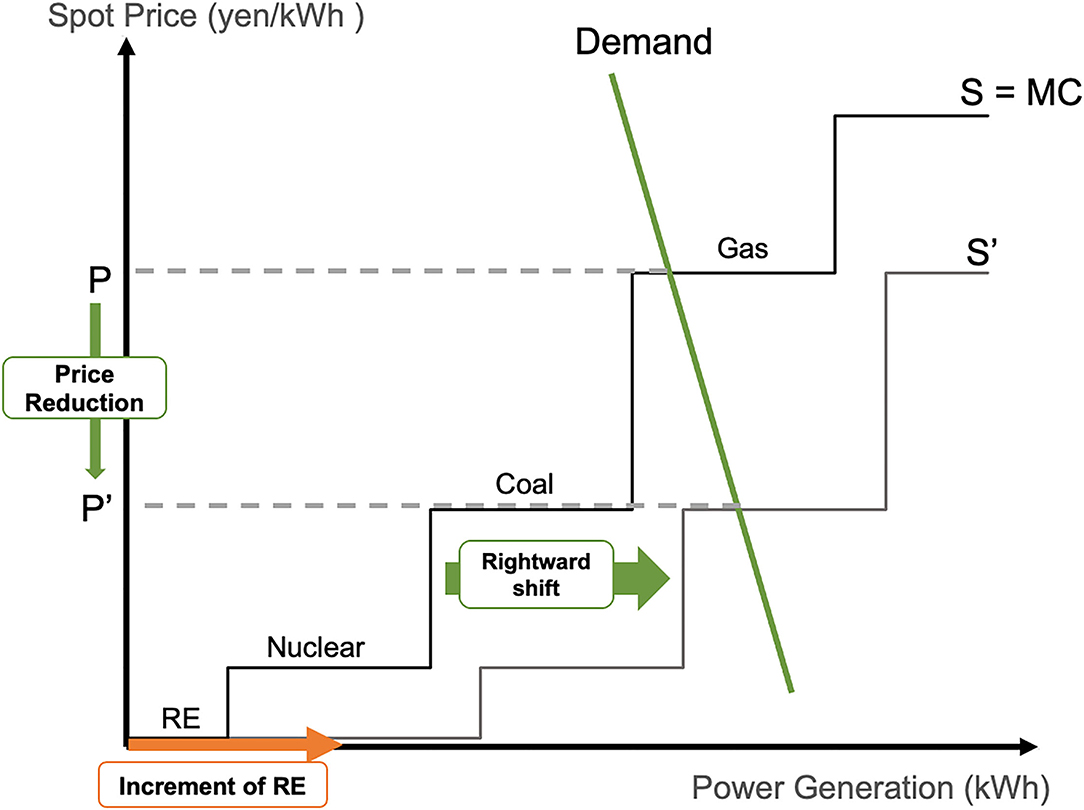
Figure 1. Conceptional graph of the merit order effect (MOE). (Source: created by authors).
Background and Literature Review
To the best of the authors' knowledge, there are few studies about the MOE in Japan; Maekawa et al. (2018) found that the MOE exists in Japan using ordinary least squares regression analysis. However, their study has some issues, such as the use of climatic data as a proxy variable, and the analysis was conducted when the trade volume of the JEPX was still below 10% (30–40% in 2019). Yoshihara and Ohashi (2017) found that based on the 2030 scenario proposed by the government, further installations of renewable energy sources lower kWh prices, reduce fuel costs, and reduce the volume of CO2 emissions.
Zipp (2017) found time-series changes in the MOE of other countries; for example, the MOE of wind power in Germany increased between 2011 and 2013. According to Keeley et al. (2021), electricity from wind and solar sources reduced the German/Austrian spot market price by 9.64 €/MWh on average between 2010 and 2017; these authors analyzed this phenomenon using generalized least squares regression and a machine learning approach. Csereklyei et al. (2019) analyzed the MOE of wind and PV in Australia and found that with a 1 GW increase in 30-min dispatched capacity, wind has a wholesale price reduction effect of 11 AUD/kWh while solar has a wholesale price reduction effect of 14 AUD/kWh. In addition, they measured the MOE of each of the four subdivided areas of Australia, namely, NSW, QLD, VIC, and SA, and found that there is significant variation across these areas. In terms of different price ranges, using quantile regression analysis, Hagfors et al. (2016) found that the MOE of PV is higher at higher price ranges in Germany, reducing the effect of extreme price spikes, while the MOE of wind is greater at lower price points. Maciejowska (2020) used quantile regression analysis to examine German electricity market prices and found that wind has a greater price-reducing impact on the lower tail of the price distribution while solar has a greater price-reducing impact on the higher tail of the price distribution. As these studies show, the MOE was investigated not only in terms of its overall effect but also at the area, year and price levels.
In Japan, the use of solar power has dramatically increased due to the feed-in-tariff policy while the utilization of wind power has been low. In addition, capacity factors of VRE in japan are relatively low compared to other countries, with the average capacity factor in Japan being 23% for wind and 15.8% for PV (Renewable Energy Institute, 2018, 2019). However, wind and PV have different characteristics in terms of generating electricity; to be more specific, PV only works during the daytime when sunlight reaches the ground, but wind works regardless of the time of day. They also have seasonal differences; wind power generation increases during the winter and decreases during the summer, while solar power generation increases during the spring and summer and decreases during the winter. Furthermore, regional differences in the implementation of VRE influence the price in each area due to the area price system.
Thus, we choose three research objectives that have not been investigated in Japan thus far. (1): We investigate how the MOE has changed overtime, aiming to identify the changes that have occurred each year as the amount of electricity generated and the trade volume of the JEPX have changed. (2): We examine how the MOE varies across price ranges, analyzing whether VRE penetration reduces price spikes. (3): We consider how the MOE differs across the four areas of Japan, identifying the differences between these areas (Japan is classified into four areas in this study based on price correlations listed on Appendix), as each area tends to have its own spot price and power supply composition (Figure 2).
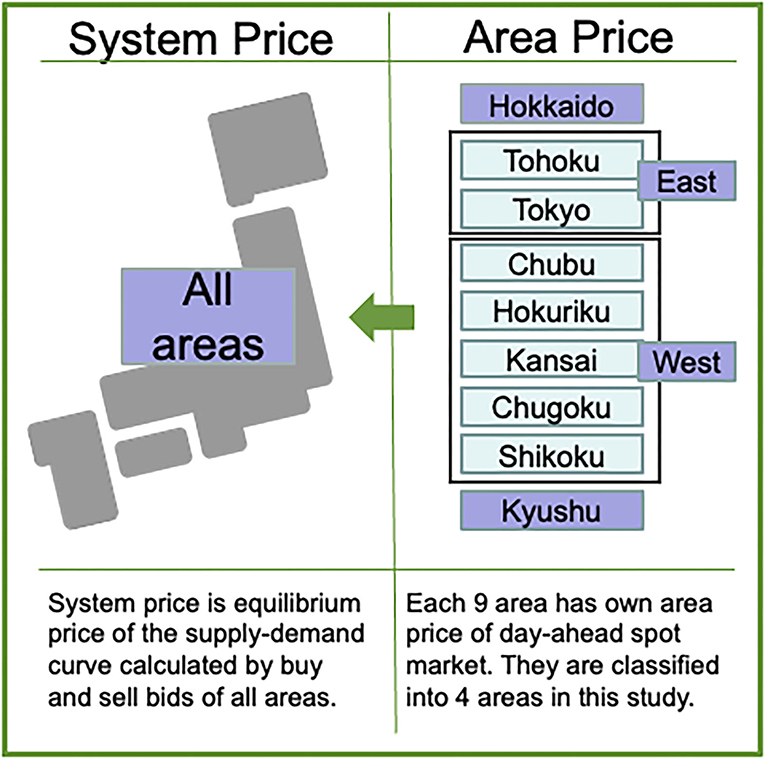
Figure 2. Classification of the four areas. (Source: created by authors).
Methodology and Data
In this study, two regression models are employed. First, an ordinary least squares regression analysis is performed on the mean value of the data set to analyze the impact of the examined factor on overall energy prices. Second, quantile regression analysis is used to analyze the effect within each price range by performing a regression analysis for each quantile. Using these two methods, we aim to analyze how wind and PV affect the day-ahead spot price of the JEPX. The first step is to analyze national data to identify the changes that occur over time, and then differences in the impact across different areas are captured using data subdivided according to the nine identified areas; the Okinawa area is excluded from this analysis, as this area is not included in the JEPX market. The overall research framework is shown in Figure 3.
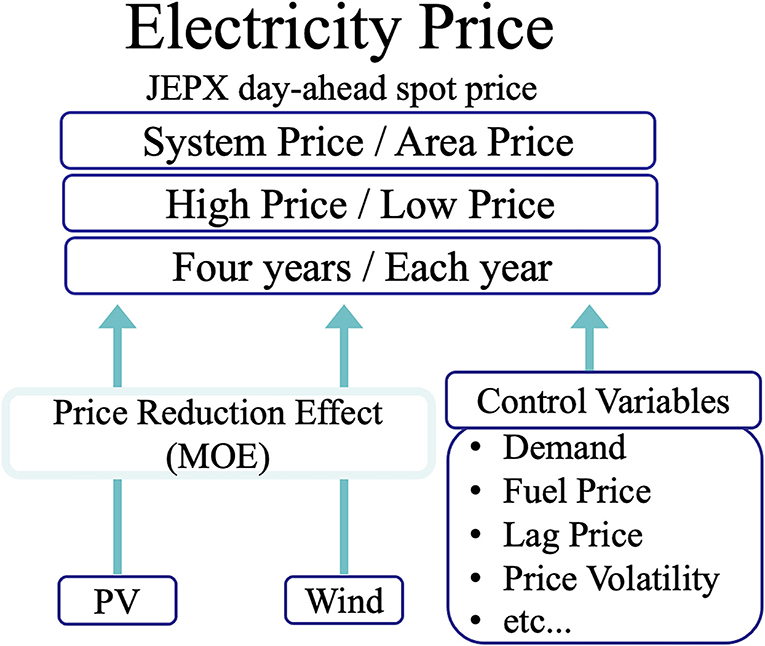
Figure 3. Research framework of this study. (Source: created by authors).
Models
We utilize the following models in both our national analysis and our area analysis.
Ordinary Least Square Regression Model (OLS Regression)
The independent variable is the JEPX day-ahead spot price. Variables for wind and PV electricity generation and control variables are included. Time autocorrelation effects must be reduced due to the use of time-series data. Therefore, we include the lagged price for the same hour of the day and for the previous seven days and the average day-ahead spot price across the 24 h of the previous day to eliminate autocorrelation in the data set. Moreover, we add a spot price volatility variable for historic price instability following Paraschiv et al. (2014) and Sirin and Yilmaz (2020), which is the standard deviation of the day-ahead spot prices of the same hour of the previous five days.
According to the above procedures, a linear regression model is estimated as shown in Equation (1). In this model, Pricet is the JEPX day-ahead spot price at time t (one h).
Quantile Regression Model
Using the same data as used for the OLS regression model, we estimate the following quantile regression model.
where q ∈ (0, 1) represents the 5, 10, 25..., and 95% quantiles.
Data
National Analysis
The system price data cover the period from 1st April 2016 to 31st March 2020 according to the Japanese fiscal year, which runs from April to March of the following year. Each JEPX day-ahead spot price is determined every 30 min; however, in this study, they are converted to hourly prices. The prices are weighted averages of the JEPX day-ahead spot prices for each time period according to trade volume. The amount of electricity generation is calculated as the sum of the generation of each of the nine areas per h, which is reported by the respective transmission system operators. All the data used in this study are listed in Table 1.
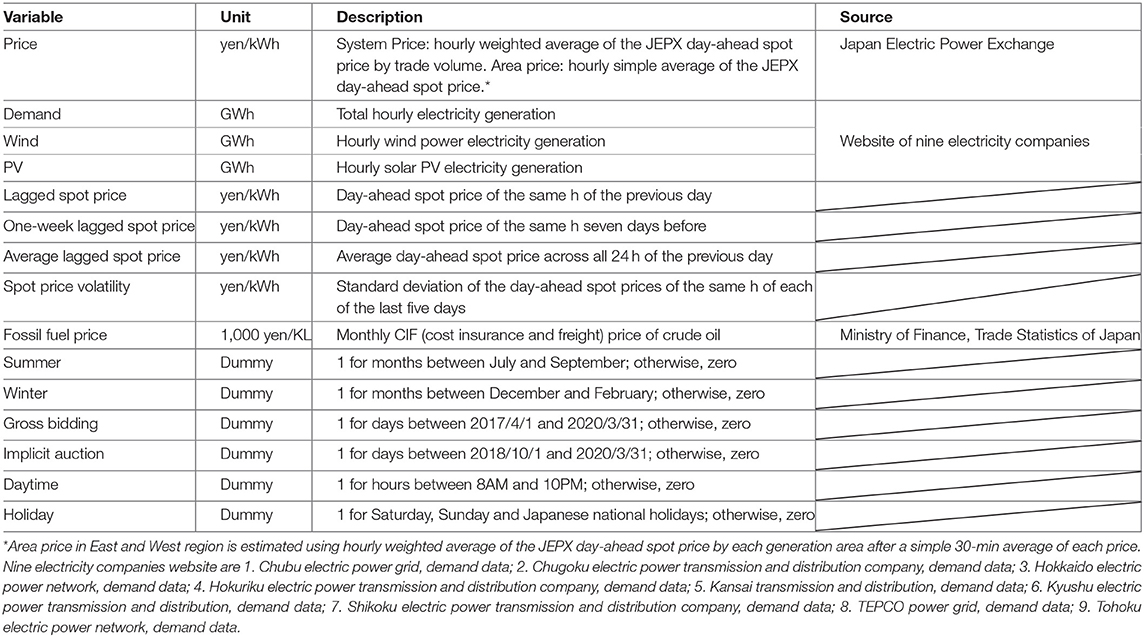
Table 1. Data description.
Area Analysis
The area price data cover the period from 8th April 2016 to 31st March 2020 due to data limitations. Although we use weighted average prices in our national analysis, a simple average of each pair of 30-min price periods is employed in our area analysis because the JEPX discloses trade volume only at the national level. Demand, wind and PV variables for each area are used, and these values are published by each transmission system operator.
Robustness Check
As a unit root may be present due to our use of time-series data, we perform an augmented Dicky-fuller (ADF) test to determine whether the variables are stationary according to Dickey and Fuller (1979). We reject the null hypothesis of a unit root at the significance level of 1%, which means that the JEPX spot price data are stationary. Then, we apply Durbin-Watson statistics and find that our data exhibit a positive autocorrelation. It is reasonable to consider the use of lagged data for our OLS and quantile regression models to eliminate the effect of this autocorrelation; thus, these data are added to equations (1) and (2).
Results and Discussion
National Analysis
National Analysis (OLS Regression Analysis)
First, an MOE was indicated by negative coefficient values within the regression analysis results. The larger a negative coefficient was, the larger the corresponding MOE was. First, five models with different combinations of control variables were calculated (Table 2), and it was revealed that each coefficient was significantly negative, i.e., the MOEs of wind and PV were significant during the years covered.
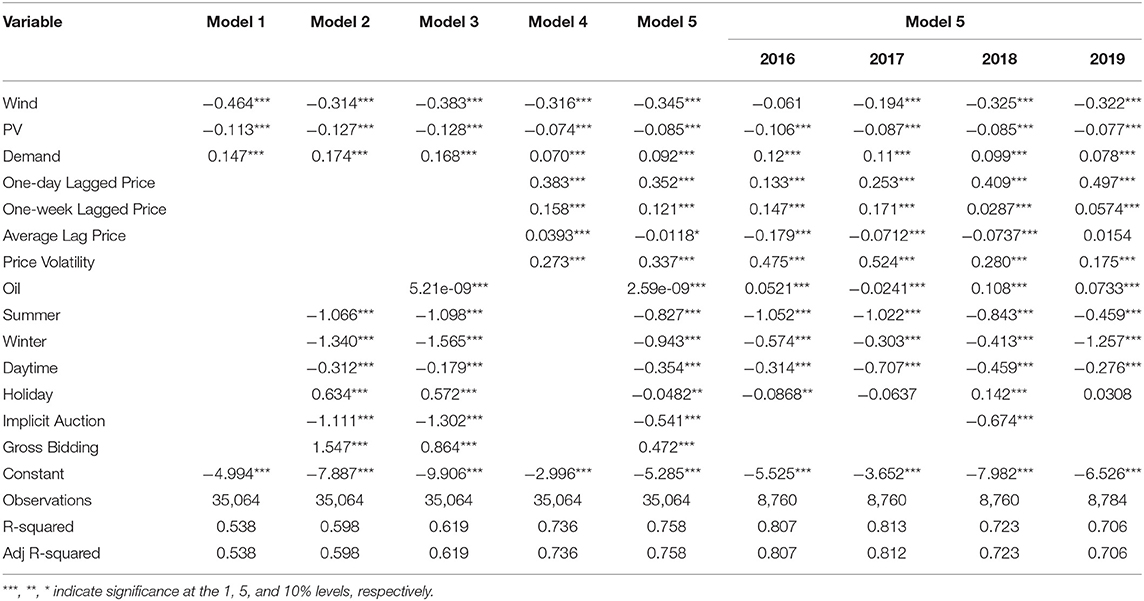
Table 2. The results of the OLS regression analysis of system prices.
In addition, the MOE of wind was a few times larger than that of PV in all five models. Next, since the adjusted coefficient of determination of model 5 was the highest, we split it into four fiscal years and examined the time series changes. Different chronological variations in the MOEs of wind and PV were found. The MOE of PV decreased from 2016 to 2019; on the other hand, the MOE of wind increased each year. In addition, the adjusted coefficient of determination decreased over the years examined, which implies that the impacts of other factors that determine the JEPX prices became stronger. The Japanese electricity market is still an oligopoly market because the former general electric utilities used to monopolize each area market before the liberalization of retail electricity market started in March 2000. This can be a factor to determine the JEPX spot price due to imperfect competitive market. Considering the effect of the policy change dummies: gross biding and implicit auction, the coefficient of implicit auction is positive while the one of gross bidding is negative. The reason why the implicit auction helps the electricity price to decrease would be the result of market integration.
National Analysis (Quantile Regression Analysis)
Figure 4 shows the results of a quantile regression used to capture the MOEs of each price range. The MOEs of wind were not significant in most quantiles, but the number of significant quantiles increased over time. The MOEs of PV, on the other hand, were significant for all the quantiles over the four years examined. Notably, the MOEs of the 95th quantile decreased from 2016 to 2019, demonstrating the price-decreasing effect of price spikes. Additionally, there were sharp drops between the 90th quantile and the 95th quantile in 2016 and 2017. These results indicated that the price-reduction effect of PV electricity generation is particularly strong during price spikes. However, the trade volume on the JEPX was relatively quite small during 2016 and 2017, and it is possible that the price spike reduction effect weakened as the transaction volume on the JEPX increased.
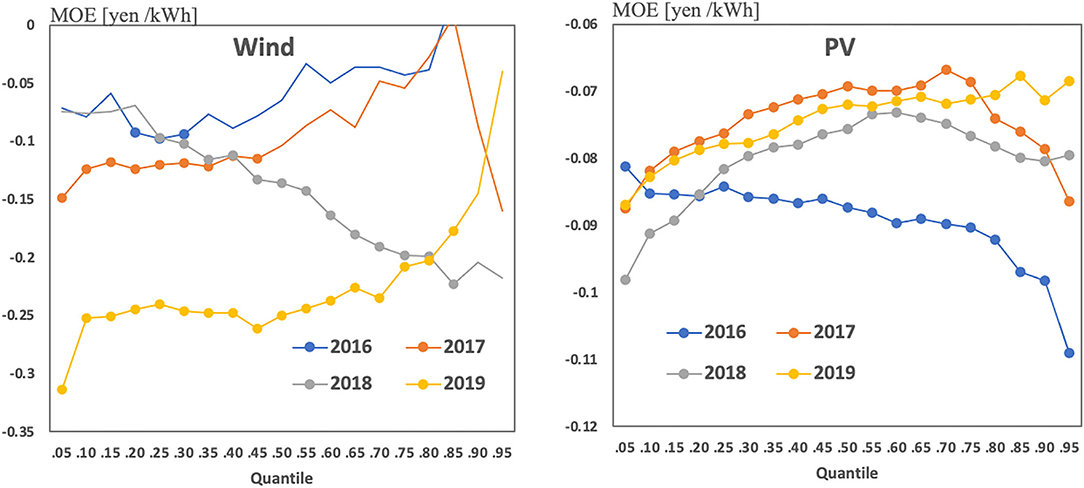
Figure 4. The results of the quantile regression analysis of system prices. (Source: Created by author). The dots in the graph indicate significance at the 1% level.
Discussion National Analysis
Certainly, the decline in the MOE of PV over time could be due to the corresponding increase in PV energy generation: solar PV accounted for 4.5% of the total energy generation of Japan in 2016, and it increased to 7.4% in 2019; this is because the impact of a single unit of PV generation decreases as PV installations increase. Since an overall upward trend in the MOE of wind was found, especially in 2018 and 2019, which had relatively significant quantiles, we considered those two years separately for daytime and night-time hours (Figure 5); we found that the magnitude of the MOE of wind did not change much during night-time hours, but it was dramatically larger during daytime hours. However, we were not able to infer the reason for this from our study; thus, we would like to leave this as an issue for future research.
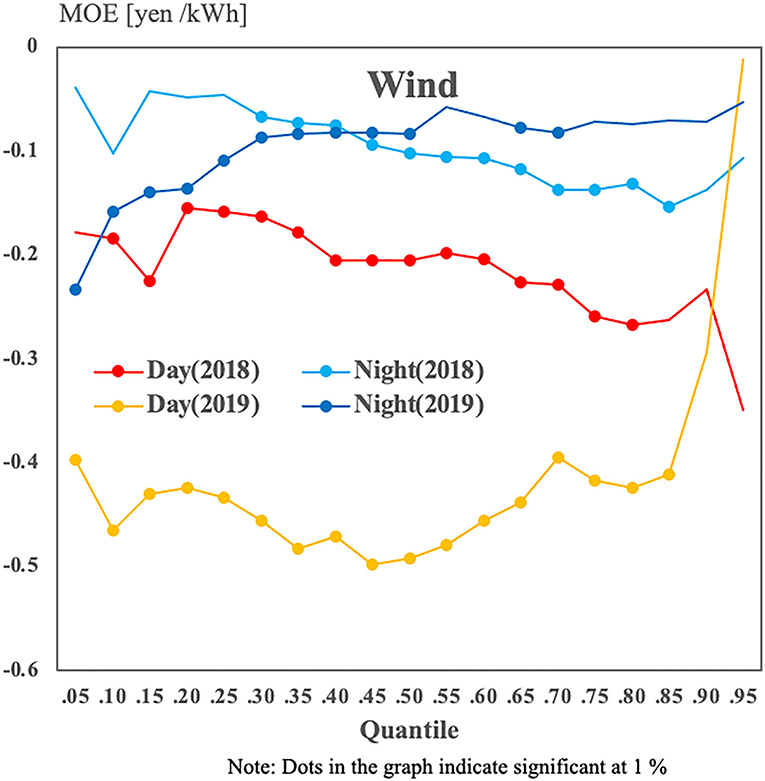
Figure 5. MOE differences between daytime and night-time hours by price range. (Source: created by authors). The dots in the graph indicate significance at the 1% level.
Area Analysis
Area Analysis (OLS Regression)
Second, the study area was broken down into four regions, and the same calculation used in the national analysis was run. The results of this OLS regression are given in Table 3. Regarding wind, MOEs were not observed for the areas of West and Kyushu in 2016 and 2017, but they were significant for the other areas. Additionally, the MOEs of PV were significant in all the areas and years. In contrast to the national analysis, consistent time-series variation was not found in the area analysis. That is, the changes observed in the national analysis were not caused by the characteristics of a certain area; rather, they represent an overall trend. Notably, the wind and PV MOEs of Hokkaido were much higher than those of the other areas.
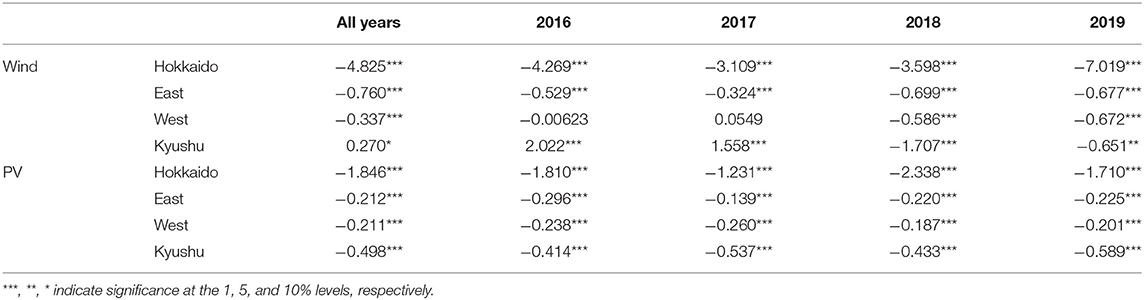
Table 3. Wind and PV MOE changes by year and area.
Area Analysis (Quantile Regression)
Figure 6 shows the results of the quantile regression analyses for each of the four areas. The MOE of wind became larger for the highest quantiles only in Hokkaido which means wind power can reduce price spikes. Similar to the national analysis, considering the overall trends of the PV MOEs, the lower the price range is, the larger the MOE is. Looking at the lowest quantile, a sudden increase for PV in Kyushu is seen. This might be because the JEPX Kyushu area price often set 0.01 yen/kWh which is the lowest price determined, and further PV curtailment also often occurs then. The fact that Kyushu is the area where the penetration of PV generation is the most advanced is the most conducive to this phenomenon.
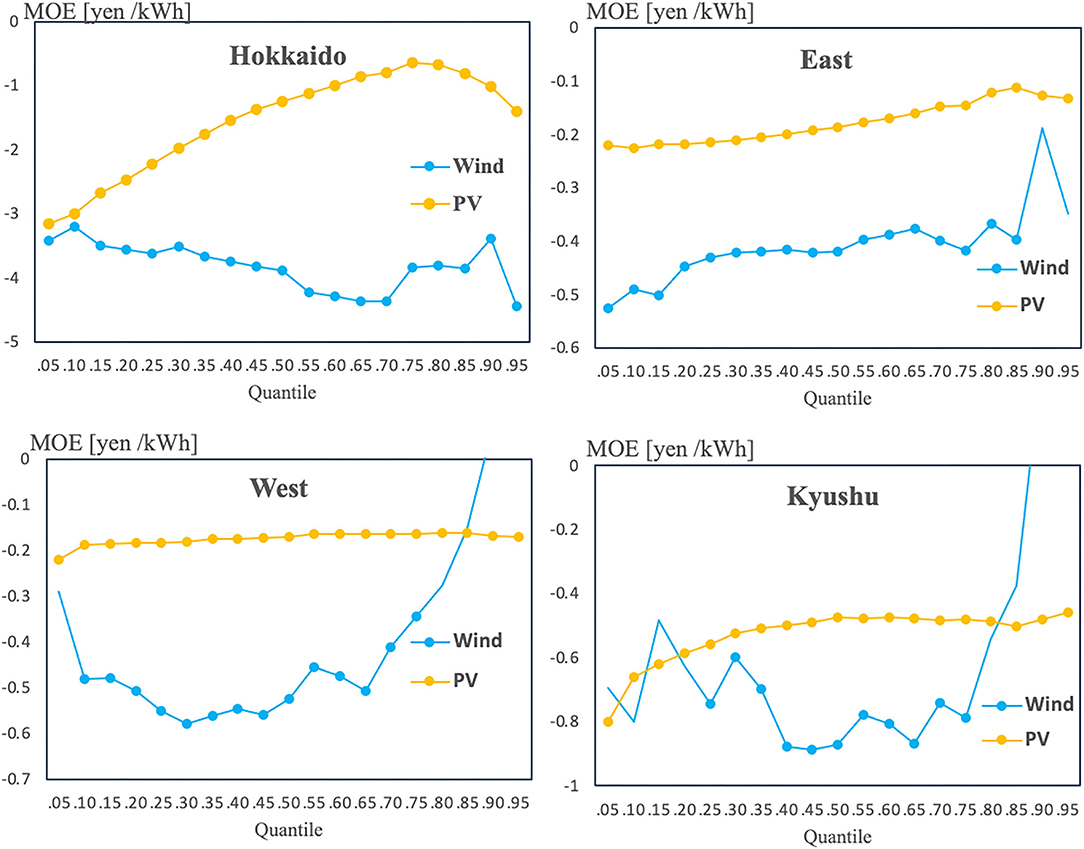
Figure 6. The results of the quantile regression analyses of the price of each area. (Source: created by authors). The dots in the graph indicate significance at the 1% level.
Discussion Area Analysis
It should be noted that the area analysis did not take into account the effect of electricity passing through interconnection lines, which are used to trade electricity with other areas. For instance, Kyushu has only one interconnection line with another area, and Kyushu exports electricity throughout the year because it has the highest percentage of PV generation. That is, in the context of this study, these lines are likely to cause the actual consumption of an area to be unequal to the electricity that is generated in the area, so errors exist due to this phenomenon. As with the results of the analyses of the four areas, the MOE trends of the various areas were not very consistent. There may be other factors in each area that determine the JEPX spot price. Additionally, the electricity mix, average prices, and the percentage of the market in each area within the high price range vary greatly, as shown in Table 4. This study revealed that a certain amount of VRE electricity generation is necessary to receive MOE benefits. Since Hokkaido has the largest share of electricity generation from wind in the four areas, the MOE for wind power was significant in all quantiles analyzed. On the other hand, the MOE of wind power was not significant in some quantiles in West and Kyushu regions. Less electricity is generated by wind power in these regions than in other regions.
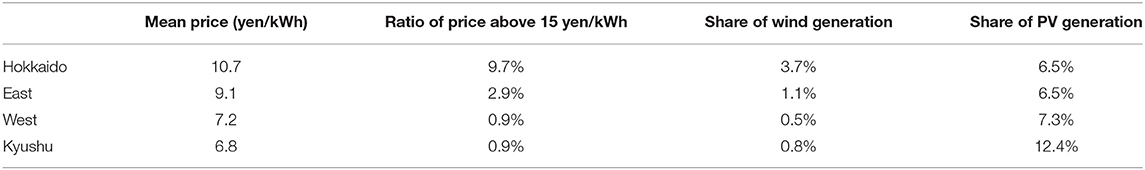
Table 4. Descriptive statistics of the electricity prices and generation sources in each area during 2019.
Comparison With Previous Research
In terms of comparing our overall MOE to those of other studies, although some previous research estimated the MOE by multiplying a calculated coefficient by a load-weighted average to quantify the actual amount of decrement due to RE penetration, we compared how much the price of electricity was reduced for each 1 GWh of additional VRE (wind and PV) generation per hour. The total number of VRE installations differs greatly by country. The results of a comparison of our MOE to those of other studies is given in Table 5, considering currency exchange rates into euros. The MOE of VRE generation in Japan is quite similar to that in other countries. However, Japan is unique in that wind power has a much larger MOE than PV, while both wind and PV have almost the same magnitude effect in Germany. The reason could be the differences of both VRE penetration percentage of the total generation. According to IEA (2021), electricity generation from wind and solar power in 2019 is about 20.7 and 7.6% in Germany while 0.7 and 6.6% in Japan. An examination of the MOE in the context of price spikes shows another difference. Although Hagfors et al. (2016) revealed that PV reduces the chance of extreme spikes, this effect weakened over time in Japan as trade volumes increased. Since this is the first study to the authors' knowledge to investigate the MOE of VRE in Japan considering price ranges, more research in this field is needed.
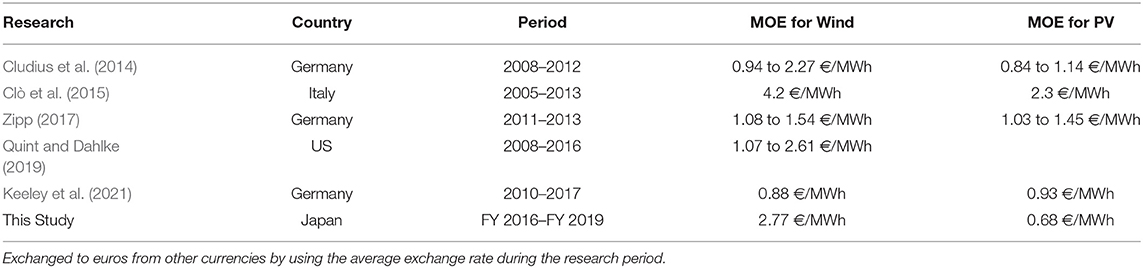
Table 5. The MOE for each GWh of additional VRE generation.
Conclusions and Policy Implications
The results of this study confirmed the MOE of both wind and PV electricity generation through the use of actual generation data, showing that the overall MOE of wind is greater than that of PV and that the former has been increasing over time while the latter has not. Japan can benefit from a greater price reduction by prioritizing the introduction of wind power. It was also evident that MOEs vary significantly across price ranges. In addition, price spike suppression was observed in 2016 and 2017 in the case of PV. Other factors may have started to affect the MOE during the price spike, as JEPX traded less in this period and solar PV generated less electricity than in 2019. For wind, the MOE was not significant at high price ranges in all year covered. It is also interesting that the MOE of wind is a few times higher than the one of PV, unlike previous research for other countries. In terms of price spikes, JEPX has experienced the long- continued high market price from December 2020 to January 2021 with unprecedented level. During the term, it is not appropriate to use these high price data unconditionally with the data we used in this study because a lot of externalities could be concerned. However, investigating the factors that caused these extreme high prices and the MOE of VRE during the period is important to the improvement of JEPX. And we leave this to future research.
In Japan, “Act on Promoting the Utilization of Sea Areas for the Development of Marine Renewable Energy Power Generation Facilities” came into effect in April 2019, aiming to further promote offshore wind power. Although the global weighted-average levelised cost of electricity (LCOE) for offshore wind is higher than PV according to IRENA (2020), the MOE for wind revealed in this study makes its implement easier.
The fact that MOEs vary across areas is also an important finding; indeed, the characteristics of a given area are taken into account in terms of the impact of this effect on electricity market prices when the government tries to promote renewable energy. As our results simply implied that electricity prices decrease and nearly reach zero as more renewable energy facilities are installed, recouping the initial investments of these facilities is important. The value of zero emission electricity generation should be prioritized to attract renewable energy investors. Even though the Japanese feed-in-tariff scheme is almost finished, the government should apply other options to eliminate the risks involved in developing renewable energy.
We found that renewable energy has a significant price-reducing effect in the wholesale electricity market of Japan. However, the variables used in this study did not fully explain the price changes observed. Thus, identifying other factors that determine electricity prices is a future research topic.
Data Availability Statement
Publicly available datasets were analyzed in this study. This data can be found here: Japan Electric Power Exchange http://www.jepx.org/.
Author Contributions
MS was involved in study design, dataset making, data analysis, and writing manuscript. HF critically revised the report, commented on drafts of the manuscript. All authors contributed to the article and approved the submitted version.
Funding
This research was funded by the Grant-in-Aid for Scientific Research (JP18H03433) and (JP20K12283) from the Ministry of Education, Culture, Sports, Science and Technology (MEXT), Japan. The results and conclusions of this article do not necessarily represent the views of the funding agencies.
Conflict of Interest
The authors declare that the research was conducted in the absence of any commercial or financial relationships that could be construed as a potential conflict of interest.
Publisher's Note
All claims expressed in this article are solely those of the authors and do not necessarily represent those of their affiliated organizations, or those of the publisher, the editors and the reviewers. Any product that may be evaluated in this article, or claim that may be made by its manufacturer, is not guaranteed or endorsed by the publisher.
References
Cabinet of Japan (2020). Press Conference by the Chief Cabinet Secretary. https://japan.kantei.go.jp/tyoukanpress/202010/26_p.html (accessed October 12, 2021).
Chubu Electric Power Grid, Demand Data. Available online: https://powergrid.chuden.co.jp/denkiyoho/ (accessed October 12, 2021).
Chugoku Electric Power Transmission Distribution Company Demand Data. Available online at: https://www.energia.co.jp/nw/service/retailer/data/area/index.html (accessed October 12, 2021).
Clò, S., Cataldi, A., and Zoppoli, P. (2015). The merit-order effect in the Italian power market: the impact of solar and wind generation on national wholesale electricity prices. Energy Policy 77, 79–88. doi: 10.1016/j.enpol.2014.11.038
Cludius, J., Hermann, H., Matthes, F. C., and Graichen, V. (2014). The merit order effect of wind and photovoltaic electricity generation in Germany 2008–2016: estimation and distributional implications. Energy Econ. 44, 302–313. doi: 10.1016/j.eneco.2014.04.020
Csereklyei, Z., Qu, S., and Ancev, T. (2019). The effect of wind and solar power generation on wholesale electricity prices in Australia. Energy Policy 131, 358–369. doi: 10.1016/j.enpol.2019.04.007
Dickey, D. A., and Fuller, W. A. (1979). Distribution of the estimators for autoregressive time series with a unit root. J. Am. Stat. Assoc. 74, 427–431. doi: 10.1080/01621459.1979.10482531
Hagfors, L. I., Paraschiv, F., Molnar, P., and Westgaard, S. (2016). Using quantile regression to analyze the effect of renewables on EEX price formation. Renew. Energy Environ. Sustain. 1:32. doi: 10.1051/rees/2016036
Hokkaido Electric Power Network, Demand Data. Available online at: https://www.hepco.co.jp/network/renewable_energy/fixedprice_purchase/supply_demand_results.html (accessed October 12, 2021).
Hokuriku Electric Power Transmission Distribution Company Demand Data. Available online at: http://www.rikuden.co.jp/nw_jyukyudata/area_jisseki.html (accessed October 12, 2021).
IEA (2021). IEA World Energy Statistics and Balances 2021 (database). Available online at: https://www.iea.org/data-and-statistics/data-product/world-energy-balances (accessed October 12, 2021).
IPCC (2018). Summary for Policymakers of IPCC Special Report on Global Warming of 1.5°C Approved by Governments. Available online at: https://www.ipcc.ch/2018/10/08/summary-for-policymakers-of-ipcc-special-report-on-global-warming-of-1-5c-approved-by-governments/ (accessed October 12, 2021).
IRENA (2020). Renewable Power Generation Costs in 2019. Abu Dhabi: International Renewable Energy Agency.
Japan Electric Power Exchange. Available online at: http://www.jepx.org/market/index.html (accessed October 12, 2021).
Kansai Transmission Distribution Demand Data. Available online at: https://www.kansai-td.co.jp/denkiyoho/area-performance.html (accessed October 12, 2021).
Keeley, A. R., Matsumoto, K. I., Tanaka, K., Sugiawan, Y., and Managi, S. (2021). The impact of renewable energy generation on the spot market price in germany: ex-post analysis using boosting method. Energy J. 41:S11. doi: 10.5547/01956574.42.S12.akee
Kyushu Electric Power Transmission Distribution Demand Data. Available online at: https://www.kyuden.co.jp/td_service_wheeling_rule-document_disclosure.html (accessed October 12, 2021).
Maciejowska, K.. (2020). Assessing the impact of renewable energy sources on the electricity price level and variability – A quantile regression approach. Energy Econ. 85:104532. doi: 10.1016/j.eneco.2019.104532
Maekawa, J., Hai, B. H., Shinkuma, S., and Shimada, K. (2018). The effect of renewable energy generation on the electric power spot price of the Japan electric power exchange. Energies 11:2215. doi: 10.3390/en11092215
Ministry of Economy Trade Industry. (2018). The Strategic Energy plan. Available online: https://www.enecho.meti.go.jp/en/category/others/basic_plan/ (accessed November 04, 2021).
Ministry of Finance Trade Statistics of Japan. Available online at: https://www.customs.go.jp/toukei/info/index_e.htm (accessed October 12, 2021).
Ministry of the Environment (2020). Entrusted Work Concerning the Development and Disclosure of Basic Zoning Information Concerning Renewable Energies (FY 2019). Available online at: https://www.renewable-energy-potential.env.go.jp/RenewableEnergy/report/r01.html (accessed October 12, 2021).
Paraschiv, F., Ermi, D., and Pietsch, R. (2014). The impact of renewable energies on EEX day-ahead electricity prices. Energy Policy 73, 196–210. doi: 10.1016/j.enpol.2014.05.004
Quint, D., and Dahlke, S. (2019). The impact of wind generation on wholesale electricity market prices in the midcontinent independent system operator energy market: an empirical investigation. Energy 169, 456–466. doi: 10.1016/j.energy.2018.12.028
Renewable Energy Institute (2018). Analysis of Wind Power Costs in Japan. 50–Translated From Japanese. Available online at: https://www.renewable-ei.org/en/activities/reports/img/pdf/20180125/JapanWindPowerCostReport_EN_20180124.pdf (accessed October 12, 2021).
Renewable Energy Institute (2019). Solar Power Generation Costs in Japan Current Status and Future Outlook. Available online at: https://www.renewable-ei.org/pdfdownload/activities/Report_SolarPVCostJapan_EN.pdf (accessed October 12, 2021).
Shikoku Electric Power Transmission Distribution Company Demand Data. Available online at: https://www.yonden.co.jp/nw/renewable_energy/data/supply_demand.html (accessed October 12, 2021).
Sirin, S. M., and Yilmaz, B. N. (2020). Variable renewable energy technologies in the Turkish electricity market: quantile regression analysis of the merit-order effect. Energy Policy 144:111660. doi: 10.1016/j.enpol.2020.111660
TEPCO Power Grid, Demand Data. Available online at: https://www.tepco.co.jp/forecast/html/area_data-j.html (accessed October 12, 2021).
Tohoku Electric Power Network, Demand Data. Available online at: https://setsuden.nw.tohoku-epco.co.jp/download.html (accessed October 12, 2021).
Yoshihara, K., and Ohashi, H. (2017). Assessing the Impact of Renewable Energy Sources: Simulation Analysis of the Japanese Electricity Market. Discussion Paper Series 17-E-063, RIETI. Tokyo: Research Institute of Economy, Trade and Industry (RIETI).
Zipp, A.. (2017). The marketability of variable renewable energy in liberalized electricity markets – An empirical analysis. Renew. Energy 113, 1111–1121. doi: 10.1016/j.renene.2017.06.072
Appendix
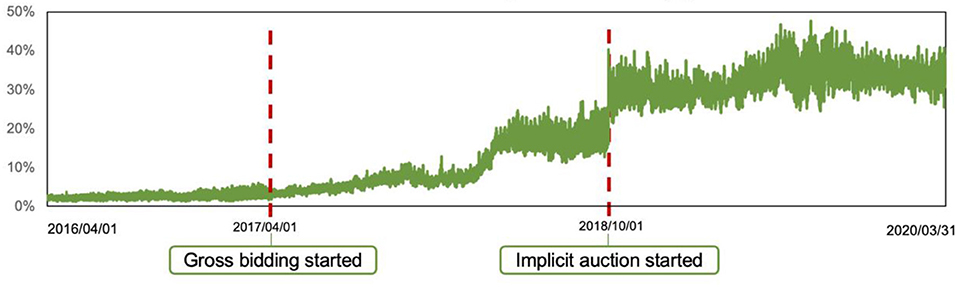
Figure A1. Share of JEPX trade volume by total electricity generation. (Data source: JEPX day ahead spot price).
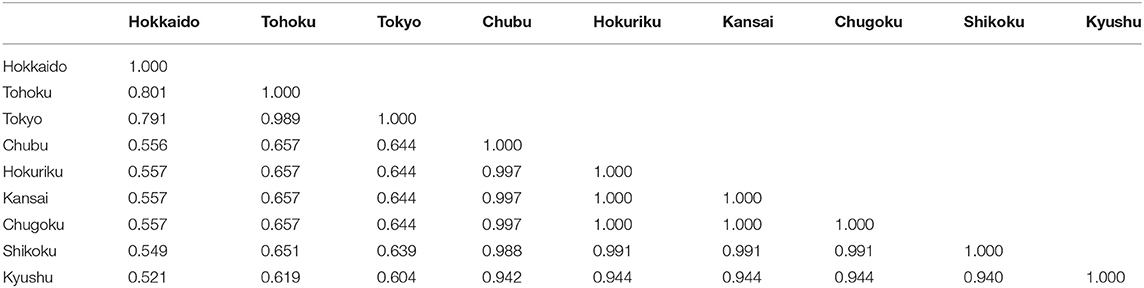
Table A1. Results of correlation analysis for each area price.
Keywords: merit order effect, wholesale electricity market, renewable energy, Japan, electricity price
Citation: Sakaguchi M and Fujii H (2021) The Impact of Variable Renewable Energy Penetration on Wholesale Electricity Prices in Japan Between FY 2016 and 2019. Front. Sustain. 2:770045. doi: 10.3389/frsus.2021.770045
Received: 03 September 2021; Accepted: 08 November 2021;
Published: 30 November 2021.
Edited by:
Shutaro Takeda, Kyoto University, JapanReviewed by:
Dimiter Ialnazov, Kyoto University, JapanEdwin Samir Pinto Maquilon, University of Zaragoza, Spain
Sumie Nakayama, Kyoto University, Japan
Copyright © 2021 Sakaguchi and Fujii. This is an open-access article distributed under the terms of the Creative Commons Attribution License (CC BY). The use, distribution or reproduction in other forums is permitted, provided the original author(s) and the copyright owner(s) are credited and that the original publication in this journal is cited, in accordance with accepted academic practice. No use, distribution or reproduction is permitted which does not comply with these terms.
*Correspondence: Hidemichi Fujii, hidemichifujii@econ.kyushu-u.ac.jp