Psychological pushing propagation in crowds—Does the observation of pushing behavior promote further intentional pushing?
 Helena Lügering
 Ahmed Alia1,2,3
 - 1Institute for Advanced Simulation 7: Civil Safety Research, Forschungszentrum Jülich, Jülich, Germany
- 2School of Architecture and Civil Engineering, University of Wuppertal, Wuppertal, Germany
- 3Department of Information Technology, An-Najah National University, Nablus, Palestine
- 4School of Humanities and Social Sciences, University of St. Gallen, St. Gallen, Switzerland
When large numbers of people come together (e.g., at concerts or religious gatherings), critical situations can arise easily. While physical factors such as crowd density play a role, people's behavior can also affect crowd dynamics. For example, pushing and shoving, which are closely related to density, can quickly contribute to potentially dangerous dynamics. There is little extant research, however, on why people start pushing in the first place. Aside from individual reasons (e.g., motivation), social reasons might also play a role: an initial instance of pushing might be imitated or spark a competition if the pusher seems to reach the goal faster or the behavior of individuals defines a group norm whether pushing is allowed or not. Practically speaking, these social factors should lead people to push because they perceive other pushers, or, in other words, a psychological pushing propagation occurs. To address this question, the behavior (pushing or non-pushing) of people in 14 different experimental runs of crowds walking through a bottleneck (N = 776) was assessed by two independent raters with the help of a rating system of forward motion. This assessment was then linked to the spatiotemporal positions of the participants to combine it with the neighborhood relations. Based on that, it was analyzed whether individuals who started to push were more likely to be in the direct neighborhood of individuals who were already pushing. Results showed a small but significant effect suggesting that there is an influence, but that pushing is not overly “contagious.”
1 Introduction
There are many different occasions for which people come together in small and large groups. Whether at concerts, religious gatherings, or train stations, crowded situations are everywhere. In such situations, however, people do not just behave in an orderly manner—by, for example, forming a queue. Sometimes they push and shove, and such behavior can have serious consequences: It has been shown, for instance, that pushing worsens the satisfaction of the people in the crowd (Filingeri et al., 2017). Furthermore, various bottleneck studies have indicated that high motivation of the group, which is often accompanied by pushing behavior, significantly increases the density (Haghani et al., 2019; Adrian et al., 2020; Zuriguel et al., 2020). Reports from real-life scenarios have shown that pushing also plays a role in the context of crowd accidents. However, people in critical situations usually do not push out of a sense of panic or selfishness to save themselves (for a critical discussion of the term “panic” in crowd accidents, see Lügering et al., 2023). Instead, people from behind continue to push because they want, for example, to get faster access and do not realize how serious the situation has become in the front (Johnson, 1987; Drury et al., 2015; Sieben and Seyfried, 2023).
When talking about pushing, it is important to know that this behavior can be understood in different ways and to distinguish between intentional and unintentional acts (Helbing and Mukerji, 2012). In unintentional pushing, an external impact on the person's body causes them to push against other individuals. In intentional pushing, the person applies energy themselves and thus builds up pressure on others. Unless stated otherwise, we refer to intentional pushing when talking about pushing in this paper. However, in addition to actively building up pressure from behind, we also consider other behaviors to be intentional pushing. In principle, we include any behavior that increases density in a crowd and can cause turbulence from behind, such as using gaps and being disproportionately close to the person in front. Thus, pushing behavior itself is very diverse. Moreover, crowds are usually not homogeneous with all people either pushing or not, but heterogeneous and dynamic, meaning that some people push, others do not, and the behavior changes over time (Üsten et al., 2022). These complex dynamics lead inevitably to the question of why people push in the first place.
Due to its impact on realistic crowd dynamics, various crowd models have attempted to integrate pushing behavior (Helbing et al., 2000; Henein and White, 2005; Pelechano et al., 2007; Kim et al., 2015; Fischer et al., 2020). In these models, pushing is usually considered as an action which is performed with a certain probability when an individual wants to move in a specific direction (e.g., toward a goal) and others obstruct the way. Henein and White (2005) added a second circumstance, namely that individuals push when someone else wants to move in their direction, i.e., they push to defend their position in the crowd. Sometimes people who push more are also characterized as being impatient, rude, or in a hurry (Pelechano et al., 2007; Kim et al., 2015). When thinking of (dense) crowds with a common goal, such as in bottleneck scenarios, however, there is in fact always someone in the way when moving forward. In addition, as long as no one gets hurt, pushing can also be fun. This has been shown anecdotally in our own experiments, in which the participants repeatedly expressed the joy of competing with each other. Furthermore, there are cultural phenomena at concerts which people initiate in order to push or to collide with each other, such as mosh pits, circle pits or the wall of death (Riches, 2011; Silverberg et al., 2013). Although these situations actually have a high risk of being injured (Janchar et al., 2000; Milsten et al., 2017), those involved enjoy them and explicitly want to be pushed (Riches, 2011). Yet the models largely disregard such aspects and generally lack a nuanced understanding about when and why some people push and others do not. But in fact, to the best of our knowledge, there are hardly any empirical studies that could provide these insights thus far.
One of the few psychological studies to yield initial evidence about pushing behavior is Drury et al. (2009). With a virtual reality approach, these researchers studied cooperative vs. competitive evacuation behavior in an underground environment. Competition was operationalized as the frequency with which others were pushed aside. They found out that there was more pushing behavior among low group identifiers (compared to high group identifiers) in mass emergencies. Additionally, the concern for others seemed to reduce the amount of pushing. In Adrian et al. (2020), participants evaluated their perceptions and behavior after taking part in a bottleneck experiment. Among other things, the results showed that pushing forward and filling gaps were perceived as strategies for faster access. This view was also already indicated by a previous study (Sieben et al., 2017). Further, many said that they had pushed because it was their task to reach the goal first or more quickly. Other reasons for pushing were that the participants were pushed from behind, that they saw others pushing, or that they wanted to escape.
Starting from these answers and elaborating and systematizing them further, a number of reasons for pushing are conceivable, which can be roughly classified as “individual” and “social.” According to this logic, individual reasons include everything that involves only the person itself, such as the demographics, the motivation to reach a goal or a personal preference for or against pushing. For instance, in Adrian et al. (2020), significantly more men reported to have been engaged in pushing. However, since such individual factors are rather stable, but pushing is a highly heterogenous behavior that can potentially change several times within a short period of time, it is improbable that individuality alone can explain this phenomenon. Therefore, it is essential to consider social reasons, too, as these reasons take the interaction between several people into account. Several years ago, Zeitz et al. (2009) reviewed the literature on crowd behavior at mass gatherings and concluded that undesired crowd behavior emerges when there is first a “seed,” i.e., individuals or a small group who show this behavior initially, which then incites the crowd to join in. This idea could also be applied to pushing behavior, whereby different mechanisms are conceivable as to why someone engages in pushing behavior when others do so. For instance, one person might simply imitate the behavior of others or competition might occur because a pusher seems to reach the goal faster and this is perceived as unfair. In cases where members of a crowd not only see the pushing behavior but are also pushed directly, they might also push back, whether in retaliation or to defend their own position [similar to the assumption in the model of Henein and White (2005)].
Moreover, social norms could be relevant in determining whether pushing is perceived as appropriate or allowed in a certain situation. Zeitz et al. (2009) stated that engaging in abnormal crowd behavior requires the modification of existing norms—an idea that can be mainly traced back to the Emergent Norm Theory (Turner and Killian, 1987). Originally, this theory hypothesized that new, non-traditional collective behavior emerges as a result of a crisis. However, even excluding exceptional precipitating events, there may not be clearly defined social norms for every situation (e.g., for different entrance scenarios). A queue, for instance, is a relatively well-defined social system in which cutting into the line or pushing is not acceptable. Instead, people get in line and wait unless they are allowed to overtake for a specific reason (e.g., queue-jumping in front of a ticket machine when one might otherwise miss the train) (Mann, 1969; Schmitt et al., 1992). If, on the other hand, the entrance is designed in a way that leads the crowd to form a semicircle and not a queue (i.e., an open space and not a corridor), the behavior perceived as appropriate changes and the situation is normatively more unclear. Evidence for this phenomenon is provided by the study of Adrian et al. (2020) in which the corridor width was varied during a bottleneck experiment. The questionnaire data showed that participants engaged in pushing slightly less frequently and observed less unfair behavior (i.e., mainly pushing forward) in the narrowest corridor that most resembled a queue. In another study, participants watched pictures and videos (taken from above) of two entrance scenarios, a semicircle and a corridor setup (Sieben et al., 2017). Afterward, they had to answer different questions including the inappropriate behavior observed and the social norms that apply in each scenario. Concerning forms of inappropriate behavior, participants mentioned pushing, shoving, and jostling for both setups. However, less inappropriate behavior was observed in the corridor compared to the semicircle setup. So, even if pushing is generally considered inappropriate, participants demonstrated this behavior—especially in experimental setups that lead to a semicircle formation. This pattern was also reflected in the norms mentioned. For the corridor, reminiscent of a queue, the three most frequent answers were “norm of queuing / lining up,” “orderly behavior,” and “pushing and shoving are forbidden.” Whereas for the semicircle it was “the strongest wins / right of the stronger,” “no rules,” and “first come, first served” (Sieben et al., 2017, p. 14). Thus, the prevailing norms in the latter setup do not clearly indicate whether pushing is permitted or prohibited.
So, all in all, the social norms that apply in an entrance situation, especially concerning pushing behavior, are not generally clear but seem to be partly influenced by the spatial structure. Thus, participants' observations of pushing behavior could resolve this ambiguous social situation and define a group norm that pushing is actually allowed. Regardless of the exact mechanism, though, all these social reasons cause individuals to start pushing because they are in contact with people who are already pushing, or in other words, a psychological propagation of pushing behavior occurs. We call this form of propagation “psychological,” because we are only dealing with the intentional onset of pushing. The purely physical reaction of the body when being pushed and therefore perhaps bumping into another person is not part of this research. Instead, we are interested in voluntary behavior.
The hypothesis of possible pushing propagation is already supported by both the results of Adrian et al. (2020)—pushing because one is pushed from behind or sees others pushing—and our own informal observations. During these unsystematic observations, we noticed that people who had contact with strong pushers intensified their behavior afterward. This does not, of course, apply to everyone. In Adrian et al. (2020) there were people who did not push at all. Frequently mentioned reasons for this in the questionnaire included a general rejection of pushing behavior, consideration for others, avoidance of danger, and the belief that pushing is inefficient. In such cases, propagation would probably not occur. Depending on the underlying mechanism, pushing propagation might also turn out differently under different circumstances. If, for example, the formation of a social norm is decisive, it is possible that the effect only occurs when several people in the vicinity are pushing, or that a certain proportion of pushers relative to the non-pushers must be reached. Furthermore, it may not only be a short-term propagation effect, but also related to crowd members' previous experiences in this situation. In other words, people who have had many contacts with pushers in the past may themselves start pushing at some point, even if the last contact was some time ago. Here again, the ratio between pushers and non-pushers could be decisive. Given the many potential complicating factors, this issue is very complex and requires systematic investigation. We therefore conducted a study using existing empirical material to examine whether and under what circumstances the behavior of neighbors influences whether a person starts pushing or not. Our main hypothesis was that there is a general influence. However, as this research approach is completely novel, most of the analysis was exploratory.
2 Method
2.1 Video material and rating of pushing behavior
To answer our research question, we used data from a previous bottleneck experiment conducted in Wuppertal, Germany, in 2018. The videos and trajectories including a short description of the experiment can be accessed via the Pedestrian Dynamics Data Archive (Forschungszentrum Jülich., 2018). For a more detailed description of the method and relevant ethical issues see Adrian et al. (2020). From all participants who took part in the experiment written and informed consent was obtained. In the experiment, there was no explicit instruction on how the participants should pass the bottleneck (e.g., being fast, being highly motivated, moving normally) but a more complex story was used. The participants were told to imagine that they were on their way to a concert by their favorite artist. In the “high motivation” condition the view was restricted from the back and participants sought to access the concert as quickly as possible to stand near the stage, whereas in the “low motivation” condition the view was good everywhere. Due to this implicit manipulation, we expected higher diversity of forward motion within the crowd as well as over time. This assumption was well supported by the results of the subsequent survey indicating that some participants pushed while others did not. This heterogeneity in behavior made the data set perfectly suited for our new research purpose.
For this secondary analysis, we chose all the experimental runs with more than 40 participants since the runs with fewer participants were too short to expect any meaningful social interactions. This selection resulted in 14 videos (out of 22)—seven low motivated and seven high motivated ones. For one pair of a high and a low motivation run, the group of participants was the same and consisted of N = 42 to N = 75 people. The videos lasted on average 48 sec for the high motivation condition and 53 sec for low motivation condition. The physical quantities of each run were analyzed by Adrian et al. (2020). To quantify the behavior of every participant over time, we used the rating system of forward motion established in Üsten et al. (2022). With this system, the behavior of each person at each moment in the video was assigned to one of four categories: (1) falling behind (e.g., being slower than the group), (2) just walking (e.g., going with the flow at an appropriate pace), (3) mild pushing (e.g., being disproportionately close or overtaking by using gaps), and (4) strong pushing (e.g., pulling people backwards or using a shoulder as a plow). In order to link the assessment of the behavior with the spatiotemporal position of the participants, the annotation function of the software Petrack (Boltes et al., 2010) was used. In this way, all participants received a rating for each frame—which was later aggregated to seconds using the median. A detailed description on how the method works and exactly which behaviors the individual categories include can be found in Üsten et al. (2022).
To ensure high quality of the rating, all the videos were evaluated by two independent raters. Please note that although the raters were aware of the pushing propagation hypothesis, due to its complexity, an intentionally hypothesis-compliant rating would not have been possible. Within the process, each person is looked at individually and independently of their neighbors, and the order of persons is determined by the random assignment of IDs by Petrack. Thus, when rating one person, the raters were not aware of what rating a neighboring person might have already received. In total, the forward motion of N = 776 participants was rated. The resulting data set had an overlap of 75.6% and a Krippendorff's alpha of 0.65. Given the complex nature of the chosen experimental videos (e.g., densities up to 9 people per m2, Adrian et al., 2020) which increases the difficulties of the rating system discussed in Üsten et al. (2022) (e.g., assessing small changes in behavior that are difficult to detect from above), this inter-coder reliability was considered acceptable (De Swert, 2012). Following the system's guidelines, the raters then revisited any cases of disagreement and compromised on a rating for each person in question. In this way, a unified data set was created. Since the original system consists of four categories, but for this question we are only interested in whether people push or not, the categories (1) falling behind and (2) just walking, as well as (3) mild pushing and (4) strong pushing, were subsequently combined. Thus, we had only two categories in our data set: (1) non-pushing and (2) pushing. Whether people are pushing or not is probably also the most relevant qualitative difference for crowd safety. Of course, it may get even more dangerous when pushing is stronger, however, as a first step, it seems more relevant whether people are pushing at all.
2.2 Identification of neighborhood relations
The videos of the analyzed experimental runs were recorded with 25 frames per second. For each time frame, we identified who is a neighbor with whom by a Python script. The identification was based on Voronoi cells (Voronoi, 1908), with two pedestrians being neighbors if their two individual cells share one border. However, we defined one restriction: The persons must not be further than 80 cm from each other since, in our view, a greater distance makes a direct influence less plausible (see Figure 1). The exact threshold of 80 cm was chosen because, in a test sample, it produced almost the same results with automatic neighbor detection as with manual detection. At a smaller distance, participants were not identified as neighbors, although they were evaluated as such by a human rater, and a larger distance resulted in the opposite issue. Further, similar to the rating of pushing behavior, once a person reached the bottleneck, they were no longer considered. The moment that there were only two participants or less in the experimental area, the identification process was terminated. That way, we obtained a list of neighboring persons for every single participant (i.e., target person) for every frame. But since one second was chosen as a minimum unit for the rating system (Üsten et al., 2022) and this is, in fact, more appropriate for human behavior than a frame-based analysis, the neighborhood relations were also condensed to one second. For this purpose, the state in the middle frame was chosen as reference for the respective second (e.g., frame 12 for second 1, frame 37 for second 2...).
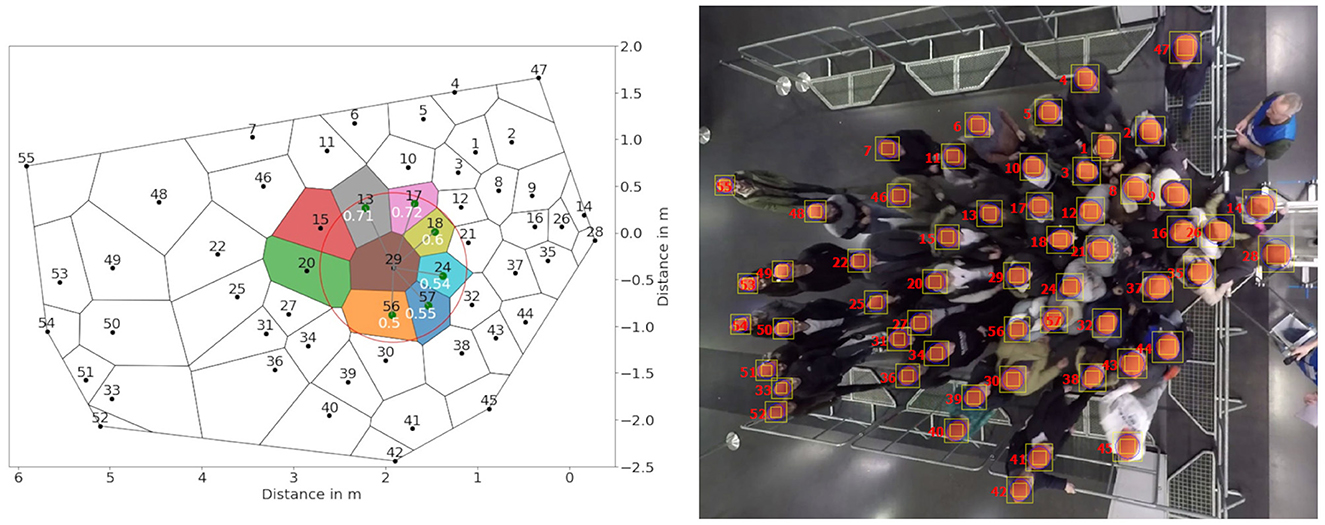
Figure 1. Exemplary neighborhood relations of target person (ID 29) based on the Voronoi technique. Participants with IDs 13, 17, 18, 24, 57, and 56 were considered neighbors of the target (ID 29) in this frame. Although participants with IDs 15 and 20 shared a border of a Voronoi cell with the target, they were not neighbors by definition because their distance was greater than 80 cm (red circle).
2.3 Combination of neighborhood relations and pushing rating
After combining the neighborhood relations and the assessment of the pushing behavior, we obtained a data set including every target person at every second plus the following information: (1) the condition (1 = “low motivation”, 2 = “high motivation”), (2) the second when the bottleneck is reached, (3) the behavior (1 = “non-pushing”, 2 = “pushing”) of the target person in this second, (4) all neighbors of the target person in this second, (5) the behavior of the neighbors (1 = “non-pushing”, 2 = “pushing”) in this second, (6) the absolute number of neighbors pushing in this second, (7) four different pushing scores (see next section), and (8) whether the target person will start pushing in the next second (0 = “no”, 1 = “yes”).
2.3.1 Different pushing scores
In order to examine whether the behavior of the neighbors can predict whether a target person will start pushing or not, four different pushing scores indicating the number of pushing neighbors were defined. Each score took different aspects into account and was calculated for every second in which the participants were in the experimental area regardless of their own pushing state.
a. Pushing score over the last three seconds (PS_3sec)
With the help of this score, we wanted to investigate whether there is a short-term pushing propagation. Since it is not realistic that the behavior of the neighbors influences a person from one second to the other, the behavior of all persons who were in the vicinity of the target person in the respective second plus two seconds before was included. Each pusher in the neighborhood scored one point. These points were added up over the three seconds. This also means that a single pusher neighboring the target person in all three seconds scored three points. Please note that for the first two seconds of each person, the pushing score obviously could not cover three seconds. However, in order to have a complete data set, we decided to still calculate a score by including only the first or the first two seconds.
b. Pushing score over the last three seconds relative to the total number of neighbors (PS_3sec_neigh)
It is not necessarily the absolute number of pushers in the neighborhood that is decisive, but the ratio between pushers to non-pushers. Therefore, the PS_3sec was divided by the total number of neighbors in the respective seconds to obtain the proportion of pushers in all neighbors. To make the results easier to interpret, the score is not given as a decimal number but as a percentage.
c. Cumulative pushing score (PS_total)
This score considered the “experiences” that the participants had gathered so far during the experimental run. Similar to the PS_3 sec, each pushing neighbor scored one point every second. This time, however, the points were not only added up over the last few seconds but over the entire period since the start of the run.
d. Cumulative pushing score relative to the total number of neighbors (PS_total_neigh)
Again, it might be the ratio between pushers and non-pushers that is relevant. So, the PS_total was divided by the total number of neighbors the target person had up to that time. Like the PS_3sec_neigh, this score is given as a percent.
2.4 Statistical analysis
While the data preparation was done with Python, all statistical analysis was either performed using IBM SPSS Statistics 29 or RStudio v2023.03.0. To first get an impression of the frequency of pushing in the experimental runs, we calculated the mean proportion of participants who push at least once during a run and the mean duration of individual pushing phases. Since we expected very different amounts of pushing behavior in high and low motivation videos, they were considered separately. This approach was also supported by the fact that the pushing rating is to some extent context-dependent and a pusher in a low motivation video is not necessarily assessed as a pusher in a high motivation video (see Üsten et al., 2022). The distinction was maintained for all further analysis.
Next, we looked more closely at the moments in which participants changed from a non-pushing status to a pushing state, or in other words, the moments in which they started pushing. In order to investigate whether the behavior of the neighbors shortly before a change had had an influence, all people who were in the vicinity of a target person in the prior three seconds were identified. Additionally, information on the behavior of the neighboring persons themselves in the respective second (i.e., non-pushing or pushing) was provided. All pushing neighbors were then summed up for each target person and each change (as some participants changed their behavior several times during one run) separately. Please note that in contrast to the pushing scores, every neighbor only counted once, even if they were around for several seconds and also pushed for several seconds. This procedure served to get a first idea on how many different pushers were actually in the vicinity shortly before a change in behavior. However, since we expected a high base rate of pushing behavior, especially in the high motivation videos, individuals probably often had one or more pushing neighbors, regardless of their own behavior. Therefore, a descriptively high percentage of changes involving pushing neighbors would be neither astonishing nor informative. We thus calculated the expected number of changes with pushing involvement using the overall percentage of time that participants had at least one pushing neighbor (regardless of their own behavior). We then used a Chi-square goodness-of-fit test to compare whether the observed number differed significantly from the expected number. Finally, repeated measurement logistic regressions (using the “glmer” function in the “lme4” package) were calculated to determine whether the start of pushing behavior in the next second can be predicted based on the four different pushing scores. The significance level was set at p < 0.05 for all statistical tests.
2.4.1 Transition phase
The statistical method of logistic regression assumes implicitly that there is a hard cut-off between non-pushing and pushing behavior, meaning that participants are classified as non-pushing one second, while they are pushing the next. Since it is not realistic for people to suddenly start pushing without mental preparation, this assumption might distort our statistics. To deal with that issue, we already considered not only the neighborly influences from one second to the next but included all neighbors in the three seconds before a change for our analysis. Likewise, it did not make much sense to count a target person two and three seconds before a change as a non-pushing case if the neighbors in these seconds were already perceived as possibly influencing a pushing start. This period of two seconds was accordingly treated as a transition phase and excluded from the analysis.
3 Results
3.1 Descriptive analysis of pushing propagation
In the high motivation videos, 82.2% of the participants pushed at least once during a run and, on average, each person stayed 11.35 sec in this state of pushing behavior. For the low motivation runs, these numbers were expectably lower. Nevertheless, 38.9% of the participants pushed at least once and they stayed in the pushing state for a mean of 8.28 sec. For a visualization of these changing dynamics in pushing behavior see the example in the Supplementary Video 1. Looking more closely at the moments of change, we had a total of 210 (high motivation) and 106 (low motivation) cases in which a participant moved from a non-pushing to a pushing state. When examining the behavior of the target person's neighbors three seconds before each change, it turned out that, in 91.4% (192 cases, high motivation) and 72.6% (77 cases, low motivation), there was at least one pushing neighbor in the vicinity. In many cases, however, there was even more than one—in runs with high motivation, the average number of pushing neighbors was 3.1 (range 1–10), while in runs with low motivation it was 2.1 (range 1–8).
Overall, and regardless of their own behavior, participants had at least one pushing neighbor in 85.7% (high motivation) or 51.7% (low motivation) of the time. Based on these percentages and the total number of actual cases in which a participant moved from a non-pushing to a pushing state, we would expect 180 (high motivation) and 55 (low motivation) changes to happen under pushing involvement. On a descriptive level, these numbers are lower than the observed ones. Calculating a Chi-square goodness-of-fit test, it turned out that the expected frequency also differed significantly from the observed ones for both conditions (high motivation: χ2 = 5.60, df = 1; p = 0.018; low motivation: χ2 = 18.29, df = 1; p < 0.001).
3.2 Prediction of target persons' behavior based on neighbors' behavior
Next, we used repeated measurement logistic regressions to examine if the different pushing scores significantly predicted the target persons' behavior in the next second. The results of all models can be found in Table 1 for high motivation and in Table 2 for low motivation runs. Dependent on whether the target person starts to push in the next second (= 1) or not (= 0), sample size, mean, and standard deviation are indicated separately for each pushing score. Further, the Akaike Information Criterion (AIC), the Odds Ratio (OR) with confidence interval (CI), the p-value as well as the marginal R2 (Nakagawa and Schielzeth, 2013) for each model are listed. An OR greater than 1 indicates that the odds of starting to push increases. The OR of 1.14 for the PS_3sec in the high motivation condition means, for example, that for each unit increase in this pushing score the odds of starting to push increases by 14%. The other ORs can be interpreted accordingly. The relation between the pushing score in one second and the predicted probability of a target person moving from a non-pushing to a pushing state in the next second are also depicted in Figure 2 (high motivation) and Figure 3 (low motivation) separately for each score. All in all, the logistic regressions revealed small but significant predictions for all models except for the PS_total in high motivation runs.
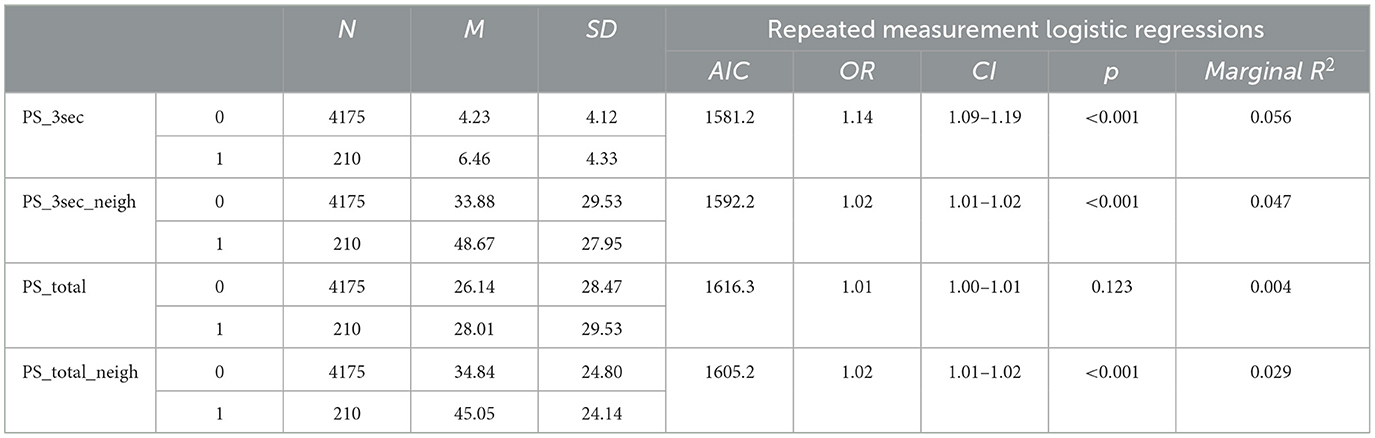
Table 1. Descriptive statistics and results of repeated measurement logistic regressions for high motivation runs.
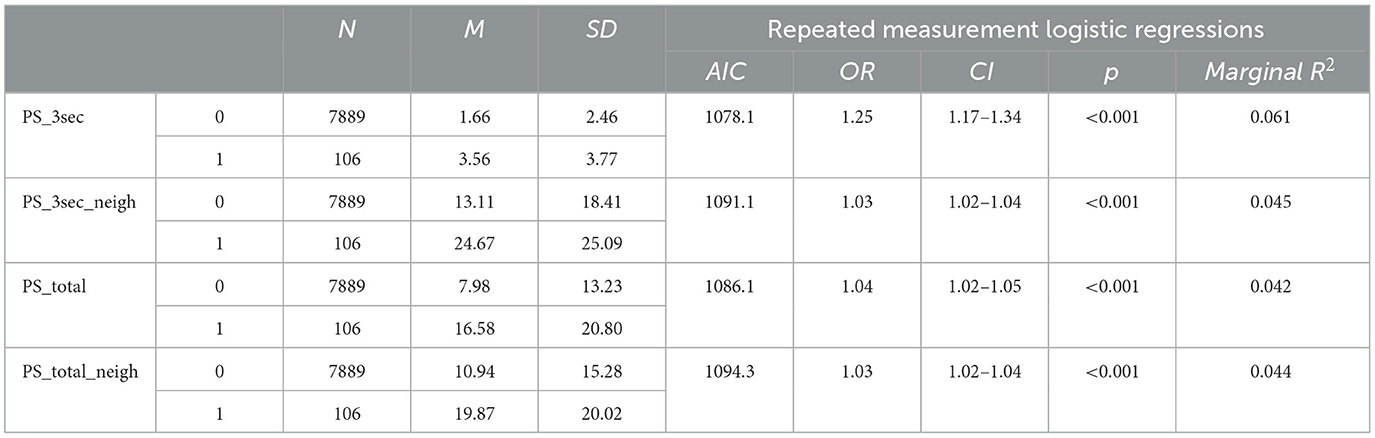
Table 2. Descriptive statistics and results of repeated measurement logistic regressions for low motivation runs.
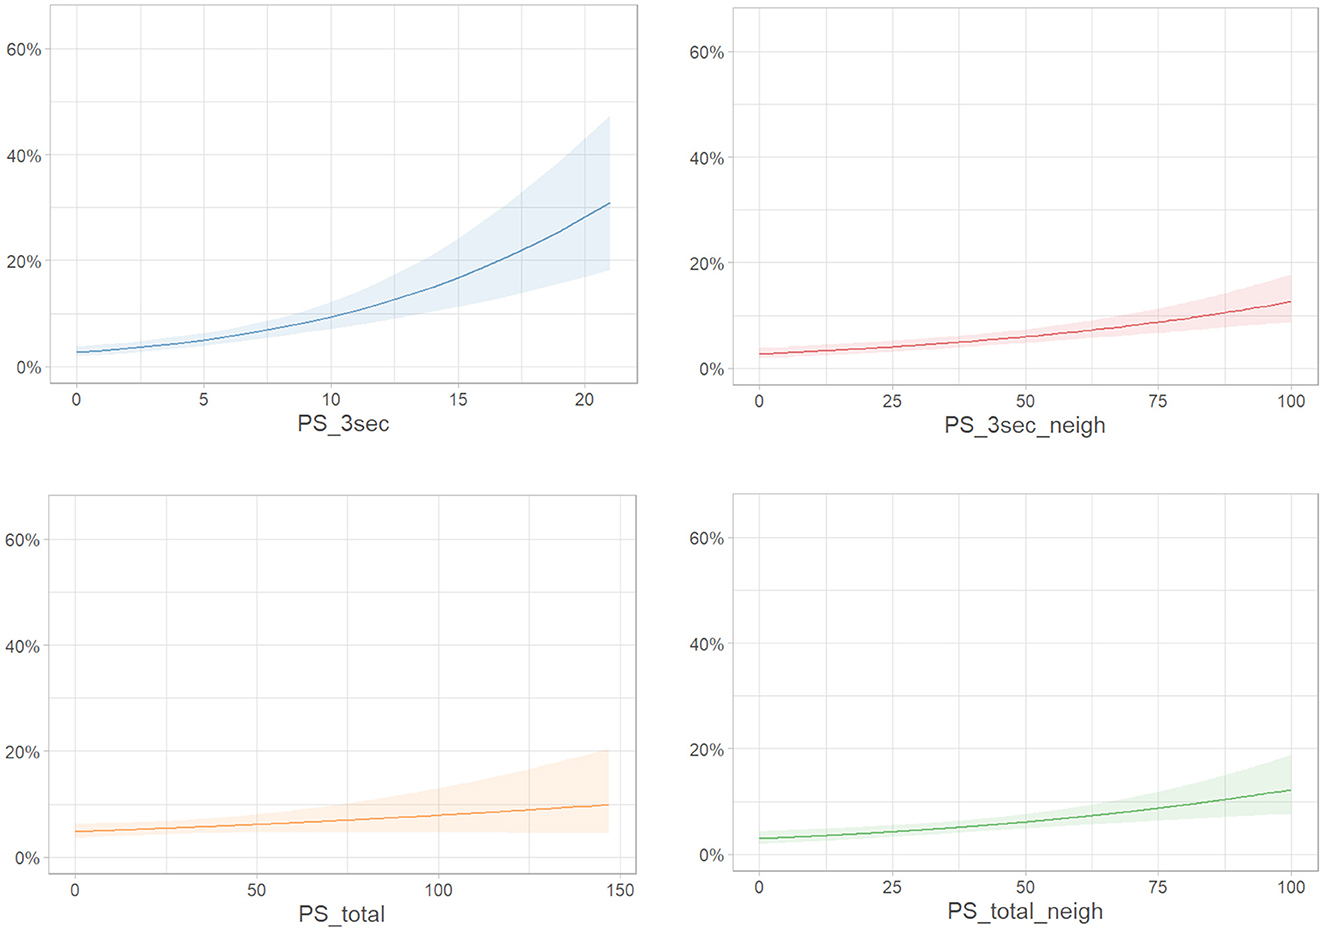
Figure 2. Predicted probabilities for start of pushing behavior in the next second in high motivation runs.
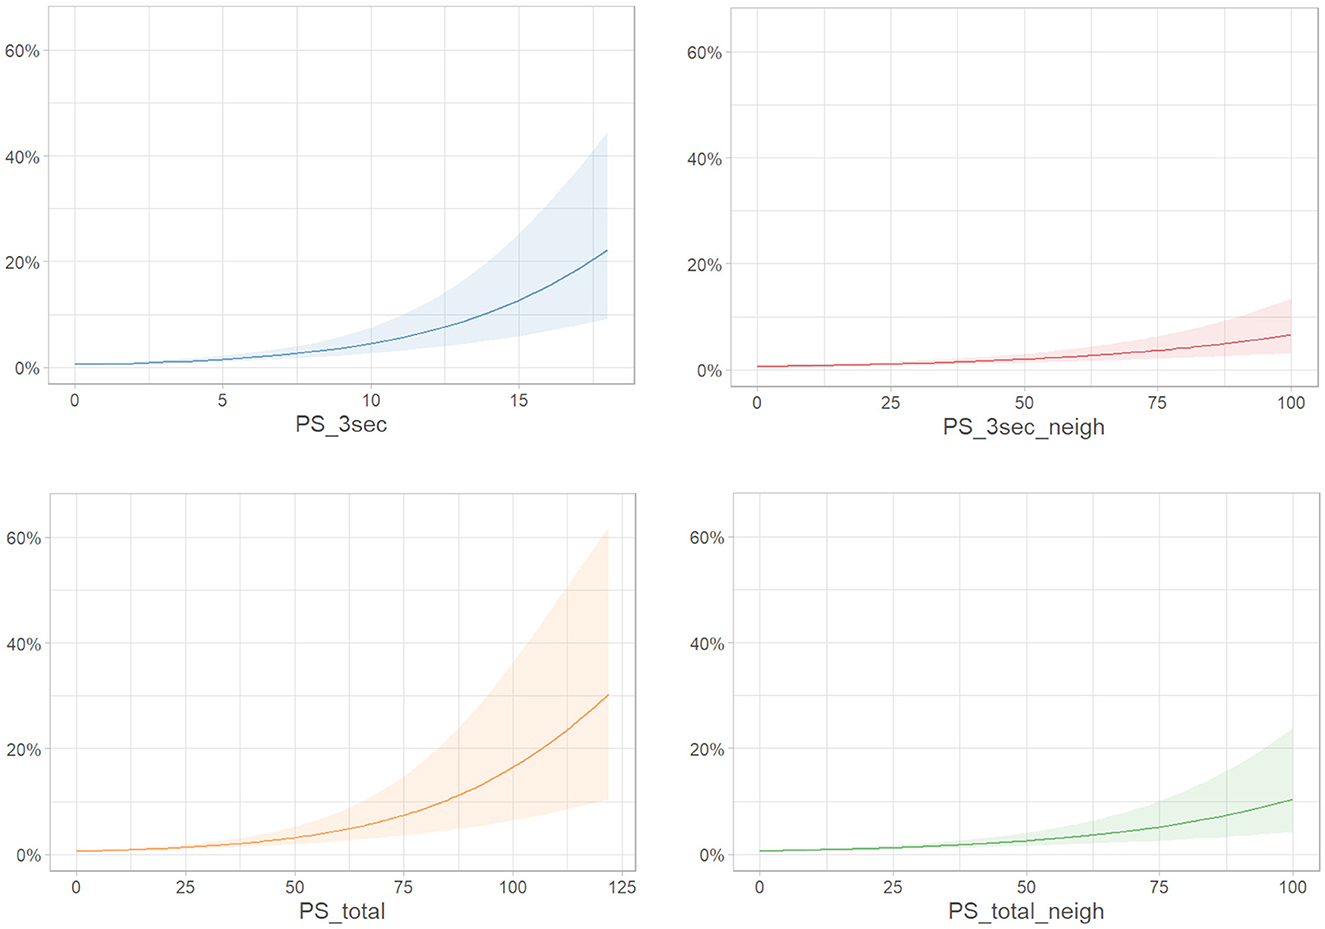
Figure 3. Predicted probabilities for start of pushing behavior in the next second in low motivation runs.
4 Discussion
The aim of this study was to show that the behavior of neighboring persons can influence whether someone starts to push or not. In addition, we wanted to examine whether the number of pushing neighbors at one moment or summed up for the entire situation is more important, and whether it is the absolute or relative number of pushers that is more decisive. All in all, our main hypothesis was confirmed as the analysis yielded small but convincing evidence of a psychological pushing propagation. The observed frequency of changes to a pushing state involving pushing neighbors was significantly higher than the expected one and an increase in a pushing score corresponded to an increase in the odds of starting to push for almost all scores. Only the PS_total does not provide a significant prediction in the high motivation runs, although it does in the low motivation runs. This somewhat surprising exception may be explained by the fact that, in high motivation runs, (strong) pushing is often accompanied by a faster reaching of the bottleneck. Participants who pushed at least once during these videos left the experimental area on average after 24 seconds. For those who did not push at all, the mean was 33 seconds. However, the PS_total “rewards” a longer stay in the experiment, since individuals who generally have more neighbors should also tend to have more contact with pushing neighbors and thus a higher score. As a result, participants who never push might have a higher PS_total than participants who push once in a while just because they have more time to collect points. In our analysis, this distortion is especially crucial when people who start pushing do so at a very early stage. Because then they may have a rather low PS_total, although there has already been comparatively much contact with pushers. This explanation is supported by the fact that the PS_total_neigh, which is relativized at the absolute number of neighbors, again provided a significant prediction. In the low motivation condition, by contrast, this problem was not quite as pronounced, since here pushing behavior is mostly expressed as being close, applying force from behind or, at most, using gaps. Pushing people to the side and thus reaching the bottleneck much faster hardly ever happened. Therefore, participants who never pushed stayed in the video for a similar amount of time (M = 29 seconds) as those who did at least once (M = 26 seconds). Presumably, this is why the score provided a better prediction for the low motivation runs, however, due to the susceptibility to the temporal component, it does not seem to be a reliable measure for the exposure to pushing behavior anyway.
Looking at the AIC, which is a measure of model fit, of each model in general, we found that actually neither the PS_total nor the PS_total_neigh nor the PS_3sec_neigh were good fits. In both motivation conditions, the model of the PS_3sec has the lowest AIC, indicating the comparatively best fit. Since according to Burnham and Anderson (2004) an increase of two units in the AIC already implies a significantly worse model, the performance of all other pushing scores was clearly lower. The PS_3sec is also conceptually the most straightforward value as it only considers pushing neighbors within the last three seconds. The relative proportion of pushers compared to the total number of neighbors thus seemed less relevant to the question of pushing propagation, as does the total pushing exposure throughout the whole experiment. This indicated that neighbors' behavior has a rather short-term effect on a pushing start.
Unfortunately, our study was not able to shed any light on the exact (social) psychological mechanism behind this effect. In particular, we could not conclusively determine whether the unclear social situation regarding the eligibility of pushing behavior was resolved by the emergence of a social norm. We assumed that this emergence might depend not on the absolute but on the relative number of pushers in the vicinity. In our study, however, both pushing scores that took the relative proportion into account (i.e., PS_3sec_neigh and PS_total_neigh) performed worse than the one that only depicts the absolute number (i.e., PS_3sec). Nevertheless, many participants who changed to a pushing state had not only one but several pushing neighbors in that situation. In addition, our results generally showed a “the more, the higher”-effect in terms of the relationship between pushing neighbors and the odds of starting to push. Hence, the social norm could also emerge as a result of several individuals engaging in pushing behavior, no matter how many others do not. In any case, further research is needed to understand the underlying mechanisms.
Despite all the significant results, however, it is also important to keep in mind that the effect is quite small. Increasing the PS_3sec by one point (i.e., one pushing neighbor for one second more), increased the odds for starting pushing by 14% in high motivation runs and 25% in low motivation runs. This means that, even with strong pushing exposure, the probability of starting to push in the next second is only about 30%. Furthermore, participants had high pushing scores even in situations in which they did not start pushing (e.g., for PS_3sec in high motivation runs: M = 4.23, SD = 4.12). We can thus conclude that pushing neighbors do not necessarily lead to intentional pushing. This is also a plausible and realistic finding because, contrary to Le Bon's assumptions (Le Bon, 1896), not everything in crowds is contagious. Even though apart from him, there are several other early theories on collective behavior that “accept the unanimity of the crowd as its most salient feature” (Turner and Killian, 1972, p. 21), the idea of crowds being completely homogenous was already critically questioned at that time (Turner and Killian, 1972). A more recent empirical study similarly showed that only a fraction of people engage in violent interactions at protest events or football matches (Adang, 2011). Systematic observations showed that at no time did more than 10% of individuals belonging to the same group (e.g., home fans) actively engage in violence in the same situation. In our study, 82.2% pushed at least once in the high motivation videos and 38.9% in the low motivation videos. These numbers are of course considerably higher than those found in the study of Adang (2011), but violent behavior is also more extreme than pushing behavior. Overall, however, it can be concluded that not everyone in a crowd engages in a certain type of behavior. This also corresponds to the findings of Adrian et al. (2020), according to which some participants simply do not want to push. When comparing the results of our secondary analysis with the original study, though, please note that the percentage of people who were rated as pushing at least once in our study was significantly higher than the percentage who self-reported pushing (Adrian et al., 2020). The self-report data only exists for the high motivation runs but here the proportion varies between 29.2 and 78.6% per run. However, this difference may simply be due to the fact that our rating was stricter and also included single, short pushing events that the participants may not have remembered when answering the questionnaire.
4.1 Further research
To the best of our knowledge, our study is the first to deal with psychological pushing propagation and to attempt to quantify its impact on crowd dynamics. Therefore, there are many open research questions to further pursue on this topic. For one thing, experiments could be conducted in which some individuals are specifically instructed to push, while all others are not given any specific instruction or are simply asked to behave as usual. In this way, it would be easier to explore the behavior of the neighbors in response to the pusher and to investigate pushing propagation more systematically. In such experiments, other influencing factors could also be examined to make the prediction more accurate. For example, the distance between the person pushing and the others or the spatial positioning (i.e., if the pusher is more in front of or behind someone) might be crucial for the strength of propagation. There may even be an interaction between the distance and the spatial positioning insofar that a propagation from behind only happens when the distance is very small, while the distance can be larger when the pusher is in the field of view. Moreover, the interaction with individual factors could be investigated. For example, certain personality traits may increase the susceptibility to propagation (e.g., less agreeable individuals may be more likely to push themselves after being pushed than highly agreeable individuals). The gender constellation of pusher and pushed person could change the dynamics, too, since at least in mosh pits, some men refuse to push women or push them less out of fear of injuring them (Riches, 2011). Following the study of Drury et al. (2009), it is also possible that social identity moderates the effect of pushing propagation. Further, as pushing behavior tends to increase when approaching the bottleneck (Üsten et al., 2023), pushing propagation might become more likely as well. There might be even a temporal influence, since highly motivated individuals might position themselves close to the bottleneck right at the beginning to be among the first, and at the same time these individuals might be particularly prone to pushing propagation. In general, the crowd context could be relevant as well. Our experiment was conducted with a concert framing where dancing, jumping and shoving is rather typical, whereas a conference (i.e., a more orderly setting) or a department store sale (i.e., an even more competitive setting) might evoke quite different dynamics. These examples already point out how intertwined individual, social and other situational factors are and that carefully planned experiments are needed to separate these theoretically distinct concepts from each other and better understand their influence. To additionally explore the exact mechanisms behind the effect of pushing propagation (e.g., imitation or competition), participants could be asked after the experiment to list reasons why they did or did not push when they saw others pushing. While they may not be conscious of some of the mechanisms, a closer inquiry could provide important insights.
An entirely different research idea would be to ask whether observing pushing behavior leads to changes in attitude toward that behavior rather than encouraging pushing per se. As Turner and Killian (1972) stated, it is possible for individuals who do not engage in a behavior to nevertheless change their attitude or feelings about it after seeing it in others. Adang (2011) reported something similar. In his study, a much larger proportion was indirectly involved in crowd violence with up to 80% supporting the behavior verbally. On the other hand, it is conceivable that witnessing people pushing might not lead to pushing propagation but in fact have an opposite reactance effect as people are reluctant to join in and even slow down as a result. In the original rating system, this behavior would correspond to the category “falling behind.” With the data set used in this study, however, the investigation of such an effect was rather impossible. Not only because we merged the categories “falling behind” and “just walking” into one “non-pushing” category, but also because the crowds studied were often so dense that it was hardly possible to fall behind. This behavior was observed more at the edges of the crowd, and, even if there were some participants in the middle who gave up, it would have been difficult to detect this in the videos taken from above. There were in fact a few extreme cases in which participants withdrew from of the crowd. However, these were too rare to systematically investigate a possible reactance effect.
4.2 Limitations
While our study does provide new and potentially important insights into the initial stages of pushing behavior, the methodology was admittedly highly simplified in many respects. First of all, we only examined bottleneck scenarios and no other crowd constellations. These setups are, however, the situations in which pushing and pushing propagation are most likely to occur, as everyone is trying to reach a common goal with limited accessibility. Furthermore, the analysis in this study only included the number of pushing neighbors and, to some extent, the length of the contact, but it neglected other factors that could improve the prediction of propagation, such as the distance between the persons. And even though the length of contact is at least partially accounted for in the two pushing scores that sum over the entire experiment (i.e., PS_total and PS_total_neigh), another limitation becomes apparent here. In the pushing scores, one second of pushing and one new pushing neighbor were weighted equally, meaning that three points could result either from one pusher being around for three seconds or three distinct pushing neighbors being there for one second each. For one thing, it is questionable whether this equation is conceptually appropriate. For another, it is not possible to distinguish whether a high pushing score is due to a target person's having had prolonged contact with a single pushing person or whether there was short-term contact with many pushers. Further, we aggregated the two categories “mild pushing” and “strong pushing” to just one pushing category which is why it was impossible to distinguish these different levels of pushing in our analysis. However, it is conceivable that simply being disproportionately close to the next person has a different impact on propagation than a strong push from behind. Moreover, the rating system of forward motion only allowed us to determine whether participants were pushing in general but not whom they were pushing specifically. As a result, we could not account for whether a target person was directly affected by a pushing neighbor or whether someone else nearby was actually being pushed. However, whether or not someone is being pushed directly could make a significant difference for their own behavior (due to retaliation or defense of the position). Finally, as no personal ID codes were used in this experiment, the questionnaire data as well as the demographics could not be reassigned to the participants in the videos which is why we could not include this information in our analysis. Overall, many of the limitations are due to the fact that this was a first attempt to study a psychological pushing propagation using secondary analysis of previous experiments that were not originally conducted for this purpose. Therefore, building on the results obtained here, new experiments should be designed to examine the effect in a more systematic and complex manner.
5 Conclusion
All in all, our research showed that psychological pushing propagation exists but that the effect is small. This is an important insight when it comes to the question as to why people start to push, and it could be useful for modeling crowd dynamics. Further research is essential to develop a deeper understanding of the underlying mechanisms and other factors bear consideration, for they might be equally important for the occurrence of pushing behavior. Pushing is multicausal and we should abandon the idea that everything in a crowd is highly contagious. People do influence each other, but only to a limited extent.
Data availability statement
The datasets presented in this study can be found in online repositories. The name of the repository and accession number can be found here: Pedestrian Dynamics Data Archive hosted by the Forschungszentrum Jülich, https://doi.org/10.34735/ped.2022.4.
Ethics statement
Ethical approval and written informed consent for participation were not required for the current study in accordance with the local legislation and institutional requirements. The original study involving humans was approved by the ethics board of the University of Wuppertal, Germany. The studies were conducted in accordance with the local legislation and institutional requirements. In the original study, written informed consent for participation and for the publication of any potentially identifiable images or data was obtained from the participants.
Author contributions
HL: Conceptualization, Data curation, Formal analysis, Investigation, Methodology, Project administration, Validation, Visualization, Writing—original draft, Writing—review & editing. AA: Data curation, Formal analysis, Software, Visualization, Writing—review & editing. AS: Supervision, Writing—review & editing.
Funding
The author(s) declare financial support was received for the research, authorship, and/or publication of this article. This study has received funding from the European Union's Horizon 2020 research and innovation programme under grant agreement No 899739 (CrowdDNA).
Acknowledgments
We thank Mira Beermann for her advice on the statistical analysis and Juliane Adrian for the video visualization of the pushing rating data.
Conflict of interest
The authors declare that the research was conducted in the absence of any commercial or financial relationships that could be construed as a potential conflict of interest.
Publisher's note
All claims expressed in this article are solely those of the authors and do not necessarily represent those of their affiliated organizations, or those of the publisher, the editors and the reviewers. Any product that may be evaluated in this article, or claim that may be made by its manufacturer, is not guaranteed or endorsed by the publisher.
Supplementary material
The Supplementary Material for this article can be found online at: https://www.frontiersin.org/articles/10.3389/frsps.2023.1263953/full#supplementary-material
References
Adang, O. M. J. (2011). “Initiation and escalation of collective violence: an observational study,” in Preventing Crowd Violence, eds T. D. Madensen and J. Knutsson (London: Lynne Rienner Publishers), 47–68. doi: 10.1515/9781588269416-006
Adrian, J., Seyfried, A., and Sieben, A. (2020). Crowds in front of bottlenecks at entrances from the perspective of physics and social psychology. J. Roy. Soc. Interface 17, 20190871. doi: 10.1098/rsif.2019.0871
Boltes, M., Seyfried, A., Steffen, B., and Schadschneider, A. (2010). “Automatic extraction of pedestrian trajectories from video recordings,” in Pedestrian and Evacuation Dynamics 2008, eds W. W. F. Klingsch, C. Rogsch, A. Schadschneider, and M. Schreckenberg (New York, NY: Springer Berlin Heidelberg), 43–54. doi: 10.1007/978-3-642-04504-2_3
Burnham, K. P., and Anderson, D. R. (2004). Multimodel Inference: understanding AIC and BIC in Model Selection. Sociol. Methods Res. 33, 261–304. doi: 10.1177/0049124104268644
De Swert, K. (2012). Calculating inter-coder reliability in media content analysis using Krippendorff's Alpha. Center for Politics and Communication.
Drury, J., Cocking, C., Reicher, S., Burton, A., Schofield, D., Hardwick, A., et al. (2009). Cooperation versus competition in a mass emergency evacuation: a new laboratory simulation and a new theoretical model. Behav. Res. Meth. 41, 957–970. doi: 10.3758/BRM.41.3.957
Drury, J., Novelli, D., and Stott, C. (2015). Managing to avert disaster: explaining collective resilience at an outdoor music event. Euro. J. Soc. Psychol. 45, 533–547. doi: 10.1002/ejsp.2108
Filingeri, V., Eason, K., Waterson, P., and Haslam, R. (2017). Factors influencing experience in crowds—The participant perspective. Appl. Ergonom. 59, 431–441. doi: 10.1016/j.apergo.2016.09.009
Fischer, M., Jankowiak, G., and Wolfram, M.-T. (2020). Micro- and macroscopic modeling of crowding and pushing in corridors. Netw. Heterogen. Media 15, 405–426. doi: 10.3934/nhm.2020025
Forschungszentrum Jülich. (2018). Crowds in Front of Bottlenecks from the Perspective of Physics and Social Psychology [data set]. doi: 10.34735/PED.2018.1
Haghani, M., Sarvi, M., and Shahhoseini, Z. (2019). When ‘push' does not come to ‘shove': Revisiting ‘faster is slower' in collective egress of human crowds. Transport. Res. Part A: Policy Pract. 122, 51–69. doi: 10.1016/j.tra.2019.02.007
Helbing, D., Farkas, I., and Vicsek, T. (2000). Simulating dynamical features of escape panic. Nature 407, 487–490. doi: 10.1038/35035023
Helbing, D., and Mukerji, P. (2012). Crowd disasters as systemic failures: analysis of the love parade disaster. EPJ Data Science 1, 1–40. doi: 10.1140/epjds7
Henein, C. M., and White, T. (2005). “Agent-based modelling of forces in crowds,” in Multi-Agent and Multi-Agent-Based Simulation. MABS 2004. Lecture Notes in Computer Science, eds P. Davidsson, B. Logan, and K. Takadama, vol 3415 (New York, NY: Springer), pp 173–184. doi: 10.1007/978-3-540-32243-6_14
Janchar, T., Samaddar, C., and Milzman, D. (2000). The mosh pit experience: emergency medical care for concert injuries. Am. J. Emerg. Med. 18, 62–63. doi: 10.1016/S0735-6757(00)90051-2
Johnson, N. R. (1987). Panic at “the who concert stampede”: an empirical assessment. Soc. Probl. 34, 362–373. doi: 10.2307/800813
Kim, S., Guy, S. J., Hillesland, K., Zafar, B., Gutub, A. A.-A., and Manocha, D. (2015). Velocity-based modeling of physical interactions in dense crowds. Vis. Comput. 31, 541–555. doi: 10.1007/s00371-014-0946-1
Lügering, H., Tepeli, D., and Sieben, A. (2023). It's (not) just a matter of terminology: Everyday understanding of “mass panic” and alternative terms. Safety Sci. 163, 106123. doi: 10.1016/j.ssci.2023.106123
Mann, L. (1969). Queue culture: the waiting line as a social system. Am. J. Sociol. 75, 340–354. doi: 10.1086/224787
Milsten, A. M., Tennyson, J., and Weisberg, S. (2017). Retrospective analysis of Mosh-Pit-Related Injuries. Prehospit. Disast. Med. 32, 636–641. doi: 10.1017/S1049023X17006689
Nakagawa, S., and Schielzeth, H. (2013). A general and simple method for obtaining R2 from generalized linear mixed-effects models. Methods Ecol. Evol. 4, 133–142. doi: 10.1111/j.2041-210x.2012.00261.x
Pelechano, N., Allbeck, J. M., and Badler, N. I. (2007). “Controlling individual agents in high-density crowd simulation,” in Proceedings of the 2007 ACM SIGGRAPH/Eurographics Symposium on Computer Animation, 99–108. Available online at: https://repository.upenn.edu/hms/210
Riches, G. (2011). Embracing the chaos: mosh pits, extreme metal music and liminality. J. Cult. Res. 15, 315–332. doi: 10.1080/14797585.2011.594588
Schmitt, B. H., Dub,é, L., and Leclerc, F. (1992). Intrusions into waiting lines: does the queue constitute a social system? J. Personal. Soc. Psychol. 63, 806–815. doi: 10.1037/0022-3514.63.5.806
Sieben, A., Schumann, J., and Seyfried, A. (2017). Collective phenomena in crowds—Where pedestrian dynamics need social psychology. Plos One 12, e0177328. doi: 10.1371/journal.pone.0177328
Sieben, A., and Seyfried, A. (2023). Inside a life-threatening crowd: analysis of the Love Parade disaster from the perspective of eyewitnesses. Safety Sci. 166, 106229. doi: 10.1016/j.ssci.2023.106229
Silverberg, J. L., Bierbaum, M., Sethna, J. P., and Cohen, I. (2013). Collective motion of humans in mosh and circle pits at heavy metal concerts. Physic. Rev. Lett. 110, 228701. doi: 10.1103/PhysRevLett.110.228701
Turner, R. H., and Killian, L. M. (1972). Collective Behavior (2d ed). Englewood Cliffs, NJ: Prentice-Hall.
Turner, R. H., and Killian, L. M. (1987). Collective Behavior (3rd ed.). Englewood Cliffs, NJ: Prentice-Hall.
Üsten, E., Lügering, H., and Sieben, A. (2022). Pushing and non-pushing forward motion in crowds: a systematic psychological observation method for rating individual behavior in pedestrian dynamics. Collect. Dynam. 7, 1–16. doi: 10.17815/CD.2022.138
Üsten, E., Schumann, J., and Sieben, A. (2023). Exploring the dynamic relationship between pushing behavior and crowd dynamics. Collect. Dynam. 8, 1–29. doi: 10.17815/CD.2023.143
Voronoi, G. (1908). Nouvelles applications des paramètres continus à la théorie des formes quadratiques. Journal Für Die Reine Und Angewandte Mathematik 133, 97–178. doi: 10.1515/crll.1908.133.97
Zeitz, K. M., Tan, H. M., Grief, M., Couns, P., and Zeitz, C. J. (2009). Crowd behavior at mass gatherings: a literature review. Prehospit. Disast. Med. 24, 32–38. doi: 10.1017/S1049023X00006518
Keywords: pedestrian dynamics, pushing propagation, pushing behavior, social psychology, crowds, social norms
Citation: Lügering H, Alia A and Sieben A (2023) Psychological pushing propagation in crowds—Does the observation of pushing behavior promote further intentional pushing? Front. Soc. Psychol. 1:1263953. doi: 10.3389/frsps.2023.1263953
Received: 20 July 2023; Accepted: 26 October 2023;
Published: 28 November 2023.
Edited by:
Mitch Brown, University of Arkansas, United StatesReviewed by:
Matthew Hibbing, University of California, Merced, United StatesAlicia Macchione, West Texas A&M University, United States
Copyright © 2023 Lügering, Alia and Sieben. This is an open-access article distributed under the terms of the Creative Commons Attribution License (CC BY). The use, distribution or reproduction in other forums is permitted, provided the original author(s) and the copyright owner(s) are credited and that the original publication in this journal is cited, in accordance with accepted academic practice. No use, distribution or reproduction is permitted which does not comply with these terms.
*Correspondence: Helena Lügering, h.luegering@fz-juelich.de