JPSS-3 / 4 VIIRS response versus scan angle characterization and performance
 Jeff McIntire
 David Moyer2
  Amit Angal
- 1Science Systems and Applications, Inc., Lanham, MD, United States
- 2The Aerospace Corporation, El Segundo, CA, United States
- 3NASA Goddard Space Flight Center, Greenbelt, MD, United States
Scientific studies of the Earth’s climate increasingly rely on high-quality satellite observations. The Visible Infrared Imaging Radiometer Suite (VIIRS) is a key sensor onboard a series of satellites [Suomi National Polar-orbiting Partnership (SNPP) and Joint Polar-orbiting Satellite System 1–4 (JPSS-1–JPSS-4)] that generate scientific data from land, ocean, and atmosphere used in these climate models. Providing quality scientific data from space-borne sensors requires the instruments to be well-calibrated. While much of the calibration can be maintained on-orbit, some aspects of the calibration can best be measured prior to launch. One VIIRS parameter that needs to be measured pre-launch is the response versus scan angle (RVS). The RVS measures the relative change in the reflectance of the scanning optics as a function of the angle of incidence. With the RVS, the gain calibration measured on-orbit can be transferred to any scan angle. The JPSS-3 and JPSS-4 instruments have undergone ground testing including the RVS measurements, which is the subject of this work. Results indicate that the measurements are comparable to previous VIIRS builds and are expected to contribute to the generation of high-quality science data once JPSS-3 and JPSS-4 are on-orbit.
1 Introduction
The response versus scan angle (RVS) is a key parameter Moyer et al. (2016); McIntire et al. (2017) used in the calibration of the Visible Infrared Imaging Radiometer Suite (VIIRS), which is currently on-orbit on the platforms Suomi National Polar-orbiting Partnership (SNPP) Cao et al. (2013); Xiong et al. (2014), Joint Polar-orbiting Satellite System 1 (JPSS-1) Xiong et al. (2016), and Joint Polar-orbiting Satellite System 2 (JPPS-2) Oudrari et al. (2018). Additional VIIRS instruments are scheduled to fly on JPSS-3 McIntire et al. (2022) and JPSS-4 with launch dates set for 2032 and 2028 respectively. Each VIIRS build undergoes a rigorous ground test program to calibrate the sensor and prepare for the sensor calibration to be transferred to on-orbit operations. Some of the calibration parameters can be updated once the instrument is on orbit. However, there are some parameters that can best be measured prior to launch; one such parameter is the RVS. The RVS is the relative variation of the reflectance of the scanning optics as a function of the angle of incidence. Measurements of the RVS were made as part of a comprehensive ground test program for JPSS-3 and JPSS-4 VIIRS conducted by Raytheon Technologies in El Segundo, CA in 2019 and 2021 respectively. It is the analysis of these measurements and comparisons to earlier builds that is the focus of this work [preliminary results for JPSS-3 were published McIntire et al. (2021)].
On-orbit the calibration of VIIRS is maintained by measurements of the solar diffuser illuminated by the Sun (for the reflective bands) or measurements of a temperature-controlled onboard blackbody (for the thermal bands). In order to transfer this calibration to any scan angle, the RVS must be measured with high fidelity. For the reflective bands, the RVS enters as a multiplicative factor; for the thermal bands, the contribution of the RVS is more complicated, but to leading order also scales as a multiplicative factor. On orbit, the RVS can be measured, but not with high fidelity, using ground targets for the reflective bands Wu et al. (2017) and a pitch maneuver for the thermal bands Wu et al. (2018); Wang et al. (2019). For SNPP, JPSS-1, and JPSS-2 VIIRS, on-orbit measurements have confirmed the pre-launch RVS (an error in a look-up table caused some initial discrepancy for JPSS-1, but has subsequently been corrected). Thus, the RVS measurements prior to launch are critical to the maintenance of the calibration once the sensor reaches orbit.
The RVS was measured for all previous VIIRS builds, and the testing and analysis methodology have not substantially changed; as a result, this work will focus not only on the results for JPSS-3 and JPSS-4 but also on the comparison to early VIIRS builds. Section 2 will give a brief overview of the sensor design and test architecture; Section 3 will provide an overview of the analysis methodology. Section 4.1 will discuss the reflective band RVS, while the thermal band RVS will be described in Section 4.2. Section 5 will provide some conclusions.
2 JPSS-3/JPSS-4 sensor design and testing program
The VIIRS sensor design incorporates scanning optics to image a swath of the Earth perpendicular to the direction of spacecraft motion as it orbits the Earth Xiong et al. (2014). This includes a rotating telescope assembly (RTA) and a half-angle mirror (HAM). The RTA is a three-mirror anastigmat that rotates once about every 1.7 s. The HAM is a double-sided mirror rotating at half the speed of the RTA that de-rotates the light and passes the beam into the aft-optics. The only optic for which the angle of incidence (AOI) changes is the HAM. It is the variation in reflectance as a function of the HAM AOI that is captured in the RVS parameters Moyer et al. (2016); McIntire et al. (2017).
VIIRS is a filtered radiometer and has 22 spectral bands covering a wavelength range from roughly 0.4–12 μm Xiong et al. (2014). These bands are listed in Table 1 with their respective center wavelengths (note that the 12.013 μm band has two entries; these are combined via TDI on-orbit, but their RVS is measured separately here). These bands are divided into two groups based on the main radiation source they will measure on orbit: reflective solar bands (RSB, I1-I3, M1-M11, and DNB) measure solar radiance reflected off the Earth and thermal emissive bands (TEB, I4-I5, and M12-M16) measure thermal radiation emitted by the Earth. These two groups of bands were measured separately in ground testing as different sources were required to generate sufficient radiance for measurement fidelity.
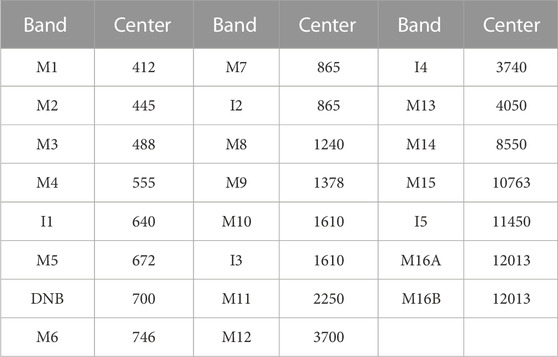
TABLE 1. VIIRS spectral bands along with their nominal center wavelengths (in nm).
The testing for both sets of bands occurred under ambient conditions Moyer et al. (2016); McIntire et al. (2017). VIIRS was placed on a rotary table with the scan plane perpendicular to gravity. A source was placed in the Earth view and the instrument rotated to view this source at different scan angles (corresponding to different HAM AOI). The space view, which provides a dark offset measurement, had an ambient target attached to the rotary table such the instrument viewed this source in the space view for all measurements. For the RSB, a 100 cm integrating sphere was used, illuminated by four 200 W halogen lamps. Two external radiometers actively monitored the output of the sphere and were used to remove any source drift. Humidity monitors were also active for use in correcting the varying atmospheric transmission for band M9. For the TEB, a cavity-type blackbody was used as an extended source, whose temperature was controlled at ∼345 K; an internal blackbody source (used for on-orbit calibration) was controlled at ∼312 K. Data acquired from these tests was then analyzed via the methodology described in the next section and in McIntire et al. (2017).
The list of measurements for JPSS-3 and JPSS-4 are provided in Tables 2, 3 for RSB and TEB respectively. For the JPSS-4 RSB test, one of the radiance monitors was not active for measurements 7–10; this resulted in the additional measurements 16–20. Unfortunately, this radiance monitor was also not on for measurement 18. The radiance monitor in question was used to detrend bands I3 and M8-M11; as a result, these bands did not use the affected data in the following analysis.
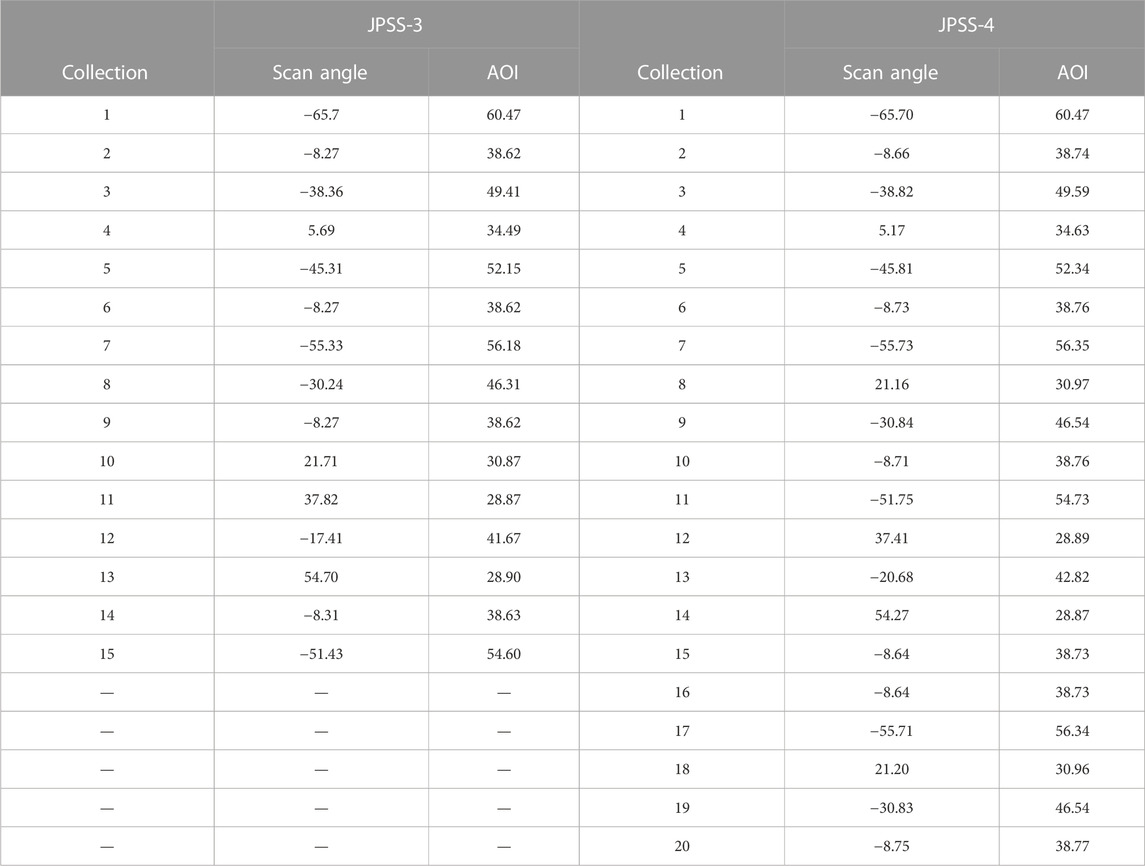
TABLE 2. JPSS-3 and JPSS-4 VIIRS measurements for the RSB bands including scan angle and AOI (both in degrees) in the order measured.
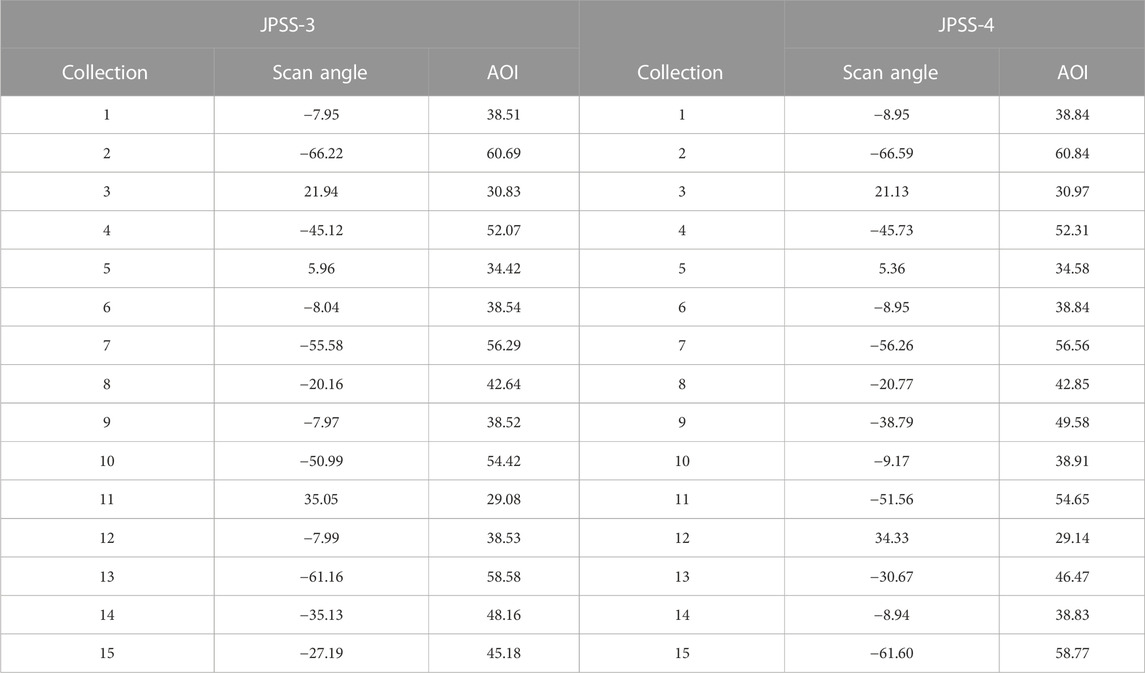
TABLE 3. JPSS-3 and JPSS-4 VIIRS measurements for the TEB bands including scan angle and AOI (both in degrees) in the order measured.
3 Analysis methodology
The analysis methodology described here follows from McIntire et al. (2017). The HAM AOI is related to the scan angle (θ) by the equation
here the AOI is a compound angle of the scan angle and an out-of-plane tilt angle (28.6°) that folds the light into the aft optics.
The dark data is used as an offset subtraction for all pixels. Then a scan profile of the source is used to generate a centroid, around which 20 pixels are averaged together over all scans. For the RSB, this average dn is then corrected for drift using the appropriate radiance monitor. A humidity model described in McIntire et al. (2017) was also used to correct band M9. For the TEB, there is a more complicated equation relating the different thermal sources, including those inside the instrument which depend on the scan angle; this equation is given below
where the L denotes the radiance for a given source (int and ext refer to the internal and external blackbodies). RVSint and RVSext represent the RVS at the view angles of the internal and external sources.
Then the measured RVS is fit to a quadratic polynomial in the HAM AOI, or
The coefficients ai are determined via a least-squares fit to the available data, which covers the expected HAM AOI range on-orbit (28.6–60.5°). The final RVS is normalized to the AOI at the SV (60.47°). As there can be some differences in the reflectance of the two HAM sides, results were reported independently for both (referred to as HAM A and B). The uncertainties are propagated through this analysis, as described in McIntire et al. (2017).
4 Analysis results
4.1 RSB and DNB RVS performance
Fits to the available data were made for all RSB and the DNB using the methodology outlined in Section 3 and in McIntire et al. (2017). An example of the un-normalized fitting for JPSS-4 band M1 (HAM side A) is shown in Figure 1. The symbols represent the measured data and the lines denote the fit RVS functions. The fit lines show good agreement with the measured data, and this is also true for all other RSBs. This is illustrated in Figures 2, 3 for all RSB and the DNB (for a middle detector). Here HAM sides A and B are denoted by solid and dashed lines. The green and purple lines represent the JPSS-3 and JPSS-4 VIIRS RVS performance; black, red, and blue denote the performance for SNPP, JPSS-1, and JPSS-2 VIIRS Moyer et al. (2016); McIntire et al. (2017). In general, the RVS for the two HAM sides is very consistent for SNPP, JPSS-2, JPSS-3, and JPSS-4. Some HAM side differences were observed for JPSS-1 due to the two sides of the HAM mirror being coated at very different times Moyer et al. (2016). Additionally, the detector variation in a given band is small across all reflective bands, as seen in Figure 1. The RVS in Figures 2, 3 are normalized to the space view angle (AOISV = 60.47). The AOI used on-orbit ranges from about 28.6 to 60.5°. The largest variation over this range occurs for the bluest bands (M1-M3) with up to about 1.5% change. The variation is smallest for bands I2, M7, and M11 with less than 0.1% change observed. An atmospheric correction has been applied to band M9, as shown in Figure 4 for JPSS-4. The A plot shows the M9 RVS without the correction and the B plot shows the RVS after the correction was applied. Similar results were obtained for JPSS-3 band M9.
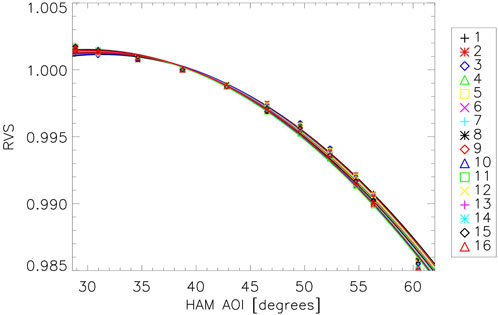
FIGURE 1. JPSS-4 band M1 RVS fitting (HAM side A). Symbol/color combinations listed in the legend denote different detectors in band M1.
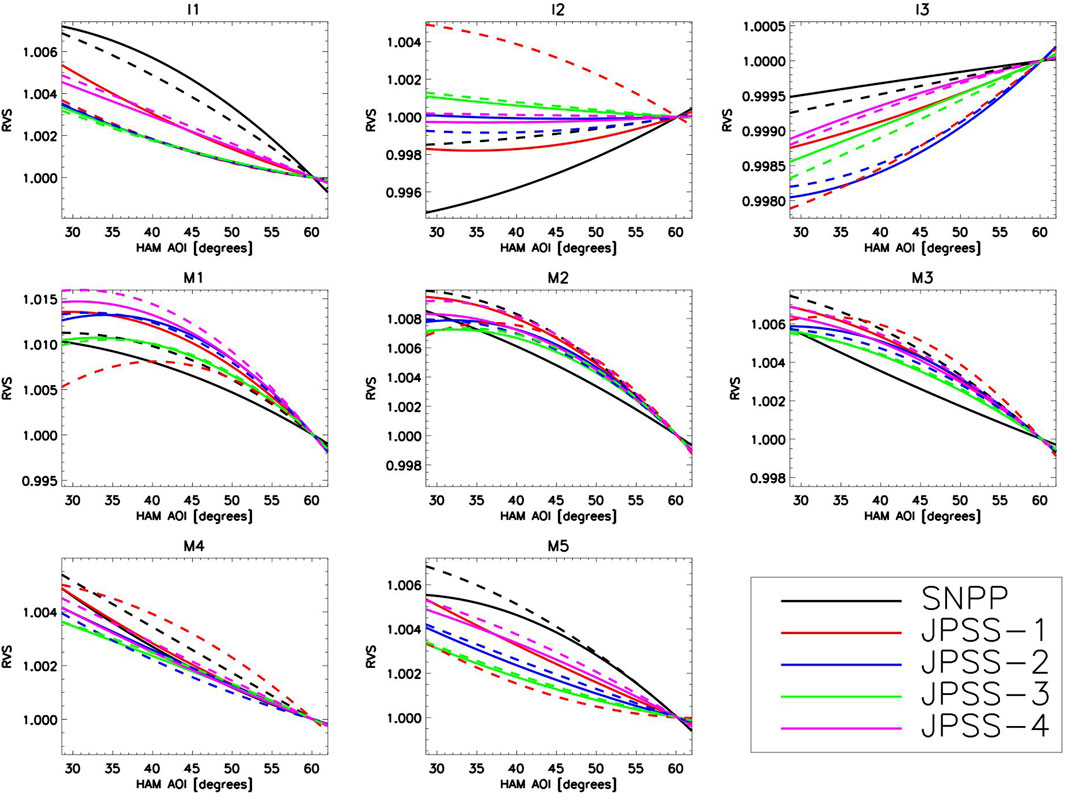
FIGURE 2. VIIRS RVS for bands I1-I3 and M1-M5. HAM sides A and B denoted by solid and dashed lines.
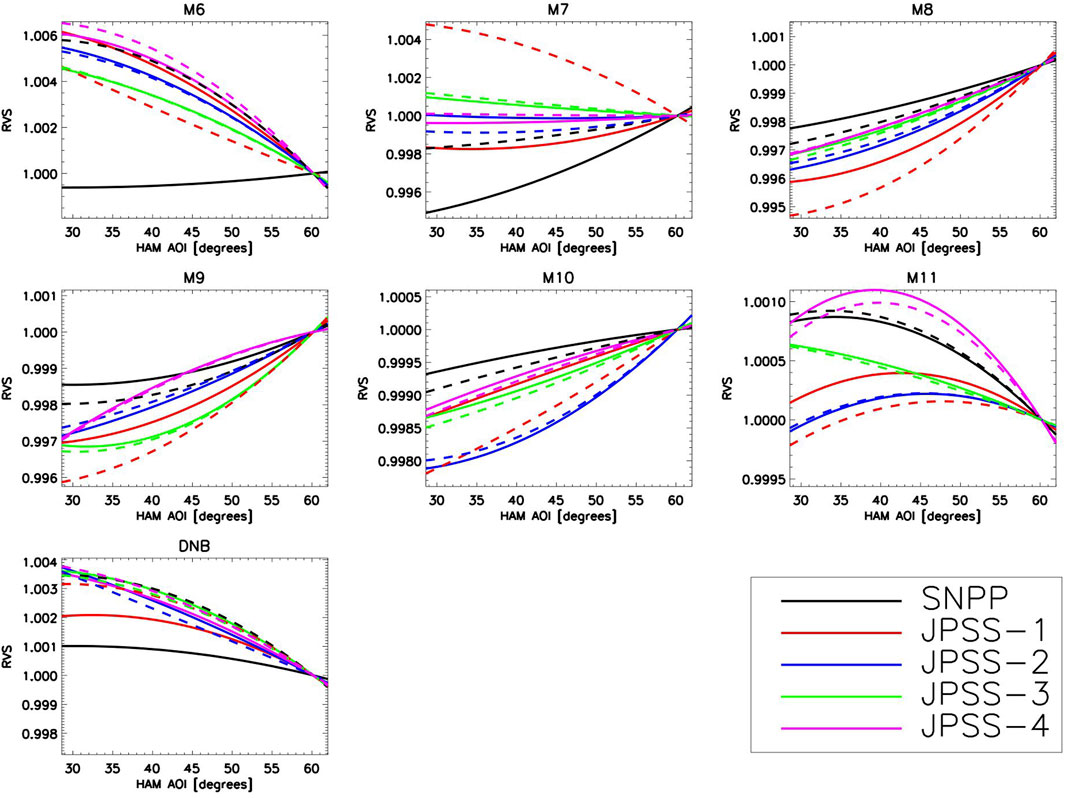
FIGURE 3. VIIRS RVS for bands M6–M11 and the DNB. HAM sides A and B denoted by solid and dashed lines.
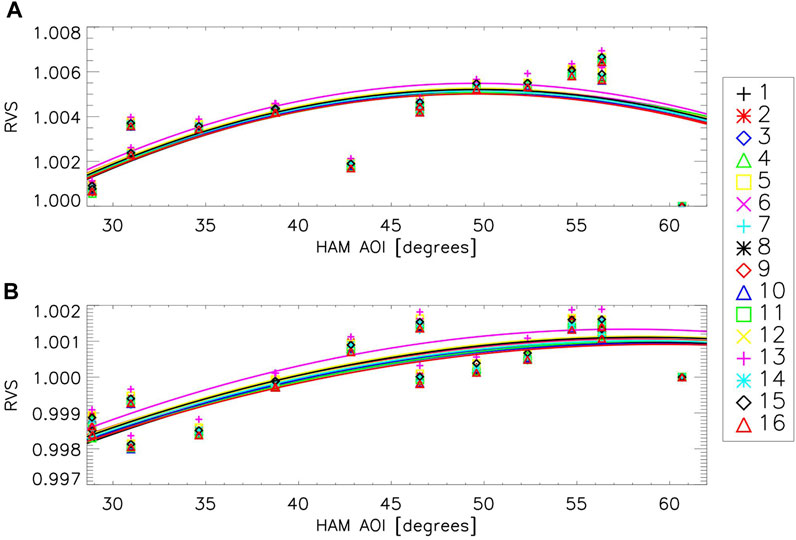
FIGURE 4. JPSS-4 VIIRS RVS for band M9, with and without a humidity correction (upper and lower plots) for HAM side A. Symbol/color combinations listed in the legend denote different detectors in band M9.
The comparison to earlier builds shows that the RVS has been consistent in the general shape. There was a change in the coating from SNPP to JPSS-1 Oudrari et al. (2014), Oudrari et al. (2016) and the HAM side differences for JPSS-1 noted earlier. Nonetheless, the magnitude, shape, and detector variation are very similar, with some minor exceptions (HAM side differences in SNPP for M6 and in JPSS-1 for I2/M7 as well as detector variation on JPSS-1 for the DNB edge detectors). The methodology employed to analyze the data has been consistent and the test setup has not changed markedly. This implies that the JPSS-3 and JPSS-4 RSB/DNB RVS will likely perform as well as the SNPP, JPSS-1, and JPSS-2 RVS have performed once on-orbit.
The uncertainties on the measured RVS data were propagated through the fitting routines to provide an uncertainty estimate on the final RVS as a function of HAM AOI. As the RVS was normalized to the space view angle (about 60.5°), the uncertainty is smallest at the normalization point and increases as the AOI decreases, where the maximum uncertainty occurs at the minimum AOI of ∼28.6°. A detailed description of the uncertainty propagation and calculation is contained in McIntire et al. (2017). For both JPSS-3 and JPSS-4, the maximum RSB RVS uncertainties are listed in Table 4, along with JPSS-2 uncertainties from McIntire et al. (2017). The values range from 0.046% for band M4 to 0.007% for band M10 and the DNB. Values were comparable to JPSS-2 uncertainty estimates. VIIRS RSB has a total uncertainty design requirement of 2%, of which 0.3% was allocated to RVS (JPSS, 2014). The values for all reflective bands and the DNB were well within this target value. The largest contributions to the uncertainty are the a1 and a2 terms. As the RVS enters into the calibrated reflectance as a multiplicative factor for the reflective bands, the maximum uncertainty on the reflectance due to RVS for each band is equivalent to the maximum RVS uncertainties listed in Table 4.
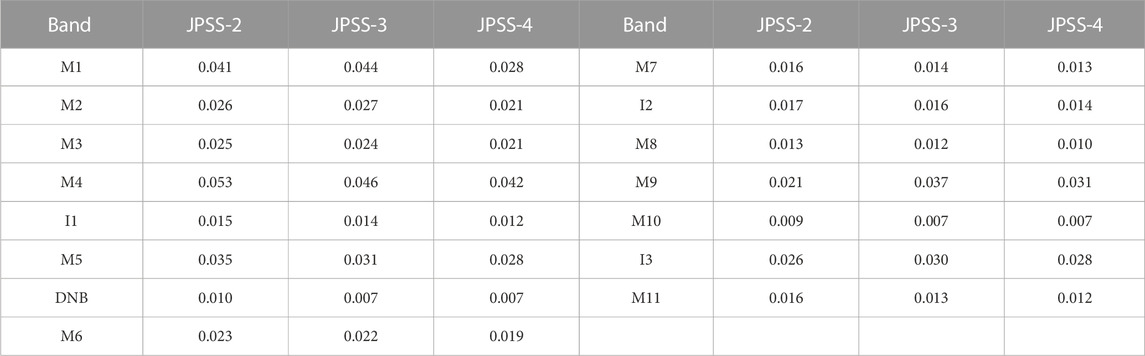
TABLE 4. JPSS-2 McIntire et al. (2017), JPSS-3, and JPSS-4 VIIRS RSB measured maximum uncertainties (in %).
4.2 TEB RVS performance
All of the TEB bands were analyzed according to the methodology outlined in Section 3 and in McIntire et al. (2017). An example of the un-normalized RVS is shown in Figure 5 for JPSS-4 band M14 (HAM side A) for all detectors. The symbols represent the measured data and the lines denote the fit RVS functions. The RVS fits reproduce the measured data very well, as is the case for all other thermal bands. The RVS for a middle detector is shown for all thermal bands in Figure 6, where HAM sides A and B are denoted by solid and dashed lines. The JPSS-3 and JPSS-4 RVS are represented by the green and purple lines (SNPP, JPSS-1, and JPSS-2 are plotted in the black, red, and blue lines, respectively). Here the RVS has been normalized to the space view angle (AOI ∼60.5°). Band M14 shows the largest variation, up to about 10%, while the 3–4 μm bands (I4, M12, and M13) show less than 0.5% change over the full range of AOI. The HAM side differences are small in the thermal bands, and the detector dependence is also generally small.
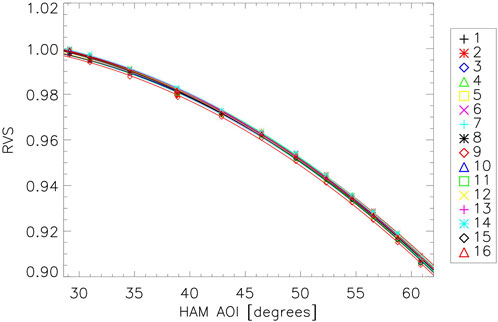
FIGURE 5. JPSS-4 band M14 RVS fitting (HAM side A). Symbol/color combinations listed in the legend denote different detectors in band M14.
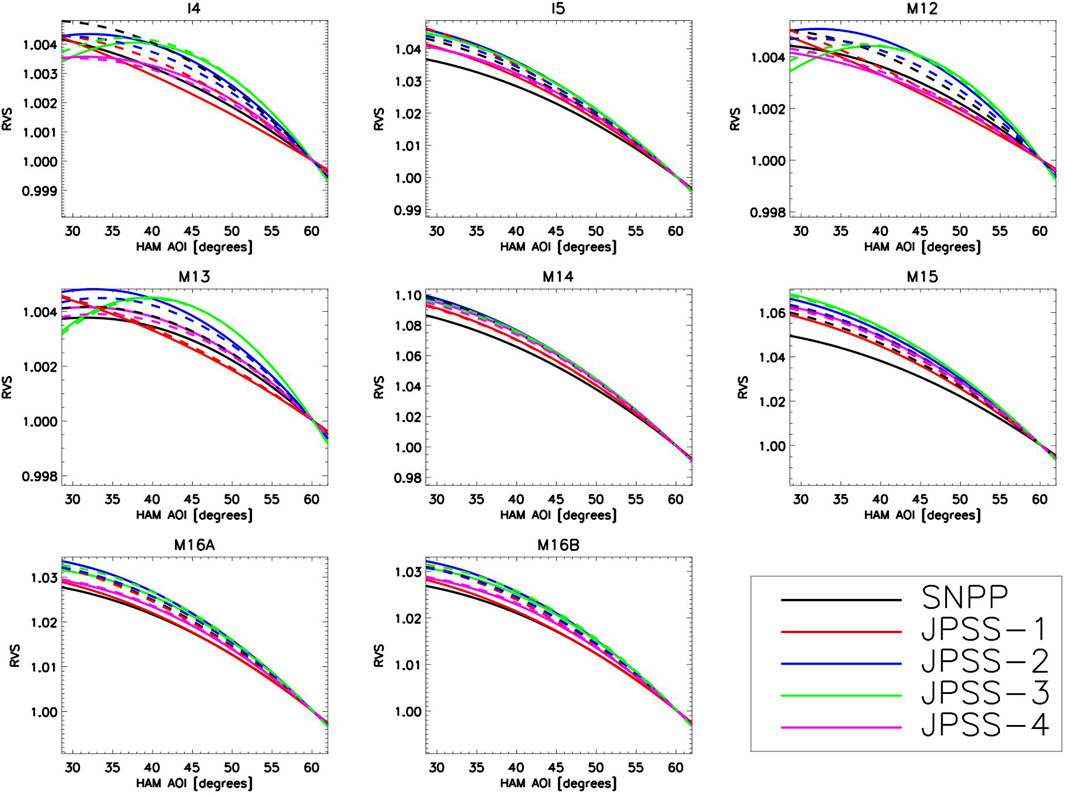
FIGURE 6. VIIRS RVS for TEB bands. HAM sides A and B are denoted by solid and dashed lines.
While there is some variation with the VIIRS build, the general shape, detector dependence, and magnitude of the RVS are very consistent. SNPP and JPSS-1 seem to have slightly smaller variations for the longer wavelength bands (8–12 μm), as well as larger HAM side differences. The mid-wavelength bands have consistently smaller RVS (below 0.5% total variation) for all builds, with a little bit more curve to the shape in JPSS-3. Neither the analysis methodology nor the test setup has changed much over the series of VIIRS tested; this indicates that the level of performance will be comparable to the observed performance of SNPP, JPSS-1, and JPSS-2 on orbit.
The uncertainties in the thermal bands were more complicated as the individual sources had to propagate through Eq. 2. Then the uncertainties were used in the fitting routine, and finally, the error on the final RVS as a function of HAM AOI was calculated as per the methodology outlined in McIntire et al. (2017). As the RVS was normalized to the space view angle (about 60.5°), the uncertainty is smallest at the normalization point and increases as the AOI decreases, where the maximum uncertainty is at the minimum AOI of ∼28.6°. The maximum uncertainties for both JPSS-3 and JPSS-4 are listed in Table 5 for all thermal bands, along with the uncertainties for JPSS-2 for comparison McIntire et al. (2017). The largest was 0.29% for band I4 and the smallest was 0.06% for bands M15 and M16B; the thermal bands generally have larger uncertainties than the reflective bands due to the complexity of the uncertainty propagation. The thermal bands have a stratified scene requirement on the total uncertainty but were all allocated 0.2% for the RVS (except band M14 which was allocated 0.6%). Some bands did not meet this threshold (bands I4 and I5), but previous builds have shown good performance on orbit with similar uncertainties. This was in part driven by larger noise in these two bands, which has been a feature since SNPP. The largest contributions to the total uncertainty for all thermal bands are the a1 and a2 terms. The RVS enters the calibrated radiance as a multiplicative factor, but its influence on the brightness temperature is less straightforward. Tables 6, 7 show the JPSS-3 and JPSS-4 uncertainties in the brightness temperature due solely to the RVS. Brightness temperature uncertainties are generally around 0.1 K or lower, except at low scene temperatures (below 230 K for I4, M12, and M13; below 210 K for I5 and M14–M16). I5 has slightly higher uncertainties for most scene temperatures. JPSS-4 uncertainties are generally lower than JPSS-3 uncertainties. Note that this is a worst-case estimate near the end of a scan (where the HAM AOI is near its minimum).
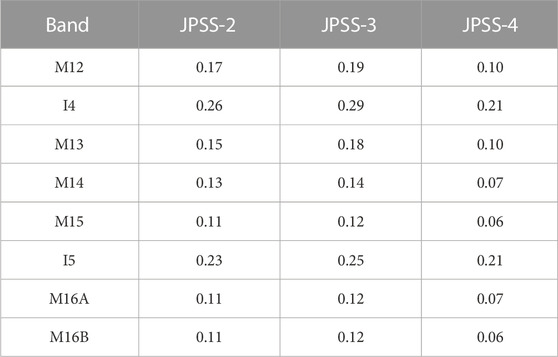
TABLE 5. JPSS-2 McIntire et al. (2017), JPSS-3, and JPSS-4 VIIRS TEB measured maximum uncertainties (in %).
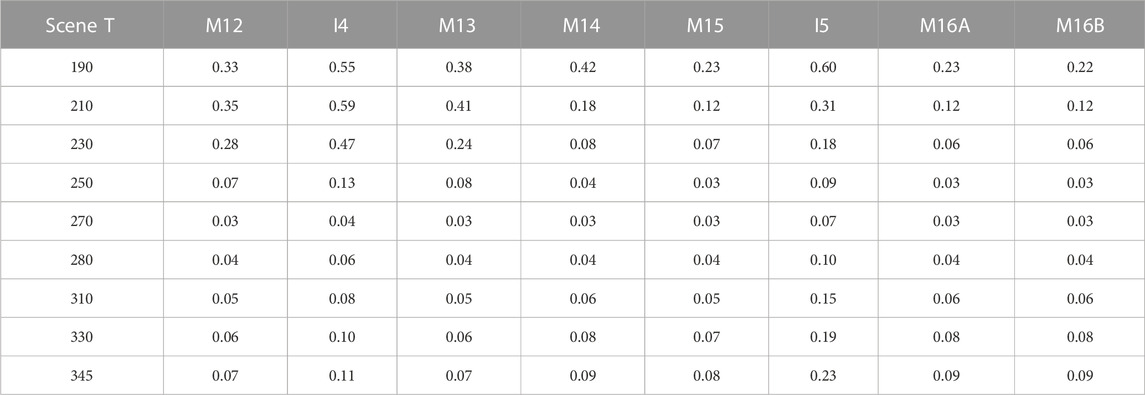
TABLE 6. Brightness temperature uncertainties due solely to the RVS maximum uncertainties listed in Table 5 (in K) for JPSS-3.
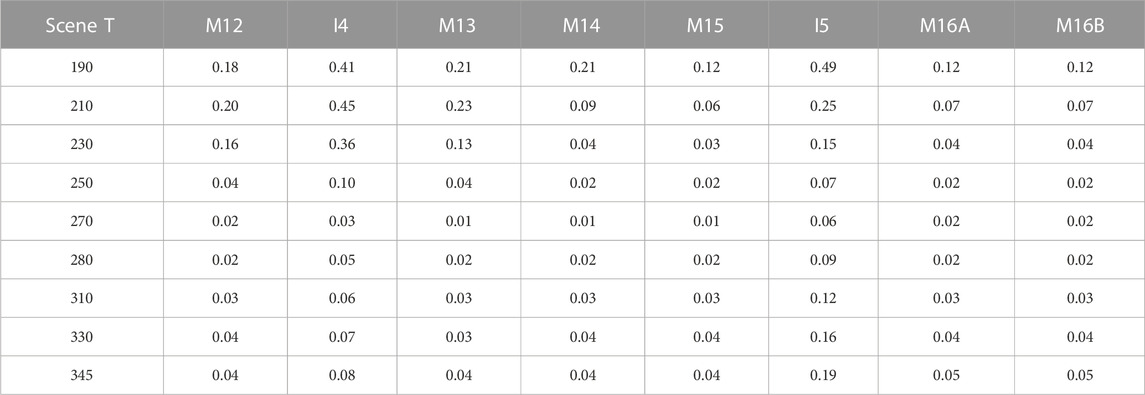
TABLE 7. Brightness temperature uncertainties due solely to the RVS maximum uncertainties listed in Table 5 (in K) for JPSS-4.
5 Conclusion
Maintaining the calibration of the VIIRS instruments once in orbit is critical to ensure the continued delivery of high-quality science data products for various science and climate studies. While some of the calibration can be performed on-orbit, some parameters can best be measured with sufficient fidelity prior to launch. One such parameter is the response versus scan angle (RVS), which describes the relative variation in reflectance as a function of the angle of incidence on the half-angle mirror. Measurements were made for the JPSS-3 and JPSS-4 VIIRS instruments, the analysis results of which were discussed in this work. The results show that the RVS for all bands was within expectations, was comparable to previous builds (SNPP, JPSS-1, and JPSS-2), and had uncertainty estimates showing high fidelity for these measurements. Considering the consistency with previous builds and their continued delivery of high-quality data products on-orbit, it is expected that the measured RVS for JPSS-3 and JPSS-4 will contribute to the continuity of high-quality science data for these missions.
Data availability statement
The data analyzed in this study is subject to the following licenses/restrictions: Proprietary. Requests to access these datasets should be directed to gravite.service@noaa.gov.
Author contributions
JM: Formal Analysis, Software, Writing–original draft, Writing–review and editing. DM: Formal Analysis, Software, Writing–review and editing. AA: Formal Analysis, Software, Writing–review and editing. XX: Supervision, Writing–review and editing.
Funding
The authors declare that no financial support was received for the research, authorship, and/or publication of this article.
Acknowledgments
The authors would like to thank the following: the Raytheon test team for conducting the performance tests and for developing much of the analysis methodology, and members of the government data analysis working group including James McCarthy for valuable comments. The above-mentioned provided valuable information and support to the analysis presented in this work.
Conflict of interest
Authors JM and AA were employed by Science Systems and Applications, Inc. Author DM was employed by The Aerospace Corporation.
The remaining author declares that the research was conducted in the absence of any commercial or financial relationships that could be construed as a potential conflict of interest.
Publisher’s note
All claims expressed in this article are solely those of the authors and do not necessarily represent those of their affiliated organizations, or those of the publisher, the editors and the reviewers. Any product that may be evaluated in this article, or claim that may be made by its manufacturer, is not guaranteed or endorsed by the publisher.
References
Cao, C., De Luccia, F. J., Xiong, X., Wolfe, R., and Weng, F. (2013). Early on-orbit performance of the visible infrared imaging radiometer suite onboard the Suomi National Polar-Orbiting Partnership (S-NPP) satellite. IEEE Trans. Geoscience Remote Sens. 52, 1142–1156.
JPSS (2014). Joint polar satellite System (JPSS) VIIRS product requirement document (PRD). Tech. Rep. Greenbelt, MD, USA: Goddard Space Flight Center. Revision D.
McIntire, J., Moyer, D., Angal, A., and Xiong, X. (2021). “JPSS-3 VIIRS response versus scan angle characterization and performance,” in Earth observing systems XXVI (SPIE), vol. 11829, 173–180.
McIntire, J., Moyer, D., Chang, T., Oudrari, H., and Xiong, X. (2017). Pre-launch JPSS-2 VIIRS response versus scan angle characterization. Remote Sens. 9, 1300.
McIntire, J., Xiong, X., Butler, J. J., Angal, A., Moyer, D., Ji, Q., et al. (2022). An overall assessment of JPSS-3 VIIRS radiometric performance based on pre-launch testing. Remote Sens. 14, 1999.
Moyer, D., McIntire, J., Oudrari, H., McCarthy, J., Xiong, X., and De Luccia, F. (2016). JPSS-1 VIIRS pre-launch response versus scan angle testing and performance. Remote Sens. 8, 141.
Oudrari, H., McIntire, J., Xiong, X., Butler, J., Ji, Q., Schwarting, T., et al. (2016). JPSS-1 VIIRS radiometric characterization and calibration based on pre-launch testing. Remote Sens. 8, 41.
Oudrari, H., McIntire, J., Xiong, X., Butler, J., Ji, Q., Schwarting, T., et al. (2018). An overall assessment of JPSS-2 VIIRS radiometric performance based on pre-launch testing. Remote Sens. 10, 1921.
Oudrari, H., McIntire, J., Xiong, X., Butler, J., Lee, S., Lei, N., et al. (2014). Prelaunch radiometric characterization and calibration of the S-NPP VIIRS sensor. IEEE Trans. Geoscience Remote Sens. 53, 2195–2210.
Wang, W., Cao, C., and Blonski, S. (2019). A new method for characterizing noaa-20/s-npp viirs thermal emissive bands response versus scan using on-orbit pitch maneuver data. Remote Sens. 11, 1624.
Wu, A., Xiong, X., and Cao, C. (2017). “Assessment of stability of the response versus scan angle for the S-NPP VIIRS reflective solar bands using pseudo-invariant desert and Dome C sites,” in Proc. Of SPIE 10423, 432–440.
Wu, A., Xiong, X., and Chiang, K. (2018). “Determination of the NOAA-20 VIIRS TEB RVS from emissive radiation measurements during the pitch maneuver,” in Earth observing missions and sensors: development, implementation, and characterization V (SPIE), vol. 10781, 227–239.
Xiong, X., Butler, J., Chiang, K., Efremova, B., Fulbright, J., Lei, N., et al. (2014). VIIRS on-orbit calibration methodology and performance. J. Geophys. Res. Atmos. 119, 5065–5078.
Keywords: JPSS, VIIRS, calibration, pre-launch, thermal emissive, reflective solar, RVS
Citation: McIntire J, Moyer D, Angal A and Xiong X (2023) JPSS-3 / 4 VIIRS response versus scan angle characterization and performance. Front. Remote Sens. 4:1303347. doi: 10.3389/frsen.2023.1303347
Received: 27 September 2023; Accepted: 21 November 2023;
Published: 07 December 2023.
Edited by:
Kai Yang, University of Maryland, College Park, United StatesReviewed by:
Xiuqing Hu, China Meteorological Administration, ChinaWenhui Wang, University of Maryland, College Park, United States
Copyright © 2023 McIntire, Moyer, Angal and Xiong. This is an open-access article distributed under the terms of the Creative Commons Attribution License (CC BY). The use, distribution or reproduction in other forums is permitted, provided the original author(s) and the copyright owner(s) are credited and that the original publication in this journal is cited, in accordance with accepted academic practice. No use, distribution or reproduction is permitted which does not comply with these terms.
*Correspondence: Jeff McIntire, jeffrey.mcintire@ssaihq.com