Multi-temporal high-resolution marsh vegetation mapping using unoccupied aircraft system remote sensing and machine learning
 Anna E. Windle1*
  Lorie W. Staver1
  Andrew J. Elmore2
  Stephanie Scherer3 Seth Keller3
  Ben Malmgren1
  Greg M. Silsbe1
- 1Horn Point Laboratory, University of Maryland Center for Environmental Science, Cambridge, MD, United States
- 2Appalachian Laboratory, University of Maryland Center for Environmental Science, Frostburg, MD, United States
- 3U.S. Army Corps of Engineers, Baltimore, MD, United States
Coastal wetlands are among the most productive ecosystems in the world and provide important ecosystem services related to improved water quality, carbon sequestration, and biodiversity. In many locations, wetlands are threatened by coastal development and rising sea levels, prompting an era of tidal wetland restoration. The creation and restoration of tidal marshes necessitate the need for ecosystem monitoring. While satellite remote sensing is a valuable monitoring tool; the spatial and temporal resolution of imagery often places operational constraints, especially in small or spatially complex environments. Unoccupied aircraft systems (UAS) are an emerging remote sensing platform that collects data with flexible on-demand capabilities at much greater spatial resolution than sensors on aircraft and satellites, and resultant imagery can be readily rendered in three dimensions through Structure from Motion (SfM) photogrammetric processing. In this study, UAS data at 5 cm resolution was collected at an engineered wetland at Poplar Island, located in Chesapeake Bay, MD United States five times throughout 2019 to 2022. The wetland is dominated by two vegetation species: Spartina alterniflora and Spartina patens that were originally planted in 2005 in low and high marsh elevation zones respectively. During each survey, UAS multispectral reflectance, canopy elevation, and texture were derived and used as input into supervised random forest classification models to classify species-specific marsh vegetation. Overall accuracy ranged from 97% to 99%, with texture and canopy elevation variables being the most important across all datasets. Random forest classifications were also applied to down-sampled UAS data which resulted in a decline in classification accuracy as spatial resolution decreased (pixels became larger), indicating the benefit of using ultra-high resolution imagery to accurately and precisely distinguish between wetland vegetation. High resolution vegetation classification maps were compared to the 2005 as-built planting plans, demonstrating significant changes in vegetation and potential instances of marsh migration. The amount of vegetation change in the high marsh zone positively correlated with interannual variations in local sea level, suggesting a feedback between vegetation and tidal inundation. This study demonstrates that UAS remote sensing has great potential to assist in large-scale estimates of vegetation changes and can improve restoration monitoring success.
Introduction
Coastal wetlands, existing at the nexus of land and water, are among the most productive ecosystems in the world and provide a suite of ecosystem services including the ability to sequester carbon, improve water quality, protect coastal regions from storms, and provide nursery grounds that support commercial fisheries (Barbier et al., 2011). Close to sea-level, coastal wetlands are vulnerable to anthropogenic and climate impacts; many of the world’s wetlands have retreated due to land conversion and rising sea levels (Pendleton et al., 2012; Kirwan and Megonigal, 2013). However, important feedbacks between vegetation growth, water level and geomorphology allow wetlands to persist under rising sea levels (Feagin et al., 2010; Kirwan and Megonigal, 2013; Beckett et al., 2016; Kirwan et al., 2016; Alizad et al., 2018; Schieder et al., 2018; Flester and Blum, 2020). Long-term monitoring elucidates emerging vegetation and soil feedbacks, allowing marsh restoration and management practitioners to better mitigate threats of sea level rise and habitat loss.
Wetlands typically have a noticeable zonation of vegetation controlled by physiological constraints and competitive displacement due to physical stress, resource competition, and nutrient availability (Bertness, 1991; Aerts, 1999; Emery et al., 2001). For example, tidal flooding establishes a stress gradient with soil anoxia, salinity, and water inundation decreasing towards the terrestrial border of a marsh (Mendelssohn et al., 1981). Low marsh vegetation, such as the cordgrass Spartina alterniflora contain extensive aerenchyma for increased gas exchange to persist in waterlogged environments (Bertness, 1991) as well as deeper root profiles that provide higher stability in surging water (Howes et al., 2010). In times of persistent tidal inundation from higher rates of sea level rise, wetlands can adapt by vertically accreting sediment; however, if accretion rates are low due to a lack of sedimentation or carbon burial, marsh vegetation tends to shift and migrate inland, a process known as marsh migration or transgression (Feagin et al., 2010; Kirwan and Megonigal, 2013; Enwright et al., 2016; Kirwan et al., 2016; Alizad et al., 2018; Schieder et al., 2018). Globally, coastal wetlands are responding to sea level rise and increased inundation by migrating upslope, leading to substantial shifts in zonation, habitat loss, and pond expansion (Feagin et al., 2010; Qi et al., 2020). Long term monitoring of marsh vegetation can improve our understanding of how tidal wetlands respond to sea level rise and assist in restoration management.
For decades, spectral and structural characteristics from high resolution satellite and aircraft imagery have been used to monitor and map spatially and temporally complex wetlands (Gross et al., 1987; Klemas, 2013; Byrd et al., 2014; Evans et al., 2014; Lane et al., 2014; Massetti et al., 2016; Liu et al., 2017; Qi et al., 2020). Using field measurements for training and validation, vegetation classification models are used to monitor large-scale marsh habitat over time (Mahdavi et al., 2018). However, the spatial resolution of satellite and airborne imagery, albeit very high (∼1–30 m), can still result in a large fraction of mixed pixels, leading to challenges in differentiating between vegetation types. Distinguishing between marsh vegetation species can also be challenging due to similar spectral signatures. Artigas and Yang (2005); Artigas and Yang (2006) compared in situ leaf-level hyperspectral reflectance of S. alterniflora and Spartina patens and found no significant differences in most of the visible and near-infrared (NIR) region. Some studies have demonstrated that incorporating an image texture metric (i.e., the spatial variance of image grayscale levels of one spectral band) can improve marsh vegetation classifications by incorporating characteristic patchiness and other structural features into the distinguishing features of each vegetation type (Dronova et al., 2012; Lane et al., 2014). Additional data layers such as elevation data from Light Detection and Ranging (LiDAR) have also improved classification (Halls and Costin, 2016; Qi et al., 2020). Some LiDAR-derived DEMs, however, tend to overestimate the marsh platform elevation in marsh environments due to an inability to penetrate dense canopies (Hladik and Alber, 2012; Elmore et al., 2016). Additionally, synthetic aperture radar (SAR) imagery has also been successfully used for classifying and mapping marsh vegetation, proving to be a useful method in dense vegetation or with frequent cloud cover (Silva et al., 2010; Evans et al., 2014). However, the spatial resolution of SAR imagery can still lead to misclassifications of small-scale wetlands.
The emerging technology of unoccupied aircraft systems (UAS, or drones) combined with Structure from Motion (SfM) photogrammetry is a promising method for classifying and assessing complex wetland habitats with high accuracy (Wan et al., 2014; Kalacska et al., 2017; Doughty and Cavanaugh, 2019; Durgan et al., 2020; Ridge and Johnston, 2020; Nardin et al., 2021). UAS can provide ultra-high resolution (<5 cm) overlapping two-dimensional (2D) images that SfM photogrammetry software can then reconstruct into 2D orthomosaics and three-dimensional (3D) point clouds (Westoby et al., 2012). UAS-SfM photogrammetry can be a low-cost alternative to expensive high-resolution satellite or occupied aircraft approaches to obtain 2D and 3D radiometric measurements of an environment. The fusion of multispectral UAS imagery and SfM-derived digital surface models (DSMs) have been applied to monitor coastal morphology over time (Seymour et al., 2018), improve species-specific wetland habitat classifications (Gray et al., 2018), monitor marsh geomorphology (Kalacska et al., 2017), and provide an estimate of vegetation height (DiGiacomo et al., 2020).
Engineered ecosystems such as tidal marsh creation or restoration and living shoreline placement are a means to mitigate anthropogenic climate change by replacing or conserving lost habitat (Duarte et al., 2013). These climate mitigation tools are becoming increasingly prevalent but often without a comprehensive understanding of the ecosystem due to a lack of effective monitoring (Li et al., 2018). The on-demand capabilities of UAS can be adopted in restoration efforts to improve site assessment and provide long-term, real-time monitoring (Ridge and Johnston, 2020). The overarching objective of this study is to develop novel methods to improve species-specific marsh vegetation differentiation using high resolution UAS imagery and SfM techniques to track marsh vegetation shifts. Specifically, this study aims to 1) examine long term (17 years) and short term (4 years) changes in vegetation species distribution in a restored wetland, 2) determine the optimal time of year for high classification accuracy of the dominant species, S. alterniflora and S. patens, and 3) determine what variables are most important in marsh vegetation classifications. The results of this study demonstrate that interannual variability of marsh vegetation can be non-linear and long-term monitoring is needed for an accurate understanding of marsh dynamics and improved marsh restoration practices.
Methods
Study site
The Paul S. Sarbanes Ecosystem Restoration Project at Poplar Island, located in mid-Chesapeake Bay, Maryland is a large-scale habitat restoration site that receives dredged material from the navigation channels approaching Baltimore Harbor. When completed, 68 million cubic yards of dredged material will be used to restore approximately 694 ha of tidal wetland, upland, and open-water embayment habitat (USACE, 2020). Tidal marshes are constructed following dredged material placement in containment cells ranging in size from approximately 12–20 ha (Staver et al., 2020). Tidal exchange is established via a tidal inlet in the exterior dike of each cell. The site has a mean tidal range of 0.49 m (NOAA Tides and Currents, station ID 8571892) and surface salinity ranges from 8.89 to 16.13 ppt (1985–2021, Station CB4.1E, Chesapeake Bay Program). The present study focused on Cell 3D, a 13 ha marsh which was developed in 2005. The marsh was planted with nursery grown S. alterniflora in the low marsh zone and S. patens in the high marsh zone, with a target of maintaining 85%–90% coverage (USACE, 2020; Figure 1).
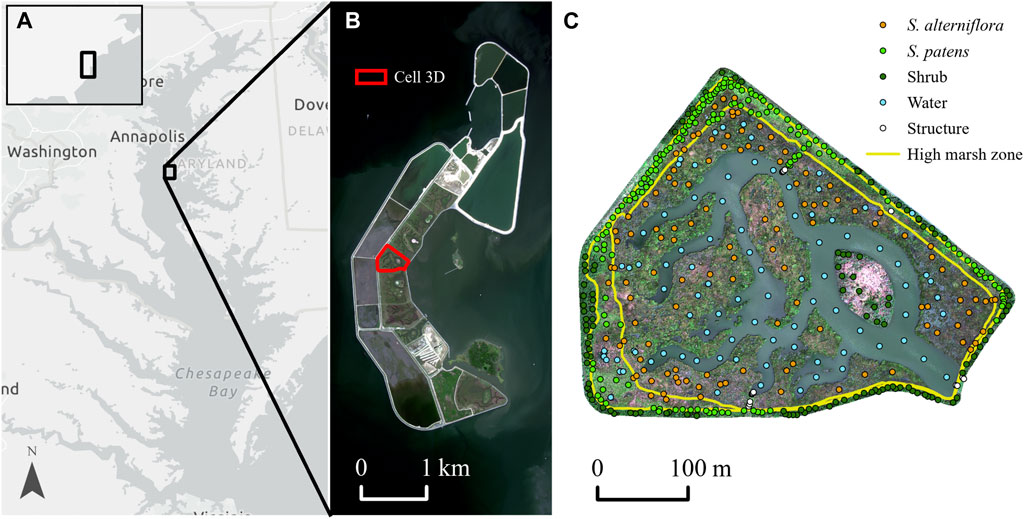
FIGURE 1. Overview of the study site location. (A) Location of Poplar Island in the Chesapeake Bay, Maryland, United States (B) WorldView-2 satellite image captured on 15 September 2020 of the Paul S. Sarbanes Ecosystem Restoration Project at Poplar Island with Cell 3D outlined in red (C) UAS RGB composite of Cell 3D collected on 26 August 2020 overlaid with the as-built planting boundaries of high and low marsh in yellow and field validation data used to train the random forest classification.
UAS description
Multispectral UAS data was collected with a MicaSense RedEdge-MX sensor (MicaSense, Seattle, Washington, United States). The sensor is a 8.7 × 5.9 × 4.5 cm multispectral camera capable of capturing five simultaneous bands on the electromagnetic spectrum in 12 bit radiometric resolution: blue (475 nm center, 32 nm full width half maximum, FWHM), green (560 nm center, 27 nm FWHM), red (668 nm center, 14 nm FWHM), red edge (717 nm center, 12 nm FWHM), and NIR (842 nm center, 57 nm FWHM). The sensor was mounted on a DJI Phantom 4 Pro UAS using a 3D-printed mount that assured a nadir viewing angle while in flight. The UAS also contains a downwelling light sensor (DLS) which measures downwelling hemispherical irradiance in the same spectral wavebands during in-flight image captures and contains a calibrated magnetometer to provide heading and orientation information which, when combined, corrects for varying illumination conditions. The DLS was mounted above the UAS to eliminate shading and collected incident light centered at a 0° zenith angle.
UAS imagery and ground control point collection
UAS data was collected over Cell 3D on five different dates (21 November 2019, 26 August 2020, 16 April 2021, 22 June 2022, and 7 November 2022) between 10:00a.m. and 2:00p.m. EST, with tides ranging from 0.29 to 1.1 m, referenced to North American Vertical Datum established in 1988 (NAVD88). A ∼5 cm/pixel ground sampling distance (GSD) was achieved by collecting imagery at an average 76 m altitude above sea level with 70% longitudinal and 80% latitudinal overlap using the flight planning application Pix4Dcapture (Pix4D, Prilly, Switzerland). Six ground control points (GCPs) were surveyed in the field with a real-time kinematic global positioning system (RTK-GPS, Reach RS+, Emlid, Hong Kong). Three of the GCPs were made from high-density polyurethane black and white checkerboard tiles (0.0929 m2) and situated on PVC pipes of differing lengths distributed around the 13 ha survey area (Supplementary Figure S1). The other three GCPs were locations of permanent structures (e.g., corner of piers). Bundle block adjustment results were strong across all datasets, with mean reprojection errors of 0.11, 0.10, 0.12, 0.11, 0.13 pixels, respectively and relative mean of geolocational accuracy was under 1 m in the X,Y directions and under 1.5 m in the Z directions for each dataset.
UAS imagery was processed with Pix4D Mapper Pro SfM photogrammetry software v4.6.4. GCP measurements were incorporated into the image processing in the software program by partial automation to georectify all UAS surveys to achieve the greatest positional and vertical accuracy. Horizontal data were referenced to the World Geodetic Datum 1984 (WGS 1984) Universal Transverse Mercator (UTM) Zone 18N, and vertical data were referenced to NAVD88. Reflectance values were obtained following the workflow described in Assmann et al. (2018). In summary, the MicaSense sensor collected radiance values which were stored as arbitrary digital numbers (DNs). These values were used to obtain reflectance by combining sensor and illumination information, as follows:
Reflectance = digital number/(radiometrically calibrated pixel value * illumination).
Within the Pix4D radiometric calibration process, sensor metadata parameters were used to apply several corrections such as correcting for vignetting (pixels on the outside of images receive less light than those in the center), compensating for dark current noise (sensitivity even when no photons enter device), and correcting for spectral overlap, sensor sensitivity, and image brightness (ISO, aperture, exposure time). Illumination values from the DLS and values collected from the calibrated reflectance panel were applied to the radiometrically calibrated values to account for variation caused by differences in ambient light due to weather and sun. This process outputs unitless surface reflectance values, ranging from 0 to 1 (Assmann et al., 2018).
Blue, green, red, red edge, NIR reflectance orthomosaics were produced as well as a normalized difference vegetation index (NDVI) orthomosaic, calculated as the difference between NIR and red reflectance divided by their sum. Orthorectified digital surface models (DSMs) were also created by applying an inverse weighted distance (IDW) interpolation from the 3D classified point cloud, resulting in a GSD of 5 cm/pixel. Since the DSM is created from the altitude of the highest point in the point cloud, the DSMs are considered vegetation canopy models. Orthorectified digital terrain models (DTMs) were also created by applying an IDW interpolation to the lowest points; however, they were not used in this study since values were highly correlated with the DSM elevations (r2 = 0.99) due to a lack of bare earth elevation points in the point cloud from dense vegetation (see Supplementary Material and Supplementary Figure S2). The reflectance orthomosaics and DSMs were transferred to ArcGIS Pro 2.4.0 mapping software (ESRI Inc. Redlands, CA, United States) for geospatial analyses.
Field data collection
Field data were collected to use as a training dataset using a range of methods. Field vegetation identification was collected at the time of each UAS flight using a RTK GPS (6–10 points per dataset, 0.01 m average lateral root mean square error). Additional vegetation identification points were collected throughout the study period by wetland restoration partners and used as training data for each respective flight. U.S. Fish and Wildlife Service personnel collected sixteen vegetation identification data in 2019 and 2021 across four transects spanning high marsh and low marsh vegetation; U.S. Army Corps of Engineers personnel collected annual vegetation identification of one low and one high marsh quadrat; and an ongoing vegetation biomass monitoring study (Staver et al., 2020) provided annual vegetation identification data in six high marsh and six low marsh locations. Despite this extensive field collection effort, the size of the training data was increased by 90%–95% through visual inspection of the high resolution UAS imagery which was reinforced by known identification of the field data. In total, habitat from 35 to 155 points (pixels) were identified for each class: S. alterniflora, S. patens, structure (any human made material), shrub (vegetation mainly on the surrounding dike), and water (Figure 1). For each dataset, all field data points from the multiple sources were randomly split into a training set (70%) to train a classification model and a test set (30%) for assessing the prediction accuracy of the models.
Multispectral reflectance spectra
For each UAS dataset, reflectance values from all bands were extracted from the S. alterniflora and S. patens field training pixels to calculate an average multispectral spectrum of each vegetation species. These spectra were compared across seasons to determine differences in vegetation reflectance. Additionally, following methods of Artigas and Young (2006), the red-edge first derivative, or slope, of reflectance at 668 and 717 nm was measured to further separate the two vegetation species.
Texture analysis
Image texture was derived from gray-level co-occurrence matrices (GLCM) (‘glcm’ package in R v 4.2.1). GLCM textural features are based on statistics which describe how often one gray tone appears in a specified spatial relationship to another gray tone which can reflect changes in uniformity, variation, and similarity in different directions and intervals (Haralick et al., 1973; Wang et al., 2018). Specifically, in this study the variance was chosen as the texture metric which can be represented by this sum of squares equation:
Where N is the total number of gray levels in the image (NIR reflectance is scaled to 32 levels), p(i,j) is the (i,j)-th entry of the normalized GLCM, that is p(i,j) = P(i,j)/∑i,j P(i,j), where P(i,j) is the (i,j)-th entry of the computed GLCM, and μ is the mean of the rows and column sums of the GLCM. A high variance value stems from increased variation of reflectance intensity in the pixel window and is associated with jagged and rough textures, such as differing vegetation heights of S. alterniflora, while a low variance value is associated with smooth or fine textures such as the more planophile leaf orientation of S. patens. Average texture metrics were calculated over all directions (e.g., using shifts of 0°, 45°, 90°, and 135°) in a 43 × 43 moving pixel window (2.15 × 2.15 m) using one high-contrast band to lessen redundancy (NIR). The window size was chosen to best represent the average size of vegetation, following the methods of Feng et al. (2015).
Classification model generation
Random forest decision tree models (RandomForest package, R v 4.2.1) were used for the marsh vegetation classifications. A random forest model is an ensemble of classification and regression trees (CARTs) fed by bootstrapped training data (Breiman, 2001; Belgiu and Dragut, 2016). It has been used in numerous applications of wetland classifications (Mutanga et al., 2012; Elmore et al., 2016; Pricope et al., 2022) and has been shown to be a robust machine learning classification algorithm that overcomes overfitting due to the large number of decision trees (Breiman, 2001; Feng et al., 2015; Belgiu and Dragut, 2016; Berhane et al., 2018). A random forest implementation was generated for each UAS dataset by training 1,000 decision trees (ntree = 1,000) with an optimum number of features (mtry) calculated using the ‘tuneRF’ function. Input into the random forest consisted of reflectance from the five wavebands, NDVI, elevation from the DSM, and texture (variance calculated from GLCM).
Since training data was collected concurrently with each survey, each classification was independently generated and validated against each unique survey. Each random forest model was fitted to raster data using the ‘predict’ function to produce a classified output for each dataset. To remove some noise, a majority filter was applied that replaced cells based on the majority of their eight contiguous neighboring cells in a 3 × 3 pixel window. To assess the benefit of including the structural components of elevation and texture, random forest classifications were applied to just the five multispectral bands + NDVI, the five multispectral bands + NDVI + texture, and the five multispectral bands + NDVI + elevation. To assess the benefit of the high resolution of the UAS imagery, random forest classifications were applied to resampled UAS five bands at the following resolutions: 1.2, 2.4, 4, and 10 m.
Variable importance was measured using the Mean Decrease in Accuracy (MDA) which represents how much removing each variable reduces the accuracy of the model, also known as permutation importance (Breiman, 2001). This is done by computing the prediction error on the out-of-bag (OOB) portion of the data before and after permutation, averaging the difference over all trees, and normalizing by the standard deviation of the differences. Classification performance was analyzed using three different metrics. Overall accuracy expresses the percentage of map area that has been correctly classified when compared to reference data, calculated by dividing the total number of correctly classified pixels by the total number of reference pixels (Story and Congalton, 1986). To assess how accuracy was distributed across individual categories, Producer’s and User’s accuracy were calculated. Producer’s accuracy is a performance measure of how well reference pixels are classified in each class and is calculated by dividing the number of correctly classified reference pixels in each class by the number of reference pixels known to be of that class. User’s accuracy is a performance measure of how well pixels classified represent the true class and is calculated by dividing the number of correctly classified pixels in each class by the total number of pixels that were classified in that class. In brief, Producer’s accuracy is a measure of omission error where pixels that have not been correctly classified have been omitted from the correct class and User’s accuracy is a measure of commission error where pixels from the classified image do not represent that class on the ground (Story and Congalton, 1986).
Calculating vegetation change
To study temporal vegetation change, the UAS classifications were compared to the 2005 as-built boundaries where only S. patens was planted upslope of the high marsh/low marsh boundary (high marsh zone) and S. alterniflora was planted downslope of that boundary (low marsh zone) (Figure 1). The UAS classified maps were converted to a polygon and vegetation area (m2) was calculated in the high marsh zone for each vegetation species across each dataset.
Results
Spectral and structural observations of marsh vegetation from UAS data
Average multispectral reflectance spectra demonstrates that S. patens exhibits higher reflectance across all wavebands than S. alterniflora, particularly in the longer wavebands (717 nm, 842 nm, Figure 2). The separation in the longer wavelengths is more apparent in the November, August, and April datasets compared to the June dataset, likely due to differences in chlorophyll levels between the two vegetation species during these seasons (Figure 2). Similarly, there are subtle peaks in the green waveband (560 nm) for both species in the June and August datasets while the spectra appear flatter across wavebands for the November and April datasets likely due to increased pigmentation during the summer months.

FIGURE 2. Multispectral reflectance spectra averaged from all Spartina alterniflora (solid line) and Spartina patens (dashed line) field training points across (A) November 2019 (orange) and November 2022 (red), (B) August 2020 (dark green), (C) April 2021 (brown), (D) June 2022 (light green). Error bars represent standard deviation of reflectance at each band.
Figure 3 depicts broad differences between canopy elevation, NDVI, and red edge slope between species and seasons. Across all seasons, canopy elevation derived from the DSM of S. alterniflora and S. patens ranged from 0.03 m to 2.02 m and 0.12 to 2.56 m, respectively. The average S. alterniflora canopy elevation was highest in June (1.05 m), lowest in August (0.5 m) and the average S. patens canopy elevation was highest in June (1.16 m) and lowest in November (0.79 m and 0.85 m for 2019 and 2022, respectively). S. alterniflora and S. patens NDVI values range from 0.08 to 0.91 and 0.14 to 0.93, respectively with June containing the highest average NDVI for S. alterniflora (0.91) and August containing the highest NDVI for S. patens (0.93). April contains the lowest NDVI value for both species (0.08 and 0.14, respectively). Red edge slope is on average higher for S. patens across all datasets ranging from 0.007 to 0.14 with the lowest values in April. Average red edge slope was highest for both species in the August and June datasets (Figure 2).
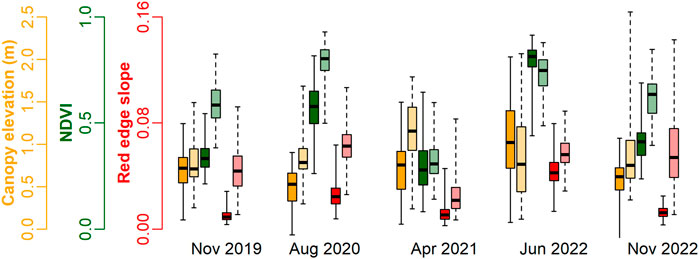
FIGURE 3. Boxplots of DSM canopy elevation (m) (yellow), NDVI (green), and the red edge slope (red) of Spartina alterniflora (dark hue) and Spartina patens (light hue) for each dataset.
Random forest classification
When applying all five UAS spectral bands, NDVI, texture, and elevation to each random forest classification, overall classification accuracy ranged from 97% to 99% across all datasets, with a mean of 98% (Supplementary Table S1). S. alterniflora user accuracy ranged from 95% to 100% with a mean of 97%, and producer accuracy ranged from 94% to 100%, with a mean of 99%. S. patens user accuracy ranged from 96% to 100% with a mean of 99% and producer accuracy ranged from 96% to 100%, with a mean of 98% (Supplementary Table S1). Overall, November 2019 produced the highest classification accuracy while June 2022 produced the lowest (Supplementary Table S1). This finding is also represented in the November 2019 classification prediction map (Figure 4, Panel H) which demonstrates the least amount of variation in classification while the June prediction map (Figure 4, Panel K) shows the most amount of variation.
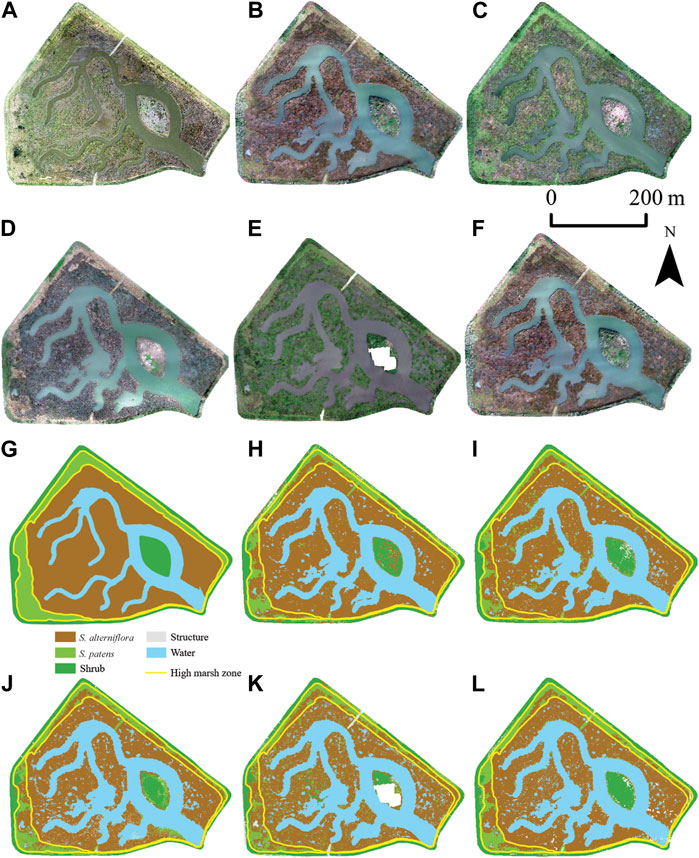
FIGURE 4. (A) Aerial image (1 m) of Cell 3D taken in May 2007, (B–F) UAS red-green-blue (RGB) reflectance orthomosaics (0.05 m) of Cell 3D collected in (B) November 2019, (C) August 2020, (D) April 2021, (E) June 2022, and (F) November 2022, (G) Classified map according to the 2005 as-build planting (H–L) Random forest classification prediction maps for each UAS orthomosaic shown in panels (B–F). Yellow lines on classified maps represent the 2005 as-built planting boundaries of high and low marsh. White patch on Panel E is the result of the SfM software failing to stitch together images in that location.
Variable importance
Variable importance plots demonstrated that across all seasons, canopy elevation was the most important variable in the accuracies of the random forest classifications, except for April where texture was the most important (Figure 5). Texture was the second most important variable in November and August while red reflectance was the second most important in June. Following canopy elevation and texture, NDVI was the most important spectral variable in November and April, likely due to high contrast in the red and NIR bands from senescing vegetation. In August, the blue band was the most important spectral variable and in June, the red and red edge reflectance were the most important spectral variables which is the narrow range (600–750 nm) where (Artigas and Yang, 2005; Artigas and Yang, 2006) found separability in hyperspectral spectra of the two species. The red edge reflectance was the least important variable for November 2019, August, and April.
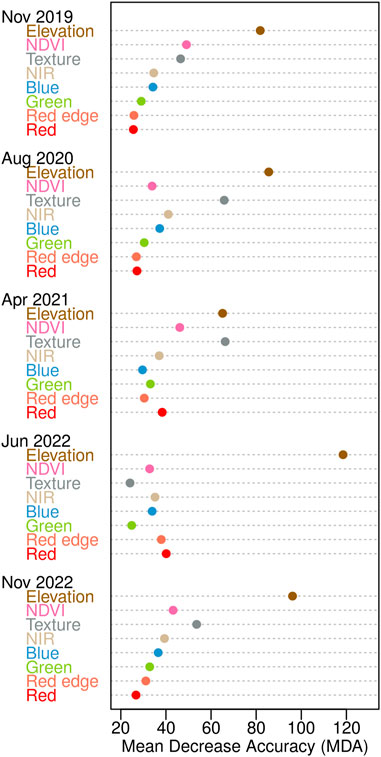
FIGURE 5. Variable importance plots calculated using the mean decrease accuracy (MDA) from random forest classification models generated independently for each dataset. MDA is a measure of the performance of the model without each variable, where a higher value indicates greater importance of that variable in predicting vegetation.
When excluding both texture and elevation from the classification model, overall accuracy declined an average 4%. When excluding just elevation, average overall accuracy declined 1%, and when excluding just texture, average overall accuracy stayed the same (Figure 6). Average overall accuracy of classifications applied to resampled UAS bands + NDVI were in general lower than the original classification accuracy. Average overall accuracy for 1.2, 2.4, and 4 m resolution were all 3% lower and the 10 m resolution was 7% lower average overall accuracy (Figure 6). Across all classification combinations, S. alterniflora user’s accuracy was the lowest, followed by S. alterniflora producer’s accuracy, demonstrating that S. alterniflora was more challenging to classify (Figure 6).
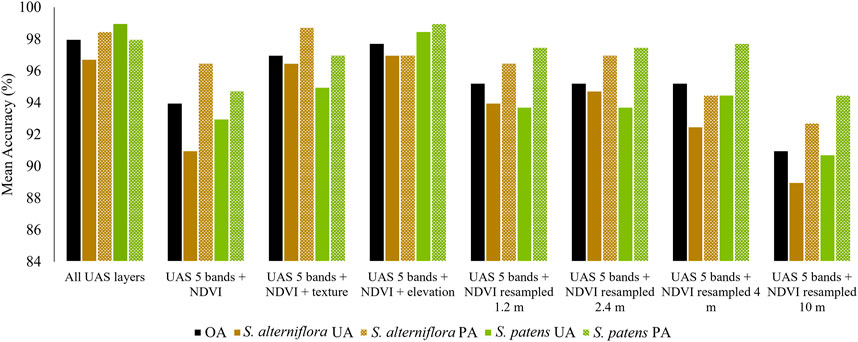
FIGURE 6. Bar plot of random forest classification accuracies (%) averaged across datasets when applied to various combinations of raster layers. OA = Overall accuracy, UA = User’s accuracy, PA = Producer’s accuracy.
Discussion
This study demonstrates how ultra-high resolution UAS remote sensing can result in high classification accuracy allowing for fine scale interannual wetland vegetation change monitoring. Supervised classification models incorporated the synergy between UAS-derived multispectral bands, canopy elevation, and texture to produce predicted habitat classes that were validated with field data. Overall, producer’s and user’s accuracy were evaluated between different combinations of variables and with down sampled (coarser) UAS imagery. Results have broad implications for improving remotely sensed vegetation classifications of wetlands, but several aspects and caveats of this study merit additional discussion.
Spectral and structural differentiation of S. alterniflora and S. patens
Belonging to the same genus, S. alterniflora and S. patens are easily distinguishable by the human eye, with S. alterniflora dominating in the low marsh growing as a tall and straight grass and S. patens dominating in the high marsh having a decumbent growth habit, earning it the nickname “marsh hay” (Figure 7). However, these species can be spectrally similar and oftentimes indistinguishable from a 2D aerial view. Like most vascular vegetation, Spartina spp. change color due to differences in light absorption and reflection properties deriving from changes in pigment concentrations throughout the growing season. In the visible spectral region, high absorption of radiation in the blue and red wavelengths is primarily due to the photosynthetic pigment, chlorophyll a. Absorption is not quite as strong at green wavelengths, which is why vegetation often appears green and contains a small reflectance peak around 560 nm (Figure 2). After the growing season (May–October), as both vegetation species begin to senesce, other pigments such as the carotenoids, xanthophylls, and anthocyanins also influence absorption properties (Knipling, 1970). During this time, the Spartina species are more easily distinguished, with S. alterniflora adopting a browner hue and S. patens remaining greener, which was observable in the November and April datasets (Figure 4).

FIGURE 7. Field photos capturing spectral and structural differences between Spartina alterniflora and Spartina patens during the (A) fall and (B) summer seasons.
In this study, reflectance was overall lower in the blue, green, and red wavelengths (475, 560, 668 nm) compared to the red edge and NIR wavelengths (717 & 842 nm, Figure 2), similar to findings of other studies (Hardisky et al., 1983; Artigas and Yang, 2006; Kearney et al., 2009). High reflectivity in the NIR across all seasons is due to the internal cellular structure where radiation is scattered from interior parts of a leaf such as the microcavities and cellulose cell walls (Knipling, 1970). Peak NIR reflectance varies across different plant species; therefore, the ratio or slope of red and NIR wavelengths is often used for distinguishing different plant species (Knipling, 1970; Artigas and Yang, 2005; Artigas and Yang, 2006; Kearney et al., 2009; Mutanga et al., 2012). The ratio of red and NIR (NDVI) of S. patens was consistently higher across all seasons, except for April and June when the species appear spectrally similar during the growing season (Figure 3). The red edge slope of S. patens was also consistently higher than S. alterniflora, in contrast to other studies where a slightly higher red edge slope was associated with S. alterniflora (Artigas and Yang, 2006). The disparity between these two studies could be due to a number of factors, including the difference between in situ and UAS-derived reflectance, lighting conditions, or the time of year measurements were collected. Both Spartina species produced a similar spectral shape with a green reflectance peak apparent in the August and June datasets, due to stronger absorption in the blue and red wavelengths from higher chlorophyll a concentrations (Figure 2). However, S. patens reflectance was overall higher in magnitude than S. alterniflora, predominantly due to canopy geometry with the stems and leaves of S. patens laying horizontally, increasing surface area compared to upright canopy forms like S. alterniflora, with less surface area to capture light (Bartlett, 1981).
Studies have demonstrated how the inclusion of structural characteristics such as elevation can improve wetland vegetation classification due to distinct differences in the vertical structure of vegetation species (Maxa and Bolstad, 2009; Halls and Costin, 2016; Samiappan et al., 2017; Pricope et al., 2022). Studies have traditionally derived elevation measurements using airborne LiDAR which performs well in coastal environments like dunes (Mancini et al., 2013; Seymour et al., 2018), but tends to overestimate marsh “bare earth” elevations and vegetation height due to an inability to penetrate dense vegetation (Hladik and Alber, 2012). Many studies instead incorporate canopy elevation, which is elevation of the highest point in the point cloud, referenced to a vertical datum. Elevation from UAS-SfM produces results similar to terrestrial LiDAR and RTK GPS measurements (Mancini et al., 2013; Kalacska et al., 2017; Seymour et al., 2018), but still tends to overestimate ‘bare earth’ elevation from a lack of bare earth points in the SfM point cloud (Supplementary Figure S2, DiGiacomo et al., 2020). In this study, the UAS-SfM DSMs were applied in the classification models representing canopy elevation which improved classification accuracy. Canopy elevation of S. patens was higher than S. alterniflora across all seasons, except June which could potentially be due to comparable vegetation heights between the two species during the growing season.
While reflectance spectra can describe average spectral variations of vegetation across bands, textural features can provide information about the spatial distribution of spectral variations within a band (Haralick et al., 1973). Incorporating textural features into wetland classification is a common approach since spectrally similar vegetation can exhibit distinguishable textural properties. Laba et al. (2010) and Lane et al. (2014) demonstrated higher overall accuracy of coastal wetland classification mapping when incorporating NIR derived textural features in high resolution satellite imagery. Feng et al. (2015) also showed improved overall accuracy results when incorporating a texture analysis of 7 cm UAS imagery. The size of the moving window upon which texture features are calculated is an important consideration since a larger window can average distinct vegetation species. It is recommended to choose a window size at the optimal scale that represents the highest between-class variation and lowest within-class variation, which should be in accordance with the average size of vegetation at a study site (Feng et al., 2015).
Random forest model classification results
The classified outputs from each dataset contained high overall accuracy with values ranging from 97% to 99% (Figure 6; Supplementary Table S1). The November 2022 dataset had the lowest overall accuracy (97%) stemming from low producer’s accuracy for each class (80%–100%). Low producer’s accuracy is equivalent to high omission errors, which indicates that confirmed vegetation classes were not correctly predicted in the classified output. In this dataset, the “structure” class (e.g., roads, docks) had the lowest producer’s accuracy (80%), which could potentially be due to high glare present in the imagery being misclassified as high reflecting structure. The November 2022 imagery was collected the earliest of all flights (10:00 local time); therefore, it is suggested to fly near solar noon to eliminate misclassifications of glare. In contrast, the November 2019 dataset had the highest overall accuracy (99%) and producer’s accuracy of S. alterniflora and S. patens (100%), likely due to the significant contrasting spectral differences that appear after S. alterniflora senescence. Producer’s accuracy of the “structure” class was still low (80%), which could be misclassification of glare or bright reflectance from bare Earth (such as in the habitat island, Figure 4).
One of the main objectives of this study included identifying which variables were most important to make accurate predictions of wetland vegetation. Variable importance differed between the random forest models due to differences in the spectral and structural characteristics of the marsh vegetation at the time of data collection. The overall high MDA for the canopy elevation and texture variables indicates the importance of these structural characteristics and the reduction in accuracy of classification models lacking these variables (Figure 5). Across all datasets except April, canopy elevation was the most important variable with much higher MDA, similar to findings from Pricope et al. (2022). In April, texture was slightly higher in importance presumably due to structural differences at the end of winter; the structure of S. patens is typically persistent while S. alterniflora tends to shed leaves and decomposes. Similarly, texture was also high in importance for the November and August datasets likely due to considerable structural differences during and right after the growing season. Across seasons, MDA was lowest for the visible bands, demonstrating that using only visible bands can lead to lower classification accuracy. NDVI and the NIR band were higher in importance than the visible bands, due to distinct differences in NIR reflection between the two species (Knipling, 1970).
The high spatial resolution of the UAS imagery (0.05 m) produced higher classification accuracies than the down-sampled UAS imagery, demonstrating that higher spatial detail is important for accurate marsh vegetation classification (Figure 6). Overall accuracy decreased 3% when down-sampling to 1.2, 2.4, and 4 m and 7% when down-sampling to 10 m. This was likely due to larger pixel sizes averaging two or more classes, leading to misclassifications of the true habitat class. Supplementary Figure S3 illustrates the differences in spatial resolution between UAS and high-resolution WorldView 2 (2.4 m) and 3 (1.2 m) imagery, demonstrating how vegetation classification would be challenging and imprecise with coarser pixel sizes. Future work should consider calculating a “Pareto Boundary,” a method that quantitatively analyzes the influence of low-resolution bias. This concept can provide insight into whether lower classification accuracy of a low spatial resolution map is given by poor performance of the model or by the low resolution of the remotely sensed data (Boschetti et al., 2004).
The classification accuracies from this study are comparable to results from other UAS wetland vegetation classification studies (Feng et al., 2015; Samiappan et al., 2017; Abeysinghe et al., 2019) These studies, along with the present study, demonstrate that ultra-high resolution data produced by a low-altitude UAS can improve classification results and is a superior method to other remote sensing platforms. To distinguish wetland vegetation with high accuracy, it is recommended to collect data during the fall after S. alterniflora has senesced to obtain more pronounced spectral and structural differences between species at that time.
Marsh vegetation change at Poplar Island
Widespread marsh lateral migration has been observed along many Mid-Atlantic wetlands, with rates ranging from 0.1 mm yr-1 to 6.78 m yr-1 (Flester & Blum, 2020; Molino et al., 2021). However, these rates are not necessarily continuous and can be episodic with high interannual variability, as shown in this study. From 2005 to 2022, the high marsh zone that was planted with 100% coverage of S. patens, shifted to 45% S. patens coverage, indicating a significant vegetation change and evidence of marsh migration (Figure 4). From 2019 to 2022, interannual variability of high marsh S. patens coverage estimated from the classification model ranged from 42% to 56%. Interannual variation is common in tidal wetlands whose vegetation tends to stabilize through feedbacks that vary with depth and duration of tidal inundation (Kirwan and Megonigal, 2013). Morris et al. (2002) found that the growth of S. alterniflora is positively correlated with interannual variations in sea level. Relative annual mean sea level at Poplar Island has gradually increased since 1971 at an estimated rate of 3.9 mm yr-1 (NOAA Station 8571892, NOAA Tides and Currents) (Kent, 2015). While our UAS sample size is small (n = 4), the percentage of classified S. alterniflora in the high marsh boundary appears to correlate with annual mean sea level (r2 = 0.92), with a lag of about 1 year. This finding suggests that S. alterniflora growth is influenced by water levels the previous year; however, more data is needed to confirm this potential lag in the vegetation response to water levels.
Marsh vegetation change can also be attributed to other factors including nutrient enrichment. Studies have shown that increased nutrient availability can change ratios of above and belowground biomass (Darby and Turner, 2008), competitive interactions (Bertness et al., 2002) and vertical accretion rates (Morris et al., 2002), potentially altering vegetation zonation, community composition, and resilience to sea level rise (Emery et al., 2001; Morris et al., 2013). The dredged material used for tidal marsh creation at Poplar Island is fine-grained and contains high levels of nitrogen (Staver et al., 2020); therefore, it is possible that detected vegetation changes are an indirect result of nutrient enrichment. Furthermore, the small interannual differences in classified marsh vegetation could be related to the classification accuracy of the random forest model developed for each year. While overall accuracy is high across all datasets, there is still potential for misclassification of vegetation, leading to small discrepancies in predicted vegetation coverage among years.
Benefits and caveats of UAS remote sensing in marsh environments
UAS remote sensing is a low cost, rapid, and repeatable method for collecting high resolution imagery that can be used to resolve fine scale changes in coastal wetlands without significant disturbance of the sensitive ecosystem (Joyce et al., 2019; Davis et al., 2022; DiGiacomo et al., 2022). UAS provides flexibility in obtaining imagery and can do so under optimal conditions which is useful for smaller scale projects that may be limited in field monitoring resources or projects where aircraft flights and access to satellite imagery are beyond the scope or budget. Consumer grade UAS can cover a relatively large area (13 ha in ∼40 min), which will only improve with advancements in battery life. For assessing larger wetlands, fixed-wing UAS can cover larger areas due to increased flight efficiency or UAS data can be used for training and validating satellite-based classification models (Gray et al., 2018).
As with any developing technology, there are some caveats with UAS remote sensing that should be discussed. Operating a UAS is highly dependent upon the legal restrictions governing an area and can be prohibited in some areas. In the United States, UAS pilots are required to be licensed (i.e., obtain a Federal Aviation Administration (FAA) Part 107 remote pilot license) and follow local, state, and federal regulations on UAS operations. Furthermore, the cost-benefit of UAS technology should also be considered. Currently, UAS pricing can range from $500 (USD) for consumer-grade aircraft to $10K-$20K (USD) for professional-grade aircraft and sensor packages, with more advanced sensors (e.g., hyperspectral, LiDAR) reaching $50K–$100K (USD). Additionally, the software typically used for post processing (e.g., Pix4D, Agisoft Metashape) can add additional costs on the order of $1K–$5K. Computing power and storage is also a consideration since a large number of images to be processed requires large amounts of computer random access memory (RAM), large graphics processing units (GPUs) and extensive storage (Morgan et al., 2022).
UAS remote sensing in marsh environments also has its specific challenges. Studies have shown that vegetated areas with standing water and changing tide levels can interfere with the radiance being collected by the UAS and alter vegetation indices such as NDVI (Kearney et al., 2009; Doughty and Cavanaugh, 2019). Canopy structure can also influence classification results; with changes in vegetation orientation or geometry (e.g., vegetation folding over from wind or water) altering canopy optical properties and leading to errors in classifications (Knipling, 1970).
There are also some caveats and considerations with the classification approach used in this study. Other machine learning classification algorithms exist such as support vector machines, K-Nearest neighbors, or artificial neural networks (Dronovo et al., 2012; Berhane et al., 2018; Morgan et al., 2022) that could perform better or similar to the random forest models applied in this study. Some studies have evaluated various classification approaches and found random forest outperforming others (Berhane et al., 2018) or concluded that no single approach is consistently better and should be matched to the research or management question (Dronova et al., 2012). Some studies have also shown promising results using an object-based image analysis (OBIA) of wetland vegetation classification where images are segmented into spectrally homogeneous “objects” or groups of pixels that can be classified (Moffett and Gorelick, 2013; Dronova, 2015; Durgan et al., 2020). OBIA approaches cannot be fully automated and require user inputs to set segmentation and scale settings, which depend on the type of vegetation being classified and imagery resolution. Due to a range of wetland vegetation sizes, it can be challenging to select optimal segmentation settings for an entire wetland landscape, leading to over-segmentation and under-segmentation errors (Liu and Xia, 2010; Kim et al., 2011; Moffett and Gorelick, 2013). In contrast, several studies have found pixel-based classifications performing better than object-based approaches, demonstrating the model being able to identify smaller patches of vegetation (Abeysinghe et al., 2019).
Conclusion
This study demonstrates that high resolution UAS imagery is an effective tool for detecting fine scale changes in the distribution of wetland vegetation. The combination of multispectral reflectance, texture, and canopy elevation derived from UAS and SfM processing in a supervised random forest classification model led to high overall accuracy as compared to other studies. Results from the classification maps demonstrated a shift in species distribution affecting 45% of the high marsh zone over a ∼17 years time frame; although recent distributions (past 4 years) were more stable, suggesting temporary equilibrium. The increased awareness of marsh habitat loss has prompted an era of creation and restoration of coastal wetlands to mitigate the effects of marsh habitat loss. Similar to large scale experiments, restoration projects require clear goals, monitoring, and adaptive management practices in order to understand site specific relationships between coastal wetlands and the surrounding environment (Zedler, 2000; Li et al., 2018). For decades, satellite and aircraft remote sensing have been used to assess and monitor coastal wetlands; however, spatial resolution, satellite revisit times, and the high cost of flying an aircraft can significantly limit the ability of managers to accurately detect fine scale vegetation changes. This study demonstrated that classification performance metrics are similar when UAS imagery is down-sampled to 1–2 m; but performance decreases with lower spatial resolution beyond this point. Repeatable, on-demand, ultra-high resolution UAS surveys can detect instances of vegetation change which can ultimately be used as early warning signals of marsh habitat loss and help identify areas for restoration efforts.
Data availability statement
The raw data supporting the conclusion of this article will be made available by the authors, without undue reservation.
Ethics Statement
Written informed consent was obtained from the individual(s) for the publication of any identifiable images or data included in this article.
Author contributions
AW, LS, and GS conceptualized the study; AW, LS, BM, SS, and SK collected training data; AW, LS, and BM collected the UAS data; AW, GS, and AE performed statistical analysis; AW, LS, and GS interpreted results; AW wrote the manuscript with contributions from all co-authors.
Funding
Logistical support was provided by Maryland Environmental Service and Maryland Department of Transportation Maryland Port Administration. AW received support from the Mid-Shore Chapter of the Izaak Walton League. Equipment and parts were funded by Horn Point Laboratory, University of Maryland Center for Environmental Science.
Acknowledgments
The authors wish to acknowledge support from the Maryland Department of Transportation Maryland Port Administration, the U.S. Army Corps of Engineers, and Maryland Environmental Service. Additionally, we would like to acknowledge Peter McGowan and Robbie Callahan from U.S. Fish and Wildlife for providing field data as well as Ian Delwiche from USACE for providing geospatial data. Additionally, we thank Justin Ridge for helpful conversations throughout.
Conflict of interest
SS and SK were employed by U.S. Army Corps of Engineers.
The remaining authors declare that the research was conducted in the absence of any commercial or financial relationships that could be construed as a potential conflict of interest.
Publisher’s note
All claims expressed in this article are solely those of the authors and do not necessarily represent those of their affiliated organizations, or those of the publisher, the editors and the reviewers. Any product that may be evaluated in this article, or claim that may be made by its manufacturer, is not guaranteed or endorsed by the publisher.
Supplementary material
The Supplementary Material for this article can be found online at: https://www.frontiersin.org/articles/10.3389/frsen.2023.1140999/full#supplementary-material
References
Abeysinghe, T., Milas, A. S., Arend, K., Hohman, B., Reil, P., Gregory, A., et al. (2019). Mapping invasive Phragmites australis in the Old Woman Creek estuary using UAV remote sensing and machine learning classifiers. Remote Sens. 11 (11), 1380. doi:10.3390/rs11111380
Aerts, R. (1999). Interspecific competition in natural plant communities: Mechanisms, trade-offs and plant-soil feedbacks. J. Exp. Bot. 50 (330), 29–37. doi:10.1093/jxb/50.330.29
Alizad, K., Hagen, S. C., Medeiros, S. C., Bilskie, M. v., Morris, J. T., Balthis, L., et al. (2018). Dynamic responses and implications to coastal wetlands and the surrounding regions under sea level rise. PloS one 13 (10), e0205176. doi:10.1371/journal.pone.0205176
Artigas, F. J., and Yang, J. S. (2005). Hyperspectral remote sensing of marsh species and plant vigour gradient in the New Jersey Meadowlands. Int. J. Remote Sens. 26 (23), 5209–5220. doi:10.1080/01431160500218952
Artigas, F. J., and Yang, J. (2006). Spectral discrimination of marsh vegetation types in the New Jersey Meadowlands, USA. Wetlands 26 (1), 271–277. doi:10.1672/0277-5212(2006)26[271:sdomvt]2.0.co;2
Assmann, J. J., Kerby, J. T., Cunliffe, A. M., and Myers-Smith, I. H. (2018). Vegetation monitoring using multispectral sensors—best practices and lessons learned from high latitudes. J. Unmanned Veh. Syst. 7 (1), 54–75. doi:10.1139/juvs-2018-0018
Barbier, E. B., Hacker, S. D., Kennedy, C., Koch, E. W., Stier, A. C., and Silliman, B. R. (2011). The value of estuarine and coastal ecosystem services. Ecol. Monogr. 81 (2), 169–193. doi:10.1890/10-1510.1
Bartlett, D. S. (1981). In situ spectral reflectance studies of tidal wetland grasses. Photogrammetric Eng. Remote Sens. 47 (12), 1695–1703.
Beckett, L. H., Baldwin, A. H., and Kearney, M. S. (2016). Tidal marshes across a chesapeake bay subestuary are not keeping up with sea-level rise. PloS one 11 (7), e0159753. doi:10.1371/journal.pone.0159753
Belgiu, M., and Dragut, L. (2016). Random forest in remote sensing: A review of applications and future directions. ISPRS J. photogrammetry remote Sens. 114, 24–31. doi:10.1016/j.isprsjprs.2016.01.011
Berhane, T. M., Lane, C. R., Wu, Q., Autrey, B. C., Anenkhonov, O. A., Chepinoga, V. V., et al. (2018). Decision-tree, rule-based, and random forest classification of high-resolution multispectral imagery for wetland mapping and inventory. Remote Sens. 10 (4), 580. doi:10.3390/rs10040580
Bertness, M. D., Ewanchuk, P. J., and Silliman, B. R. (2002). Anthropogenic modification of New England salt marsh landscapes. Proc. Natl. Acad. Sci. 99 (3), 1395–1398. doi:10.1073/pnas.022447299
Bertness, M. D. (1991). Zonation of spartina patens and spartina alterniflora in new england salt marsh. Ecology 72 (1), 138–148. doi:10.2307/1938909
Boschetti, L., Flasse, S. P., and Brivio, P. A. (2004). Analysis of the conflict between omission and commission in low spatial resolution dichotomic thematic products: The Pareto Boundary. Remote Sens. Environ. 91 (3-4), 280–292. doi:10.1016/j.rse.2004.02.015
Byrd, K. B., O’Connell, J. L., di Tommaso, S., and Kelly, M. (2014). Evaluation of sensor types and environmental controls on mapping biomass of coastal marsh emergent vegetation. Remote Sens. Environ. 149, 166–180. doi:10.1016/j.rse.2014.04.003
Darby, F. A., and Turner, R. E. (2008). Below- and aboveground biomass of Spartina alterniflora: Response to nutrient addition in a Louisiana salt marsh. Estuaries Coasts 31, 326–334. doi:10.1007/s12237-008-9037-8
Davis, J., Giannelli, R., Falvo, C., Puckett, B., Ridge, J., and Smith, E. (2022). Best practices for incorporating UAS image collection into wetland monitoring efforts: A guide for entry level users. NOAA Tech. Memo. Nos. NCCOS 308, 26. pps. doi:10.25923/ccvg-ze70
DiGiacomo, A. E., Bird, C. N., Pan, V. G., Dobroski, K., Atkins-Davis, C., Johnston, D. W., et al. (2020). Modeling salt marsh vegetation height using unoccupied aircraft systems and structure from motion. Remote Sens. 12 (14), 2333. doi:10.3390/rs12142333
DiGiacomo, A. E., Giannelli, R., Puckett, B., Smith, E., Ridge, J. T., and Davis, J. (2022). Considerations and tradeoffs of UAS-based coastal wetland monitoring in the Southeastern United States. Front. Remote Sens. 3, 81. doi:10.3389/frsen.2022.924969
Doughty, C. L., and Cavanaugh, K. C. (2019). Mapping coastal wetland biomass from high resolution unmanned aerial vehicle (UAV) imagery. Remote Sens. 11 (5), 540. doi:10.3390/rs11050540
Dronova, I., Gong, P., Clinton, N. E., Wang, L., Fu, W., Qi, S., et al. (2012). Landscape analysis of wetland plant functional types: The effects of image segmentation scale, vegetation classes and classification methods. Remote Sens. Environ. 127, 357–369. doi:10.1016/j.rse.2012.09.018
Dronova, I. (2015). Object-based image analysis in wetland research: A review. Remote Sens. 7 (5), 6380–6413. doi:10.3390/rs70506380
Duarte, C. M., Losada, I. J., Hendriks, I. E., Mazarrasa, I., and Marbà, N. (2013). The role of coastal plant communities for climate change mitigation and adaptation. Nat. Clim. change 3 (11), 961–968. doi:10.1038/nclimate1970
Durgan, S. D., Zhang, C., Duecaster, A., Fourney, F., and Su, H. (2020). Unmanned aircraft system photogrammetry for mapping diverse vegetation species in a heterogeneous coastal wetland. Wetlands 40 (6), 2621–2633. doi:10.1007/S13157-020-01373-7
Elmore, A. J., Engelhardt, K. A. M., Cadol, D., and Palinkas, C. M. (2016). Spatial patterns of plant litter in a tidal freshwater marsh and implications for marsh persistence. Ecol. Appl. 26 (3), 846–860. doi:10.1890/14-1970
Emery, N. C., Ewanchuk, P. J., and Bertness, M. D. (2001). Competition and salt-marsh plant zonation: Stress tolerators may be dominant competitors. Ecology 82 (9), 2471–2485. doi:10.1890/0012-9658(2001)082[2471:casmpz]2.0.co;2
Enwright, N. M., Griffith, K. T., and Osland, M. J. (2016). Barriers to and opportunities for landward migration of coastal wetlands with sea-level rise. Front. Ecol. Environ. 14 (6), 307–316. doi:10.1002/fee.1282
Evans, T. L., Costa, M., Tomas, W. M., and Camilo, A. R. (2014). Large-scale habitat mapping of the Brazilian pantanal wetland: A synthetic aperture radar approach. Remote Sens. Environ. 155, 89–108. doi:10.1016/j.rse.2013.08.051
Feagin, R. A., Luisa Martinez, M., Mendoza-Gonzalez, G., and Costanza, R. (2010). Salt marsh zonal migration and ecosystem service change in response to global sea level rise: A case study from an urban region. Ecol. Soc. 15 (4), art14. doi:10.5751/es-03724-150414
Feng, Q., Liu, J., and Gong, J. (2015). UAV Remote sensing for urban vegetation mapping using random forest and texture analysis. Remote Sens. 7 (1), 1074–1094. doi:10.3390/rs70101074
Flester, J. A., and Blum, L. K. (2020). Rates of mainland marsh migration into uplands and seaward edge erosion are explained by geomorphic type of salt marsh in Virginia coastal lagoons. Wetlands 40 (6), 1703–1715. doi:10.1007/s13157-020-01390-6
Gray, P. C., Ridge, J. T., Poulin, S. K., Seymour, A. C., Schwantes, A. M., Swenson, J. J., et al. (2018). Integrating drone imagery into high resolution satellite remote sensing assessments of estuarine environments. Remote Sens. 10 (8), 1257. doi:10.3390/rs10081257
Gross, M. F., Hardisky, M. A., Klemas, V., and Wolf, P. L. (1987). Quantification of biomass of the marsh grass spartina alterniflora Loisel using landsat thematic mapper imagery. Photogrammetric Eng. Remote Sens. 53 (11), 1577–1583.
Halls, J., and Costin, K. (2016). Submerged and emergent land cover and bathymetric mapping of estuarine habitats using worldView-2 and LiDAR imagery. Remote Sens. 8 (9), 718. doi:10.3390/rs8090718
Haralick, R. M., Shanmugam, K., and Dinstein, I. H. (1973). Textural features for image classification. IEEE Trans. Syst. man, Cybern. (6), 610–621. doi:10.1109/tsmc.1973.4309314
Hardisky, M. A., Smart, R. M., and Klemas, V. (1983). Growth response and spectral characteristics of a short Spartina alterniflora salt marsh irrigated with freshwater and sewage effluent. Remote Sens. Environ. 13 (1), 57–67. doi:10.1016/0034-4257(83)90027-5
Hladik, C., and Alber, M. (2012). Accuracy assessment and correction of a LIDAR-derived salt marsh digital elevation model. Remote Sens. Environ. 121, 224–235. doi:10.1016/j.rse.2012.01.018
Howes, N. C., Fitzgerald, D. M., Hughes, Z. J., Georgiou, Y., Kulp, M. A., Miner, M. D., et al. (2010). Hurricane-induced failure of low salinity wetlands. Proc. Natl. Acad. Sci. 107 (32), 14014–14019. doi:10.1073/pnas.0914582107
Joyce, K. E., Duce, S., Leahy, S. M., Leon, J., and Maier, S. W. (2019). Principles and practice of acquiring drone-based image data in marine environments. Mar. Freshw. Res. 70 (7), 952–963. doi:10.1071/MF17380
Kalacska, M., Chmura, G. L., Lucanus, O., Bérubé, D., and Arroyo-Mora, J. P. (2017). Structure from motion will revolutionize analyses of tidal wetland landscapes. Remote Sens. Environ. 199, 14–24. doi:10.1016/j.rse.2017.06.023
Kearney, M. S., Stutzer, D., Turpie, K., and Stevenson, J. C. (2009). The effects of tidal inundation on the reflectance characteristics of coastal marsh vegetation. J. Coast. Res. 25 (6), 1177–1186. doi:10.2112/08-1080.1
Kim, M., Warner, T. A., Madden, M., and Atkinson, D. S. (2011). Multi-scale GEOBIA with very high spatial resolution digital aerial imagery: Scale, texture and image objects. Int. J. Remote Sens. 32 (10), 2825–2850. doi:10.1080/01431161003745608
Kirwan, M. L., and Megonigal, J. P. (2013). Tidal wetland stability in the face of human impacts and sea-level rise. Nature 504 (7478), 53–60. doi:10.1038/nature12856
Kirwan, M. L., Walters, D. C., Reay, W. G., and Carr, J. A. (2016). Sea level driven marsh expansion in a coupled model of marsh erosion and migration. Geophys. Res. Lett. 43 (9), 4366–4373. doi:10.1002/2016GL068507
Klemas, V. (2013). Remote sensing of coastal wetland biomass: An overview. J. Coast. Res. 29 (5), 1016–1028. doi:10.2112/JCOASTRES-D-12-00237.1
Knipling, E. B. (1970). Physical and physiological basis for the reflectance of visible and near-infrared radiation from vegetation. Remote Sens. Environ. 1 (3), 155–159. doi:10.1016/s0034-4257(70)80021-9
Laba, M., Blair, B., Downs, R., Monger, B., Philpot, W., Smith, S., et al. (2010). Use of textural measurements to map invasive wetland plants in the Hudson River National Estuarine Research Reserve with IKONOS satellite imagery. Remote Sens. Environ. 114 (4), 876–886. doi:10.1016/j.rse.2009.12.002
Lane, C. R., Liu, H., Autrey, B. C., Anenkhonov, O. A., Chepinoga, V. V., and Wu, Q. (2014). Improved wetland classification using eight-band high resolution satellite imagery and a hybrid approach. Remote Sens. 6 (12), 12187–12216. doi:10.3390/rs61212187
Li, X., Bellerby, R., Craft, C., and Widney, S. E. (2018). Coastal wetland loss, consequences, and challenges for restoration. Anthr. Coasts 1 (1), 1–15. doi:10.1139/anc-2017-0001
Liu, D., and Xia, F. (2010). Assessing object-based classification: Advantages and limitations. Remote Sens. Lett. 1 (4), 187–194. doi:10.1080/01431161003743173
Liu, M., Li, H., Li, L., Man, W., Jia, M., Wang, Z., et al. (2017). Monitoring the invasion of Spartina alterniflora using multi-source high-resolution imagery in the Zhangjiang Estuary, China. Remote Sens. 9 (6), 539. doi:10.3390/rs9060539
Mahdavi, S., Salehi, B., Granger, J., Amani, M., Brisco, B., and Huang, W. (2018). Remote sensing for wetland classification: A comprehensive review. GIScience Remote Sens. 55 (5), 623–658. doi:10.1080/15481603.2017.1419602
Mancini, F., Dubbini, M., Gattelli, M., Stecchi, F., Fabbri, S., and Gabbianelli, G. (2013). Using unmanned aerial vehicles (UAV) for high-resolution reconstruction of topography: The structure from motion approach on coastal environments. Remote Sens. 5 (12), 6880–6898. doi:10.3390/rs5126880
Massetti, A., Sequeira, M. M., Pupo, A., Figueiredo, A., Guiomar, N., and Gil, A. (2016). Assessing the effectiveness of RapidEye multispectral imagery for vegetation mapping in Madeira Island (Portugal). Eur. J. Remote Sens. 49 (1), 643–672. doi:10.5721/EuJRS20164934
Maxa, M., and Bolstad, P. (2009). Mapping northern wetlands with high resolution satellite images and LiDAR. Wetlands 29 (1), 248–260. doi:10.1672/08-91.1
Mendelssohn, I. A., Mckee, K. L., and Patrick, W. H. (1981). Oxygen deficiency in spartina alterniflora roots: Metabolic adaptation to anoxia. Science 214 (4519), 439–441. doi:10.1126/science.214.4519.439
Moffett, K. B., and Gorelick, S. M. (2013). Distinguishing wetland vegetation and channel features with object-based image segmentation. Int. J. Remote Sens. 34 (4), 1332–1354. doi:10.1080/01431161.2012.718463
Molino, G. D., Defne, Z., Aretxabaleta, A. L., Ganju, N. K., and Carr, J. A. (2021). Quantifying slopes as a driver of forest to marsh conversion using geospatial techniques: Application to chesapeake bay coastal-plain, United States. Front. Environ. Sci. 9, 149. doi:10.3389/fenvs.2021.616319
Morgan, G. R., Hodgson, M. E., Wang, C., and Schill, S. R. (2022). Unmanned aerial remote sensing of coastal vegetation: A review. Ann. GIS 2, 1–15. doi:10.1080/19475683.2022.2026476
Morris, J. T., Shaffer, G. P., and Nyman, J. A. (2013). Brinson review: Perspectives on the influence of nutrients on the sustainability of coastal wetlands. Wetlands 33 (6), 975–988. doi:10.1007/s13157-013-0480-3
Morris, J. T., Sundareshwar, P. v., Nietch, C. T., Kjerfve, B., and Cahoon, D. R. (2002). Responses of coastal wetlands to rising sea level. Ecology 83 (10), 2869–2877. doi:10.1890/0012-9658(2002)083[2869:ROCWTR]2.0.CO;2
Mutanga, O., Adam, E., and Cho, M. A. (2012). High density biomass estimation for wetland vegetation using WorldView-2 imagery and random forest regression algorithm. Int. J. Appl. Earth Observation Geoinformation 18, 399–406. doi:10.1016/j.jag.2012.03.012
Nardin, W., Taddia, Y., Quitadamo, M., Vona, I., Corbau, C., Franchi, G., et al. (2021). Seasonality and characterization mapping of restored tidal marsh by NDVI imageries coupling UAVs and multispectral camera. Remote Sens. 13 (21), 4207. doi:10.3390/rs13214207
Pendleton, L., Donato, D. C., Murray, B. C., Crooks, S., Jenkins, W. A., and Sifleet, S. (2012). Estimating global “blue carbon” emissions from conversion and degradation of vegetated coastal ecosystems. PLoS ONE 7, e43542. doi:10.1371/journal.pone.0043542
Pinton, D., Canestrelli, A., Wilkinson, B., Ifju, P., and Ortega, A. (2020). A new algorithm for estimating ground elevation and vegetation characteristics in coastal salt marshes from high-resolution UAV-based LiDAR point clouds. Earth Surf. Process. Landforms 45 (14), 3687–3701. doi:10.1002/esp.4992
Pricope, N. G., Minei, A., Halls, J. N., Chen, C., and Wang, Y. (2022). UAS hyperspatial LiDAR data performance in delineation and classification across a gradient of wetland types. Drones 6, 268. doi:10.3390/drones6100268
Qi, M., MacGregor, J., and Gedan, K. (2020). Biogeomorphic patterns emerge with pond expansion in deteriorating marshes affected by relative sea level rise. Limnol. Oceanogr. 66 (4), 1036–1049. doi:10.1002/lno.11661
Ridge, J. T., and Johnston, D. W. (2020). Unoccupied aircraft systems (UAS) for marine ecosystem restoration. Front. Mar. Sci. 7, 438. doi:10.3389/fmars.2020.00438
Samiappan, S., Turnage, G., Allen Hathcock, L., and Moorhead, R. (2017). Mapping of invasive phragmites (common reed) in Gulf of Mexico coastal wetlands using multispectral imagery and small unmanned aerial systems. Int. J. Remote Sens. 38 (8-10), 2861–2882. doi:10.1080/01431161.2016.1271480
Schieder, N. W., Walters, D. C., and Kirwan, M. L. (2018). Massive upland to wetland conversion compensated for historical marsh loss in chesapeake bay, USA. Estuaries Coasts 41, 940–951. doi:10.1007/s12237-017-0336-9
Seymour, A. C., Ridge, J. T., Rodriguez, A. B., Newton, E., Dale, J., and Johnston, D. W. (2018). Deploying fixed wing unoccupied aerial systems (UAS) for coastal morphology assessment and management. J. Coast. Res. 34 (3), 704–717. doi:10.2112/JCOASTRES-D-17-00088.1
Silva, T. S. F., Costa, M. P., and Melack, J. M. (2010). Spatial and temporal variability of macrophyte cover and productivity in the eastern amazon floodplain: A remote sensing approach. Remote Sens. Environ. 114 (9), 1998–2010. doi:10.1016/j.rse.2010.04.007
Staver, L. W., Stevenson, J. C., Cornwell, J. C., Nidzieko, N. J., Staver, & K. W., Owens, M. S., et al. (2020). Tidal marsh restoration at poplar island: Ii. Elevation trends, vegetation development, and carbon dynamics. Wetlands 40 (6), 1687–1701. doi:10.1007/s13157-020-01295-4/
Story, M., and Congalton, R. G. (1986). Accuracy assessment: A user’s perspective. Photogrammetric Eng. remote Sens. 52 (3), 397–399.
USACE (2020). Multispectral imagery analysis for vegetative coverage monitoring at poplar island. Baltimore, Maryland: USACE.
Wan, H., Wang, Q., Jiang, D., Fu, J., Yang, Y., and Liu, X. (2014). Monitoring the invasion of Spartina alterniflora using very high resolution unmanned aerial vehicle imagery in Beihai, Guangxi (China). Sci. World J. 2014, 1–7. doi:10.1155/2014/638296
Wang, M., Fei, X., Zhang, Y., Chen, Z., Wang, X., Tsou, J. Y., et al. (2018). Assessing texture features to classify coastal wetland vegetation from high spatial resolution imagery using Completed Local Binary Patterns (CLBP). Remote Sens. 10 (5), 778. doi:10.3390/rs10050778
Westoby, M. J., Brasington, J., Glasser, N. F., Hambrey, M. J., and Reynolds, J. M. (2012). ‘Structure-from-Motion’ photogrammetry: A low-cost, effective tool for geoscience applications. Geomorphology 179, 300–314. doi:10.1016/j.geomorph.2012.08.021
Keywords: wetland, marsh, restoration, UAS, drones, monitoring, classification, random forest
Citation: Windle AE, Staver LW, Elmore AJ, Scherer S, Keller S, Malmgren B and Silsbe GM (2023) Multi-temporal high-resolution marsh vegetation mapping using unoccupied aircraft system remote sensing and machine learning. Front. Remote Sens. 4:1140999. doi: 10.3389/frsen.2023.1140999
Received: 09 January 2023; Accepted: 20 February 2023;
Published: 17 March 2023.
Edited by:
Chunyan Lu, Fujian Agriculture and Forestry University, ChinaReviewed by:
Zhigang Cao, Nanjing Institute of Geography and Limnology (CAS), ChinaMaycira Costa, University of Victoria, Canada
Copyright © 2023 Windle, Staver, Elmore, Scherer, Keller, Malmgren and Silsbe. This is an open-access article distributed under the terms of the Creative Commons Attribution License (CC BY). The use, distribution or reproduction in other forums is permitted, provided the original author(s) and the copyright owner(s) are credited and that the original publication in this journal is cited, in accordance with accepted academic practice. No use, distribution or reproduction is permitted which does not comply with these terms.
*Correspondence: Anna E. Windle, awindle110@gmail.com