 Timothy L. McMurry1
 Jennifer M. Lobo
 Soyoun Kim
 Min-Woong Sohn
- 1Department of Public Health Sciences, University of Virginia, Charlottesville, VA, United States
- 2Department of Social Welfare, Ewha Womans University, Seoul, Republic of Korea
- 3Department of Kinesiology and Community Health, University of Illinois, Champaign, IL, United States
- 4Department of Health Management and Policy, University of Kentucky, Lexington, KY, United States
Importance: The United States (US) Medicare claims files are valuable sources of national healthcare utilization data with over 45 million beneficiaries each year. Due to their massive sizes and costs involved in obtaining the data, a method of randomly drawing a representative sample for retrospective cohort studies with multi-year follow-up is not well-documented.
Objective: To present a method to construct longitudinal patient samples from Medicare claims files that are representative of Medicare populations each year.
Design: Retrospective cohort and cross-sectional designs.
Participants: US Medicare beneficiaries with diabetes over a 10-year period.
Methods: Medicare Master Beneficiary Summary Files were used to identify eligible patients for each year in over a 10-year period. We targeted a sample of ~900,000 patients per year. The first year's sample is stratified by county and race/ethnicity (white vs. minority), and targeted at least 250 patients in each stratum with the remaining sample allocated proportional to county population size with oversampling of minorities. Patients who were alive, did not move between counties, and stayed enrolled in Medicare fee-for-service (FFS) were retained in the sample for subsequent years. Non-retained patients (those who died or were dropped from Medicare) were replaced with a sample of patients in their first year of Medicare FFS eligibility or patients who moved into a sampled county during the previous year.
Results: The resulting sample contains an average of 899,266 ± 408 patients each year over the 10-year study period and closely matches population demographics and chronic conditions. For all years in the sample, the weighted average sample age and the population average age differ by <0.01 years; the proportion white is within 0.01%; and the proportion female is within 0.08%. Rates of 21 comorbidities estimated from the samples for all 10 years were within 0.12% of the population rates. Longitudinal cohorts based on samples also closely resembled the cohorts based on populations remaining after 5- and 10-year follow-up.
Conclusions and relevance: This sampling strategy can be easily adapted to other projects that require random samples of Medicare beneficiaries or other national claims files for longitudinal follow-up with possible oversampling of sub-populations.
Introduction
The United States (US) Medicare claims data capture national data on health care utilization for Americans aged 65 years old or older, disabled, or with end-stage renal disease (ESRD). Medicare currently is the only source of national data on healthcare utilization in the US, and thus its importance for epidemiological and health services research cannot be overemphasized (1–7). Due to the costs and sheer sizes of Medicare claims data, obtaining full data on even a subset (e.g., a disease-specific cohort) of the Medicare population with longitudinal follow-up over several years may not be feasible or practical. For this reason, researchers frequently work with a representative sample of the Medicare population.
Because the price for a Medicare claims file is the same for up to one million beneficiaries and increases thereafter, researchers tend to settle for a cohort with fewer than one million beneficiaries for each year. For projects with multiple objectives that require a longitudinal follow-up over many years as well as a cross-sectional analysis of a single year's data, however, this pricing structure creates a problem due to high attrition of Medicare population through mortality or disenrollment over time. In the example we discuss below, we observed that over 70% of patients in our sample exited Medicare fee for service (FFS) during a 10-year follow-up. Because of attrition and aging, the remaining cohort from the second year on will be substantially smaller than, and different from, the original cohort and older than the Medicare population overall for that year. Except for the first year, therefore, a longitudinal sample may not be representative of the Medicare population for subsequent years and cannot be validly used for population estimates.
On the other hand, if the data are sampled independently each year, the resulting data over multiple years may not be suitable for longitudinal analysis, because too few patients will be available for multi-year follow-up and the longitudinal sample would not be representative of the underlying longitudinal population due to independent sampling each year.
Therefore, a sampling approach suited for cross-sectional analysis may not be compatible with an approach optimized for longitudinal analysis. This poses dilemma for projects that require both longitudinal and cross-sectional analyses. This paper describes a method we developed for constructing a longitudinal sample from Medicare claims that is also valid for cross-sectional analysis. With this approach, researchers can maximize the value and utility of their Medicare samples. For small area variations between counties, our approach also takes oversampling into account for small counties and/or racial/ethnic minorities. To illustrate the method, we describe an ongoing research project studying Medicare patients with diabetes living in the Diabetes Belt and surrounding counties over a 10-year period (NIDDK R01DK113259). The sample for this project is also designed to be representative at the county level, and it additionally incorporates oversampling of whichever of the minority or white population of in each county is smaller.
Methods
Study sample, population, and data sources
Our study tracked Medicare patients with diabetes living in the area known as the Diabetes Belt (see below) and its surrounding counties between 2006 and 2015. Our initial cohort was a random sample of patients with diabetes identified from the 2006 Medicare records. These patients were then followed for 10 years until the end of 2015 to create a longitudinal sample. At the same time, some of our objectives required cross-sectional analysis (e.g., to examine risk factors for diabetic complications using the 2015 data), which necessitated careful augmentation of the data in each year of follow-up.
Our population included all Medicare Fee-for-Service patients with diabetes residing in the Diabetes Belt (described below) and surrounding counties. We used the Medicare Master Beneficiary Summary Files (MBSFs) to identify Medicare patients meeting inclusion criteria each year from 2006 to 2015. To be eligible for inclusion, Medicare patients needed to have been previously diagnosed with diabetes (identified in the Chronic Conditions segment in the MBSFs), be living in the Diabetes Belt or surrounding counties, and be enrolled in Medicare Fee-for-Service for all 12 months each year. Patients enrolled in Medicare HMOs were excluded because their claims data were not available.
Diabetes belt and surrounding counties
The Center for Disease Prevention and Control (CDC) identified 644 counties across 15 states in the Appalachian region and the southeastern US as the Diabetes Belt (8). Some or all counties in Alabama, Arkansas, Florida, Georgia, Kentucky, Louisiana, Mississippi, North Carolina, Ohio, Pennsylvania, South Carolina, Tennessee, Texas, Virginia, and West Virginia comprise the Belt. We used the CDC's definition based on 2008 data in this study. We additionally identified 310 counties that are closest but not contiguous to the Belt counties as surrounding counties to serve as a basis for comparisons with the Belt counties. Counties that are immediately adjacent to the Belt were not included among the surrounding counties because some patients may cross county boundaries to seek care and may confound our estimates on healthcare utilization and outcome rates.
Construction of the first year's sample
The sampling approach we developed was informed and influenced by our study objectives that included tracking changes in patient care, practice patterns, and outcomes over time. The sample we describe was designed to provide valid inference around these goals for patients with diabetes living in the Diabetes Belt and surrounding counties during the years from 2006 to 2015.
From a sampling design perspective, the goals we have outlined are somewhat in conflict. For example, if the goal is to provide similar precision within each county, then the optimal sampling design would be to sample approximately the same number of people in each county. In contrast, if the goal is to provide the best population-level estimates, then sampling from each county in proportion to its size is approximately optimal (9). The desire to compare white and minority populations in our study suggested oversampling of whichever group is smaller in each county. While surveys designed for a specific primary analysis can be further optimized, our survey needs to provide reasonable analytic power for multiple aims. This sampling design will provide good precision for a wide range of analyses.
Because the population sizes varied widely among counties, we chose to oversample patients from smaller counties to ensure they were adequately represented in our sample and to balance the competing needs for county and regional level inference. This meant that we must take the whole patient population from smaller counties. We thus allocated a minimum sample of 500 persons to each county or the county eligible population if < 500. We considered several alternatives between 500 and 1,000 and found that 500 allowed a complete enumeration for the smallest 18% of counties and at least 50% sampling for 70% of counties while still allowing significant sampling in the most populous regions. We then allocated the remaining available sample to each county proportional to the size of its un-sampled population, with the constant of proportionality chosen to produce a sample size as close as possible to the 900,000-person target; the resulting sampling rate was ~30% of the remaining population.
Within counties we then initially tried to allocate a sample of 250 (or the population size if <250) to the white population and 250 for the minority population. Remaining samples allocated to the county were then divided between the white and minority populations according to the proportion.
where represents the minority proportion in the remaining sample for county i, represents the minority proportion of the unsampled population of county i (Figure 1). In this paper, we combined all non-White racial/ethnic groups into one “minority” group. In counties where the minority population is smaller, this formula oversamples the minority population by a rate of approximately two-to-one when the minority population is proportionally small, transitioning to equal sampling as the white and minority populations become equal. In counties where the white population is smaller, the white population was oversampled. Our goal was to oversample whichever group (white/minority) was smaller in each county in order to improve within county comparisons while still providing significant coverage of the white population, which encompasses ~80% of the population living with diabetes in this region.

Figure 1. Targeted sampling proportion of minorities in each county.
Once we had defined the sample size by stratum (county and white/minority), we then selected patients using simple random sampling within strata. Sampling weights were defined to be the stratum population size divided by the stratum sample size.
Construction of subsequent years' samples
Sampling in subsequent years was complicated by the demands of retaining patients for longitudinal follow-up and ensuring a cross-sectionally representative sample in each year. Because the first year's sample (2006) was representative of all Medicare patients who had diabetes and met inclusion criteria in that year, all patients retained from the 2006 sample who had remained alive and eligible would have been representative of the population who had been eligible for at least 1 year (and they were therefore ~1 year older than the overall population). In order to replace patients in the 2006 data set who had died, enrolled in a Medicare HMO, or moved, we replaced them with an appropriately weighted sample of patients who became newly eligible for inclusion in 2007 by being new Medicare FFS enrollees or moving into a sampled county.
We constructed the 2007 replacement sample to first allocate at least 10 patients to each stratum to ensure that we add new beneficiaries in every county every year. Additional patients were then allocated to each stratum to target the overall sample size as would have been calculated using the 2006 sampling procedure on the 2007 county populations. All replacement patients were sampled from the population who would have been ineligible in 2006 (not enrolled in Medicare, in a Medicare HMO, lived elsewhere, or were first diagnosed with diabetes in 2007). Sampling weights were calculated as the number of first year eligible white/minority population in each county divided by the corresponding fill-in sample size. We similarly constructed the 2008–2015 replacement samples.
Comparison of sample to population
In order to ensure the sample demographics reflected the underlying population for each year, we compared the randomly selected sample to the population. This analysis was performed using weighted survey sample analysis procedures (Stata “survey” suite of programs) with weights as described above and sampling strata defined by county, white/minority, and year the patient was added to the sample. Because the MBSF included limited number of patient characteristics, we only compared sample age, sex, race/ethnicity to the population parameters. Additionally, the Chronic Condition segment of the MBSF files contained indicators for 29 comorbid chronic conditions for each patient. We used them to compare the annual samples to the corresponding populations. We also constructed two longitudinal cohorts that were defined in 2006 and 2011 as the baseline (e.g., all patients with diabetes aged 65 years or older at baseline), respectively. We followed them for 10 and 5 years and patients remaining in the last year of follow-up (2015) were compared to the populations to examine how closely longitudinal cohorts constructed from samples resemble those constructed from the populations.
Statistical analysis
Data cleaning was performed in SAS v9.4 (Cary, NC) and Stata SE v15.1 (College Station, TX); the random sample was generated using an R v3.6.1 (Vienna, Austria) program which is available on request. We compared the weighted sample values to the population parameters to test how closely our annual samples and longitudinal samples match annual and longitudinal populations. Descriptive statistics and comparison to the reference population were calculated using Stata survey programs. For standard statistics (means, proportions, totals, regression coefficients), Taylor-series-based methods were used for cross-sectional analyses presented below (10). This study was approved by the University of Virginia institutional review board.
Results
Our study sampled Medicare FFS patients in each year of a 10-year period (2006–2015), retained as many patients as possible for longitudinal follow-up and allowed for cross-sectional analysis. We targeted a stratified random sample of about 900,000 from the Diabetes Belt and surrounding counties. Table 1 shows year-by-year retention based on year of initial sampling.
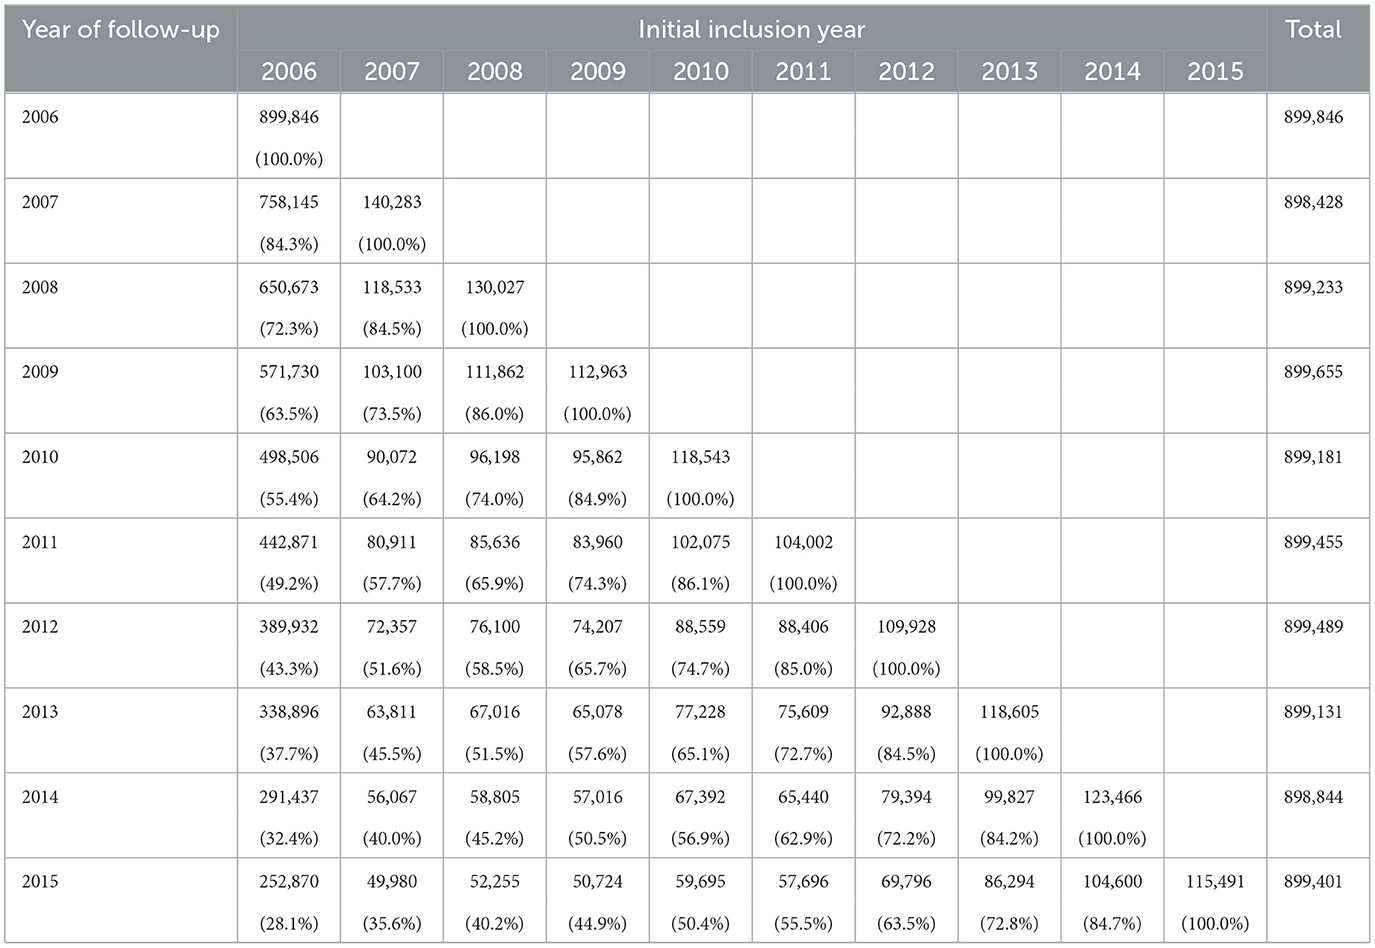
Table 1. Longitudinal retention (sample size and percent) in the Medicare data by year of initial inclusion and year of follow-up.
Our sample design yielded an average sample size of 899,266 ± 408 over the 10-year study period. A total of 28% of the first year (2006) sample was retained for the full 10-year follow-up that included more than 200,000 non-Hispanic white and 70,000 minority patients. For a follow-up from 2010 to 2015 to examine the effects of the Affordable Care Act legislation, this sampling approach yielded a sample of over 460,000 patients (52% of the 2010 sample) who can be followed up for the full 6 years. Although Hispanic and other race/ethnicity groups represented <1% of our total sample, the study retained a substantial number (~2,000 or more) for area-wide subgroup comparison and for longitudinal follow-up for the 10-year period.
In order to assess the resulting sample, for each year of the survey we made cross-sectional comparisons of the weighted sample to the population defined from the MBSF (described in Table 1). Population size, race, and previous year sample eligibility were the factors we used in determining the sample. We therefore focused our descriptive statistics on race, age, sex, and population totals. Age is a particularly important variable for assessment because if the fill-in samples were incorrectly constructed, we would expect to see drift from the underlying population as the retained samples from previous years aged. We additionally included sex because it is an important factor in most health outcomes and it provides a good additional point of comparison that was not incorporated in the sampling design.
Demographic comparisons are shown in Table 2. For all years in the sample, the weighted sample average age and the population age differ by < 0.01 years; the proportion white is within 0.01%; and the proportion female is within 0.08%. No difference was statistically significant at the α = 0.05 level. Figure 2 shows that, in the last year of follow-up (2015), the weighted age distribution in the sample closely matched the population age distribution. This comparison provides a visual check that the fill-in samples from years 2007–2015 were appropriately weighted to allow for valid cross-sectional comparisons of age.
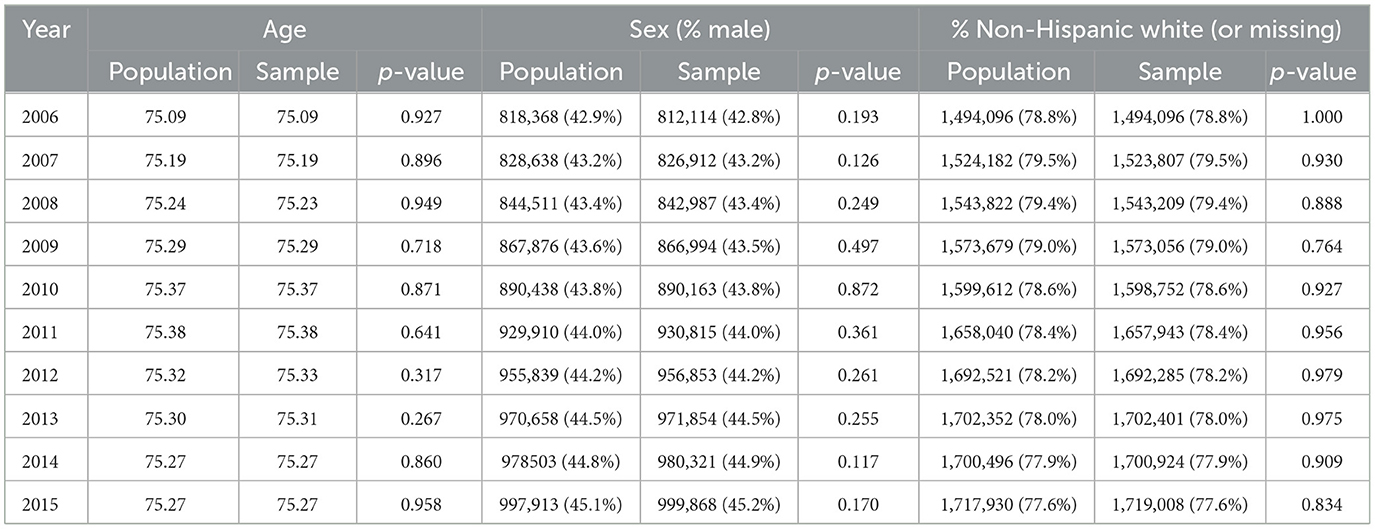
Table 2. Cross-sectional comparison of population and weighted sample by age, sex, and race/ethnicity by year.
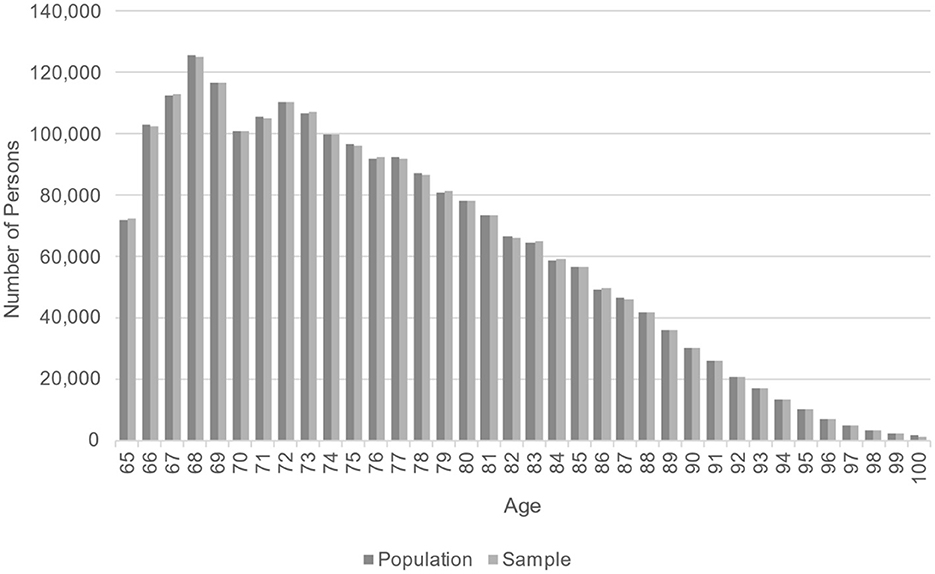
Figure 2. Comparison of population and weighted sample age distribution for 2015.
At the county level, the sample produced a complete census for at least 14.5% of counties each year, and 58.6% counties had more than 50% of their residents capture each year. All counties had more than 25% of their residents captured every year.
Prevalence rates of 21 chronic conditions were compared between the population and the sample using one-sample proportion test. Table 3 shows the comparisons for 3 years only (2006, 2010, and 2015). Overall, we found that rates estimated from the samples for all 10 years closely approximated the population parameters; they were within 0.12% of the population rates. However, we found that five of the 210 comparisons (0.24%) showed statistically significant differences from the underlying population. We found no apparent trend or pattern for the bias over time. Some uncommon conditions such as endometrial cancer at around 1% were well-represented in the samples over the study period.
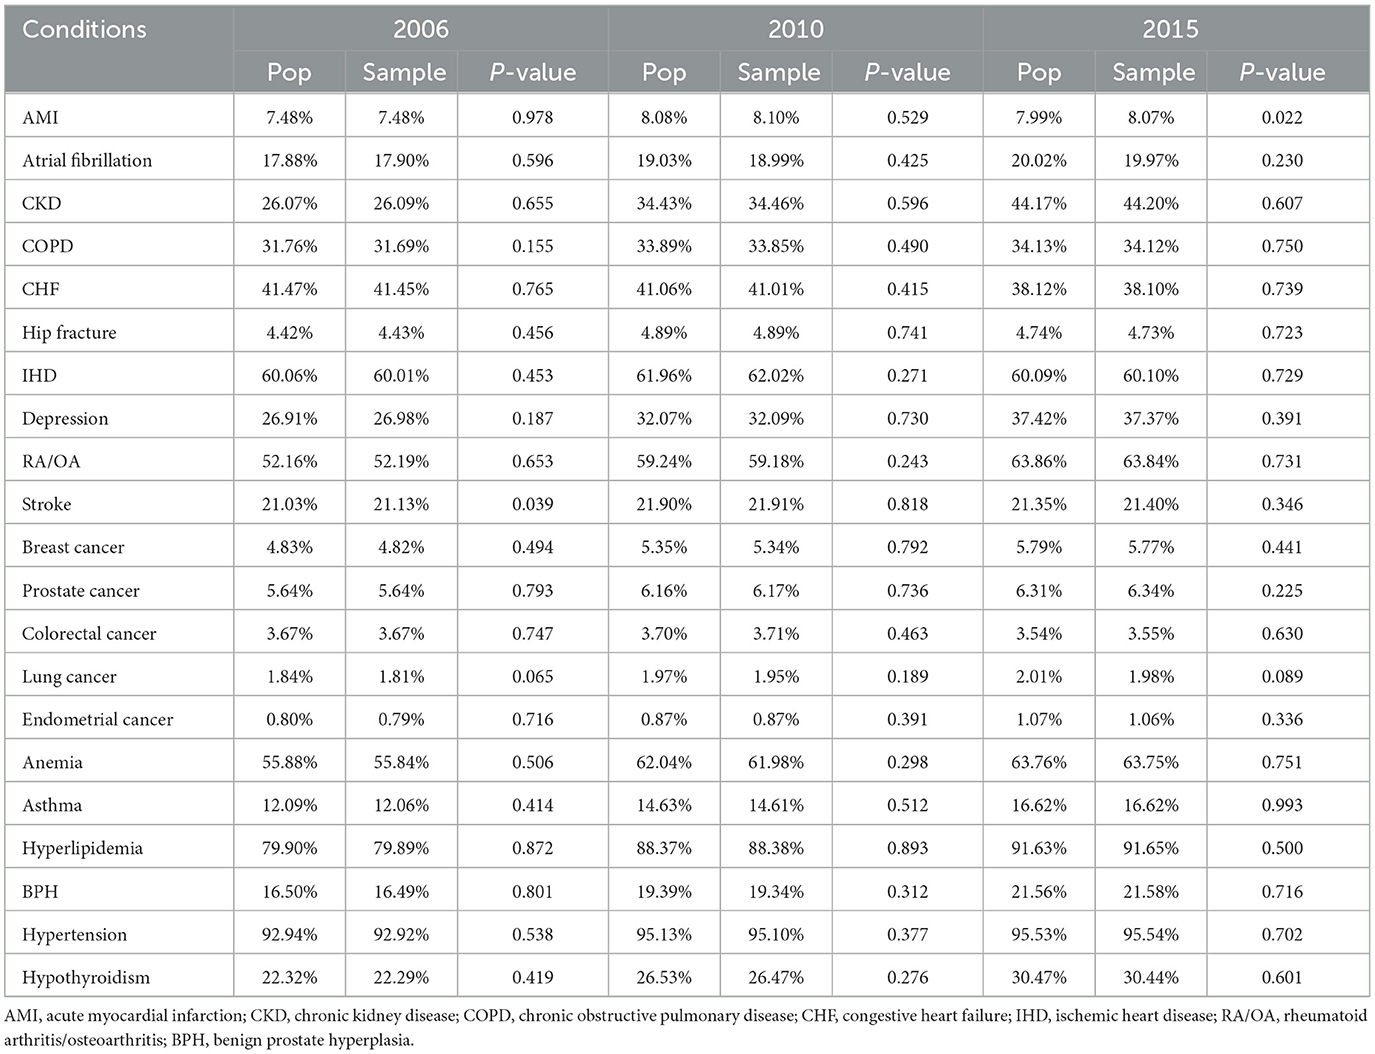
Table 3. Comparison of prevalence rates of 21 chronic conditions from the population and the weighted samples for 2006, 2010, 2015.
Comparison of longitudinal cohorts from samples resembled the matching cohorts assembled from the populations in the last year of follow-up (Table 4). For this comparison, we removed a small percentage of patients who moved out of a county during a 10-year (3.2%) and 5-year (1.8%) follow-up. We found that the sample and population retained 30 and 31% of those in the baseline year at the end of the 10-year follow-up and 60 and 61% after the 5-year follow-up. Average ages in the remaining cohorts differed by 0.01 and 0.003 years, respectively, after a 10- and 5-year follow-up between sample and population cohorts. Gender and race/ethnicity distributions in the sample cohorts were within 0.2% of the population cohorts. Similarly, comorbidity distributions were also very similar after 10- and 5-year follow-up (≤0.2% for all conditions). Only four of 48 comparisons (8%) showed statistically significant differences between population and sample values in Table 4.
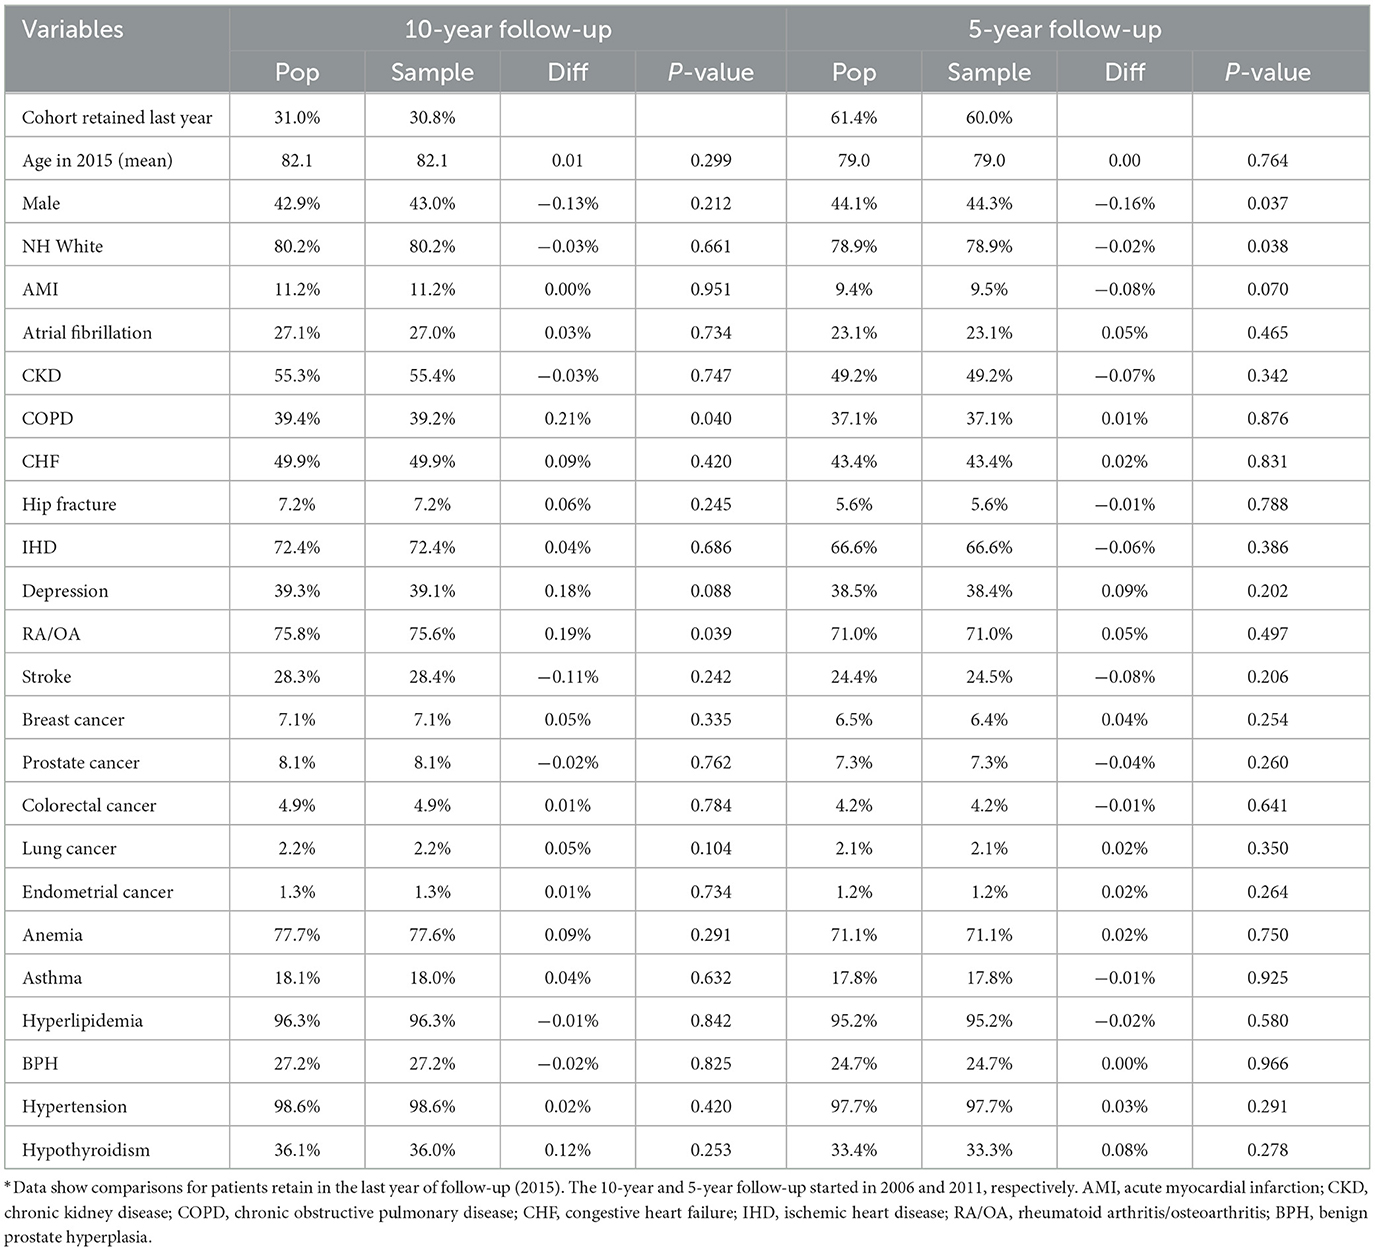
Table 4. Longitudinal cohorts from annual samples compared to matching cohorts from populations*.
Discussion
In this paper, we described a sampling method which produced a representative sample of the US Medicare patients for a 10-year study period. This method produced annual samples that closely matched the populations in demographics and comorbidity distributions. The longitudinal cohorts defined using annual samples also closely resembled those defined using annual populations in the percentages of retained patients, demographics, and comorbidity rates in the last year of 10- and 5-year follow-up.
Our results show that the properly weighted sample and the population had almost identical age and sex and race distribution each year over the 10-year follow-up. Unlike a pure longitudinal sample for a retrospective cohort study, the sample for each year is a good representative sample that has virtually identical distribution of age, sex, race/ethnicity, and comorbid conditions to the population not just in the baseline year but also in all subsequent years.
We also showed that disease prevalence rates in the sample closely approximated the rates from the population; all differences were ≤ 0.12% of the population rates. The five of 210 comparisons (0.24%) that showed significant differences from the underlying population; this however is less than the alpha = 5% Type I error rate that would be expected from a perfectly representative sample. The samples also performed well in representing beneficiaries with uncommon conditions such as endometrial cancer. This suggests that the annual samples taken using our proposed method can be used to estimate rates of medical conditions in the population with reasonably high accuracy.
Retrospective cohorts defined using samples and populations were remarkably similar even after a long follow-up. Our data also suggest that retrospective cohorts can be defined in the middle of a study period and the resulting longitudinal sample and follow-up data will closely resemble those in the matching population.
A primary objective in this work was to document our sampling approach for future researchers who might be interested in obtaining representative samples of Medicare claims data. In preparing for this project, we found only limited literature describing longitudinal sampling designs that could serve as a reference. Smith et al. (11) offers a very high-level overview and describes the principles of sampling design for longitudinal surveys. Other articles address subsets of our challenge. For example, Wolinsky et al. (12) discusses matching Medicare claims to a longitudinally followed cohort without need for cross-sectional inference, while Thompson (13) and Carrillo and Karr (14) focus primarily on analytic approaches rather than design.
In constructing this sample, we found that it was relatively easy to produce a representative sample for the baseline year (2006), even with stratification and oversampling. Significantly more care was needed to identify the sampling frame for subsequent years. An advantage of working with Medicare data and with samples this large is that there is abundant power to identify potential problems before purchasing data.
The samples derived using our approach can be flexibly used for both longitudinal and cross-sectional analysis, trend analysis, and other studies that require more complex designs such as nested case-control designs or interrupted time-series designs. As an illustration, this sampling approach produced yearly samples of US Medicare beneficiaries with diabetes residing in the Diabetes Belt and surrounding counties that we used to assess trends in preventive care utilization, long-term outcomes, disparities, and associations between preventive care and diabetic complications in patients with diabetes. These goals required the sample to be valid both longitudinally and cross-sectionally. Because we took the population (e.g., all eligible beneficiaries) from small counties, these samples can provide as much power to make county-level comparisons as the population does.
This study is limited by the scope of Medicare claims data. In particular, this cohort only included patients ages 65 and up, and it excluded those patients enrolled in a Medicare HMO. In addition, Medicare only captures claims data, so we did not have access to full clinical records.
Conclusions
We demonstrated that a representative sample of Medicare beneficiaries can be carefully constructed to be used in cross-sectional as well as longitudinal analyses. This sampling method makes the data request much more affordable. The computer algorithms we created can be used by future researchers in drawing random representative samples from Medicare claims data.
Data availability statement
The data analyzed in this study is subject to the following licenses/restrictions: the data used in this study was obtained under a data use agreement with the US Centers for Medicare and Medicaid Services that restrict sharing of data. Requests to access these datasets should be directed to JL, jem4yb@virginia.edu.
Ethics statement
The studies involving humans were approved by the University of Virginia Institutional Review Board for Health Sciences Research. The studies were conducted in accordance with the local legislation and institutional requirements. Written informed consent for participation was not required from the participants or the participants' legal guardians/next of kin in accordance with the national legislation and institutional requirements.
Author contributions
TM: Conceptualization, Formal analysis, Methodology, Software, Validation, Visualization, Writing – original draft, Writing – review & editing. JL: Data curation, Funding acquisition, Project administration, Supervision, Writing – review & editing. SK: Formal analysis, Validation, Writing – review & editing. HK: Writing – review & editing. M-WS: Conceptualization, Data curation, Formal analysis, Funding acquisition, Methodology, Project administration, Supervision, Validation, Writing – original draft, Writing – review & editing.
Funding
The author(s) declare financial support was received for the research, authorship, and/or publication of this article. This study was funded by NIH/NIDDK grant number R01DK113295. M-WS is the guarantor of the work reported in this paper.
Conflict of interest
The authors declare that the research was conducted in the absence of any commercial or financial relationships that could be construed as a potential conflict of interest.
Publisher's note
All claims expressed in this article are solely those of the authors and do not necessarily represent those of their affiliated organizations, or those of the publisher, the editors and the reviewers. Any product that may be evaluated in this article, or claim that may be made by its manufacturer, is not guaranteed or endorsed by the publisher.
Author disclaimer
The content is solely the responsibility of the authors and does not necessarily represent the official views of the National Institutes of Health.
References
1. Fisher ES, Baron JA, Malenka DJ, Barrett J, Bubolz TA. Overcoming potential pitfalls in the use of medicare data for epidemiologic research. Am J Public Health. (1990) 80:1487–90. doi: 10.2105/AJPH.80.12.1487
2. Murphy M, Alavi K, Maykel J. Working with existing databases. Clin Colon Rectal Surg. (2013) 26:5–11. doi: 10.1055/s-0033-1333627
3. Lauderdale DS, Furner SE, Miles TP, Goldberg J. Epidemiologic uses of medicare data. Epidemiol Rev. (1993) 15:319–27. doi: 10.1093/oxfordjournals.epirev.a036123
4. Fung V, Brand RJ, Newhouse JP, Hsu J. Using medicare data for comparative effectiveness research: opportunities and challenges. Am J Manag Care. (2011) 17:488–96.
5. Brennan N, Oelschlaeger A, Cox C, Tavenner M. Leveraging the big-data revolution: CMS is expanding capabilities to spur health system transformation. Health Aff. (2014) 33:1195–202. doi: 10.1377/hlthaff.2014.0130
6. Warren JL, Klabunde CN, Schrag D, Bach PB, Riley GF. Overview of the SEER-medicare data: content, research applications, and generalizability to the United States elderly population. Med Care. (2002) 40(8 Suppl.):IV3–18. doi: 10.1097/00005650-200208001-00002
7. Enewold L, Parsons H, Zhao L, Bott D, Rivera DR, Barrett MJ, et al. Updated overview of the SEER-medicare data: enhanced content and applications. J Natl Cancer Inst Monogr. (2020) 2020:3–13. doi: 10.1093/jncimonographs/lgz029
8. Barker LE, Kirtland KA, Gregg EW, Geiss LS, Thompson TJ. Geographic distribution of diagnosed diabetes in the US: a diabetes belt. Am J Prev Med. (2011) 40:434–9. doi: 10.1016/j.amepre.2010.12.019
10. Wolter KM. Introduction to Variance Estimation. 2nd ed. New York, NY: Springer Science + Business Media (2007). p. xiv, 447.
11. Smith P, Lynn P, Elliot D. Sample design for longitudinal surveys. In:Lynn P, editor. Methodology of Longitudianl Surveys. West Sussex: John Wiley & Sons (2009).
12. Wolinsky FD, Jones MP, Ullrich F, Lou Y, Wehby GL. The concordance of survey reports and Medicare claims in a nationally representative longitudinal cohort of older adults. Med Care May. (2014) 52:462–8. doi: 10.1097/MLR.0000000000000120
13. Thompson M. Using longitudinal complex survey data. Ann Rev Stat Appl. (2015) 2:305–20. doi: 10.1146/annurev-statistics-010814-020403
Appendix
Example sample construction and weight calculation
As an example of how the initial and fill-in samples were constructed, consider a hypothetical county with 2006 population of 1,600 white and 400 minority eligible Medicare patients with diabetes and a target sampling rate of 50% (see Construction of first year's sample). Initially, 250 samples are allocated to the white population and 250 to the minority, leaving 500 additional samples to be allocated across 1500 remaining patients. Ten percent (150) of the remaining patients are minority, so we would target the remaining sample to be 17.2% minority (26 patients). Therefore, the 2006 sample would contain 276 minority patients and 724 white patients, and the sampling weights for the minority patients will be 1.45 and the sampling weights for white patients would be 2.21.
In 2007, imagine that of the 2006 sample, 615 white and 235 minority patients remained enrolled in Medicare and living in county in 2007. These 850 patients would be retained for 2007 with their 2006 sampling weights. The 150 sampled patients who were lost would be replaced from newly eligible Medicare enrollees. Imagine that there were 300 newly eligible enrollees in our county in 2007, 260 white and 40 minority. We would immediately allocate 10 samples to the white stratum and 10 to the minority. For the remaining 130 samples, we target 18.2% minority (51) patients, but since only 40 minority patients are available, the 2007 fill-in sample will be 40 minority patients each with sampling weight 1, and 110 white patients each with sampling weight 2.36.
Samples in years 2008 and on would be constructed similarly to the 2007 sample. An R program for selecting samples and computing weights is available on request.
Keywords: diabetes, Medicare claims, sample, longitudinal analysis, cross-sectional design
Citation: McMurry TL, Lobo JM, Kim S, Kang H and Sohn M-W (2024) A sampling strategy for longitudinal and cross-sectional analyses using a large national claims database. Front. Public Health 12:1257163. doi: 10.3389/fpubh.2024.1257163
Received: 13 July 2023; Accepted: 08 January 2024;
Published: 01 February 2024.
Edited by:
Robert White, NewYork-Presbyterian, United StatesReviewed by:
William Augustine Toscano, University of Minnesota Twin Cities, United StatesGuillaume Chauvet, National School of Statistics and Information Analysis, France
Copyright © 2024 McMurry, Lobo, Kim, Kang and Sohn. This is an open-access article distributed under the terms of the Creative Commons Attribution License (CC BY). The use, distribution or reproduction in other forums is permitted, provided the original author(s) and the copyright owner(s) are credited and that the original publication in this journal is cited, in accordance with accepted academic practice. No use, distribution or reproduction is permitted which does not comply with these terms.
*Correspondence: Min-Woong Sohn, min-woong.sohn@uky.edu