 Tristan Stampfler
 Mohamed Elgendi
 Richard Ribon Fletcher
 Carlo Menon
- 1Biomedical and Mobile Health Technology Lab, Department of Health Sciences and Technology, ETH Zurich, Zurich, Switzerland
- 2Mobile Technology Group, Department of Mechanical Engineering, Massachusetts Institute of Technology (MIT), Cambridge, MA, United States
- 3Department of Psychiatry, Massachusetts General Hospital, Boston, MA, United States
The emerging field of digital phenotyping leverages the numerous sensors embedded in a smartphone to better understand its user's current psychological state and behavior, enabling improved health support systems for patients. As part of this work, a common task is to use the smartphone accelerometer to automatically recognize or classify the behavior of the user, known as human activity recognition (HAR). In this article, we present a deep learning method using the Resnet architecture to implement HAR using the popular UniMiB-SHAR public dataset, containing 11,771 measurement segments from 30 users ranging in age between 18 and 60 years. We present a unified deep learning approach based on a Resnet architecture that consistently exceeds the state-of-the-art accuracy and F1-score across all classification tasks and evaluation methods mentioned in the literature. The most notable increase we disclose regards the leave-one-subject-out evaluation, known as the most rigorous evaluation method, where we push the state-of-the-art accuracy from 78.24 to 80.09% and the F1-score from 78.40 to 79.36%. For such results, we resorted to deep learning techniques, such as hyper-parameter tuning, label smoothing, and dropout, which helped regularize the Resnet training and reduced overfitting. We discuss how our approach could easily be adapted to perform HAR in real-time and discuss future research directions.
Introduction
Human activity recognition (HAR) is an emerging field in health research that seeks to better understand human movements and behaviors (1). Researchers are increasingly working on HAR systems to translate measurements from wearable devices and smartphones into physical activity (2, 3). Analyzing data collected via the HAR systems remain challenging (4, 5). Moreover, understanding and modeling HAR data across different situations are needed for more personalized and effective interventions to improve health and wellbeing (6).
Digital phenotyping is defined as the moment-by-moment quantification of the individual-level human phenotype in situ using data from personal digital devices (7). Smartphones have become the device of choice for conducting digital phenotyping (6), as they have become a growing trend concerning the adoption rate over the last decade, even among senior adults (8). Beyond the pervasiveness of the smartphone, it has also improved many dimensions that make digital phenotyping with it increasingly convenient, notably its quantity and diversity of sensors, its sensor accuracy, its connectivity, its computing power, and its memory.
Studies have determined that users have their smartphones on them on average 36% of the daytime, a rate that increases when considering movement phases (9). Thus, the smartphone can easily transform into a convenient monitoring tool whose usage can be used in the form of apps covering several areas, such as mental health (9), regular health (10), or even fitness (11). The review by Straczkiewicz et al. (2) on HAR underlines the importance of finding a method that has the potential to generalize well, for example, from subjects in the laboratory to a free-living setting. It was also pointed out that HAR research should use make a more systemic use of publicly available dataset to benchmark their HAR recognition approach, a hint that we chose to follow for our study.
Some research also follows a multi-sensor approach for HAR, where the outputs of multiple sensors are conjointly analyzed to classify an activity (12). While this approach is likely to offer, in theory, a better performance perspective, it needs to be more practical. We will focus on a dataset employing the smartphone exclusively as a sensor.
In parallel, machine learning has greatly evolved during the last decade regarding performance and accessibility. Digital phenotyping revolves around types of tasks that machine learning is particularly well suited to tackle in a systematic way, such as regression or classification. In terms of time-series analysis, the focus of this article, deep learning architectures have replaced the paradigm of handcrafted feature engineering. Different families of neural net architectures such as CNN and RNN have been shown to outperform classical methods on benchmarks of more than 128 time-series datasets (13). As neural nets have evolved to deeper and more complex architectures, new architectures, such as Resnet, have emerged that incorporate features such as connecting non-contiguous activation layers, to address numerical problems such as vanishing or exploding gradient calculations. Therefore, we sought to optimize Resnet for HAR using data from a smartphone's accelerometer.
Developing robust models for HAR is challenging, and here, we attempt to optimize the development of these models. In this study, we will explore the use of deep learning for HAR and how it can be brought to improve state-of-the-art results. We will additionally discuss the challenges and limitations of our approach. The essential steps to conducting a deep learning-based HAR system will be addressed to pave the future development of this field.
Method
We present below a description of the data and the deep learning architecture used for this research.
Dataset choice
We chose to work with the UniMiB-SHAR dataset (14), whose data were collected in 2016. A prompt comparison with other popular datasets for human activity recognition from the literature is found in Table 1. Our main motivations for choosing the UniMiB-SHAR dataset are the following:
Popularity: It has over 300 citations, which indicates its intrinsic quality and provides a good opportunity to benchmark our results.
Subjects: It has a relatively high number of subjects and includes older people.
Data quantity: It contains 11,771 segments of both human activity and falls, covering nine classes of cleaned activity of daily living and eight classes of falls in total.
Data quality: It provides pre-processed data that are formatted, cleaned, and labeled.
Availability: It is publicly available and downloadable directly from the following website: http://www.sal.disco.unimib.it/technologies/unimib-shar/.
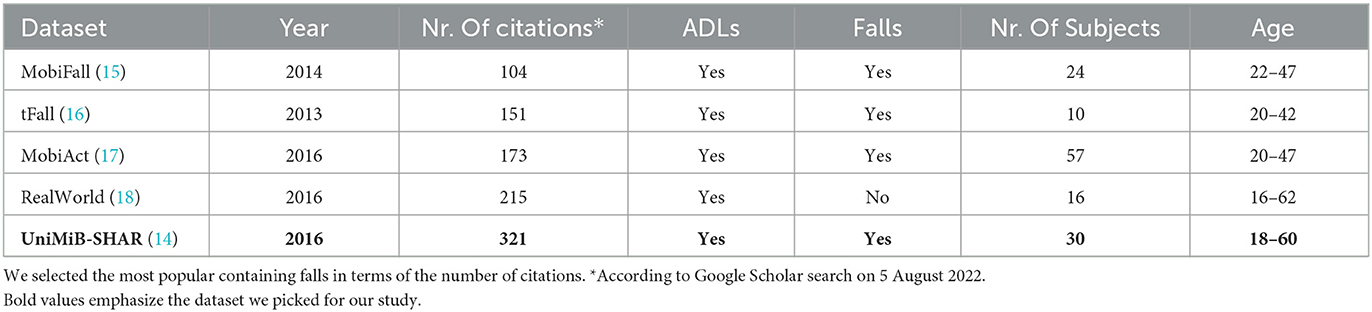
Table 1. Most popular datasets for human activity recognition and fall detection with accelerometer data.
This dataset was built from scratch by researchers from the University of Milano Bicocca. They asked volunteers to place a smartphone in their pant pockets and to perform a series of activities and falls according to the protocol they established. Experiments were supervised by the researchers, and a queen-sized mattress was laid on the ground to prevent volunteers from injuring themselves by falling. Elders were excluded from falling activities due to safety concerns.
The recording device was a Samsung Galaxy Nexus I9250 with Android Version 5.1.1 equipped with a Bosh BMA220 acceleration sensor. The Android OS limits the acceleration range, and the sampling rate is capped at 50 Hz. The smartphone was alternatively placed in the front right and front left pant pockets.
Data segmentation
Once time series were recorded, the researchers extracted the 3-s time windows from them to create segments for each activity or fall type. The rule followed was to search for a peak of 1.5 g in the data and to center a time window when one was found. If several consecutive values were above 1.5 g, the time window was centered on the first one. Notably, such preprocessing has one consequence to consider for the rest of the study: data leakage. Indeed, different segments can partially overlap and share common timestamps, which can lead to data leakage between the training and test sets. This point has been overlooked by all studies that have not performed leave-one-subject-out to assess the results.
We first introduced the data from the UniMiB-SHAR dataset in Figure 1 with a plot of a few segments from the dataset. The acceleration value was plotted against the time (total duration of 3 s) and varied based on the movements of the phone carrier. The segments are centered on a maximum acceleration. One can already notice significant differences in patterns between ADLs and falls.
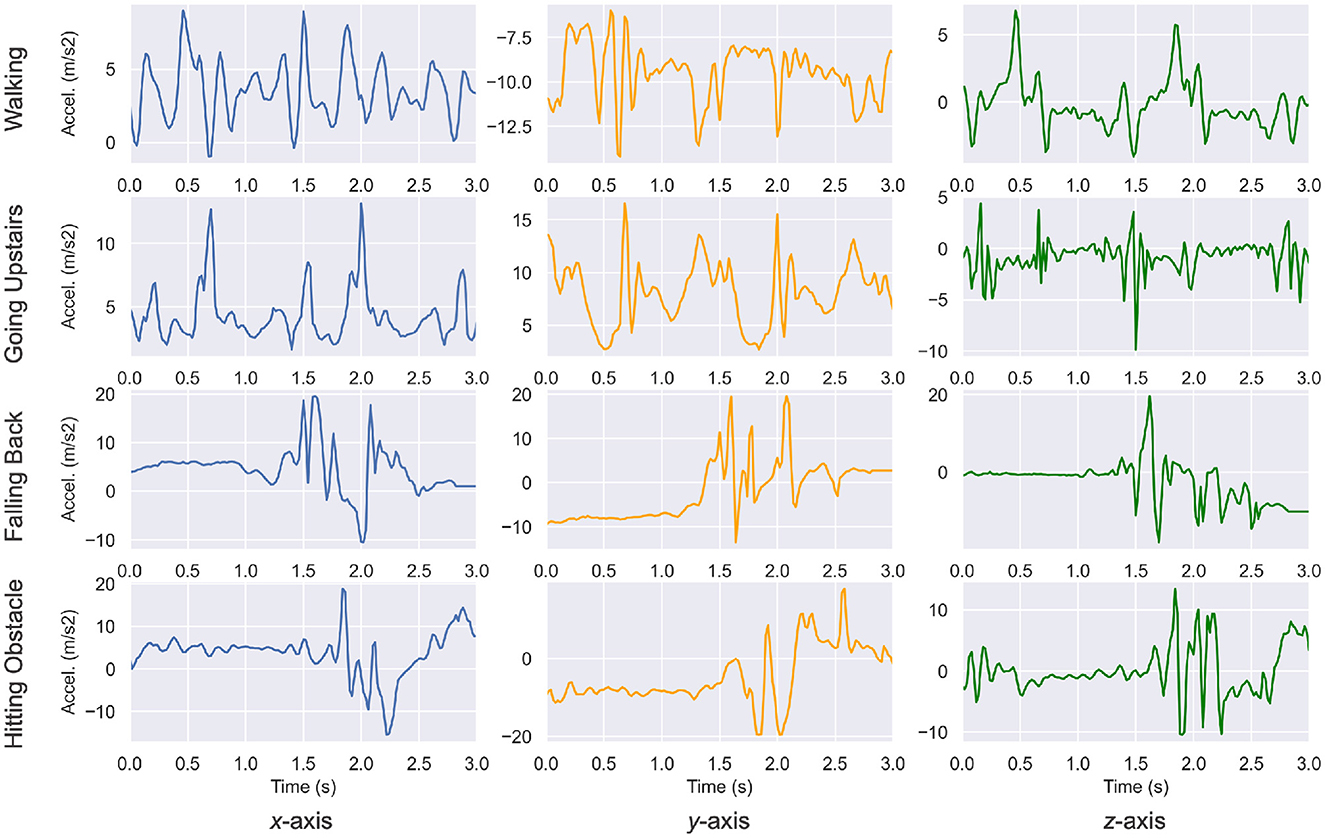
Figure 1. Acceleration segments from the UniMiB-SHAR dataset (14). Patterns and amplitudes variations are significantly different across various activities. For example, the walking activity features low amplitude and periodic patterns, whereas the falling back activity features a sudden burst of acceleration.
Subsequently, we counted the number of segments for the nine classes of activities of daily living (ADLs) and eight classes of falls on two separate plots. Figure 2 shows how many segments from each ADL were in the dataset and how many ADL segments corresponded to each subject. We noticed a strong class imbalance. Cumbersome activities have fewer segments than the easiest ones, such as walking or running. Such imbalance will be addressed later by our choice of evaluation method. Figure 3 depicts how many segments from each fall type are in the dataset and how many fall segments correspond to each subject. There is only a minor class imbalance in the case of falls here. To cross-check whether each subject performed enough of each activity, we can dive one level of granularity deeper and plot the count of each ADL and fall per subject. Figure 4 demonstrates this distribution using a heat map. Beyond some strong class imbalances, we also notice that subjects 4, 7, 8, 10, 12, 18, 26, 27, 28, and 30 are missing at least one type of ADL or fall. We again noticed that walking and running were the activities with the most segments in the dataset.
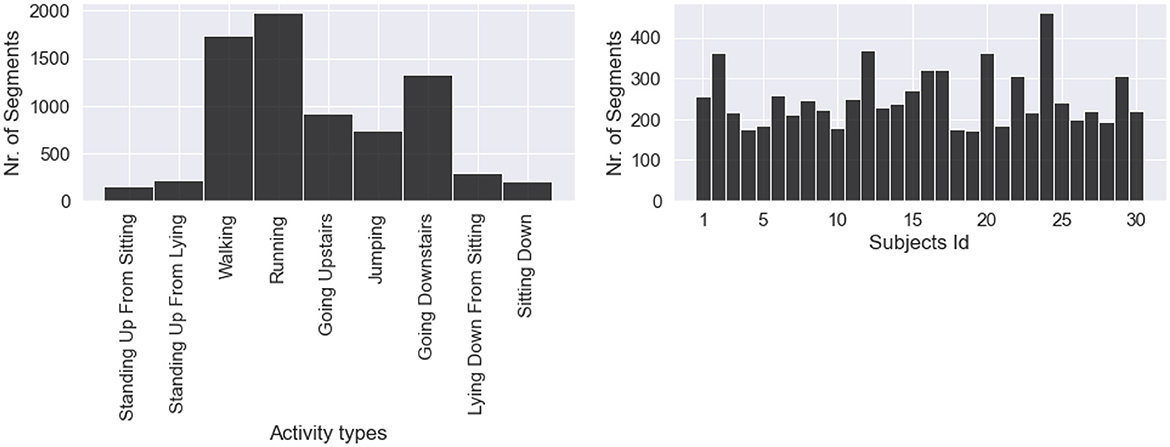
Figure 2. Distribution of daily living activities, with a strong class imbalance. Daily activities that are less cumbersome to perform are predominant (walking, running, going up, and downstairs).
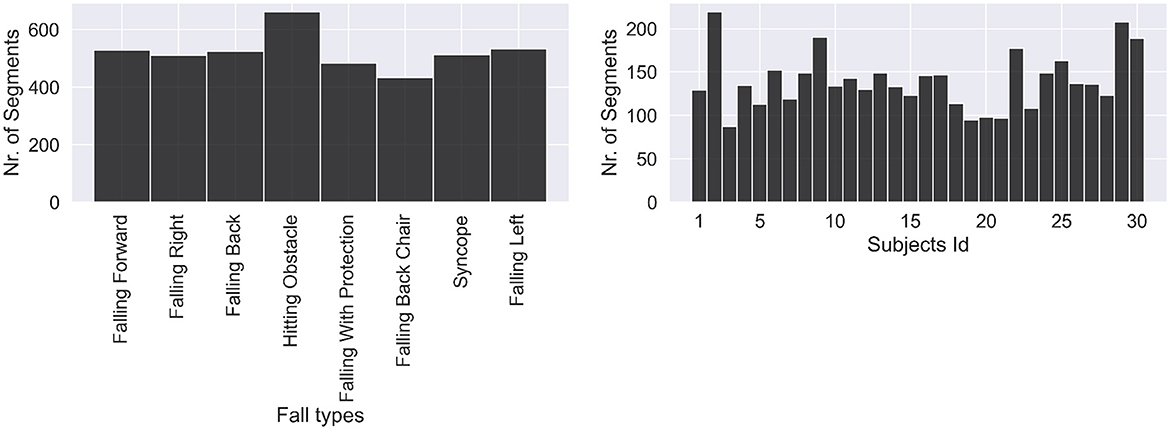
Figure 3. Distribution of fall activities. Classes are fairly balanced as all falls are about equivalent to perform.
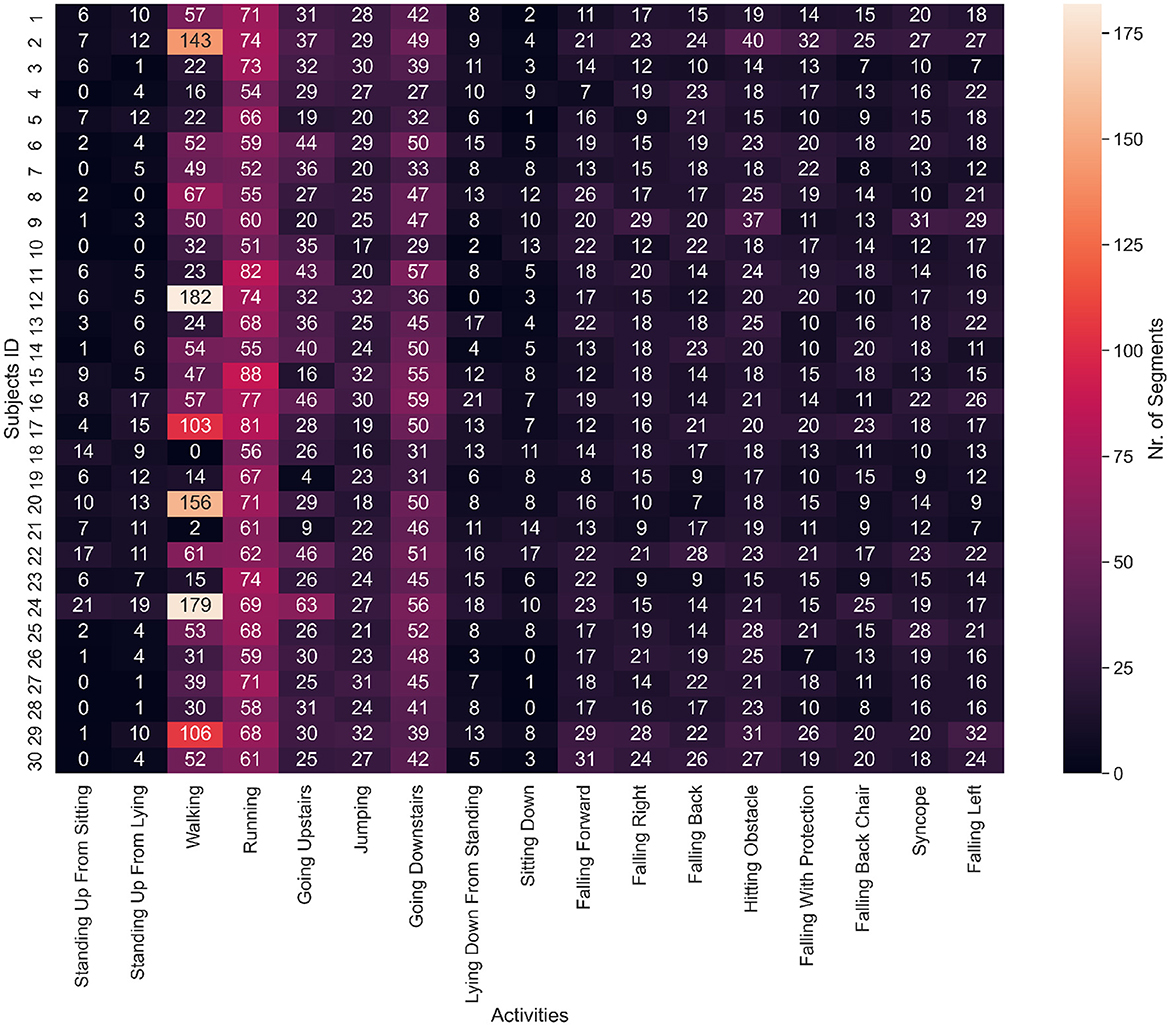
Figure 4. Heat map of the number of segments for each ADL or fall and subject. Subjects 4, 7, 8, 10, 12, 18, 26, 27, 28, and 30 are missing at least one type of ADL or fall. Walking, running and going downstairs are clearly the predominant activities by the number of segments.
Statistical analysis
Since segments are in the form of time-series data, we can conduct a statistical analysis to better grasp the differences between the ADLs and the fall groups. The core insight is that the maximum acceleration (i.e., the maximum magnitude value that can be found in a 3-s segment) tends to be higher for falls, especially on the x-axis and z-axis. We illustrate this with a boxplot of these maximum values for the whole dataset in Figure 5. Notably, because of the Android recording limitations, acceleration recordings are capped at 2 g, while some values could have been higher. The means of the three maximum distributions are rigorously compared with a t-test (19) in Table 2, which confirms falls that have higher accelerations.
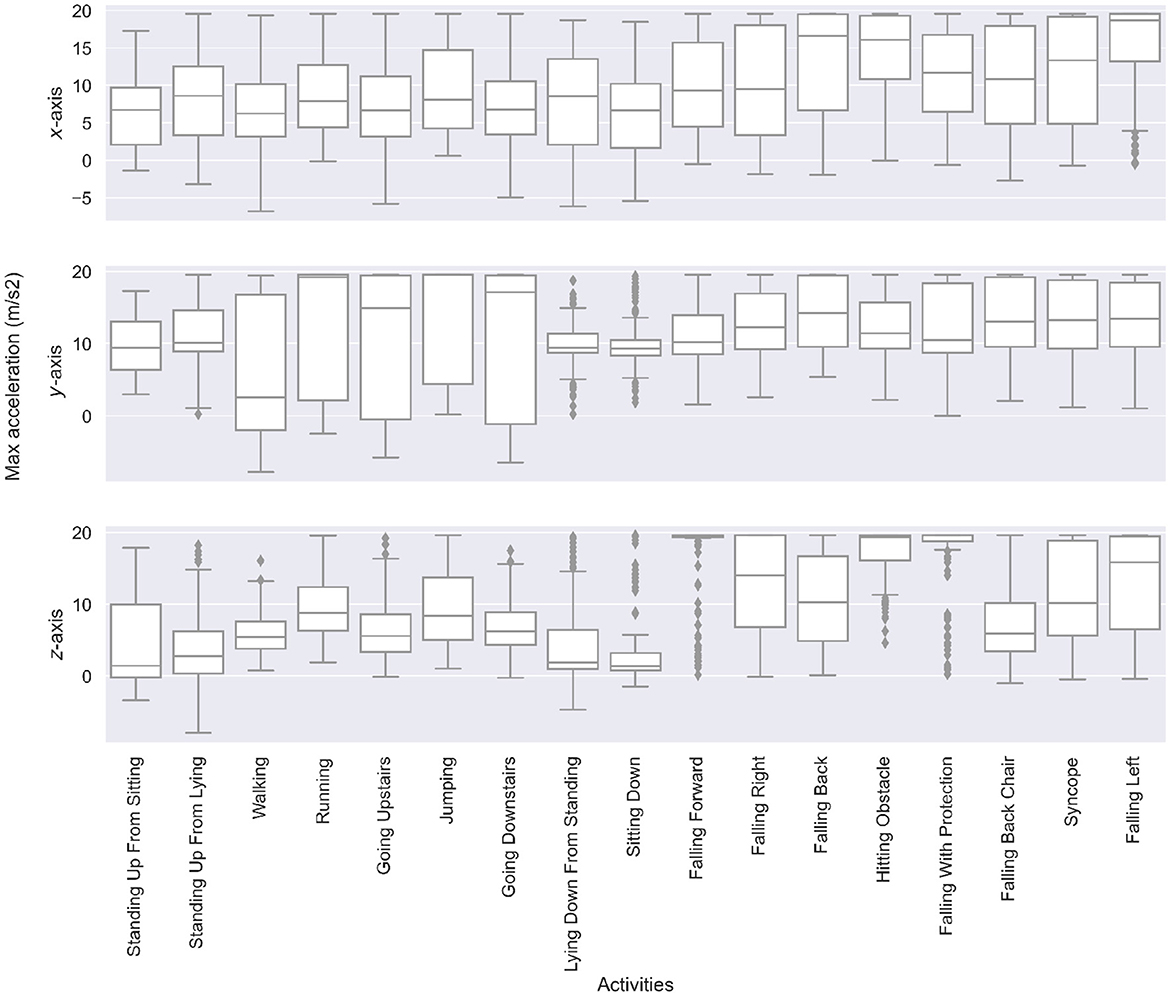
Figure 5. Boxplots of the maximum acceleration value along the x-, y-, and z-axis for each type of ADL and falls. Falls have significantly higher maximum accelerations than ADLs. Moreover, the direction of the fall is reflected in the differences of x-, y-, and z-axis accelerations.
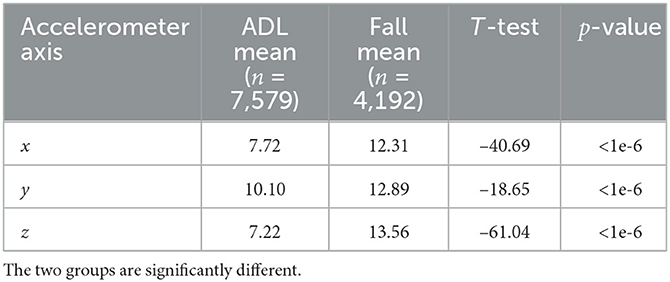
Table 2. t-test of the means of maximum acceleration values for ADLs and falls, split by axis.
Leveraging these distinctions is not sufficient to build a classification algorithm. Some ADL segments may still have high maximum acceleration values; similarly, some fall segments may still have low maximum acceleration values. This is enough to rule out a classification approach entirely based on thresholds despite such an approach being present in the literature, as seen in the literature review.
Deep learning Architecture
We leverage deep learning to tackle this complex classification task. Deep neural networks have demonstrated remarkable performance across various datasets, such as image datasets. One family of deep networks, known as Resnets (20), often achieves state-of-the-art results on benchmark datasets. They enable better backpropagation in deeper architectures using skip connection over Resnet blocks. Ismail Fawaz et al. (13) have investigated a wide range of deep learning architectures for time-series classification, and they have proven that a Resnet would deliver the best results in most cases. After using a CNN, a Resnet, an encoder, and hybrid architectures, we chose a Resnet as our classifier for fall detection (binary classification) or human activity recognition (17 classes classification). The network architecture is shown in Figure 6, and it was originally published by Ismail Fawaz et al. (13). It differs from previously published Resnet architectures (21–23) benchmarked on the UniMiB-SHAR dataset in two main points: (i) Skip connections implement Conv1D operations (instead of a simple addition) to expand the number of channels and (ii) the kernels analyze more timestamps at once as we made them bigger (we use kernel of sizes 8 and 7 instead of the usual sizes 5 and 3). We call our approach optimized Resnet due to these changes and the further optimizations we introduced, which are detailed in the Discussion Section.
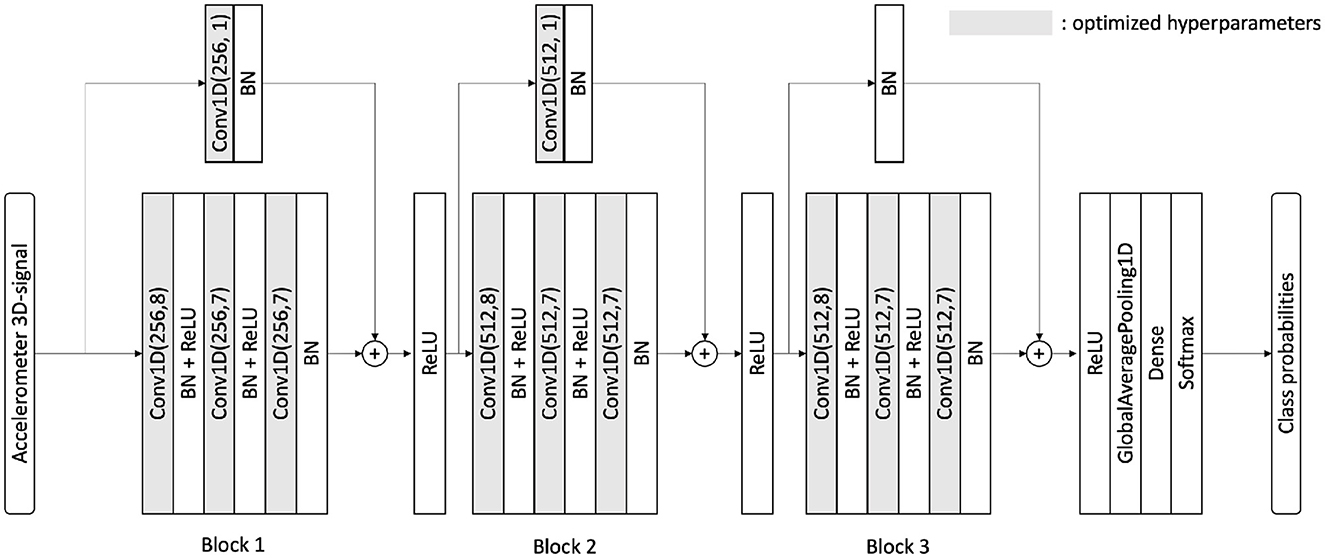
Figure 6. Neural architecture for our optimized Resnet. This is similar to both binary and multi-class classifications. The number of filters and the kernel sizes are different from the original architecture from Ismail Fawaz et al. (13). BN, batch-normalization; Conv1D, convolution 1D; ReLU, rectified linear unit; Conv1D(F, K), conv 1D with F filters and kernel size K.
Training and evaluation procedure
We leverage cloud computing on the Google Cloud platform to train our models. We created a notebook on the AI platform, running on the following software and hardware environment:
• Tensorflow Environment: Tensorflow 2.8
• Machine Type: 8 vCPUs, 30 GB RAM
• GPU: One NVIDIA Tesla T4
Several factors justify the need for cloud computing on a GPU for this task. From a deep learning perspective, the depth of the network, the use of dropouts, the number of segments (11,771), and the number of epochs (120) lead to high training time. From an evaluation perspective, cross-validation, and especially leave-one-subject-out (LOO), is time expensive, as the network may need to be retrained up to 30 times. Overall, the training and evaluation for each method can range from an hour to 2 days in the LOO case.
Results
We now expose evaluation methods used and results and show our approach exceeds the current state of the art.
Evaluation of binary and multi-class classifications
Binary classification
The binary classification is straightforward to explain; the network attempts to classify segments into two categories: ADL (0) and falls (1), while disregarding the activity or fall type. Obtaining high accuracy here is less challenging than in multi-class classification because there are only two possible output classes. As is often the case in the literature (as seen in the literature review) regarding human activity recognition, rather high figures can be achieved for the metrics presented. Our results are presented against various possible evaluation metrics in Table 3. The metrics are defined below for binary classification:
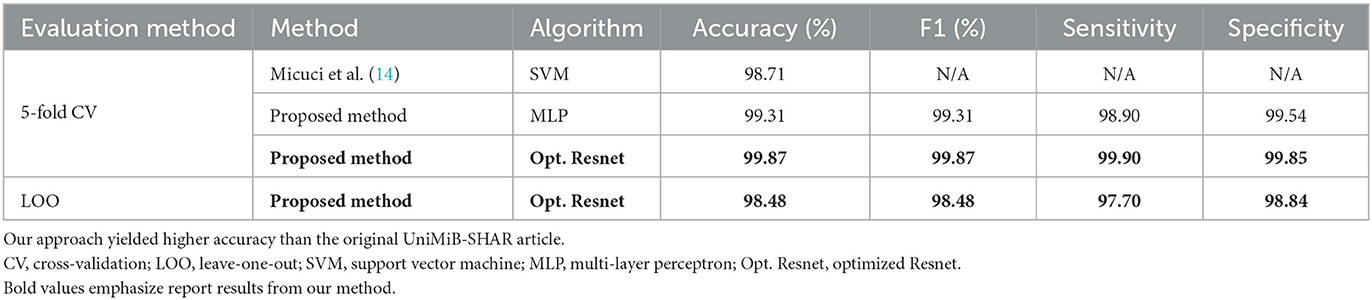
Table 3. Benchmark for binary classification of ADLs and falls.
We write m the total number of segments. We use the following notations: True positive (TP): A fall is correctly classified as a fall. True negative (TN): A non-fall activity is correctly classified as a non-fall activity. False positive (FP): A non-fall activity is incorrectly classified as a fall. False negative (FN): A fall is incorrectly classified as a non-fall activity.
We benchmark our approach against the results from Micuci et al. in the original article with the UniMiB-SHAR dataset. For further reference, we share metrics obtained for leave-one-subject-out (LOO). The implementation difference between cross-validation and LOO is that, in cross-validation, segments are randomly assigned between the train and validation set whereas in the LOO case, we ensure additionally that the train and validation sets of subjects (each subject has several recorded segments) are rigorously disjoint. In short, in LOO, the validation set is exclusively made of segments whose subjects were not in the train set. Thus, the LOO evaluation setting better represents the generalization potential of the algorithm as it faces entirely new data from entirely new subjects in the validation set.
However, these results should still be taken with a grain of salt. Indeed, a specificity that is not 100% will lead to the detection of false positives. For instance, in a case in which someone never falls, one false alarm will be triggered every 100 analyses. This rate can be computed simply by rewriting the formula that gives the sensitivity in the case of only negative segments, whereas in this case, m = TN+FP:
Multi-class classification
We move to the case where we do not have two but 17 classes to classify. There are nine types of activities of daily living and eight types of falls. Classifying that many classes is more challenging and introduces more discrepancies into the literature. Near-perfect results of over 99% are far more challenging to attain, especially with the most rigorous evaluation methods. We use the two most common metrics that can be found in the literature, that is, accuracy and the weighted F1-score, which are defined later. We use the following notation: correctly classified (CC): The segment has been classified in its correct class. weight of class i (wi): Proportion of segments labeled i in the dataset. F1-score of class i (F1-scorei): F1-score considering class i as positive and the rest as negative.
We benchmark our results to compare approaches in Table 4 for the UniMiB-SHAR dataset. We structure and regroup the results from the literature based on their evaluation methods and compare them with our results. We found our approach to be state of the art in all cases.
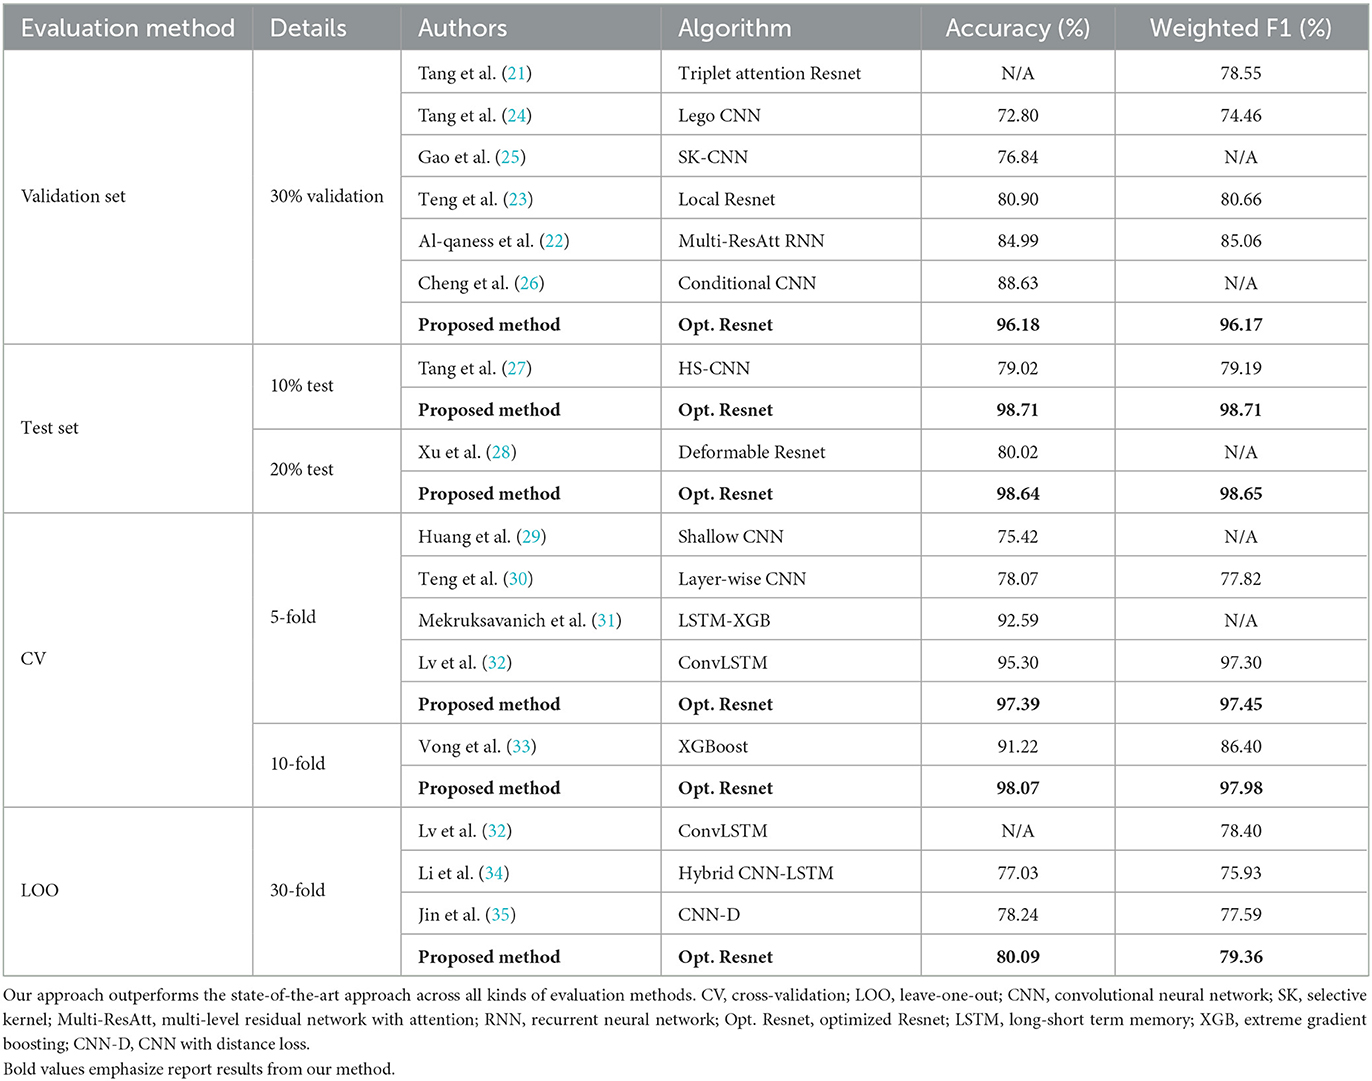
Table 4. Benchmark of multi-class classification on the UniMiB-SHAR dataset.
Discussion
We discuss here the key differences and improvements our approach brings compared with other approaches from our benchmark. We eventually underline some machine-learning-related limitations.
Optimization and deployability of deep learning
We started from the base Resnet architecture of Ismail Fawaz et al. (13), which is available at the following GitHub repository: dl-4-tsc. We only considered the architecture and did not perform in any kind of transfer learning. Subsequently, we conducted a series of hyperparameter optimizations, which are summarized in Table 5. A simple ablation study to show the contributions of the different techniques used is given in Table 6, for the case of leave-one-subject-out as this is the most challenging case to regularize. For optimizations regarding the network, we mostly increased the number of parameters of the filters and the kernels from 581,698 parameters for the standard Resnet to 11,567,362 parameters for our optimized Resnet. This mostly made training and evaluation time rise (the 30-fold cross-validation took approximately 36 h to complete). However, despite 11 million parameters being seemingly daunting for deployment purposes, our model could still be successfully run live with no prediction delays when we deployed it on a Samsung Galaxy A22 5G smartphone running Android 11. For optimizations regarding training, we found increasing the number of epochs necessary due to the higher number of parameters, and we could partially compensate for the training time by increasing the batch size (i.e., the number of segments given simultaneously to the network during the training phase). Smoothing labels is a common trick to boost deep learning network performance. The idea is to change the one-hot vector class representation to a probabilistic representation where other classes have small yet non-zero probabilities. Consequently, the following has been demonstrated:
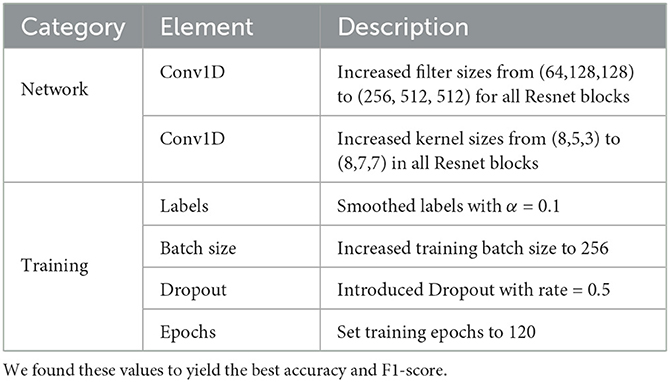
Table 5. Our hyperparameters tuning of the proposed optimized Resnet network.
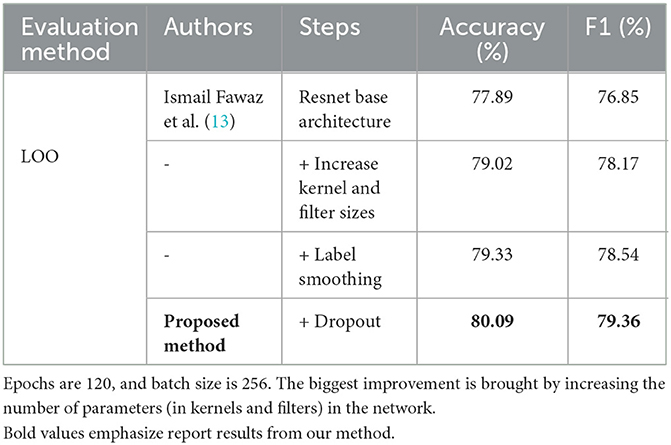
Table 6. Simple ablation study on multi-class classification with LOO evaluation for the optimized Resnet.
Label smoothing influences representations learned by the penultimate layer of the network and encourages representations of training examples from the same class for grouping in tight clusters (36). This results in the network's enhanced ability to distinguish classes. The principle for label smoothing is to change the encoding of classes from one-hot vectors to smooth vectors (36). Smoothing can be seen as a function fα, with smoothing parameter α, that for a one-hot vector vk: = (δi, k)i representing class k (among K possible classes) returns , the α-smoothed vector. In our case, we found the case α = 0.1 to yield the best results.
Dropout is an another common supervised deep learning trick that prevents the network from overfitting (37). Randomly dropping activation units during the training phase forces the network to not be overreliant on only a few of them and makes it more robust. We found it very useful in our case; accuracy on the training set was always near 100% at the end of the training but much lower on the validation set.
Related work from benchmark
Our benchmark regroups head-to-head 17 articles (21–35) by sharing their approach concerning the human activity recognition task evaluated on the UniMiB-SHAR dataset. Deep learning was the method of choice in almost every case (21–26, 28–32, 34, 35) to try to achieve state-of-the-art results. Only Vong et al. (33) employed a more standard machine learning and feature engineering approach. When choosing deep learning, the focus of studies was split into two parts. First, the developed classification method should achieve the highest accuracy or F1-score known to the authors. Second, some authors mentioned that their deep learning architecture should be kept reasonable in terms of memory consumption and computation time (23, 24, 26, 29, 30). This is only logical from an operational perspective, as the final goal of the algorithm is to be embedded into a portable device and to run live, which some studies have tested with their solutions (21, 26, 28, 29).
The question of feature representation in the case of human activity recognition was also raised as is often the case in deep learning studies. Li et al. argued that their hybrid CNN-LSTM allowed the extraction of both long- and short-term dependencies in the data (34). Tang et al. and Al-qaness et al. both leveraged attention mechanisms in their network (21, 22), and Lv et al. designed a module to specifically maximize information through the network by adding connections (32). Kernels and filters are hyperparameters found in CNN or LSTM architectures and are particularly appropriate for analyzing time-series data. Filters were the focus of a dimensional optimization by Tang et al. (24) and Gao et al. (25) introduced a selective kernel mechanism for convolutions.
Beyond architecture and operations, training loss was researched, and a clear trend toward building local losses and layer-wise training appeared in three selected studies (23, 24, 30). The creation of a clustering loss, the class anchor clustering (CAC) loss, was published in Jin et al. (35)
Finally, despite the UniMiB-SHAR dataset being seen as a benchmark dataset by all of the aforementioned studies, discrepancies remain between evaluation methods. This means that the results and metrics reported by one study cannot always be rigorously compared with all the others, as they must use the same evaluation methods. The evaluation methods featured in these articles are as follows: the evaluation of a validation set (21–26), the evaluation of a test set (27, 28), cross-validation (29–32), and leave-one-subject-out (32, 34, 35).
Hyperparameters and performance
The benchmark from Table 4 shows that no a priori performance ranking of the various algorithms could be made solely based on the type of neural network architecture. Despite our optimized Resnet coming always first, the second best option (where more than three are present) is dependent on the case either based around a CNN architecture (26, 35) or a hybrid-LSTM architecture (32).
This reinforces the claim that hyperparameter search, beyond neural architecture, is key to tune a network specifically to a given dataset and make it reach its best performance. Such hyperparameter studies have systematically been in the focus of top performers (26, 32, 35). They all conducted ablation studies, did trial and errors, or followed best practices from the literature to tune optimally their respective chosen architectures. Cheng et al. found similar results in that regard than our study, that is adding complexity to the network, such as by increasing kernel sizes, leads to higher accuracy and F1-score (26). Lv et al. studied as well as influence of the kernel sizes, the number of layers, and possible fusion modes of outputs of analyzing modules of their hybrid network (32). Jin et al. research mostly focused on designing a custom loss for HAR, the anchor-based loss function that has two loss components balanced by a simple scalar hyperparameter λ that has been investigated and optimized (35).
Continuous time classification
Thus far, we have built a classification method based on pre-formatted segments that displays good performance with this framework. We would like to provide perspectives on how a deep learning classifier can be adapted to analyze accelerometer signals in continuous time. We describe the steps of our proposal in Figure 7. This step must be iterated with the desired frequency for real-time analysis. Significantly, the proper implementation of this live analysis could already be tested only with the dataset. All that needs to be done is to concatenate segments of activities beside each other to gain a longer time series featuring multiple activities. For the concatenation to go smoothly and not have abrupt changes, we ensure that distances between the last x, y, and z values of the acceleration of the current time series are near the first ones of the next time series.
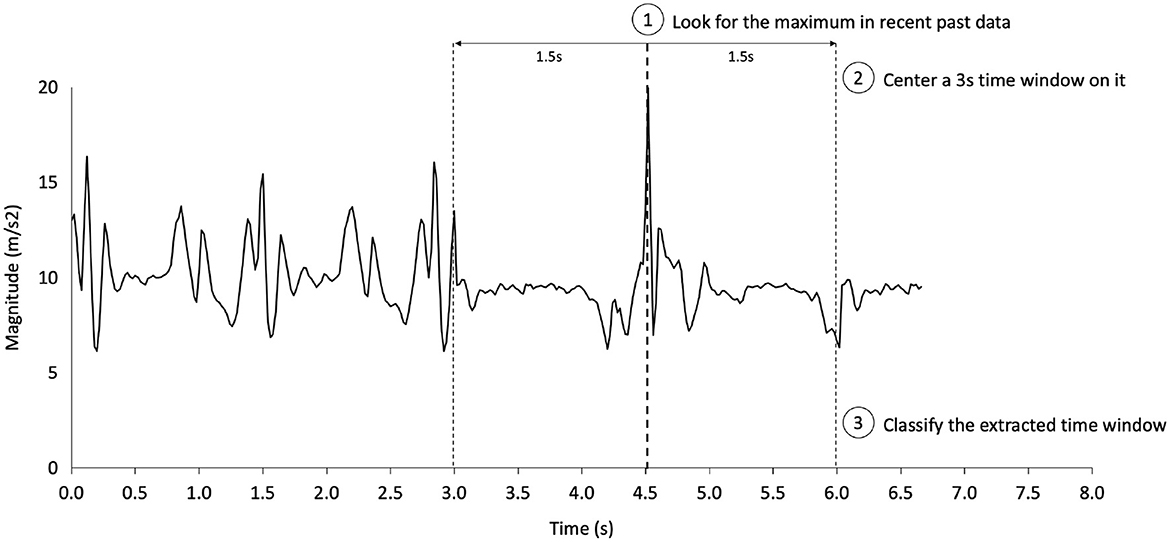
Figure 7. One-step in our proposal for real-time fall detection. This step can then be re-executed at the desired frequency, up to the smartphone's computing power limitations.
Limitations
Using machine learning for human activity recognition brings up several limitations. First, there is potential for bias in the training data. If the data used to train the model are not representative of the diverse range of activities and individuals, the model may lack robustness and generalizability. A second limitation is a dependence on the quality of the sensors and processing used for recognition. Factors such as noise, sensor placement, and data resolution can all impact the model's accuracy. The third limitation is the computing resources requirement, which corresponds to a machine learning model, to be trained and run effectively. Finally, a fourth limitation revolves around ethical consideration, where privacy, fairness, and transparency should be as carefully considered as performance when deploying such systems running on personal data. In addressing these limitations, it is also important to consider the power consumption implications of using the internal sensors and also processing the data.
Conclusion
Our research has highlighted the main steps in conceptualizing a deep learning-based human activity recognition classifier. We showed that our optimized Resnet was remarkably fit for this task and that deep learning best practices such as dropout and label smoothing worked well to improve accuracy and the F1-score for fall detection. Our approach raised the state-of-the-art accuracy to 80.09% on the UniMiB-SHAR dataset using the rigorous leave-one-subject-out evaluation method. However, there are still challenges to be addressed on a more global scale, such as collecting data via different types of smartphones and diverse populations to reduce bias and increase generalizability.
Data availability statement
The original contributions presented in the study are included in the article/supplementary material, further inquiries can be directed to the corresponding authors.
Author contributions
ME designed and led the study. TS, ME, RF, and CM conceived the study. All authors approved the final manuscript.
Funding
Open access funding provided by the ETH Zurich.
Conflict of interest
The authors declare that the research was conducted in the absence of any commercial or financial relationships that could be construed as a potential conflict of interest.
Publisher's note
All claims expressed in this article are solely those of the authors and do not necessarily represent those of their affiliated organizations, or those of the publisher, the editors and the reviewers. Any product that may be evaluated in this article, or claim that may be made by its manufacturer, is not guaranteed or endorsed by the publisher.
References
1. Stampfler T, Elgendi M, Fletcher RR, Menon C. Fall detection using accelerometer-based smartphones: where do we go from here? Front Public Health. (2022) 10:996021. doi: 10.3389/fpubh.2022.996021
2. Straczkiewicz M, James P, Onnela JP. A systematic review of smartphone-based human activity recognition methods for health research. NPJ Digit Med. (2021) 4:1–15. doi: 10.1038/s41746-021-00514-4
3. Zhang S, Li Y, Zhang S, Shahabi F, Xia S, Deng Y, et al. Deep learning in human activity recognition with wearable sensors: a review on advances. Sensors. (2022) 22:1476. doi: 10.3390/s22041476
4. Melissa R, Lama M, Laurence K, Sylvie B, Jeanne D, Odile V, et al. Physical activity in eating disorders: a systematic review. Nutrients. (2020) 12:183. doi: 10.3390/nu12010183
5. Usman Sarwar M, Rehman Javed A, Kulsoom F, Khan S, Tariq U, Kashif Bashir A. Parciv: recognizing physical activities having complex interclass variations using semantic data of smartphone. Software: Pract Exp. (2021) 51:532–49. doi: 10.1002/spe.2846
6. Javed AR, Faheem R, Asim M, Baker T, Beg MO. A smartphone sensors-based personalized human activity recognition system for sustainable smart cities. Sustain Cities Soc. (2021) 71:102970. doi: 10.1016/j.scs.2021.102970
7. Torous J, Kiang MV, Lorme J, Onnela JP, et al. New tools for new research in psychiatry: a scalable and customizable platform to empower data driven smartphone research. JMIR Mental Health. (2016) 3:e5165. doi: 10.2196/mental.5165
8. Anderson M, Perrin A. Technology Use Among Seniors. Washington, DC: Pew Research Center for Internet & Technology (2017).
9. Bakker D, Kazantzis N, Rickwood D, Rickard N, et al. Mental health smartphone apps: review and evidence-based recommendations for future developments. JMIR Mental Health. (2016) 3:e4984. doi: 10.2196/mental.4984
10. BinDhim NF, Hawkey A, Trevena L. A systematic review of quality assessment methods for smartphone health apps. Telemed e-Health. (2015) 21:97–104. doi: 10.1089/tmj.2014.0088
11. Millington B. Smartphone apps and the mobile privatization of health and fitness. Crit Stud Media Commun. (2014) 31:479–93. doi: 10.1080/15295036.2014.973429
12. Qiu S, Zhao H, Jiang N, Wang Z, Liu L, An Y, et al. Multi-sensor information fusion based on machine learning for real applications in human activity recognition: state-of-the-art and research challenges. Inform Fusion. (2022) 80:241–65. doi: 10.1016/j.inffus.2021.11.006
13. Ismail Fawaz H, Forestier G, Weber J, Idoumghar L, Muller PA. Deep learning for time series classification: a review. Data Min Knowl Disc. (2019) 33:917–63. doi: 10.1007/s10618-019-00619-1
14. Micucci D, Mobilio M, Napoletano P. Unimib shar: a dataset for human activity recognition using acceleration data from smartphones. Appl Sci. (2017) 7:1101. doi: 10.3390/app7101101
15. Vavoulas G, Pediaditis M, Spanakis EG, Tsiknakis M. The MobiFall dataset: An initial evaluation of fall detection algorithms using smartphones. In: 13th IEEE International Conference on BioInformatics and BioEngineering. Chania: IEEE (2013). p. 1–4.
16. Medrano C, Igual R, Plaza I, Castro M. Detecting falls as novelties in acceleration patterns acquired with smartphones. PLoS ONE. (2014) 9:e94811. doi: 10.1371/journal.pone.0094811
17. Vavoulas G, Chatzaki C, Malliotakis T, Pediaditis M, Tsiknakis M. The mobiact dataset: recognition of activities of daily living using smartphones. In: International Conference on Information and Communication Technologies for Ageing Well and e-Health. vol. 2. Rome: SciTePress (2016). p. 143–51.
18. Sztyler T, Stuckenschmidt H. On-body localization of wearable devices: An investigation of position-aware activity recognition. In:. 2016 IEEE International Conference on Pervasive Computing and Communications (PerCom). Sydney, NSWL IEEE (2016). p. 1–9.
19. Kim TK. T test as a parametric statistic. Korean J Anesthesiol. (2015) 68:540–6. doi: 10.4097/kjae.2015.68.6.540
20. He K, Zhang X, Ren S, Sun J. Deep residual learning for image recognition. In: Proceedings of the IEEE Conference on Computer Vision and Pattern Recognition. Las Vegas, NV: IEEE (2016). p. 770–8.
21. Tang Y, Zhang L, Teng Q, Min F, Song A. Triple cross-domain attention on human activity recognition using wearable sensors. IEEE Trans Emerg Top Comput Intell. (2022) 6: 1167–76. doi: 10.1109/TETCI.2021.3136642
22. Al-qaness MA, Dahou A, Abd Elaziz M, Helmi A. Multi-resatt: multilevel residual network with attention for human activity recognition using wearable sensors. IEEE Trans Ind Inform. (2022) 19: 144–52. doi: 10.1109/TII.2022.3165875
23. Teng Q, Zhang L, Tang Y, Song S, Wang X, He J. Block-wise training residual networks on multi-channel time series for human activity recognition. IEEE Sens J. (2021) 21:18063–74. doi: 10.1109/JSEN.2021.3085360
24. Tang Y, Teng Q, Zhang L, Min F, He J. Layer-wise training convolutional neural networks with smaller filters for human activity recognition using wearable sensors. IEEE Sens J. (2020) 21:581–92. doi: 10.1109/JSEN.2020.3015521
25. Gao W, Zhang L, Huang W, Min F, He J, Song A. Deep neural networks for sensor-based human activity recognition using selective kernel convolution. IEEE Trans Instrument Meas. (2021) 70:1–13. doi: 10.1109/TIM.2021.3102735
26. Cheng X, Zhang L, Tang Y, Liu Y, Wu H, He J. Real-time human activity recognition using conditionally parametrized convolutions on mobile and wearable devices. IEEE Sens J. (2022) 22:5889–901. doi: 10.1109/JSEN.2022.3149337
27. Tang Y, Zhang L, Min F, He J. Multi-scale deep feature learning for human activity recognition using wearable sensors. IEEE Trans Ind Electron. (2022) 70:2106–16. doi: 10.1109/TIE.2022.3161812
28. Xu S, Zhang L, Huang W, Wu H, Song A. Deformable convolutional networks for multimodal human activity recognition using wearable sensors. IEEE Trans Instrument Meas. (2022) 71:1–14. doi: 10.1109/TIM.2022.3158427
29. Huang W, Zhang L, Gao W, Min F, He J. Shallow convolutional neural networks for human activity recognition using wearable sensors. IEEE Trans Instrument Meas. (2021) 70:1–11. doi: 10.1109/TIM.2021.3091990
30. Teng Q, Wang K, Zhang L, He J. The layer-wise training convolutional neural networks using local loss for sensor-based human activity recognition. IEEE Sens J. (2020) 20:7265–74. doi: 10.1109/JSEN.2020.2978772
31. Mekruksavanich S, Jantawong P, Jitpattanakul A. LSTM-XGB: a new deep learning model for human activity recognition based on LSTM and XGBoost. In: 2022 Joint International Conference on Digital Arts, Media and Technology with ECTI Northern Section Conference on Electrical, Electronics, Computer and Telecommunications Engineering (ECTI DAMT & NCON). Chiang Rai: IEEE (2022). p. 342–5.
32. Lv T, Wang X, Jin L, Xiao Y, Song M. A hybrid network based on dense connection and weighted feature aggregation for human activity recognition. IEEE Access. (2020) 8:68320–32. doi: 10.1109/ACCESS.2020.2986246
33. Vong C, Theptit T, Watcharakonpipat V, Chanchotisatien P, Laitrakun S. Comparison of feature selection and classification for human activity and fall recognition using smartphone sensors. In: 2021 Joint International Conference on Digital Arts, Media and Technology with ECTI Northern Section Conference on Electrical, Electronics, Computer and Telecommunication Engineering. Cha-am: IEEE (2021). p. 170–3.
34. Li F, Shirahama K, Nisar MA, Köping L, Grzegorzek M. Comparison of feature learning methods for human activity recognition using wearable sensors. Sensors. (2018) 18:679. doi: 10.3390/s18020679
35. Jin L, Wang X, Chu J, He M. Human activity recognition machine with an anchor-based loss function. IEEE Sens J. (2021) 22:741–56. doi: 10.1109/JSEN.2021.3130761
36. Müller R, Kornblith S, Hinton GE. When does label smoothing help? In: Advances in Neural Information Processing Systems, Vol. 32. (2019).
Keywords: digital health, deep learning, data science, public health, smartphone, activity recognition, physical activity, wearable technology
Citation: Stampfler T, Elgendi M, Fletcher RR and Menon C (2023) The use of deep learning for smartphone-based human activity recognition. Front. Public Health 11:1086671. doi: 10.3389/fpubh.2023.1086671
Received: 01 November 2022; Accepted: 27 January 2023;
Published: 28 February 2023.
Edited by:
Teodora Sandra Buda, Meta Platforms, Inc., SpainReviewed by:
Sen Qiu, Dalian University of Technology, ChinaSakorn Mekruksavanich, University of Phayao, Thailand
Ivan Miguel Pires, Universidade da Beira Interior, Portugal
Copyright © 2023 Stampfler, Elgendi, Fletcher and Menon. This is an open-access article distributed under the terms of the Creative Commons Attribution License (CC BY). The use, distribution or reproduction in other forums is permitted, provided the original author(s) and the copyright owner(s) are credited and that the original publication in this journal is cited, in accordance with accepted academic practice. No use, distribution or reproduction is permitted which does not comply with these terms.
*Correspondence: Mohamed Elgendi, moe.elgendi@hest.ethz.ch; Carlo Menon, carlo.menon@hest.ethz.ch
†These authors have contributed equally to this work and share first authorship