 Chengcheng Wei1†
 Yu Yang
 Dong Ni
 Yu Huang
 Xiong Yang
 Zhaohui Chen
- 1Department of Urology, Union Hospital, Tongji Medical College, Huazhong University of Science and Technology, Wuhan, China
- 2Department of Urology, Ezhou Central Hospital, Ezhou, China
- 3Department of Pathologist and Laboratory Medicine, Staff Pathologist, Deaconess Hospital, Evansville, IN, United States
Background: Volatile organic compounds (VOCs) are a large group of chemicals widely used in people's daily routines. Increasing evidence revealed the VOCs' accumulating toxicity. However, the VOCs toxicity in male prostate has not been reported previously. Thus, we comprehensively evaluated the association between VOCs and prostate-specific antigen (PSA).
Methods: A total of 2016 subjects were included in our study from the National Health and Nutrition Examination Survey with VOCs, PSA, and other variables among U.S. average population. We constructed XGBoost Algorithm Model, Regression Model, and Generalized linear Model (GAM) to analyze the potential association. Stratified analysis was used to identify high-risk populations.
Results: XGBoost Algorithm model identified blood chloroform as the most critical variable in the PSA concentration. Regression analysis suggested that blood chloroform was a positive association with PSA, which showed that environmental chloroform exposure is an independent risk factor that may cause prostate gland changes [β, (95% CI), P = 0.007, (0.003, 0.011), 0.00019]. GAM observed the linear relationship between blood chloroform and PSA concentration. Meanwhile, blood chloroform linear correlated with water chloroform in the lower dose range, indicating that the absorption of water may be the primary origin of chloroform. Stratified associations analysis identified the high-risk group on the chloroform exposures.
Conclusion: This study revealed that blood chloroform was positively and independently associated with total PSA level, suggesting that long-term environmental chloroform exposure may cause changes in the prostate gland.
Introduction
Volatile organic compounds (VOCs) are a large group of chemicals used as solvents, degreasers, and cleaning agents through industry and consumer products in people's daily routines (1, 2), including vehicle emissions, cooking, wood burning, various industrial processes, smoking, cleaning supplies, building materials, and other household products (3–5). People monitored human exposure to VOCs through a variety of mechanisms, including traditional routes of assessment and the collection of an individual's blood, urine, breath, or sweat (6).
Previous studies have reported that acute exposures to selected VOCs [1,1-dichloroethane, 1,2-dichloroethane, benzene, bromodichloromethane, bromoform, chloroform, dibromochloromethane, dichloromethane, ethylbenzene, MTBE, tetrachloroethylene (PCE)] lead to kidney damage, cardiovascular disease, leukemia and chromosomal mismatch (7–9). Some studies showed that severe VOCs exposures [benzene, toluene, ethylbenzene, and xylenes (BTEX)] could cause sharp liver injury in humans and animal models and lower environment VOCs exposures may also lead to liver damage (10, 11). Some studies indicated that occupational VOCs (methane, benzene, toluene, ethylbenzene, o-xylene, m/p-xylene, and styrene) levels affect white blood level growth. Meanwhile, this phenomenon also occurs in the general population (4, 12, 13). Increasing evidence revealed the VOCs' accumulating toxicity (14). A study observed that cancer incidence, including stomach, bronchus, lung, and prostate, increased among persons living near a municipal solid waste landfill site that generated many VOCs (15). Although most research used empirical data in the environmental distribution and risk analysis, personal laboratory data was considered the best similar to actual exposure (16, 17). The limitations of the association between the blood VOCs concentration and parameters of liver, kidney, hematologic, endocrine and prostate functions still exist, especially in the average population (18). Studies evaluated occupational exposure to monocyclic aromatic hydrocarbons (MAHs) in prostate cancer (PCa) development indicating elevated risks of PCa with ever exposure to toluene and xylene (BTX) and duration, while marginal increases were found for exposure to styrene or MAHs (19–21). The limitations of the association between the blood VOCs concentration and parameters of liver, kidney, hematologic, endocrine, and prostate functions still exist, especially in the average population (18, 22).
The prostate is an essential reproductive gland in many physiological functions and fertility; it produces prostate fluid containing different enzymes, zinc, and many acids (23, 24). The prostate-specific antigen is one of the enzymes in a prostatic fluid whose functions include coagulation and liquefaction of semen which play a significant role in sperm fertility (25). Mounting PSA levels with an enlarged prostate size is related to benign prostatic hyperplasia (BPH), prostatitis, or prostate cancer (26). PSA concentrations monitoring is considered the most helpful serum biomarker to detect in the early prostate cancer process, clinical staging, and therapeutic outcome observation (27). Now, increasing evidence shows various environmental pollution like agent orange, pesticides, and cadmium are possible risk factors in prostate cancer (28), evidenced by PSA levels growth (29, 30). Air pollution and metal exposure are also known as risk factors for BPH like nitrogen oxide, cadmium, and nickel (31–33).
VOCs are common chemicals and suspected dangerous factors influencing public health. However, till now, there has been no research focus on the environmental VOCs affecting the prostate condition in the average population. However, some studies reveal that urinary volatiles and chemical characteristics for the non-invasive detection of prostate changes (34–37), the association between environmental VOCs exposure and PSA concentrations have not been reported previously. Studies revealed that occupational VOCs might promote PCa development, while environmental VOCs' effect on the prostate is still unclear. We hypothesized that VOCs might cause pathological prostate changes, which lead to PSA concentration changes. In order to verify our hypothesis, we explored the U.S. National Health and Nutrition Examination Survey (NHANES) for secondary analysis. According to previous articles (38–43), we controlled the potential confounders including, age, race, education level, marital status, poverty to income ratio, BMI, alcohol drinks, smoking, diabetes, physical activity, blood urea nitrogen, uric acid, creatinine which might be related to both the exposure as well as the outcome. Then we constructed models to clarify the comprehensive relationship between the volatile organic compounds (VOCs) and prostate-specific antigen (PSA). We aim to illustrate the VOCs influence prostate health among U.S. males.
Methods
Data availability
National Health and Nutrition Examination Survey (NHANES) as a nationwide study was supported by the National Centers for Disease Control (CDC) and Prevention National Health Statistics Center, which aimed to estimate the United States adults' and children's health and nutritional status from 1960 (44). All survey data and methodological details are available on the NHANES website (https://www.cdc.gov/nchs/nhanes/index.htm). NHANES protocols were approved by the NAHNES Institutional Review Board (IRB)/NCHS Research Ethics Review Board (ERB). In our study, no external IRB or ethical approval was needed beyond NHANES IRB/ERB approval.
Study population
NHANES is a continuous survey that has released published data files in 2-year cycles since 1999. Our study consisted of five periods of subjects who participated NHANES survey from 2001 to 2010. PSA concentration, water VOCs, blood VOCs, sociodemographic data, medical examination, and personal life history data, comorbidities data, and laboratory data have been included in our study for the secondary analysis. Participants were selected out of the total population and taken into our study according to the following exclusion criteria as: (1) female subjects (n = 26,493); (2) aged below 40 years old (n = 16,844); (3) missing/without PSA testing (n = 2735); (4) diagnosed with enlarged prostate (n = 739); (5) diagnosed with prostate cancer (n = 129); (Participants with enlarged prostate or diagnosed with PSA may cause outliers data which influence analysis results)(6) missing/without VOCs testing (n = 3078); (7) do not have data about covariates at least one of following (n = 161): race/ethnicity; educational level; marital level; family poverty income ratio (38, 43, 45). Inclusion criteria as: (1) male subjects (n = 25,702); (2) 40 years old or older (n = 8,858); (3) Tested for PSA (n = 5,255); (4) Tested for VOCs (n = 2,177); (5) have data about covariates at least one of following (n = 2,016): race/ethnicity; educational level; marital level; family poverty income ratio. There were 2016 analyzed samples out of 52,195 participants left in our study after screening (Figure 1). In the process of study design and conduction, the study complied with the Helsinki Declaration of the World Medical Association (46).
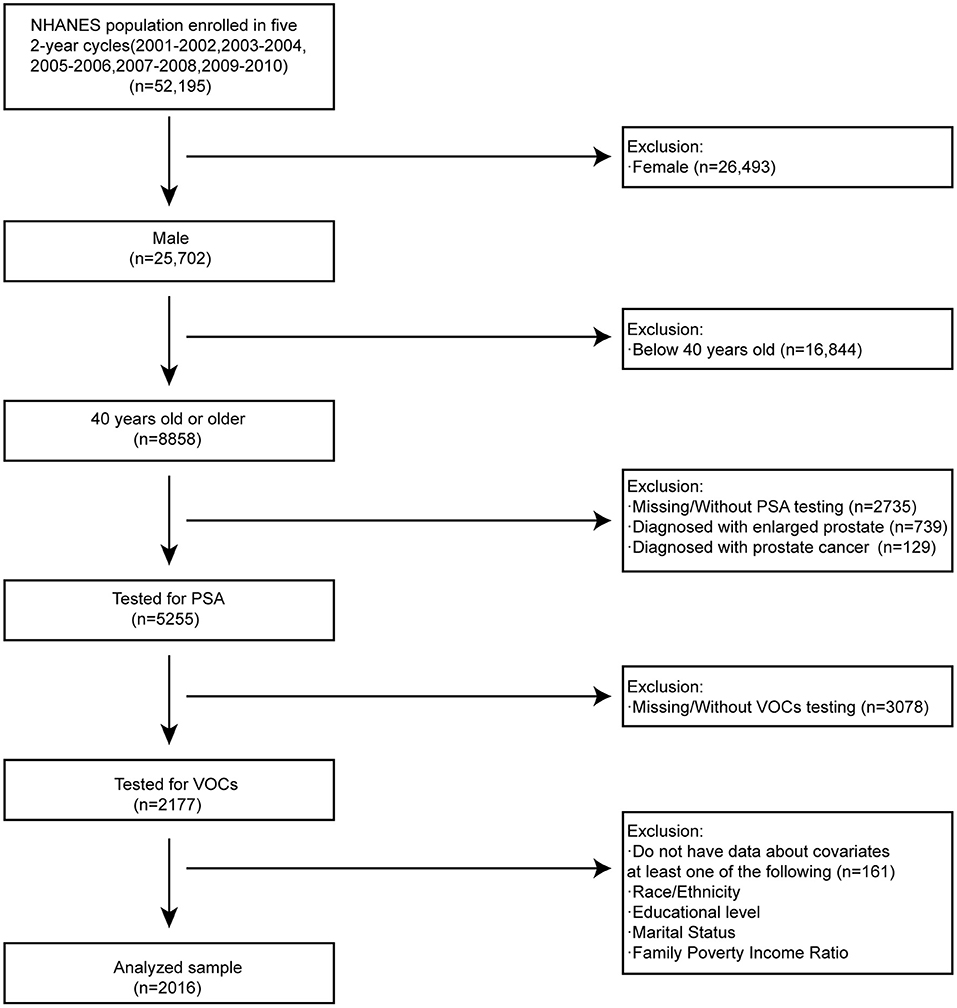
Figure 1. Flowchart for selecting analyzed participants.
VOCs measurement
Volatile organic compounds (VOCs) are a large group of chemicals that have been used as solvents, degreasers, and cleaning agents in the industry and consumer products. VOCs measurement consists of human blood VOCs and home tap water VOCs. Tap water VOCs including THMs (chloroform, bromodichloromethane, dibromochloromethane, and bromoform) and MTBE. These were analyzed by automatic method on headspace solid-phase microextraction (SPME) coupled with capillary gas chromatography and mass spectrometry. Blood disinfection by-products (DBP) (chloroform, bromodichloromethane, dibromochloromethane, and bromoform) and MTBE were quantified in human blood using capillary gas chromatography (GC) and high-resolution mass spectrometry (MS) with selected ion mass detection and isotope-dilution techniques which quantified trace levels of THMs and MTBE in human blood. Additional VOCs (tetrachloroethene, benzene, 1,4-dichlorobenzene, ethylbenzene, o-xylene, styrene, trichloroethene, toluene, m-/p-Xylene) were measured in human blood using SPME in conjunction with gas chromatography and benchtop quadrupole mass spectrometer.
PSA measurement
Total PSA concentrations were detected using the Hybritech PSA method on the Beckman Access Immunoassay System, which automatically detected reacted samples' light production. Free PSA concentrations were detected by the Access Hybritech assay, which measures through a two-site immuno-enzymatic “sandwich” assay. Prostate-specific antigen ratio was calculated by dividing the free PSA by the total PSA and then multiplying by 100. Total PSA's cutoff value to dichotomize was 4.0 ng/ mL, and the PSA ratio was 15% (47, 48).
Other variables
We have selected other variables affecting PSA concentration based on the previous surveys regarding the possible connection. Sociodemographic variables included age (year), poverty to income ratio, race/ethnicity (Mexican American, other Hispanic, non-Hispanic white, non-Hispanic black, others), an education level (less than high school, high school, more than high school), marital status (married, single, living with a partner). Variables of laboratory data included blood urea nitrogen (mmol/L), uric acid (umol/L), creatinine (umol/L) (41, 49, 50). The LX20 modular chemistry (BUNm) and timed endpoint method were used to quantitatively determine the concentration of blood urea nitrogen and uric acid in serum or plasma. Creatinine was detected by the LX20 modular chemistry side using the Jaffe rate method (kinetic alkaline picrate). Analyzed samples' comorbidities data included drinking (Had at least 12 alcohol drinks/1 year), smoking (Smoked at least 100 cigarettes in life), and diagnosis with diabetes (Yes, No, Borderline). Lastly, we also included medical examination and personal life history data involving body mass index (Kg/m2) and physical activity (MET-based rank). More details of variables can be found on the NHANES official website.
Statistical analysis
We have conducted a statistical analysis of the VOCs (blood and water) and PSA levels based on the CDC guidelines' criteria (https://www.cdc.gov/nchs/nhanes/index.htm). PSA concentration, VOCs and other continuous variables were expressed as the mean ± standard deviation as the normal distribution. The categorical variables were presented as percentage or frequency. First, we divided age as a continuous variable into four quartile concentrations. The weighted chi-square was used to calculate the p-value of the characteristics of the analyzed population's Categorical variables. In the case of continuous variables, we used the Kruskal Wallis rank sum test to calculate the p-value. If the count variable has a theoretical number < 10, we used Fisher's exact probability test to calculate the p-value, Results were shown in Table 1. Second, we constructed the machine learning of the XGBoost algorithm model to predict the relative importance of blood VOCs on the effect of PSA concentration. XGBoost model was performed to analyze blood VOCs contribution (gain) to PSA concentration (51). Third, we constructed three kinds of weighted multiple linear regression models that adjusted various variables shown in Table 2 to classify the relationship between the blood VOCs and PSA concentrations (Model 1: non-adjusted model, Model 2: minimally adjusted model, Model 3: fully adjusted model). Multiple analysis results were based on Rubin's rules and calculated dataset. Then, we found the statistical difference between the blood chloroform and PSA level, so we further constructed the subgroup analysis to identify the stratified associations between blood chloroform and PSA through stratified multivariate logistic regression. Lastly, we based the penalty spline method to construct a smooth curve using a Generalized additive model (GAM) model with a fully adjusted model to explore the potential linear relationship between the blood chloroform and PSA concentration (52). In order to explore the origin of the blood chloroform, we further constructed a smooth curve between the blood chloroform and water chloroform. Using the MICE package accounting for missing data, we curated the data and improved the accuracy of analysis results (53). There is no significant difference between the complete data and origin data. Multiple analysis results were based on the calculated dataset and Rubin's rules. All kinds of statistical analyses were conducted by R software (Version 4.0.2) using the R package (http://www.R-project.org, The R Foundation) (54). The software of EmpowerStats provided significant help in the process of our research (http://www.empowerstats.com, X&Y Solutions, Inc., Boston, MA, USA). In our study, the level of statistical significance was set p-value below 0.05.
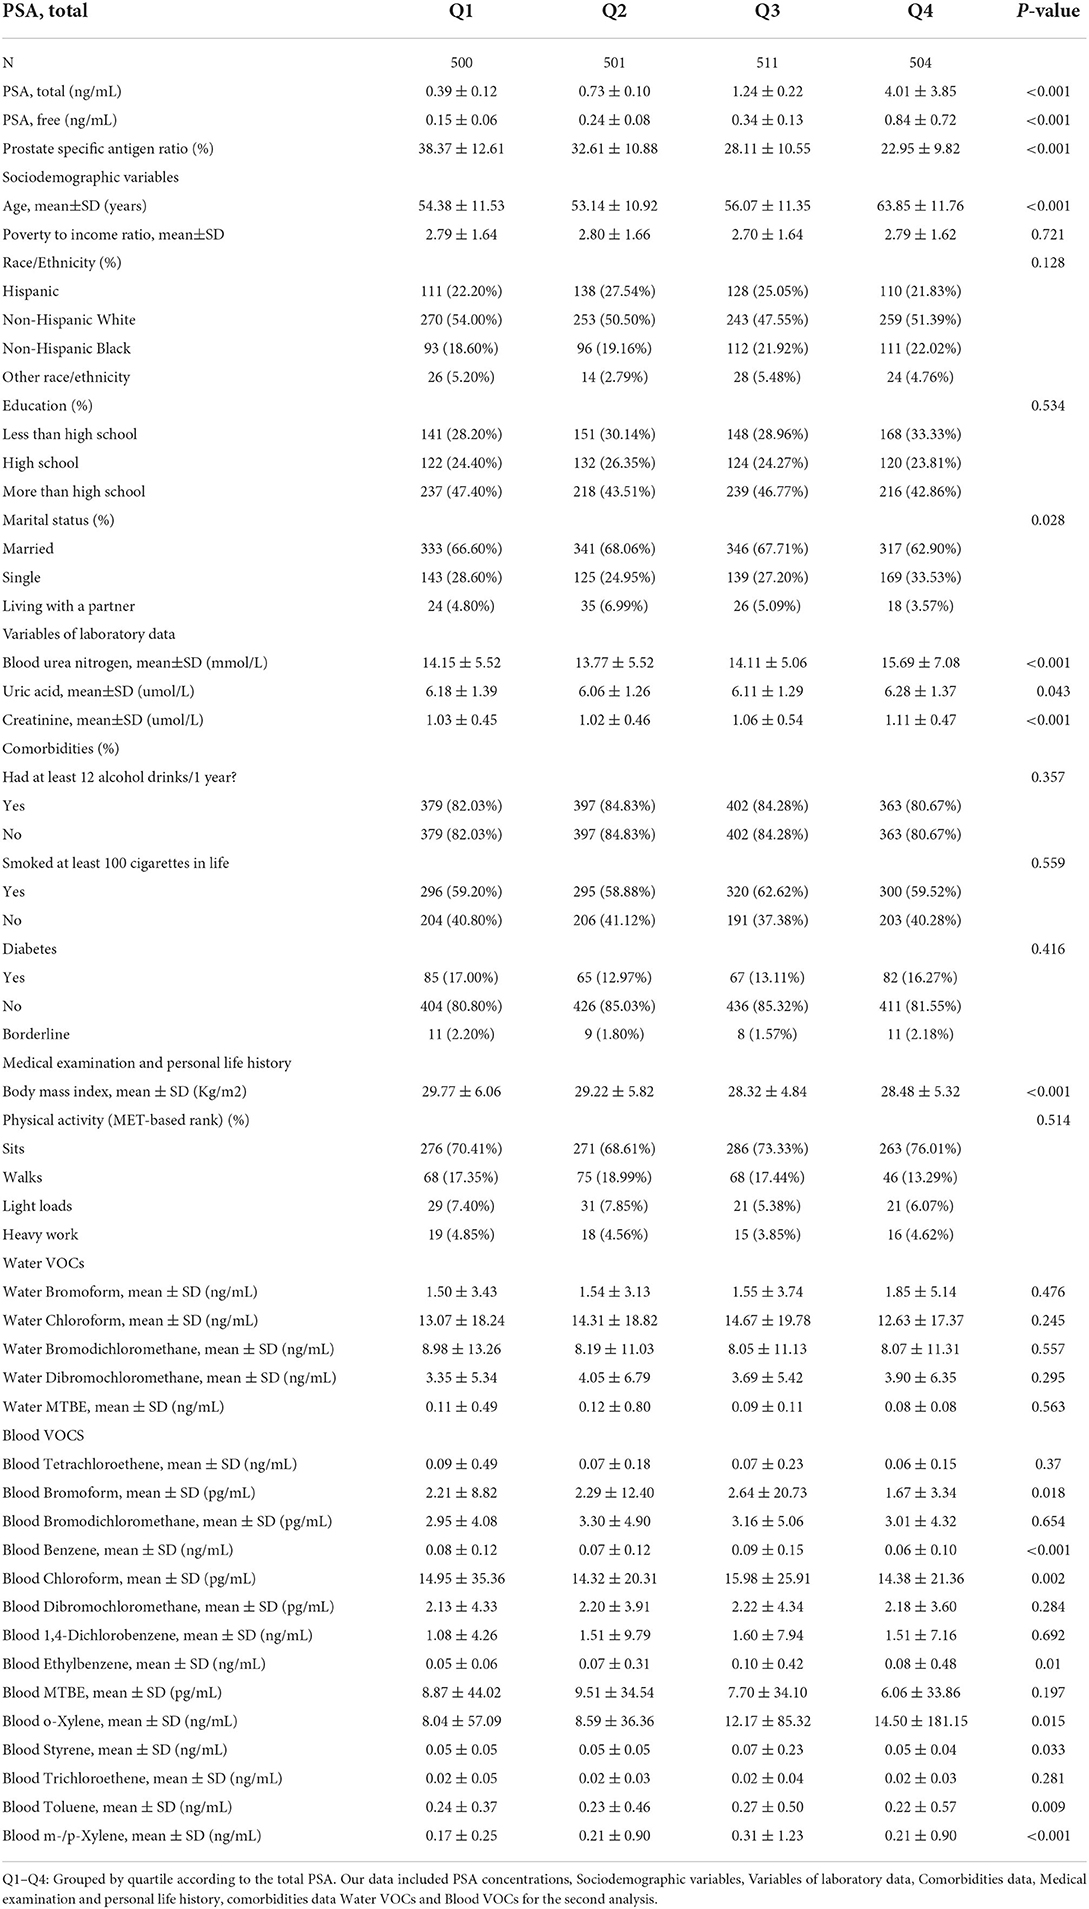
Table 1. Baseline characteristics of the study population.
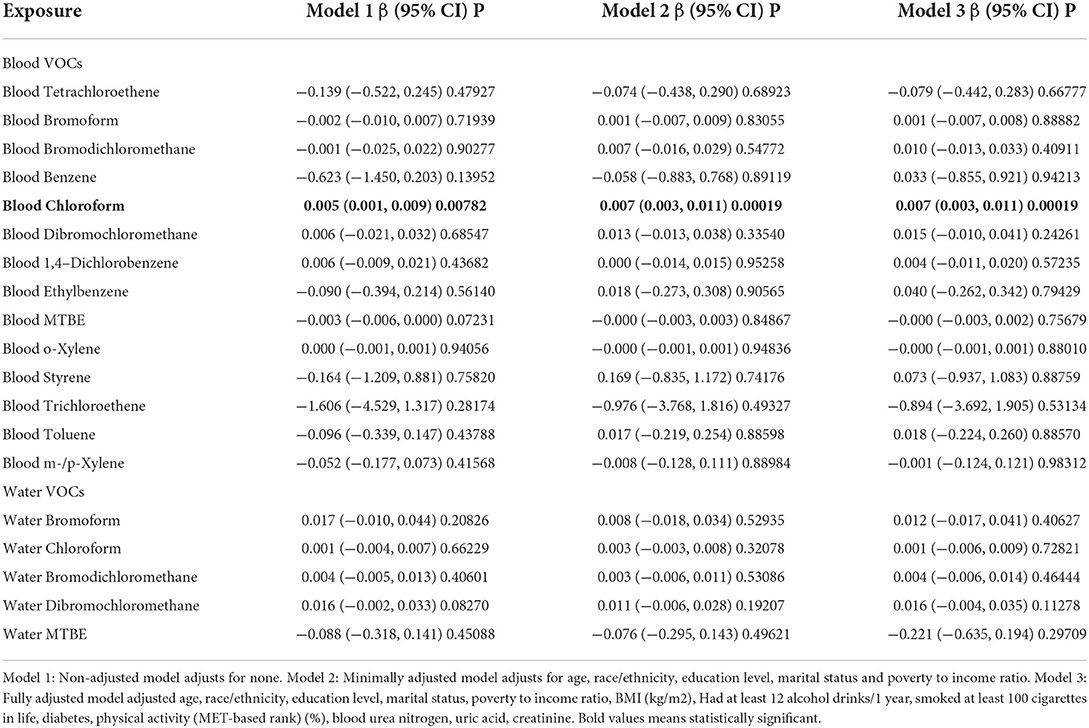
Table 2. Multivariate weighted linear model analysis reveals the association between the blood VOCs and PSA concentration.
Results
Characteristics of selected population
Table 1 shows the baseline characteristics of the chosen population from the NHANES dataset (2001-2010), which is weighted distribution. Variables included sociodemographic variables, laboratory data, comorbidities, medical examination and personal life history, water VOCs, blood VOCs, and PSA data. We grouped the population by quartile according to the total PSA (Q1-Q4). We found the distribution of poverty to income ratio, race/ethnicity, education level, drinking situation, smoking situation, diabetes, and physical activity in four quartiles indicated no statistical difference with p values > 0.05, and prostate-specific antigen ratio, age, marital status showed statistical difference with p values < 0.05. The older population showed a higher level of total PSA concentrations, which accorded to previous papers. Compared with the various groups, VOCs including blood bromoform, blood benzene, blood chloroform, blood ethylbenzene, blood o-Xylene, blood styrene, blood toluene, blood m-/p-Xylene showed distribution difference with a statistical significance which may indicate exposure difference between four groups while blood tetrachloroethene, blood bromodichloromethane, blood dibromochloromethane, blood 1,4-dichlorobenzene, blood MTBE and blood trichloroethene showed no exposure difference. Water VOCs including water bromoform, water chloroform, water bromodichloromethane, water dibromochloromethane, and water MTBE showed no statistical difference in the four groups. In our research, non-Hispanic Whites were the main population, and the following were the non-Hispanic Black. (This race/ethnicity variable was derived from responses to the survey questions on race and Hispanic origin. Respondents who self-identified as “Mexican American” were coded as such regardless of their other race-ethnicity identities. Otherwise, self-identified “Hispanic” ethnicity would result in the code “Other Hispanic” variable. We used “Hispanic” category to replace “other Hispanic” and “Mexican American”. All other non-Hispanic participants would then be categorized based on their self-reported races: non-Hispanic white, non-Hispanic black, and other non-Hispanic race, including non-Hispanic multiracial).
Using machine learning of XGBoost algorithm model to explore the VOCs' relative importance
In order to select which VOCs affected PSA most, we constructed the machine learning of the XGBoost Algorithm model to determine the relative importance among all blood VOCs. VOCs' variables included blood disinfection by-products (DBP) (chloroform, bromodichloromethane, dibromochloromethane, and bromoform) and additional blood VOCs (tetrachloroethene, benzene, 1,4-dichlorobenzene, ethylbenzene, o-xylene, styrene, trichloroethene, toluene, m-/p-Xylene). We found that blood chloroform was the most critical variable in the PSA concentration, followed by blood1,4-dichlorobenzene, blood styrene, blood benzene, and blood bromodichloromethane (Figure 2).
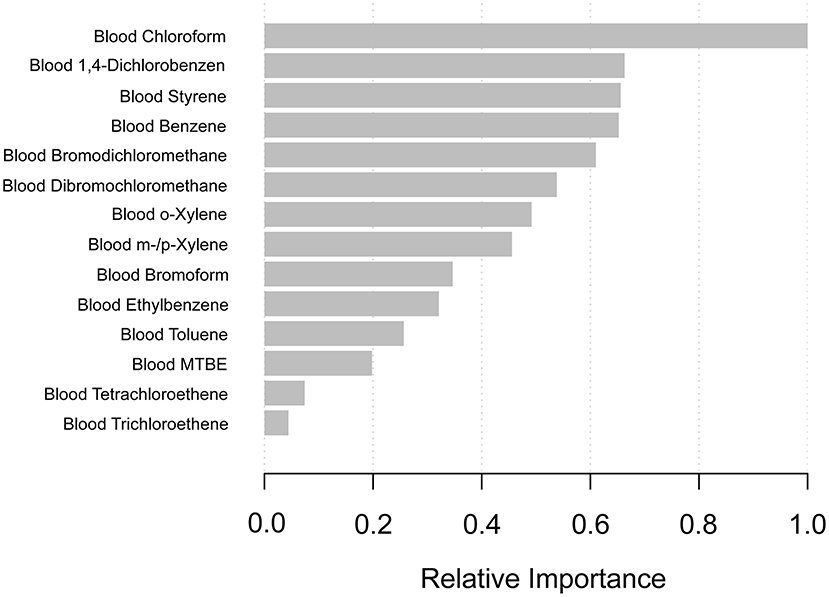
Figure 2. XGBoost model reveals the relative importance of blood VOCs on the PSA concentration and the corresponding variable importance score. The X-axis indicates the importance score, the relative number of a variable used to distribute the data; the Y-axis shows the blood VOCs.
The regression analysis between VOCs and PSA concentrations
In order to figure out the association between the blood VOCs and PSA concentrations, we constructed the weighted linear model by multivariate regression analysis shown in Table 2. Among all of the results, we found that only blood chloroform shows a positive association with PSA concentrations with statistical significance. In model 1 which adjusts for none, the PSA increase by 0.005 (ng/mL) (0.001, 0.009) for each additional unit of blood chloroform (pg/mL) with p less than 0.05. In model 2 (minimally adjusted model) and model 3 (fully adjusted model), results from both indicated that PSA increased by 0.007 (ng/mL) (0.003, 0.011) for each additional unit of blood chloroform (pg/mL) with p less than 0.05. This result suggested that long-time environmental chloroform exposure as an independent risk factor may cause male reproductive damage, especially in the prostate gland.
Stratified associations between PSA concentrations and blood chloroform
We further analyzed stratified associations between PSA concentrations and blood chloroform in a specific subgroup by age, race, education level, and the ratio of family income and BMI shown in Table 3. Surprisingly, we found an association between the blood chloroform and the PSA concentration concentrated in the specific subgroup. PSA concentrations of the population whose ages from 60 to 70 increase by 0.050 (ng/mL) for each unit of blood chloroform in model 1, by 0.049 in model 2, and 0.060 in model 3 with p < 0.05. This positive association also represents the non-Hispanic black, education level more than high school, BMI from 25 to 28. In the non-Hispanic black, PSA increase by 0.036 (ng/mL) (0.025, 0.047) for each additional unit of blood chloroform (pg/mL) in model 1, increase by 0.035 (ng/mL) (0.024, 0.045) in model 2 and increase by 0.055 (ng/mL) (0.041, 0.070) with statistical difference. Moreover, people with education level more than high school had same trend whose PSA increase by 0.021(ng/mL) in model 1, increase by 0.022(ng/mL) (0.017, 0.028) in model 2 and increase by 0.027(ng/mL) (0.021, 0.033) in model 3 with statistical difference. Moreover, Population with BMI between 25 to 28 indicated that PSA concentrations increase by 0.009 (ng/mL) (0.004, 0.015) in model 1, increase by 0.011(ng/mL) (0.006, 0.016) in model 2 and 0.011(ng/mL) (0.005, 0.016) in model 3.
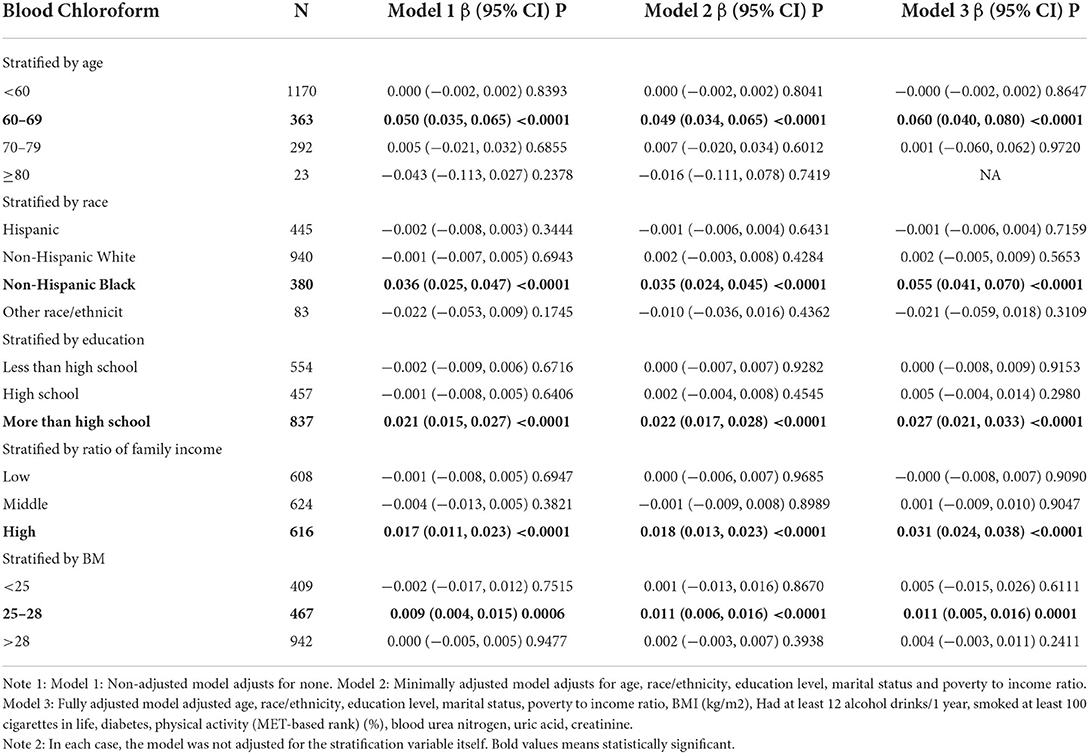
Table 3. Stratified associations of blood chloroform on PSA in the prespecified and exploratory subgroup.
Linear relationship between the blood chloroform and PSA concentrations/water chloroform using GAM
The Generalized linear model (GAM) is sensitive to identifying the linear relationship or non-linearity. To confirm the stability of the analysis results, we constructed the linear relationship using the GAM model between the blood chloroform and PSA concentrations. Based on the fully adjusted model (Figure 3), we used a smooth fit curve to investigate the possible association. Adjusting for all variables, we observed the linear relationship between blood chloroform and PSA concentration, and most of the data were distributed in the blood chloroform between 0 to 100 (pg/mL). We also constructed the GAM model to explore the linear relationship between blood chloroform and water chloroform. We observed the linear relationship between the blood chloroform and water chloroform when the water chloroform concentration was below 40 (pg/mL). When water chloroform concentration was above 40 (pg/mL), we observed a non-linear relationship between the two variables, which indicated that the origin of blood chloroform might come from various sources when water chloroform is above 40 (pg/mL). Thus, this positive correlation suggested that absorption of water might be the primary origin of chloroform in the specific range.
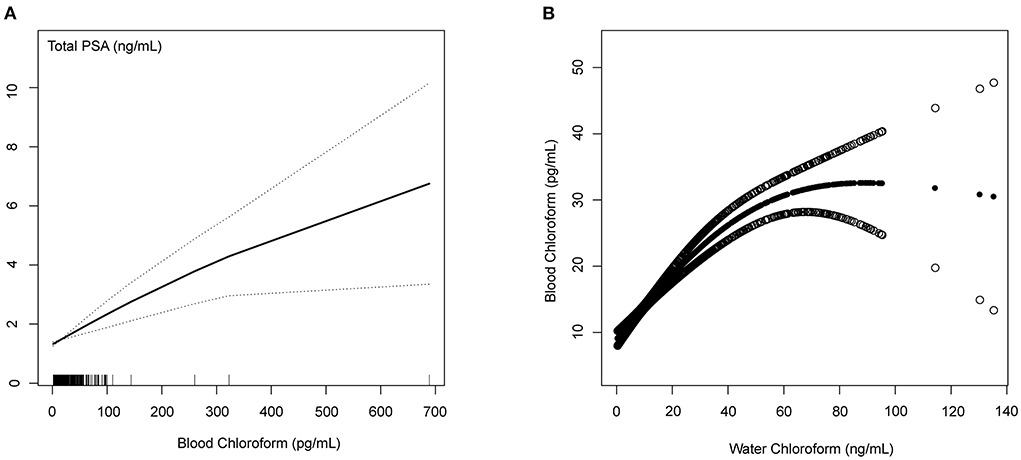
Figure 3. Blood Chloroform and PSA concentrations/Water Chloroform (A) The linear relationship between the blood chloroform and total PSA; (B) The nonlinear relationship between the blood chloroform and water chloroform.
Discussion
VOCs serve as common chemicals in people's daily routines, including vehicle emissions, cooking, wood burning, various industrial processes, smoking, cleaning supplies, building materials, and other household products (55–59). More and more evidence revealed that VOCs might be the dangerous factors influencing public health. Although some studies reveal that urinary volatiles and chemical characteristics may help detect prostate changes in a non-invasive way (60–62), the association between environmental VOCs exposure and PSA concentrations has not been reported previously. Our research was an extensive secondary analysis of national studies to explore the potential relationship between volatile organic compounds (VOCs) and prostate-specific antigen (PSA) based on the United Stated cross-sectional NHANES database. We proposed the hypothesis that the toxicity of environmental VOCs might cause influent the function of the male reproductive gland. Until now, there is no previous epidemiological research that reported this association. Blood VOCs analysis was considered the accurate indicator used in the environmental pollution exposures assessment through toxic or harmful VOCs checked in human blood (63, 64).
VOCs in our study contained disinfection by-products (DBPs) (chloroform, bromodichloromethane, dibromochloromethane, and bromoform), MTBE, and other VOCs (tetrachloroethene, benzene, 1,4-dichlorobenzene, ethylbenzene, o-xylene, styrene, trichloroethene, toluene, m-/p-Xylene). DBPs are formed when chlorine interacts with natural organic materials found in water. Primary sources of DBPs mainly come from chlorinated drinking water and recreational water bodies (65, 66). DBPs showed the possibility of cytotoxicity, mutagenicity, teratogenicity, and carcinogenicity (67). Methyl-tert-butyl ether (MTBE) was used as an additive in gasoline to replace lead, but it was banned after widespread groundwater contamination was discovered (68). Other VOCs (tetrachloroethene, benzene, 1,4-dichlorobenzene, ethylbenzene, o-xylene, styrene, trichloroethene, toluene, m-/p-Xylene) usually used in industrial and chemical synthetic processes such as benzene has been used to produce DDT, phenol, and nitrobenzene, 1,4-dichlorobenzene is also used as a moth repellent and as a deodorizer (69). Some studies reported that occupational exposure to VOCs may correlate with cancers. A study indicated that blood THM species, particularly brominated THMs, were significantly associated with total cancer mortality in adults (70). A case-control study on occupational exposure to chlorinated solvents revealed elevated odds ratios (ORs) between perchloroethylene and prostate cancer (71). A study reported that cancer incidence increased among Finnish workers exposed to halogenated hydrocarbons (72).
Our research aimed to explore the toxicity of environmental VOCs exposures on the PSA level. We consisted of five periods of subjects who participated NHANES survey from 2001 to 2010 (2001-2002, 2003-2004, 2005-2006, 2007-2008, 2009-2010). In order to classify the above VOCs' relative importance on the PSA level, we first constructed the machine learning of the XGBoost model to determine the order of selected variables. We identified blood chloroform as the most important VOCs on PSA concentrations, followed by blood 1,4-dichlorobenzene, styrene, benzene, and bromodichloromethane. Then, we constructed a weighted linear model by multivariate regression analysis to identify which VOCs is the independent risk factor. Among all of the results, we found that only blood chloroform shows a positive association with PSA concentrations with a statistical significance which indicated that PSA increased by 0.007 (ng/mL) (0.003, 0.011) for each additional unit of blood chloroform (pg/mL) in model 3 (fully adjusted model). This result suggested that long-time environmental chloroform exposure as an independent risk factor may cause male reproductive damage, especially in the prostate gland. Results mean that if 200 (pg/mL) of blood chloroform is added, the PSA concentration will increase by 1.4 (ng/mL).
Chloroform is the most prevalent biomarker of DBPs which can be absorbed through ingestion, inhalation, and dermal contact (73). A prospective cohort study revealed a positive relationship between total brominated THMs, including Br-THMs, the sum of (BDCM, DBCM, and TBM) and TTHM concentrations, and the risk of cancer death (74). Some studies showed that long-term chloroform exposures are linked to colorectal cancer and bladder cancer (75, 76). Animal models indicated that lower exposures of chloroform causing maternal toxicity could not lead to offspring developmental effects (77, 78). Some studies also accounted for the association of chloroform with reproductive development outcomes at the human group level (79, 80). Till now, the toxicity effect of chloroform on the male reproductive gland has not been explored. Through constructing the Generalized linear model (GAM) model, we observed the linear relationship between blood chloroform and PSA concentration which indicated that the damage to the prostate is associated with the accumulation of chloroform exposures. Moreover, we observed the linear relationship between the blood chloroform and water chloroform when water chloroform is below 40 (pg/mL), indicating the absorption of water may be the primary origin of chloroform in the low dose range. Furthermore, we found that the association between chloroform on PSA level has population differences. We identified the high-risk group on the chloroform exposures through stratified analysis, including age between 60 and 70, BMI between 25 and 28, non-Hispanic black, education level more than high school, and education level more than high school.
Our survey has some limitations which should be acknowledged. First, although our study is national broad, most of the data is based on Unite State population. Data on Asian or other populations is still lacking, and the results of the VOCs exposures may be different due to the country's development. Second, this research is a cross-sectional design, and more research is needed to guarantee associations based on causal relationships. Third, VOCs had a relatively short half-life. Time differences may occur between the PSA concentrations and blood VOCs exposures. Although we comprehensively evaluated the association between VOCs exposure and damage to the prostate, was selected chloroform as a significant risk factor. Nevertheless, the number of analyzed subjects was still too small. It may be a deviation from the results. Therefore, the reproductive toxicity of VOCs and chloroform should be conducted in another large-scale study and in-vivo/ in-vitro experiments. In our research, we have excluded patients who contain factors that could affect PSA concentrations including diagnosed with enlarged prostate or with prostate cancer. However, our include patients may contain other factors that could affect PSA concentrations including the presence of prostatitis, drug treatment or recent prostate biopsy and surgery. Meanwhile, our study is based on the secondary analysis of published data, so variables that are not included in the data set cannot be adjusted for. With the development of VOCs consumption, it is necessary to monitor the VOCs concentration in serum and urine. We propose to construct more predicted models between VOCs and body biomarkers, including PSA, in the future clinical setting to guide clinical prevention and treatment.
Conclusion
Our study comprehensively evaluated the association between VOCs exposure and serum PSA level. We found blood chloroform positively and independently associated with total PSA level, which suggested long-time environmental chloroform exposure may cause male reproductive damage, especially in the prostate gland. Furthermore, we found that blood chloroform positively correlates with water chloroform in the lower dose range, which indicated that the absorption of water might be the primary origin of chloroform. We also identified the high-risk group on the chloroform exposures. Our research wished to attract more attention to the toxicity of VOCs and prostate health among the average population.
Data availability statement
The original contributions presented in the study are included in the article/supplementary material, further inquiries can be directed to the corresponding author/s.
Author contributions
CW: conceptualization, data curation, formal analysis, methodology, software, visualization, writing-original draft, and writing-review & editing. YC: conceptualization, methodology, and writing-review & editing. YY: validation and writing-review & editing. DN, YH, and MW: writing-review & editing. XY and ZC: conceptualization, funding acquisition, methodology, supervision, and writing-review & editing. All authors contributed to the article and approved the submitted version.
Conflict of interest
The authors declare that the research was conducted in the absence of any commercial or financial relationships that could be construed as a potential conflict of interest.
Publisher's note
All claims expressed in this article are solely those of the authors and do not necessarily represent those of their affiliated organizations, or those of the publisher, the editors and the reviewers. Any product that may be evaluated in this article, or claim that may be made by its manufacturer, is not guaranteed or endorsed by the publisher.
References
1. Li AJ, Pal VK, Kannan K. A review of environmental occurrence, toxicity, biotransformation and biomonitoring of volatile organic compounds. Environ Chem Ecotoxicol. (2021). 3:91–116. doi: 10.1016/j.enceco.2021.01.001
2. McGraw KE, Riggs DW, Rai S, Navas-Acien A, Xie Z, Lorkiewicz P, et al. Exposure to volatile organic compounds - acrolein, 1,3-butadiene, and crotonaldehyde - is associated with vascular dysfunction. Environ Res. (2021) 196:110903. doi: 10.1016/j.envres.2021.110903
3. Ashley DL, Bonin MA, Cardinali FL, McCraw JM, Wooten JV. Measurement of volatile organic compounds in human blood. Environ Health Perspect. (1996) 104:871–7. doi: 10.1289/ehp.96104s5871
4. Jia C, Yu X, Masiak W. Blood/air distribution of volatile organic compounds (Vocs) in a nationally representative sample. Sci Total Environ. (2012) 419:225–32. doi: 10.1016/j.scitotenv.2011.12.055
5. Fujita EM, Campbell DE, Zielinska B, Arnott WP, Chow JC. Concentrations of air toxics in motor vehicle-dominated environments. Res Rep (Health Effects Institute). (2011) 156:3–77.
6. McFarlan EM, Mozdia KE, Daulton E, Arasaradnam R, Covington J, Nwokolo C. Pre-analytical and analytical variables that influence urinary volatile organic compound measurements. PLoS ONE. (2020) 15:e0236591. doi: 10.1371/journal.pone.0236591
7. Midzenski MA, McDiarmid MA, Rothman N, Kolodner K. Acute high dose exposure to benzene in shipyard workers. Am J Ind Med. (1992) 22:553–65. doi: 10.1002/ajim.4700220410
8. Hanna GB, Boshier PR, Markar SR, Romano A. Accuracy and methodologic challenges of volatile organic compound-based exhaled breath tests for cancer diagnosis: a systematic review and meta-analysis. JAMA Oncol. (2019) 5:e182815. doi: 10.1001/jamaoncol.2018.2815
9. Beyer LA, Greenberg GI, Beck BD. A comparative cancer risk evaluation of mtbe and other compounds (including naturally occurring compounds) in drinking water in new hampshire. Risk Anal. (2020) 40:2584–97. doi: 10.1111/risa.13570
10. Lang AL, Beier JI. Interaction of volatile organic compounds and underlying liver disease: a new paradigm for risk. Biol Chem. (2018) 399:1237–48. doi: 10.1515/hsz-2017-0324
11. Park HJ, Oh JH, Yoon S, Rana SV. Time dependent gene expression changes in the liver of mice treated with benzene. Biomark Insights. (2008) 3:191–201. doi: 10.4137/BMI.S590
12. Ciarrocca M, Tomei G, Fiaschetti M, Caciari T, Cetica C, Andreozzi G, et al. Assessment of occupational exposure to benzene, toluene and xylenes in urban and rural female workers. Chemosphere. (2012) 87:813–9. doi: 10.1016/j.chemosphere.2012.01.008
13. Vaughan Watson C, Naik S, Lewin M, Ragin-Wilson A, Irvin-Barnwell E. Associations between select blood vocs and hematological measures in nhanes 2005–2010. J Expo Sci Environ Epidemiol. (2021) 31:366–76. doi: 10.1038/s41370-019-0192-8
14. Kampa M, Castanas E. Human health effects of air pollution. Environ. Pollut. (2008) 151:362–7. doi: 10.1016/j.envpol.2007.06.012
15. Goldberg MS. al-Homsi N, Goulet L, Riberdy H. Incidence of cancer among persons living near a municipal solid waste landfill site in Montreal, Québec. Arch Environ Health. (1995) 50:416–24. doi: 10.1080/00039896.1995.9935977
16. Doherty BT, Kwok RK, Curry MD, Ekenga C, Chambers D, Sandler DP., et al. Associations between blood btexs concentrations and hematologic parameters among adult residents of the US Gulf States. Environ Res. (2017) 156:579–87. doi: 10.1016/j.envres.2017.03.048
17. Li X, Guo Y, Song X, He Y, Zhang H, Bao H, et al. A cross-sectional survey based on blood vocs, hematological parameters and urine indicators in a population in Jilin, Northeast China. Environ Geochem Health. (2019) 41:1599–615. doi: 10.1007/s10653-019-00241-6
18. Øvrevik J. Oxidative potential versus biological effects: a review on the relevance of cell-free/abiotic assays as predictors of toxicity from airborne particulate matter. Int J Mol Sci. (2019) 20:4772. doi: 10.3390/ijms20194772
19. Blanc-Lapierre A, Sauvé J-F. Parent M-E. Occupational exposure to benzene, toluene, xylene and styrene and risk of prostate cancer in a population-based study. J Occup Environ Med. (2018) 75:562–72. doi: 10.1136/oemed-2018-105058
20. Weisel CP. Benzene exposure: an overview of monitoring methods and their findings. Chem Biol Interact. (2010) 184:58–66. doi: 10.1016/j.cbi.2009.12.030
21. Gérin M, Siemiatycki J, Kemper H, Bégin D. Obtaining occupational exposure histories in epidemiologic case-control studies. J Occup Med Official Publ Ind Med Assoc. (1985) 27:420–6.
22. Salinas CA, Tsodikov A, Ishak-Howard M, Cooney KA. Prostate cancer in young men: an important clinical entity. Nat Rev Urol. (2014) 11:317–23. doi: 10.1038/nrurol.2014.91
23. Verze P, Cai T, Lorenzetti S. The role of the prostate in male fertility, health and disease. Nat Rev Urol. (2016) 13:379–86. doi: 10.1038/nrurol.2016.89
24. Franz MC, Anderle P, Bürzle M, Suzuki Y, Freeman MR, Hediger MA, et al. Zinc transporters in prostate cancer. Mol Aspects Med. (2013) 34:735–41. doi: 10.1016/j.mam.2012.11.007
25. Rao AR, Motiwala HG, Karim OM. The discovery of prostate-specific antigen. BJU Int. (2008) 101:5–10.
26. Lokant MT, Naz RK. Presence of psa auto-antibodies in men with prostate abnormalities (prostate cancer/benign prostatic hyperplasia/prostatitis). Andrologia. (2015) 47:328–32. doi: 10.1111/and.12265
27. Ornstein DK, Pruthi RS. Prostate-specific antigen. Expert Opin Pharmacother. (2000) 1:1399–411. doi: 10.1517/14656566.1.7.1399
28. Wang J, Xia HH, Zhang Y, Zhang L. Trends in treatments for prostate cancer in the United States, 2010–2015. Am J Cancer Res. (2021) 11:2351–68.
29. De Coster S, Koppen G, Bracke M, Schroijen C, Den Hond E, Nelen V, et al. Pollutant effects on genotoxic parameters and tumor-associated protein levels in adults: a cross sectional study. Environ Health Global Access Sci Source. (2008) 7:26. doi: 10.1186/1476-069X-7-26
30. Miyake H, Hara I, Kamidono S, Eto H. Oxidative DNA damage in patients with prostate cancer and its response to treatment. J Urol. (2004) 171:1533–6. doi: 10.1097/01.ju.0000116617.32728.ca
31. Mullins JK, Loeb S. Environmental exposures and prostate cancer. Urol Oncol. (2012) 30:216–9. doi: 10.1016/j.urolonc.2011.11.014
32. Shim SR, Kim JH, Song YS, Lee WJ. Association between air pollution and benign prostatic hyperplasia: an ecological study. Arch Environ Occup Health. (2016) 71:289–92. doi: 10.1080/19338244.2015.1093458
33. Miller KD, Nogueira L, Devasia T, Mariotto AB, Yabroff KR, Jemal A, et al. Cancer treatment and survivorship statistics, 2022. CA Cancer J Clin. (2022) 62:220–41. doi: 10.3322/caac.21731
34. Tyagi H, Daulton E, Bannaga AS, Arasaradnam RP, Covington JA. Urinary volatiles and chemical characterisation for the non-invasive detection of prostate and bladder cancers. Biosensors. (2021) 11:437. doi: 10.3390/bios11110437
35. da Costa BRB, De Martinis BS. Analysis of urinary vocs using mass spectrometric methods to diagnose cancer: a review. Clin Mass Spectrometry. (2020) 18:27–37. doi: 10.1016/j.clinms.2020.10.004
36. Wen Q, Boshier P, Myridakis A, Belluomo I, Hanna GB. Urinary volatile organic compound analysis for the diagnosis of cancer: a systematic literature review and quality assessment. Metabolites. (2020) 11:17. doi: 10.3390/metabo11010017
37. Lima AR, Pinto J, Azevedo AI, Barros-Silva D, Jerónimo C, Henrique R, et al. Identification of a iomarker panel for improvement of prostate cancer diagnosis by volatile metabolic profiling of urine. Br J Cancer. (2019) 121:857–68. doi: 10.1038/s41416-019-0585-4
38. Wei C, Tian L, Jia B, Wang M, Xiong M, Hu B, et al. Association between serum triglycerides and prostate specific antigen (psa) among u.s. males: national health and nutrition examination survey (Nhanes), 2003–2010. Nutrients. (2022) 14:1325. doi: 10.3390/nu14071325
39. Lu Y, Edwards A, Chen Z, Tseng TS Li M, Gonzalez GV, et al. Insufficient lycopene intake is associated with high risk of prostate cancer: a cross-sectional study from the national health and nutrition examination survey (2003–2010). Front Public Health. (2021) 9:792572. doi: 10.3389/fpubh.2021.792572
40. Mouzannar A, Kuchakulla M, Blachman-Braun R, Nackeeran S, Becerra M, Nahar B, et al. Impact of plant-based diet on psa level: data from the national health and nutrition examination survey. Urology. (2021) 156:205–10. doi: 10.1016/j.urology.2021.05.086
41. Wu H, Wang M, Raman JD, McDonald AC. Association between urinary arsenic, blood cadmium, blood lead, and blood mercury levels and serum prostate-specific antigen in a population-based cohort of men in the United States. PLoS ONE. (2021) 16:e0250744. doi: 10.1371/journal.pone.0250744
42. Hong D, Min JY, Min KB. Association between pyrethroids and prostate endpoints; stratified according to renal function. Environ Int. (2021) 153:106489. doi: 10.1016/j.envint.2021.106489
43. Liu Z, Chen C, Yu F, Yuan D, Wang W, Jiao K, et al. Association of total dietary intake of sugars with prostate-specific antigen (psa) concentrations: evidence from the national health and nutrition examination survey (Nhanes), 2003–2010. Biomed Res Int. (2021) 2021:4140767. doi: 10.1155/2021/4140767
45. Wang A, Lazo M, Carter HB, Groopman JD, Nelson WG, Platz EA. Association between liver fibrosis and serum psa among U.S. men: national health and nutrition examination survey (Nhanes), 2001–2010. Cancer Epidemiol Biomarkers Prevent Public Am Assoc Cancer Res Cosponsored Am Soc Prevent Oncol. (2019) 28:1331–8. doi: 10.1158/1055-9965.EPI-19-0145
46. World Medical Association. Declaration of Helsinki: ethical principles for medical research involving human subjects. JAMA. (2013) 310:2191–4. doi: 10.1001/jama.2013.281053
47. Wang C, Wang YY, Wang SY, Ding JX, Ding M, Ruan Y, et al. Peripheral zone psa density: a predominant variable to improve prostate cancer detection efficiency in men with psa higher than 4 Ng Ml(-1). Asian J Androl. (2021) 23:415–20. doi: 10.4103/aja.aja_72_20
48. Djavan B, Zlotta A, Kratzik C, Remzi M, Seitz C, Schulman CC., et al. Psa, psa density, psa density of transition zone, free/total psa ratio, and psa velocity for early detection of prostate cancer in men with serum psa 25 to 40 Ng/Ml. Urology. (1999) 54:517–22. doi: 10.1016/S0090-4295(99)00153-3
49. Anic GM, Albanes D, Rohrmann S, Kanarek N, Nelson WG, Bradwin G, et al. Association between Serum 25-hydroxyvitamin D and serum sex steroid hormones among men in nhanes. Clin Endocrinol. (2016) 85:258–66. doi: 10.1111/cen.13062
50. Song J, Chen C, He S, Chen W, Su J, Yuan D, et al. Is there a non-linear relationship between dietary protein intake and prostate-specific antigen: proof from the national health and nutrition examination survey (2003–2010). Lipids Health Dis. (2020) 19:82. doi: 10.1186/s12944-020-01234-6
51. Babajide Mustapha I, Saeed F. Bioactive molecule prediction using extreme gradient boosting. Molecules. (2016) 21:983. doi: 10.3390/molecules21080983
52. Marques DDS, Costa PG, Souza GM, Cardozo JG, Barcarolli IF, Bianchini A. Selection of biochemical and physiological parameters in the croaker micropogonias furnieri as biomarkers of chemical contamination in estuaries using a generalized additive model (Gam). Sci Total Environ. (2019) 647:1456–67. doi: 10.1016/j.scitotenv.2018.08.049
53. Hsu CH, Yu M. Cox regression analysis with missing covariates via nonparametric multiple imputation. Stat Methods Med Res. (2019) 28:1676–88. doi: 10.1177/0962280218772592
54. Leroux A, Di J, Smirnova E, McGuffey EJ, Cao Q, Bayatmokhtari E, et al. Organizing and analyzing the activity data in nhanes. Stat Biosci. (2019) 11:262–87. doi: 10.1007/s12561-018-09229-9
55. Konkle SL, Zierold KM, Taylor KC, Riggs DW, Bhatnagar A. National secular trends in ambient air volatile organic compound levels and biomarkers of exposure in the United States. Environ Res. (2020) 182:108991. doi: 10.1016/j.envres.2019.108991
56. Jain RB. Detection rates, trends in and factors affecting observed levels of selected volatile organic compounds in blood among us adolescents and adults. Environ Toxicol Pharmacol. (2017) 56:21–8. doi: 10.1016/j.etap.2017.08.031
57. Jain RB. Distributions of selected urinary metabolites of volatile organic compounds by age, gender, race/ethnicity, and smoking status in a representative sample of US adults. Environ Toxicol Pharmacol. (2015) 40:471–9. doi: 10.1016/j.etap.2015.07.018
58. Liu B, Jia C. Effects of exposure to mixed volatile organic compounds on the neurobehavioral test performance in a cross-sectional study of Us adults. Int J Environ Health Res. (2015) 25:349–63. doi: 10.1080/09603123.2014.945514
59. Su FC, Jia C, Batterman S. Extreme value analyses of voc exposures and risks: a comparison of riopa and nhanes datasets. Atmospheric Environ. (2012) 62:97–106. doi: 10.1016/j.atmosenv.2012.06.038
60. Guest C, Harris R, Sfanos KS, Shrestha E, Partin AW, Trock B, et al. Feasibility of integrating canine olfaction with chemical and microbial profiling of urine to detect lethal prostate cancer. PLoS ONE. (2021) 16:e0245530. doi: 10.1371/journal.pone.0245530
61. Khalid T, Aggio R, White P, De Lacy Costello B, Persad R, Al-Kateb H, et al. Urinary volatile organic compounds for the detection of prostate cancer. PLoS ONE. (2015) 10:e0143283. doi: 10.1371/journal.pone.0143283
62. Gao Q, Su X, Annabi MH, Schreiter BR, Prince T, Ackerman A, et al. Application of urinary volatile organic compounds (vocs) for the diagnosis of prostate cancer. Clin Genitourin Cancer. (2019) 17:183–90. doi: 10.1016/j.clgc.2019.02.003
63. Longo V, Forleo A, Ferramosca A, Notari T, Pappalardo S, Siciliano P, et al. Blood, urine and semen volatile organic compound (voc) pattern analysis for assessing health environmental impact in highly polluted areas in Italy. Environ Pollut (Barking, Essex: 1987). (2021) 286:117410. doi: 10.1016/j.envpol.2021.117410
64. de Lacy Costello B, Amann A, Al-Kateb H, Flynn C, Filipiak W, Khalid T, et al. A review of the volatiles from the healthy human body. J Breath Res. (2014) 8:014001. doi: 10.1088/1752-7155/8/1/014001
65. Alexandrou L, Meehan BJ, Jones OAH. Regulated and emerging disinfection by-products in recycled waters. Sci Total Environ. (2018) 637–638:1607–16. doi: 10.1016/j.scitotenv.2018.04.391
66. Carter RAA, Joll CA. Occurrence and formation of disinfection by-products in the swimming pool environment: a critical review. J Environ Sci. (2017) 58:19–50. doi: 10.1016/j.jes.2017.06.013
67. Srivastav AL, Patel N, Chaudhary VK. Disinfection by-products in drinking water: occurrence, toxicity and abatement. Environ Pollut. (2020) 267:115474. doi: 10.1016/j.envpol.2020.115474
68. Bogen KT, Heilman JM. Reassessment of Mtbe cancer potency considering modes of action for Mtbe and its metabolites. Crit Rev Toxicol. (2015) 45:1–56. doi: 10.3109/10408444.2015.1052367
69. Tormoehlen LM, Tekulve KJ, Nañagas KA. Hydrocarbon toxicity: a review. Clin Toxicol. (2014) 52:479–89. doi: 10.3109/15563650.2014.923904
70. Min JY, Min KB. Blood trihalomethane levels and the risk of total cancer mortality in Us adults. Environ. Pollut. (2016) 212:90–6. doi: 10.1016/j.envpol.2016.01.047
71. Christensen KY, Vizcaya D, Richardson H, Lavoué J, Aronson K, Siemiatycki J. Risk of selected cancers due to occupational exposure to chlorinated solvents in a case-control study in Montreal. J Occup Environ Med. (2013) 55:198–208. doi: 10.1097/JOM.0b013e3182728eab
72. Anttila A, Pukkala E, Sallmén M, Hernberg S, Hemminki K. Cancer incidence among finnish workers exposed to halogenated hydrocarbons. J Occup Environ Med. (1995) 37:797–806. doi: 10.1097/00043764-199507000-00008
73. Villanueva CM, Espinosa A, Gracia-Lavedan E, Vlaanderen J, Vermeulen R, Molina AJ, et al. Exposure to widespread drinking water chemicals, blood inflammation markers, and colorectal cancer. Environ Int. (2021) 157:106873. doi: 10.1016/j.envint.2021.106873
74. Sun Y, Chen C, Mustieles V, Wang L, Zhang Y, Wang YX., et al. Association of blood trihalomethane concentrations with risk of all-cause and cause-specific mortality in US adults: a prospective cohort study. Environ Sci Technol. (2021) 55:9043–51. doi: 10.1021/acs.est.1c00862
75. Richardson SD, Plewa MJ, Wagner ED, Schoeny R, Demarini DM. Occurrence, genotoxicity, and carcinogenicity of regulated and emerging disinfection by-products in drinking water: a review and roadmap for research. Mutat Res. (2007) 636:178–242. doi: 10.1016/j.mrrev.2007.09.001
76. Villanueva CM, Castaño-Vinyals G, Moreno V, Carrasco-Turigas G, Aragonés N, Boldo E, et al. Concentrations and correlations of disinfection by-products in municipal drinking water from an exposure assessment perspective. Environ Res. (2012) 114:1–11. doi: 10.1016/j.envres.2012.02.002
77. Liu C, Sun Y, Mustieles V, Chen YJ, Huang LL, Deng YL, et al. Prenatal exposure to disinfection byproducts and intrauterine growth in a chinese cohort. Environ Sci Technol. (2021) 55:16011–22. doi: 10.1021/acs.est.1c04926
78. Smith MK, Zenick H, George EL. Reproductive toxicology of disinfection by-products. Environ Health Perspect. (1986) 69:177–82. doi: 10.1289/ehp.8669177
79. Williams AL, Bates CA, Pace ND, Leonhard MJ, Chang ET, DeSesso JM. Impact of chloroform exposures on reproductive and developmental outcomes: a systematic review of the scientific literature. Birth Defects Res. (2018) 110:1267–313. doi: 10.1002/bdr2.1382
Keywords: prostate-specific antigen (PSA), volatile organic compounds (VOCs), National Health and Nutrition Examination Survey (NHANES), public health, chloroform
Citation: Wei C, Chen Y, Yang Y, Ni D, Huang Y, Wang M, Yang X and Chen Z (2022) Assessing volatile organic compounds exposure and prostate-specific antigen: National Health and Nutrition Examination Survey, 2001–2010. Front. Public Health 10:957069. doi: 10.3389/fpubh.2022.957069
Received: 30 May 2022; Accepted: 14 July 2022;
Published: 29 July 2022.
Edited by:
Yansen Bai, Guangzhou Medical University, ChinaReviewed by:
Zahira Altagracia Quinones, University of Rochester, United StatesLanjing Zhang, Rutgers, The State University of New Jersey - Busch Campus, United States
Jian Lu, Peking University Third Hospital, China
Copyright © 2022 Wei, Chen, Yang, Ni, Huang, Wang, Yang and Chen. This is an open-access article distributed under the terms of the Creative Commons Attribution License (CC BY). The use, distribution or reproduction in other forums is permitted, provided the original author(s) and the copyright owner(s) are credited and that the original publication in this journal is cited, in accordance with accepted academic practice. No use, distribution or reproduction is permitted which does not comply with these terms.
*Correspondence: Xiong Yang, yangxiong1368@hust.edu.cn; Zhaohui Chen, zhaohuichen@hust.edu.cn
†These authors have contributed equally to this work