 Zhenyu Liang
 Chuming You
- Department of Pediatrics, Guangdong Second Provincial General Hospital, Guangzhou, China
The burden of lower respiratory infections is primarily evident in the developing countries. However, the association between size-specific particulate matter and acute lower respiratory infection (ALRI) outpatient visits in the developing countries has been less studied. We obtained data on ALRI outpatient visits (N = 105,639) from a tertiary hospital in Guangzhou, China between 2013 and 2019. Over-dispersed generalized additive Poisson models were employed to evaluate the excess risk (ER) associated with the size-specific particulate matter, such as inhalable particulate matter (PM10), coarse particulate matter (PMc), and fine particulate matter (PM2.5). Counterfactual analyses were used to examine the potential percent reduction of ALRI outpatient visits if the levels of air pollution recommended by the WHO were followed. There were 35,310 pneumonia, 68,218 bronchiolitis, and 2,111 asthma outpatient visits included. Each 10 μg/m3 increase of 3-day moving averages of particulate matter was associated with a significant ER (95% CI) of outpatient visits of pneumonia (PM2.5: 3.71% [2.91, 4.52%]; PMc: 9.19% [6.94, 11.49%]; PM10: 4.36% [3.21, 5.52%]), bronchiolitis (PM2.5: 3.21% [2.49, 3.93%]; PMc: 9.13% [7.09, 11.21%]; PM10: 3.12% [2.10, 4.15%]), and asthma (PM2.5: 3.45% [1.18, 5.78%]; PMc: 11.69% [4.45, 19.43%]; PM10: 3.33% [0.26, 6.49%]). The association between particulate matter and pneumonia outpatient visits was more evident in men patients and in the cold seasons. Counterfactual analyses showed that PM2.5 was associated with a larger potential decline of ALRI outpatient visits compared with PMc and PM10 (pneumonia: 11.07%, 95% CI: [7.99, 14.30%]; bronchiolitis: 6.30% [4.17, 8.53%]; asthma: 8.14% [2.65, 14.33%]) if the air pollutants were diminished to the level of the reference guidelines. In conclusion, short-term exposures to PM2.5, PMc, and PM10 are associated with ALRI outpatient visits, and PM2.5 is associated with the highest potential decline in outpatient visits if it could be reduced to the levels recommended by the WHO.
Introduction
Lower respiratory infections, such as pneumonia and bronchiolitis, are the sixth leading cause of death in all age groups, resulting in ~2.4 million deaths worldwide in 2016 (1). The burden of lower respiratory infections is unevenly distributed across the world and is primarily born in the developing countries with socioeconomically disadvantaged communities, where proper nutrition, clean fuel, sanitation, and clean air are unavailable or inadequate (2, 3). China has experienced a staggering economic growth in the past 30 years, resulting in a steady increase in the life expectancy and improvement in the health outcomes in the country. From 1990 to 2019, the number of cases and mortalities of lower respiratory infections declined by 21.98 and 65.94%, respectively. In 2019, there were still 55.84 million cases, with 185,264.33 mortalities attributed to lower respiratory infections in China, making it the country's leading cause of mortality in children under-five (4).
Exposure to ambient particulate matter has been widely reported to be associated with lower respiratory infections (5–7). However, evidence on the association between size-specific particulate matter and lower respiratory infections, especially that from the developing countries where the level of air pollution is high, is relatively limited (8–10). Based on particle diameter, inhalable particulate matter (PM10) can be divided into fine particles (PM2.5) and coarse particles (PMc). Most studies only focused on the health effects of PM2.5, while the effects of PM10 and PMc remain inconclusive.
The previous time-series studies that examined the association between the size-specific particulate matter and the risk of adverse health outcomes often reported the odds ratio or excess risk (ER) estimates per 1 or 10 μg/m3 (11– 13). However, these effect size estimates ignore the underlying statistical distributions of the air pollutants and may not be comparable across the size-specific particulate matter. In this study, we introduced the counterfactual analyses to effectively compare the potential reduction of acute lower respiratory infection (ALRI) hospitalizations (counterfactual outcomes) associated with the size-specific particulate matter (14). These counterfactual outcomes, which accounted for the statistical distributions of air pollutants, can be directly comparable for different particulate matter and, therefore, have more public health implications for policymakers.
In this current study, we investigate the association between the size-specific particulate matter and the outpatient visits of ALRI. Beyond these analyses, we further employed a counterfactual approach to investigate the potential percent reduction of ALRI outpatient visits if the levels of particulate matter were as low as those recommended by the WHO.
Methods
Acute Lower Respiratory Infection Data
This study is a time-series analysis of ALRI outpatient visits from 2013 to 2019 in Guangzhou, China. Data on ALRI-related hospital outpatient visits were retrieved from the Guangdong Second Provincial General Hospital, which is located in the southwest of the city (Figure 1). This is one of the tertiary hospital in Guangzhou (15). According to the International Classification of Diseases, Tenth Revision (ICD-10), hospital outpatient visits with the primary diagnoses of pneumonia (J12-J18), bronchiolitis (J20-J21), and asthma (J45-J46) (16) were obtained between February 2013 and December 2019. We aggregated the three subtypes of ALRI into a series of daily time-series data (17–20).
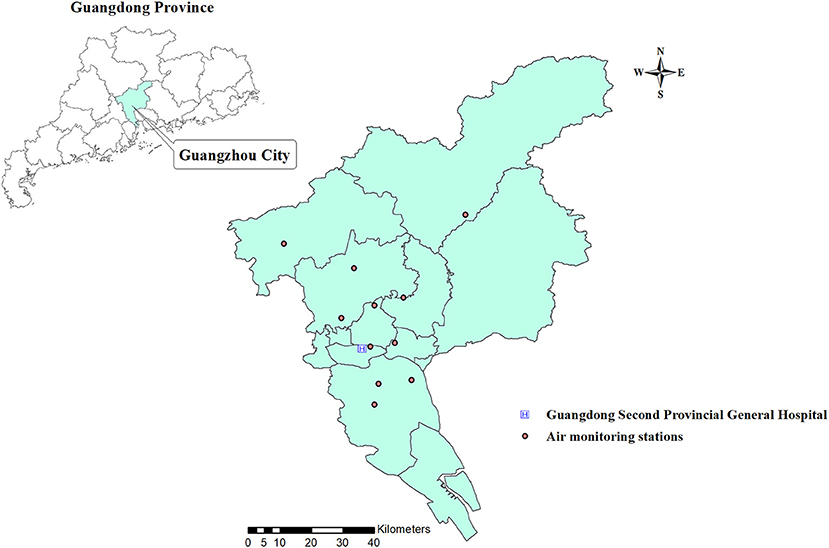
Figure 1. Geographical distribution of the sample hospitals and air monitoring stations.
Air Pollution and Meteorological Data
Daily concentrations of air pollution during the study period were obtained from 11 air monitoring stations in Guangzhou (Figure 1), such as PM10, PMc, PM2.5, nitrogen dioxide (NO2), sulfur dioxide (SO2), and ozone (O3). Following a previous study (19), the PMc concentrations were calculated by the subtracting PM2.5 from PM10, because PM10 consists of PM2.5 and PMc. Details on the measurement of air pollutants have been described previously (21). Approximately 1% of observation days had missing data for air pollutants, and a linear interpolation approach was used to fill in the missing data (the “na.approx” function in “zoo” package in R).
Daily meteorological data (mean temperature and relative humidity [RH]) were obtained from the National Weather Data Sharing System (http://data.cma.cn/). Because there is a potentially high correlation between different air pollutants and meteorological factors, we examined the Pearson correlation coefficients among these variables (22, 23).
Statistical Models
The ALRI data, daily air pollution concentrations, and meteorological data were linked by date. Following similar epidemiologic studies (11, 12), the association between particulate matter and hospital outpatient visits for ALRI was examined using a generalized additive over-dispersed Poisson model (GAM), where the property of over dispersion was tested using the approach proposed by Cameron and Trivedi (24) (Supplementary Table 1). In the model, public holidays (PH) and days of the week (DOW) were adjusted as categorical variables. Seasonal patterns, long-term trends, temperature, and RH were controlled through smoothing splines. Following the approaches used in the previous studies (25, 26), we selected six degrees of freedom (df) per year for temporal trends, a df of six for moving average temperature of the current day and the previous 3 days (Temp03), and RH.
Considering the delayed health effects of air pollutants, we examined the lag effects for different lag structures. We began with the same day (lag0) up to a 5-day lag (lag5) in the single-lag day models. We also considered the accumulated effects of multi-day lags (moving averages for the current day and the previous 1, 2, and 3 days [lag01, lag02, and lag03]).
Stratified Analyses
To evaluate the potential effect modifiers of the particulate matter–ALRI associations, we conducted the stratified analyses by sex (men vs. women), age group (age <5 vs. age 5–14), and season (warm vs cold). The warm season was defined as the period from April to September, and the cold season was from October to March. The 95% CI of the difference between the groups was calculated using the following formula:
where Q represents the estimated coefficient in each stratum, and SE is the corresponding standard error (27). The difference was considered statistically significant if the 95% CI did not include unity.
Counterfactual Analyses on the Burden of ALRI Attributable to Air Pollution
We estimated the burden of ALRI attributable to PM2.5, PMc, and PM10 by calculating the difference between the observed ALRI outpatient visits and the counterfactual visits predicted using well-recognized reference values of particulate matter recommended by the WHO (28) and our previously built generalized additive over-dispersed Poisson models. This difference between the observed and counterfactual ALRI outpatient visits represents the estimated burden of ALRI outpatient visits associated with the size-specific particulate matter. The counterfactual scenarios were set to be hypothetical values of PM2.5 and PM10 set by the recently updated WHO Global Air Quality Guidelines (24 h mean: 15 μg/m3 for PM2.5 and 45 μg/m3 for PM10) (28). However, PMc was not directly regulated by the WHO Air Quality Guidelines, the reference concentration for PMc (30 μg/m3) was defined as the difference between the standard concentrations of PM10 and PM2.5 according to the previous studies (17, 20). The observed air pollution levels lower than the reference values were kept the same in the counterfactual scenario. The 95% CIs were constructed using 1,000 bootstrap replicates with a replacement for each model (29, 30).
Sensitivity Analyses
We applied a series of sensitivity studies to examine the accuracy of the main models. The main findings were assessed by changing the df in the smooth functions for temporal trends and meteorological factors. Additionally, we adjusted for the gaseous air pollutants (SO2, NO2, and O3) in two-pollutant models. The models were regarded as robust if there were no significant changes after df-change or further adjustment for gaseous air pollutants.
In all statistical analyses, a p ≤ 0.05 was considered statistically significant. All data cleaning, aggregation, and visualization, and statistical analyses were performed using the statistical computing environment R version 4.0.5 (31).
Results
Figure 1 presents the geographical location of Guangzhou and the sample hospital, as well as the geographical distribution of the air monitoring stations in Guangzhou. A total of 105,639 pediatric outpatient visits were included in the study, with the following breakdown of cases: 35,310 pneumonia, 68,218 bronchiolitis, and 2,111 asthma. Table 1 shows the summary statistics of ALRI subtypes, size-specific particulate matter (PM10, PMc, and PM2.5), and gaseous pollutants (SO2, NO2, and O3). The daily averages (SD) of pneumonia, bronchiolitis, and asthma cases were 12.5 (9.1), 24.3 (11.5), and 0.8 (1.4), respectively. The mean concentrations of PM10, PMc, and PM2.5 in our study were 58.3, 21.0, and 37.8 μg/m3. The mean (SD) of temperature and relative humidity was 22.8°C (5.9) and 81.8% (10.2%), respectively.
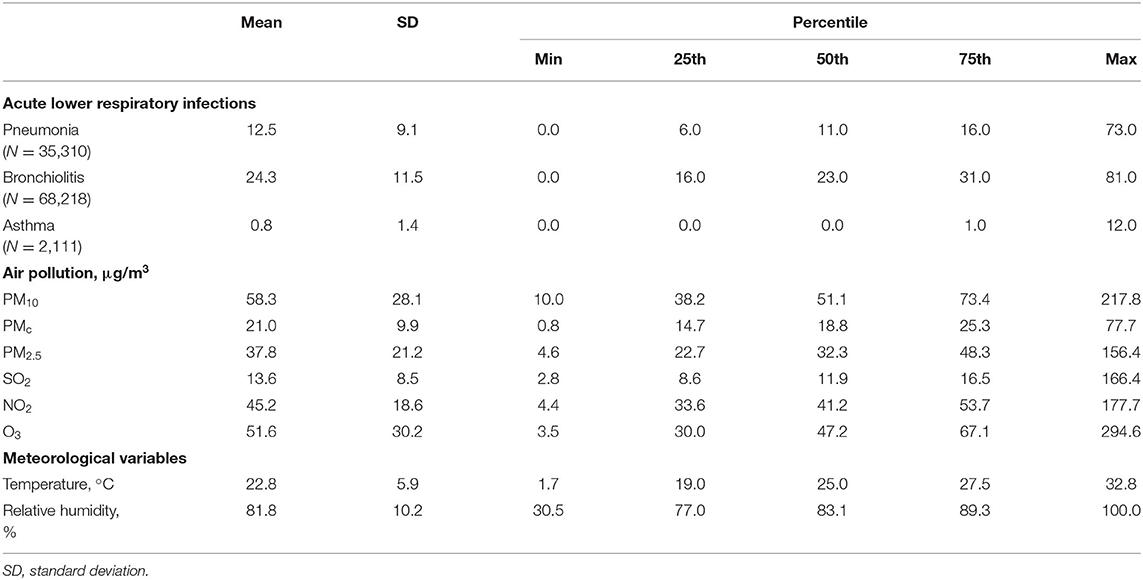
Table 1. Summary statistics of acute lower respiratory infections outpatient visits, air pollutants, and meteorological variables.
Figure 2 shows the correlation plot of the air pollutants and meteorological variables in our sample. All the Pearson's correlation coefficients were statistically significant except for the correlation between NO2 and O3. PM10 was significantly and strongly correlated with PMc and PM2.5 (Pearson's correlation coefficients: 0.81 and 0.93); NO2 was moderately correlated with particulate matters (Pearson's correlation coefficients for PM10, PMc, and PM2.5: 0.78, 0.66, and 0.70). Meteorological variables were negatively correlated with air pollutants except for the positive correlation between temperature and O3.
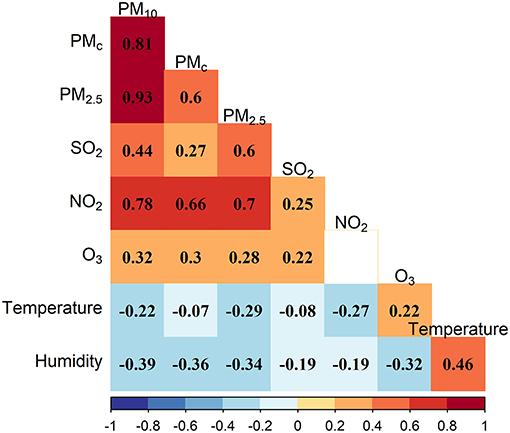
Figure 2. Correlation plot of the air pollutants and meteorological variables.
Table 2 exhibits the ER of pneumonia, bronchiolitis, and asthma outpatient visits associated with per 10 μg/m3 increase in PM2.5, PMc, and PM10 at lag03. The results revealed that size-specific particulate matter were significantly associated with pneumonia, bronchiolitis, and asthma, respectively, in single-pollutant models, where the ER of PMc was the largest, followed by that of PM2.5 and PM10. The results were consistent and robust in two-pollutant models with further adjustment for SO2, NO2, and O3, except for those asthma models controlling for NO2. The corresponding exposure–response non-linear curves for the daily particulate matter and log relative risk are shown in Supplementary Figure 1.
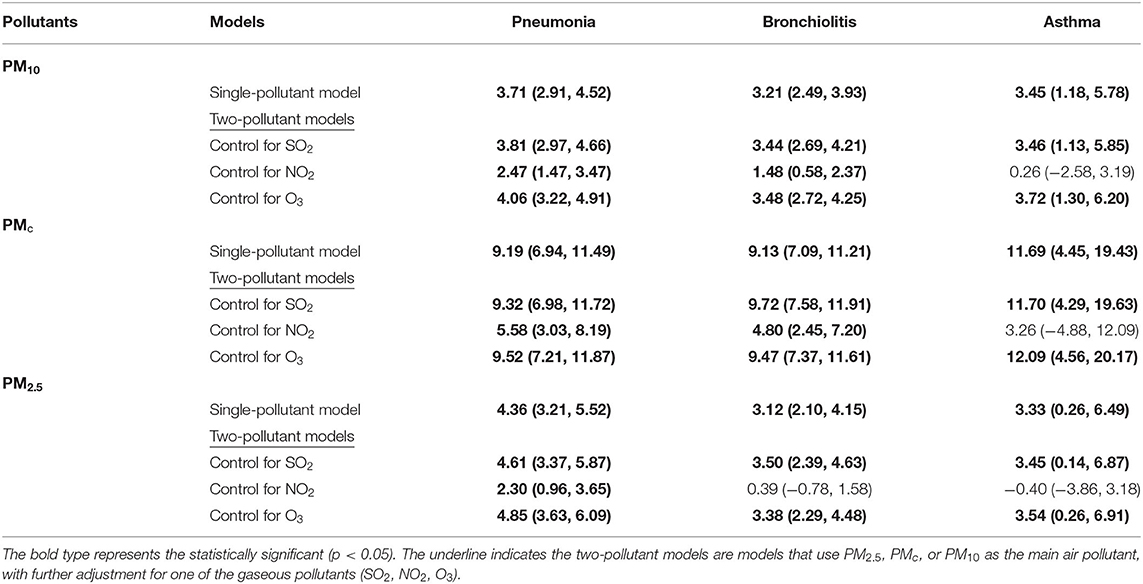
Table 2. Excess risk and 95% CIs of pneumonia, bronchiolitis, and asthma for each 10 μg/m3 increase in PM2.5, PMc, and PM10 using single- and two-pollutants models at lag03.
Similar patterns of ER of ALRI outpatient visits associated with per 10 μg/m3 increase in the size-specific particulate matter could be observed in Figure 3. Each 10 μg/m3 increase in PM2.5, PMc, and PM10 was associated with the outpatient visits for pneumonia, bronchiolitis, and asthma on different lag days. In contrast, the effects of the size-specific particulate matter on asthma are less robust: the moving average lags of PMc, and PM2.5 were still significantly associated with the ALRI outpatient visits, but the effects of lag0 to lag5 of PMc and PM2.5 and different lags of PM10 were non-significant or at borderline significant. Sensitivity analyses using the different degrees of freedom for splines of temporal trends and temperature showed a generally consistent pattern (Supplementary Table 2).
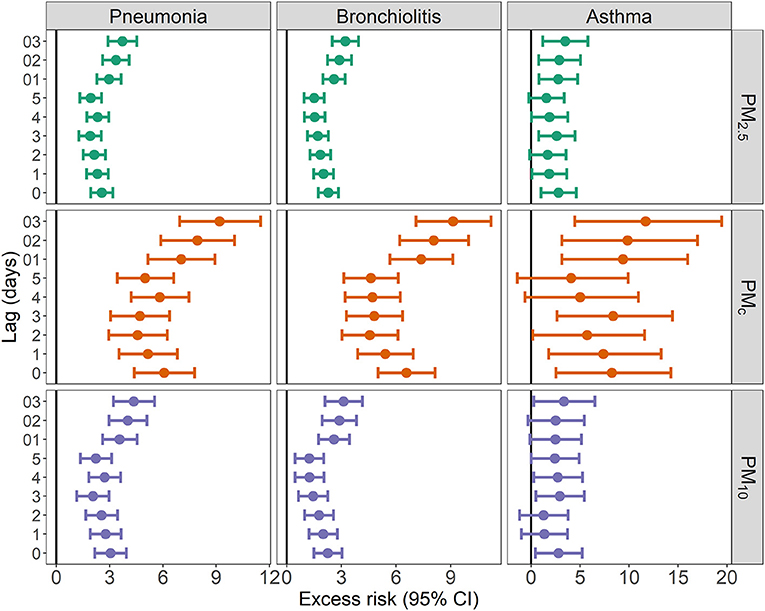
Figure 3. Excess risk (95% CIs) of hospital outpatient visits associated with 10 μg/m3 increase in PM10, PMc, and PM2.5.
Table 3 presents the estimated ER with 95% CI of pneumonia, bronchiolitis, and asthma stratified by sex, age group, and season, where the bold numbers indicate the significant differences across strata. We observed that each 10 μg/m3 increase in PM10, PMc, and PM2.5 was consistently associated with significantly different effects on pneumonia outpatient visits by sex and season groups. Similar differential effects were observed for the bronchiolitis associated with increases in PM10 and PMc by different season strata, but not for PM2.5. However, the differential effects across strata were much less significant for the asthma outpatient visits: it was only significantly different between the warm and cold seasons.
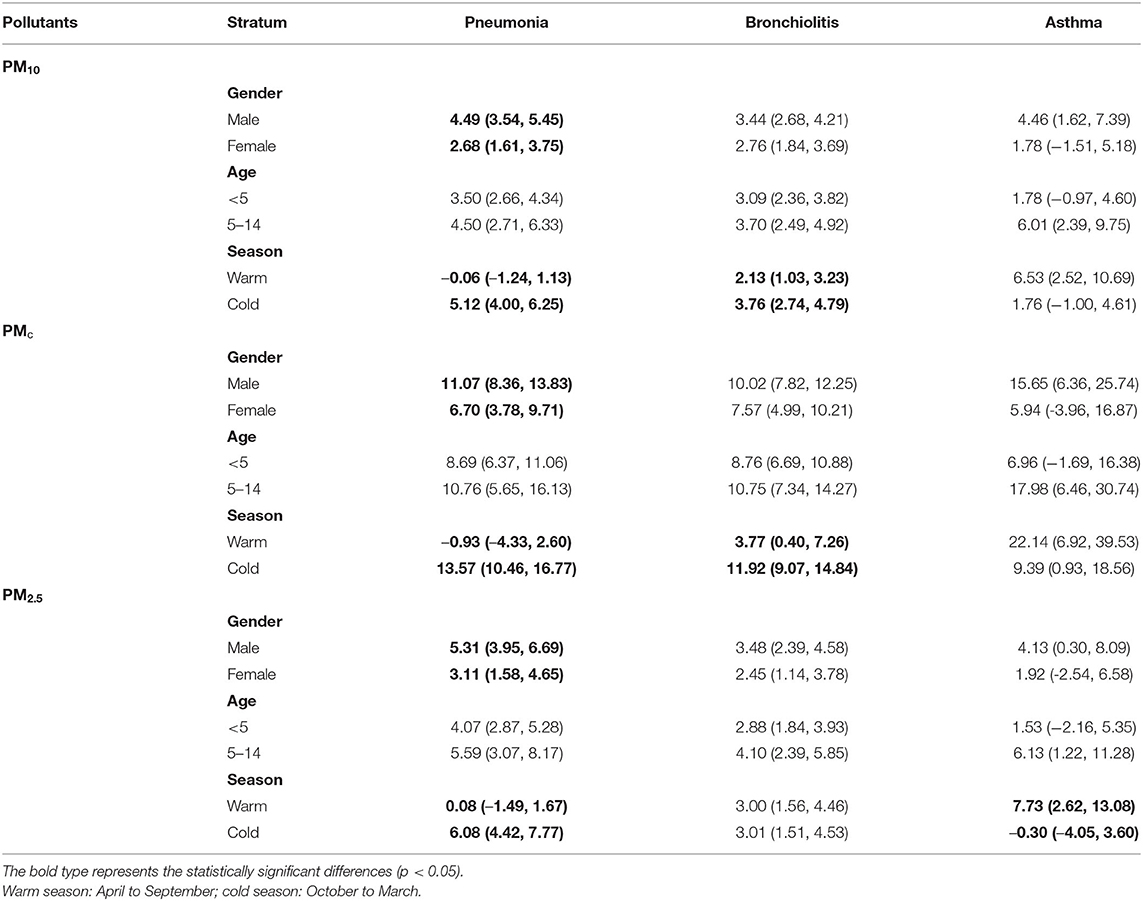
Table 3. Excess risk and 95% CIs of pneumonia, bronchiolitis, and asthma for each 10 μg/m3 increase in PM2.5, PMc, and PM10 stratified by gender, age group, and season.
Table 4 shows the proportion reduction of ALRI (pneumonia, bronchiolitis, and asthma) outpatient visits attributable to PM2.5, PMc, and PM10 in Guangzhou from 2013 to 2019 using a counterfactual analysis framework (15 μg/m3 for PM2.5, 30 μg/m3 for PMc, and 45 μg/m3 for PM10). We found that PM2.5 was associated with the largest decline in ALRI outpatient visits (pneumonia: 11.07%, 95% CI: [7.99, 14.30%]; bronchiolitis: 6.30% [4.17, 8.53%]; asthma: 8.14% [2.65, 14.33%]) if the levels of air pollution were reduced to the level of the reference guidelines.
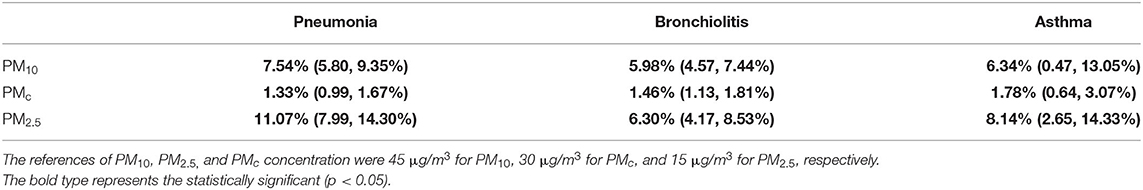
Table 4. Counterfactual analysis on the percent of decline (95% confidence intervals) in acute lower respiratory infection outpatient visits if the level of PM2.5, PMc, and PM10 were reduced to the reference levels in Guangzhou from 2013 to 2019.
Discussion
In this study, we observed statistically significant ERs and a potential decline of ALRI (such as pneumonia, bronchiolitis, and asthma) outpatient visits associated with the size-specific particulate matter. The results were consistent in exposure assessment using different lags (lag 0–5 and moving averages of 1–3 days), two-pollutant models adjusting for SO2, NO2, and O3, and various degrees of freedom. In counterfactual analyses that are of more public health significance, PM2.5 was associated with the largest decline in the ALRI outpatient visits if the exposure was as low as the WHO reference guideline.
Consistent with a previous study (18), we observed dissimilar effect estimates associated with the size-specific particulate matter, and the largest ER was found to be that of PMc, followed by that of PM2.5 and PM10. However, these results should be interpreted with caution as PM2.5, PMc, and PM10 have different means and standard deviations: the mean of PMc in our sample (21.0 μg/m3) was lower than the reference level (30 μg/m3); the SD of PMc (9.9 μg/m3) was much smaller compared with that of PM2.5 (21.2 μg/m3) and PM10 (28.1 μg/m3). Therefore, the ER of ALRI associated with PMc appeared to be the largest, which likely resulted from its smaller SD.
We found a larger effect of particulate matter–ALRI association among men than women, which is similar to the results of the sex-specific effects of particulate matter pollution reported previously (19). This may be due to the biological differences between men and women populations, such as hormones, sizes of airway diameters and lung sizes, and build, which will, in turn, result in the difference in the transport of pollutants and tissue deposition (17, 32). In addition, the observed associations between particulate matter and ALRI were stronger during the cold season, which is in line with the several previous studies (26, 33–35). There are several possible biological mechanisms, such as season-specific behavior, differences in PM2.5 levels, constituent, and etiologic agents, which may be responsible for this seasonal difference.
The effects of particulate matter pollution on ALRI did not seem to be confounded by SO2 and O3. However, the associations between particulate matter pollution and ALRI decreased after adjusting for NO2, in particular, the particulate matter-asthma associations became non-significant. It was difficult to ascertain their potential effects especially given the potential multicollinearity issue, possibly because NO2 was highly correlated with particulate matter (Figure 2).
Given the limitation that the calculation of ER largely depends on the statistical distribution of the exposures, we further examined the potential proportion declination that would occur if exposure to size-specific particulate matter were reduced to the WHO recommended levels (15 μg/m3 for PM2.5, 30 μg/m3 for PMc, and 45 μg/m3 for PM10). Our counterfactual approach calculated the difference between the observed true number of hospitalizations and the estimated number of hospitalizations in counterfactual scenarios (the WHO recommended levels of air pollutants). Because the concentration of air pollutants for each person was input into the statistical models of the counterfactual analysis, this empirical approach is not subject to the underlying statistical distributions of the air pollutants. Our counterfactual analysis suggested that reducing PM2.5 to the WHO reference was associated with the largest potential decline in ALRI outpatient visits, followed closely by the reduction of PM10, while reducing PMc to the WHO reference is associated with the lowest potential for a decline in ALRI outpatient visits, which is likely explained by the fact that the mean level of PMc (21.0 μg/m3) in our sample is lower than that of the WHO reference level (30 μg/m3).
Our counterfactual analysis results have a more practical public health meaning than those of ER. The implication that reducing the level of PM2.5 may be associated with the largest decline in ALRI outpatient visits is consistent with the previous studies reporting about the toxicity of smaller-sized particulate matter on lower respiratory infection hospitalizations (36–40). For example, Wang et al. specifically focused on the association between the size-specific particulate matter and childhood pneumonia, and they reported a graded impact of the size-specific particulate matter on the childhood pneumonia (PM1 > PM2.5 > PM10). Smaller-sized particulate matter is more likely to enter the smaller airways and cause severe health consequences.
Although the air quality has been substantially improved attributable to the effort of air quality management in China over the past decade (41, 42). The average level of particulate matter (especially PM2.5 and PM10) is still above the WHO recommended level. Northern Chinese cities with the high population densities can experience anomalously high levels of air pollution during the winter (43). Our results highlight the importance of focusing on the smaller-sized particulate matter due to its harmful effects on ALRI outpatient visits.
This study should be interpreted in view of several limitations. First, we used daily aggregated data to evaluate the short-term effect of particulate matter on health outcomes, but this aggregated nature of data could be subject to ecological bias. Second, a city-wide average concentrations of air pollution was used to represent the population exposure level, which could lead to exposure misclassification. Third, we included a relatively small number of asthma outpatient visits, which led to unstable point estimates and CIs for asthma. Fourth, since we used secondary data collected from the hospital administrative database, some important confounders (such as maternal smoking, prenatal care, and BMI) were not available to us. Lastly, we only used data from a single hospital, which limits the applicability of the results to the other regions of China.
Nonetheless, this study has several strengths. First, this is the first study to investigate the association between the size-specific particulate matter and subtypes of ALRI outpatient visits, while previous studies either reported the association between PM2.5 and subtypes of ALRI outpatient visits or the association between the size-specific particulate matter and overall ALRI hospitalization without details on subtypes (5–7). Second, we used the counterfactual analyses to estimate the potential percent reduction in ALRI outpatient visits compared with the WHO-recommended levels. The results of counterfactual analyses have more substantial public health significance compared with ER, OR, and any other estimates associated with a fixed amount of increase in particulate matter (such as per 10 μg/m3 increase in PM2.5) (11–13).
Conclusions
In summary, this study suggests a larger potential percent of the reduction in ALRI outpatient visits if PM2.5 could be lowered to the levels recommended by the WHO. The association between particulate matter and pneumonia outpatient visits was stronger among men patients and in the cold seasons. The results highlight the need for a consolidated effort to reduce the particulate matter pollution of smaller sizes and consequently improve the health outcomes of residents in China.
Data Availability Statement
The data analyzed in this study is subject to the following licenses/restrictions: Ownership of the data does not belong to the individual. Requests to access these datasets should be directed to Chuming You, gd2hek@163.com.
Author Contributions
ZL: conceptualization, investigation, visualization, writing—original draft, writing—reviewing, and editing. QM: investigation, visualization, and funding acquisition. QY and NC: investigation, writing—reviewing, and editing. CY: investigation, visualization, supervision, and project administration. All authors contributed to the article and approved the submitted version.
Funding
This study was supported by the Science Foundation of Guangdong Second Provincial General Hospital (2021BSGZ001).
Conflict of Interest
The authors declare that the research was conducted in the absence of any commercial or financial relationships that could be construed as a potential conflict of interest.
Publisher's Note
All claims expressed in this article are solely those of the authors and do not necessarily represent those of their affiliated organizations, or those of the publisher, the editors and the reviewers. Any product that may be evaluated in this article, or claim that may be made by its manufacturer, is not guaranteed or endorsed by the publisher.
Acknowledgments
The authors thank the Chinese Meteorological Data Sharing Service System for providing the meteorological data used in this study.
Supplementary Material
The Supplementary Material for this article can be found online at: https://www.frontiersin.org/articles/10.3389/fpubh.2021.789542/full#supplementary-material
References
1. G. B. D. Causes of Death Collaborators. Global, regional, and national age-sex specific mortality for 264 causes of death, 1980-2016: a systematic analysis for the Global Burden of Disease Study 2016. Lancet. (2017) 390:1151–210. doi: 10.1016/S0140-6736(17)32152-9
2. G. B. D. Lower Respiratory Infections Collaborators. Estimates of the global, regional, and national morbidity, mortality, and aetiologies of lower respiratory infections in 195 countries, 1990-2016: a systematic analysis for the Global Burden of Disease Study 2016. Lancet Infect Dis. (2018) 18:1191–210. doi: 10.1016/S1473-3099(18)30310-4
3. World Health Organization. End Preventable Deaths: Global Action Plan for Prevention and Control of Pneumonia and Diarrhea. France: UNICEF (2013).
4. Ruan Z, Qi J, Qian ZM, Zhou M, Yang Y, Zhang S, et al. Disease burden and attributable risk factors of respiratory infections in China from 1990 to 2019. Lancet Reg Health West Pac. (2021) 11:100153. doi: 10.1016/j.lanwpc.2021.100153
5. Mehta S, Shin H, Burnett R, North T, Cohen AJ. Ambient particulate air pollution and acute lower respiratory infections: a systematic review and implications for estimating the global burden of disease. Air Qual Atmos Health. (2013) 6:69–83. doi: 10.1007/s11869-011-0146-3
6. Johnston FH, Salimi F, Williamson GJ, Henderson SB, Yao J, Dennekamp M, et al. Ambient particulate matter and paramedic assessments of acute diabetic, cardiovascular, and respiratory conditions. Epidemiology. (2019) 30:11–9. doi: 10.1097/EDE.0000000000000929
7. Burnett RT, Pope CA 3rd, Ezzati M, Olives C, Lim SS, Mehta S, et al. An integrated risk function for estimating the global burden of disease attributable to ambient fine particulate matter exposure. Environ Health Perspect. (2014) 122:397–403. doi: 10.1289/ehp.1307049
8. Kurmi OP, Lam KB, Ayres JG. Indoor air pollution and the lung in low- and medium-income countries. Eur Respir J. (2012) 40:239–54. doi: 10.1183/09031936.00190211
9. Horne BD, Joy EA, Hofmann MG, Gesteland PH, Cannon JB, Lefler JS, et al. Short-term elevation of fine particulate matter air pollution and acute lower respiratory infection. Am J Respir Crit Care Med. (2018) 198:759–66. doi: 10.1164/rccm.201709-1883OC
10. Gurley ES, Salje H, Homaira N, Ram PK, Haque R, Petri WA, et al. Indoor exposure to particulate matter and age at first acute lower respiratory infection in a low-income urban community in Bangladesh. Am J Epidemiol. (2014) 179:967–73. doi: 10.1093/aje/kwu002
11. Chen R, Yang J, Chen D, Liu WJ, Zhang C, Wang H, et al. Air pollution and hospital outpatient visits for conjunctivitis: a time-series analysis in Tai'an, China. Environ Sci Pollut Res Int. (2021) 28:15453–61. doi: 10.1007/s11356-020-11762-4
12. Ai S, Wang C, Qian ZM, Cui Y, Liu Y, Acharya BK, et al. Hourly associations between ambient air pollution and emergency ambulance calls in one central Chinese city: Implications for hourly air quality standards. The Science of the total environment. (2019) 696:133956. doi: 10.1016/j.scitotenv.2019.133956
13. Liu C, Chen R, Sera F, Vicedo-Cabrera AM, Guo Y, Tong S, et al. Ambient particulate air pollution and daily mortality in 652 cities. N Engl J Med. (2019) 381:705–15. doi: 10.1056/NEJMoa1817364
14. Hashem Pesaran M, Smith RP. Counterfactual analysis in macroeconometrics: An empirical investigation into the effects of quantitative easing. Res Econ. (2016) 70:262–80. doi: 10.1016/j.rie.2016.01.004
15. Cai M, Liu E, Tao H, Qian Z, Lin X, Cheng Z. Does level of hospital matter? A study of mortality of acute myocardial infarction patients in Shanxi, China. Am J Med Qual. (2018) 33:185–92. doi: 10.1177/1062860617708608
16. Cai M, Xie Y, Bowe B, Gibson AK, Zayed MA, Li T, et al. Temporal trends in incidence rates of lower extremity amputation and associated risk factors among patients using veterans health administration services from 2008 to 2018. JAMA Netw Open. (2021) 4:e2033953. doi: 10.1001/jamanetworkopen.2020.33953
17. Wang X, Leng M, Liu Y, Qian ZM, Zhang J, Li Z, et al. Different sized particles associated with all-cause and cause-specific emergency ambulance calls: A multicity time-series analysis in China. Sci Total Environ. (2021) 783:147060. doi: 10.1016/j.scitotenv.2021.147060
18. Wang X, Qian Z, Wang X, Hong H, Yang Y, Xu Y, et al. Estimating the acute effects of fine and coarse particle pollution on stroke mortality of in six Chinese subtropical cities. Environ Pollut. (2018) 239:812–7. doi: 10.1016/j.envpol.2018.04.102
19. Wang X, Tian J, Li Z, Lai J, Huang X, He Y, et al. Relationship between different particle size fractions and all-cause and cause-specific emergency ambulance dispatches. Environ Health. (2020) 19:69. doi: 10.1186/s12940-020-00619-5
20. Zhao Y, Wang S, Lang L, Huang C, Ma W, Lin H. Ambient fine and coarse particulate matter pollution and respiratory morbidity in Dongguan, China. Environ Pollut. (2017) 222:126–31. doi: 10.1016/j.envpol.2016.12.070
21. Wang X, Zhang L, Yao Z, Ai S, Qian ZM, Wang H, et al. Ambient coarse particulate pollution and mortality in three Chinese cities: Association and attributable mortality burden. Sci Total Environ. (2018) 628–9:1037–42. doi: 10.1016/j.scitotenv.2018.02.100
22. Cai M, Yazdi MAA, Mehdizadeh A, Hu Q, Vinel A, Davis K, et al. The association between crashes and safety-critical events: Synthesized evidence from crash reports and naturalistic driving data among commercial truck drivers. Transport Res Part C: Emerg Technol. (2021) 126:103016. doi: 10.1016/j.trc.2021.103016
23. Revelle W, Condon DM, Wilt J, French JA, Brown A, Elleman LG. Web and Phone Based Data Collection Using Planned Missing Designs. Sage Handbook of Online Research Methods. Thousand Oaks, CA: Sage Publications, Inc (2016). doi: 10.4135/9781473957992.n33
24. Cameron AC, Trivedi PK. Regression-based tests for overdispersion in the Poisson model. J Econometri. (1990) 46:347–64. doi: 10.1016/0304-4076(90)90014-K
25. Lin H, Liu T, Xiao J, Zeng W, Li X, Guo L, et al. Mortality burden of ambient fine particulate air pollution in six Chinese cities: Results from the Pearl River Delta study. Environ Int. (2016) 96:91–7. doi: 10.1016/j.envint.2016.09.007
26. Nhung NTT, Schindler C, Dien TM, Probst-Hensch N, Perez L, Kunzli N. Acute effects of ambient air pollution on lower respiratory infections in Hanoi children: An eight-year time series study. Environ Int. (2018) 110:139–48. doi: 10.1016/j.envint.2017.10.024
27. Zeka A, Zanobetti A, Schwartz J. Individual-level modifiers of the effects of particulate matter on daily mortality. Am J Epidemiol. (2006) 163:849–59. doi: 10.1093/aje/kwj116
28. World Health O. WHO Global Air Quality Guidelines: Particulate Matter (PM2.5 and PM10), Ozone, Nitrogen Dioxide, Sulfur Dioxide and Carbon Monoxide. Geneva: World Health Organization (2021).
29. Davison AC, Hinkley DV. Bootstrap Methods and Their Application. Cambridge: Cambridge university press (1997). doi: 10.1017/CBO9780511802843
30. Cai M, Liu E, Zhang R, Lin X, Rigdon SE, Qian Z, et al. Comparing the performance of charlson and elixhauser comorbidity indices to predict in-hospital mortality among a Chinese population. Clin Epidemiol. (2020) 12:307–16. doi: 10.2147/CLEP.S241610
32. Shin HH, Parajuli RP, Gogna P, Maquiling A, Dehghani P. Pollutant-sex specific differences in respiratory hospitalization and mortality risk attributable to short-term exposure to ambient air pollution. Sci Total Environ. (2021) 755:143135. doi: 10.1016/j.scitotenv.2020.143135
33. Cheng J, Su H, Xu Z. Intraday effects of outdoor air pollution on acute upper and lower respiratory infections in Australian children. Environ Pollut. (2021) 268:115698. doi: 10.1016/j.envpol.2020.115698
34. Barnett AG, Williams GM, Schwartz J, Neller AH, Best TL, Petroeschevsky AL, et al. Air pollution and child respiratory health: a case-crossover study in Australia and New Zealand. Am J Respir Crit Care Med. (2005) 171:1272–8. doi: 10.1164/rccm.200411-1586OC
35. Nhung NTT, Schindler C, Dien TM, Probst-Hensch N, Kunzli N. Association of ambient air pollution with lengths of hospital stay for hanoi children with acute lower-respiratory infection, 2007-2016. Environ Pollut. (2019) 247:752–62. doi: 10.1016/j.envpol.2019.01.115
36. Virani SS, Alonso A, Aparicio HJ, Benjamin EJ, Bittencourt MS, Callaway CW, et al. Heart disease and stroke statistics-2021 update: a report from the American Heart Association. Circulation. (2021) 143:e254–743. doi: 10.1161/CIR.0000000000000950
37. Pu X, Wang L, Chen L, Pan J, Tang L, Wen J, et al. Differential effects of size-specific particulate matter on lower respiratory infections in children: A multi-city time-series analysis in Sichuan, China. Environ Res. (2021) 193:110581. doi: 10.1016/j.envres.2020.110581
38. Tian Y, Liu H, Wu Y, Si Y, Li M, Wu Y, et al. Ambient particulate matter pollution and adult hospital admissions for pneumonia in urban China: A national time series analysis for 2014 through (2017). PLoS Med. (2019) 16:e1003010. doi: 10.1371/journal.pmed.1003010
39. Li D, Wang JB, Zhang ZY, Shen P, Zheng PW, Jin MJ, et al. Effects of air pollution on hospital visits for pneumonia in children: a two-year analysis from China. Environ Sci Pollut Res Int. (2018) 25:10049–57. doi: 10.1007/s11356-018-1192-2
40. Cheng CY, Cheng SY, Chen CC, Pan HY, Wu KH, Cheng FJ. Ambient air pollution is associated with pediatric pneumonia: a time-stratified case-crossover study in an urban area. Environ Health. (2019) 18:77. doi: 10.1186/s12940-019-0520-4
41. Zhang Q, Zheng Y, Tong D, Shao M, Wang S, Zhang Y, et al. Drivers of improved PM2.5 air quality in China from 2013 to 2017. Proc Natl Acad Sci USA. (2019) 116:24463–9. doi: 10.1073/pnas.1907956116
42. Lu X, Zhang S, Xing J, Wang Y, Chen W, Ding D, et al. Progress of air pollution control in China and its challenges and opportunities in the ecological civilization era. Engineering. (2020) 6:1423–31. doi: 10.1016/j.eng.2020.03.014
Keywords: particulate matter, lower respiratory infection, particle, China, children
Citation: Liang Z, Meng Q, Yang Q, Chen N and You C (2021) Size-Specific Particulate Matter Associated With Acute Lower Respiratory Infection Outpatient Visits in Children: A Counterfactual Analysis in Guangzhou, China. Front. Public Health 9:789542. doi: 10.3389/fpubh.2021.789542
Received: 05 October 2021; Accepted: 01 November 2021;
Published: 02 December 2021.
Edited by:
Yunquan Zhang, Wuhan University of Science and Technology, ChinaReviewed by:
Zengliang Ruan, Southeast University, ChinaBehzad Heibati, University of Oulu, Finland
Copyright © 2021 Liang, Meng, Yang, Chen and You. This is an open-access article distributed under the terms of the Creative Commons Attribution License (CC BY). The use, distribution or reproduction in other forums is permitted, provided the original author(s) and the copyright owner(s) are credited and that the original publication in this journal is cited, in accordance with accepted academic practice. No use, distribution or reproduction is permitted which does not comply with these terms.
*Correspondence: Chuming You, gd2hek@163.com