 Efat Mohamadi1
 Mohammad Mehdi Kiani1,2Alireza Olyaeemanesh1,3*
 Amirhossein Takian1,2,4*Reza Majdzadeh5Farhad Hosseinzadeh Lotfi6Hamid Sharafi6Haniye Sadat Sajadi7,8Zahra Goodarzi3Somayeh Noori Hekmat9
- 1Health Equity Research Center (HERC), Tehran University of Medical Sciences (TUMS), Tehran, Iran
- 2Department of Health Management and Economics, School of Public Health, Tehran University of Medical Sciences (TUMS), Tehran, Iran
- 3National Institute of Health Research, Tehran University of Medical Sciences (TUMS), Tehran, Iran
- 4Department of Global Health and Public Policy, School of Public Health, Tehran University of Medical Sciences (TUMS), Tehran, Iran
- 5Community Based Participatory Research Centre and Knowledge Utilization Research Center, Tehran University of Medical Sciences (TUMS), Tehran, Iran
- 6Department of Mathematics, Science and Research Branch, Islamic Azad University, Tehran, Iran
- 7Knowledge Utilization Research Center, Tehran University of Medical Sciences, Tehran, Iran
- 8University Research and Development Center, Tehran University of Medical Sciences, Tehran, Iran
- 9Research Center for Health Services Management, Institute for Futures Studies in Health, Kerman University of Medical Sciences, Kerman, Iran
Background: Measuring the efficiency and productivity of hospitals is a key tool to cost contamination and management that is very important for any healthcare system for having an efficient system.
Objective: The purpose of this study is to examine the effects of contextual factors on hospital efficiency in Iranian public hospitals.
Methods: This was a quantitative and descriptive-analytical study conducted in two steps. First, we measured the efficiency score of teaching and non-teaching hospitals by using the Data Envelopment Analysis (DEA) method. Second, the relationship between efficiency score and contextual factors was analyzed. We used median statistics (first and third quarters) to describe the concentration and distribution of each variable in teaching and non-teaching hospitals, then the Wilcoxon test was used to compare them. The Spearman test was used to evaluate the correlation between the efficiency of hospitals and contextual variables (province area, province population, population density, and the number of beds per hospital).
Results: On average, the efficiency score in non-teaching hospitals in 31 provinces was 0.67 and for teaching hospitals was 0.54. Results showed that there is no significant relationship between the efficiency score and the number of hospitals in the provinces (p = 0.1 and 0.15, respectively). The relationship between the number of hospitals and the population of the province was significant and positive. Also, there was a positive relationship between the number of beds and the area of the province in both types of teaching and non-teaching hospitals.
Conclusion: Multilateral factors influence the efficiency of hospitals and to address hospital inefficiency multi-intervention packages focusing on the hospital and its context should be developed. It is necessary to pay attention to contextual factors and organizational architecture to improve efficiency.
Introduction
Health promotion and response to the demands of people and society is the main mission of the health system (1). In this regard, hospitals, as the main facilities for health services, have a special role in the health system (2). Further, a hospital is a very complex social organization that plays a significant role in the maintenance and promotion of health but provides such complex and specialized services which are also expensive (3).
Hospital expenditures represent around 30–80% of the total health expenditures in all high and low-middle income countries (4). Therefore, assessing the efficiency and productivity of hospitals is a key tool to cost contamination and management that is important for any healthcare system due to having an efficient system. That is why one of the middle goals of the health systems is the improvement of efficiency (5, 6). Because of that, health policymakers measure the efficiency of hospitals to achieve an efficient health system.
There are many studies that have been conducted on the efficiency measurement using the Data Envelopment Analysis (DEA) approach in different contexts and countries, for example, studies of Ersoy et al. (7), which were among the first efforts in the field of efficiency analysis using the DEA technique. Kirigia et al. (8), Ramanathan (9), Ghaderi et al. (10), Mohammadi et al. (11), and Azad et al. (12) have used the frontier data analysis method to evaluate the efficiency of hospitals. Some studies have used the DEA method by applying and promoting this method. For example, in the study of Manh-TrungPhung et al., applying a new DEA modeling technique to be demonstrated in managerial implications can improve the efficiency of the system (13). Another study proposes the Multi-Objective Programming (MOP) method for solving network DEA (NDEA) models. Kao et al. (14) apply the idea of cross-evaluation, which has been demonstrated to be an effective approach in ranking Decision Making Units (DMUs) for systems considered as a whole-unit to measure the efficiency of the two basic structures of network systems, namely, series and parallel (15). Also, Kao et al. propose a general slack-based measure (SBM) model for network systems and can decompose the system efficiency into a weighted average of the process efficiencies (16).
There are abounding variables that affect hospital efficiency. These variables are considered input and output variables to measure efficiency. Nevertheless, the impact of contextual factors (i.e., the population covered by the hospital, type of hospitals, management of hospitals, and qualitative variables) on hospital efficiency as external determinants are rarely paid attention in efficiency measurement. In contrast to most previous studies that have focused primarily on examining the impacts of inputs (number of physicians, nurses, money, etc.) on technical efficiency, this study also investigates the effect of contextual and environmental factors on hospital efficiency.
We conducted this study on the Iran health system. Iran is an ancient country located in the Middle East, a region between Asia, Europe, and Africa. The area of Iran is 1,648,195 km2, which makes it the 17th largest country in the world. Iran is divided into 31 provinces and 336 districts. The Ministry of Health and Medical Education (MOHME) is the stewardship of heath in Iran. All hospitals are regulated under the supervision of the MOHME. There are 921 active hospitals in the country, 80% of them are public (Governmental) and 20% are non-public hospitals. Governmental hospitals are divided into three categories: Medical-Non-Teaching hospitals, Medical-Teaching hospitals, and Medical-Teaching-Research hospitals.
In this study, we assume that contextual factors have an important role in hospitals that can affect hospital efficiency. The idea that contextual or environmental factors have a significant role in explaining the deviation of actual values from the frontier, has long been an underlying motivation in frontier models in production economics. The results of this study lead to a better understanding of the relationship between contextual factors. In addition, determining their interactions can help efficient policymaking to improve hospital efficiency. Therefore, the purpose of this study is to examine the effects of contextual factors on hospital efficiency in Iranian public hospitals.
Methods
This was a quantitative and descriptive-analytical study that was conducted in two steps. First, we measured the efficiency score for teaching and non-teaching hospitals. Second, the relationship between efficiency score and contextual factors was analyzed.
Data Collection
According to the purpose of the study, we had two categories of data, namely, data related to measuring the efficiency of hospitals and data related to contextual variables. For measuring hospital efficiency, we conducted a qualitative analysis, i.e., literature review and collecting opinions of experts to identify the input and output indicators. First, a scoping review of related studies identified a list of related indicators for the objectives of our research (17). Second, we examined the existence of data associated with each indicator and the reliability of the data source, according to which, many indicators were excluded. Finally, the included indicators were reviewed and approved by an expert panel, comprising of the research team plus selected key informants in the field of health management, policy, and economics.
We considered data of all the Iranian Medical and Non-teaching and Medical and teaching hospitals affiliated with MOHME. There were 577 active hospitals in these categories that were scattered across 31 provinces in Iran. We extracted data from secondary databases linked to the health information system (HIS) of MOHME in 2016. We used a checklist for data collection that was designed based on the input and output variables. An Excel sheet was used to enter the data as “Decision Making Units (DMUs)” for all teaching and non-teaching public hospitals. We then cleaned up the data to ensure the existence and accuracy of all data for each indicator per DMU. Irregular data was compared with other sources to ensure data integrity. Data collection and cleaning lasted 6 months.
For analyzing the impact of contextual factors affecting hospital efficiency, we determined some contextual variables: number of hospitals in the province, area of the province, population of the province, population density, and number of beds per hospital by type of hospital. The data source of this step included the HIS and Iran Statistics Center Database. Data was gathered for 2016.
Data Analysis
We considered each hospital as a DMU while hospitals were categorized into various specialty groups and Extended Data Envelopment Analysis (EDEA) models were independently implemented to each categorization.
We considered 4 input and 7 output for measuring the efficiency of hospitals. We use the following symbols to show the values of inputs and outputs of the hospital j (j = 1…, n).
As described above, we determined the inputs and outputs for each hospital for modeling as Table 1:
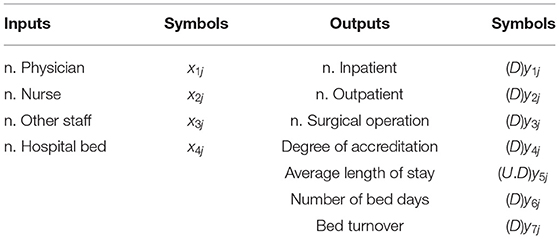
Table 1. Inputs and outputs for each hospital.
Symbols D and U.D are desirable and undesirable, respectively. In other words, an increase of desirable outputs is considered by management which improves productivity. However, the undesirable outputs are not considered by the manager which has an adverse effect on productivity. Since the fifth output (Average length of stay) is undesirable. We make the following changes to make it a desirable output.
As we mentioned in the method, given the definitions of each input and output, the following constraints are taken for them based on the opinions of experts.
Relationships (2) show the relative weight of indicators. For example, the importance of the seventh output is at least equal to the first output, and the importance of the first input to the second input is at least 1.3. Since the design of this research requires a restriction, the modeling is done in envelopment form. Therefore, constraints (2) appear in a trade-off in the envelopment form with symbols α and β. Also, the variables γ and μ correspond to this trade-off in envelopment form.
On the other hand, the sixth output is expressed as a “percentage,” so its value must always be between [0, 100]. Therefore, the following constraints are considered in the modeling.
The number of bed days is also dependent on the number of beds, which is why the following model constraints are considered in the modeling.
According to the above description, the radial model in the envelopment form, taking into according to the trade-off and limitations on the template, will be as follows:
The final model to calculate the relative efficiency of hospital p can be found by solving the model hereunder:
The optimal value of the objective function of the model (5) can be denoted as a relative efficiency of hospital p. It is obvious that if the optimal value of the objective function of the model (3) is equivalent to 1, then hospital p is efficient. Similarly, if the optimal value of the objective function of the model (3) is <1, then the hospital p can be called as being inefficient. Data were analyzed through GAMS software 24.3.
In the second step of the study, we used median statistics (first and third quarters) to describe the concentration and distribution of each variable in teaching and non-teaching hospitals. Then, the Wilcoxon test was used to compare them. The Spearman test was used to evaluate the correlation between the efficiency of hospitals and contextual variables (province area, province population, population density, and the number of beds per hospital in 31 provinces). In addition, the spline smoothing (with strong regression) was added in the data distribution chart to give a better description of the relationship between the variables (especially in outlier data). In all tests, a significance level of 0.05 was considered. Data were analyzed using R software 4.0.2.
Results
The descriptive statistics of inputs, outputs, and explanatory variables are shown in Tables 2, 3. We summarized the efficiency score of hospitals in Table 4. Tables 5, 6 show the efficiency score of the general and specialized hospitals during 2012–2016 in Iran.
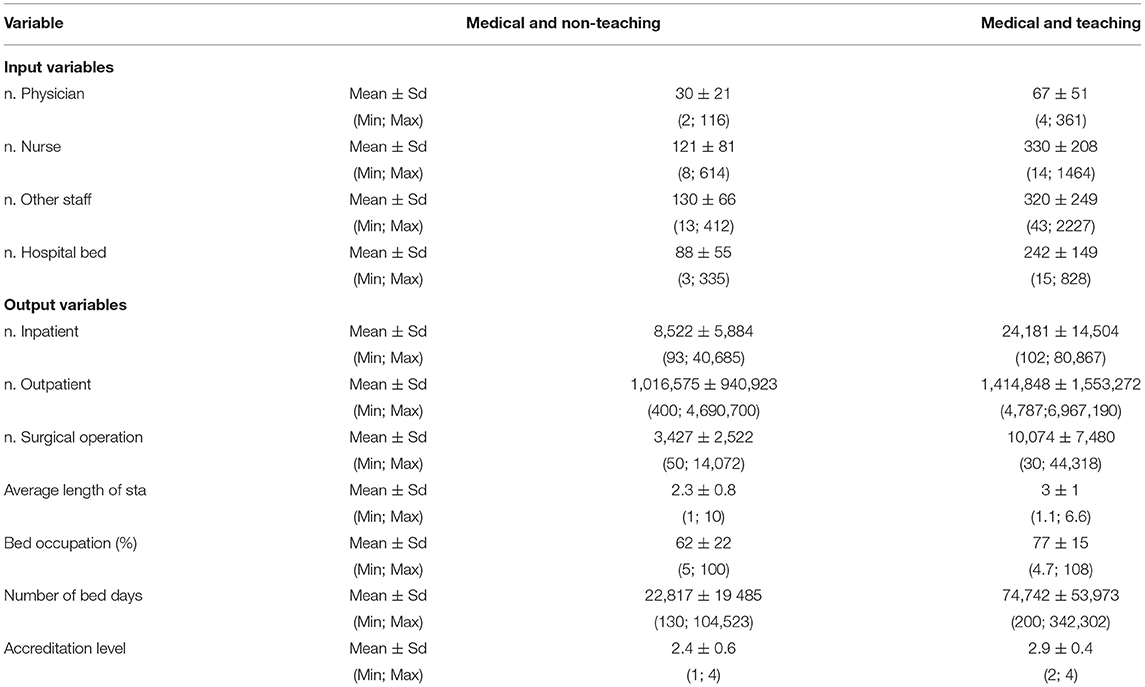
Table 2. Descriptive statistics of inputs and Output variables to measure efficiency.
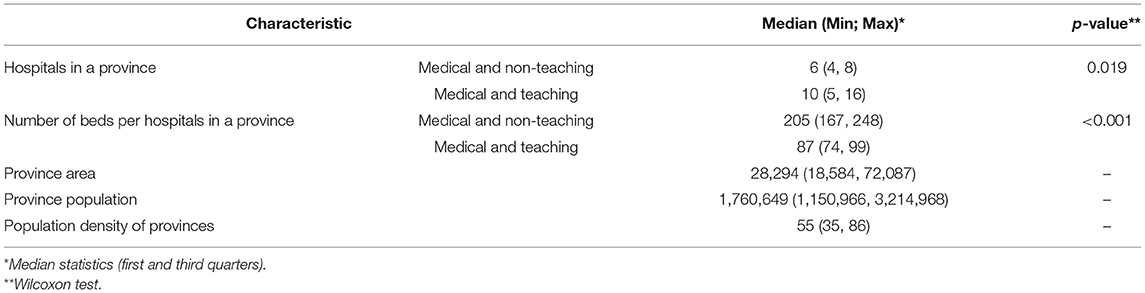
Table 3. Descriptive statistics and comparison of variables between educational and non-educational hospitals.
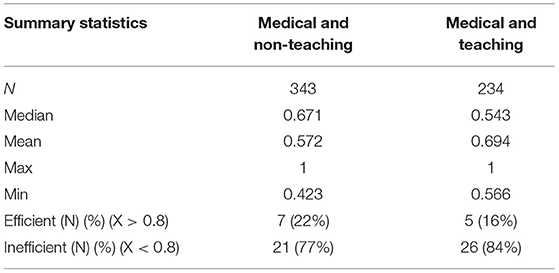
Table 4. Overall efficiency results.
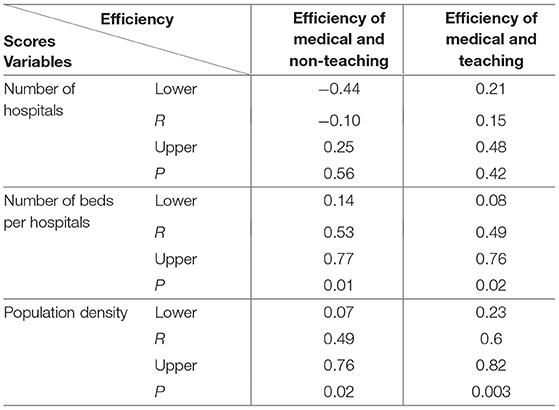
Table 5. The relationship between efficiency score and contextual variables.
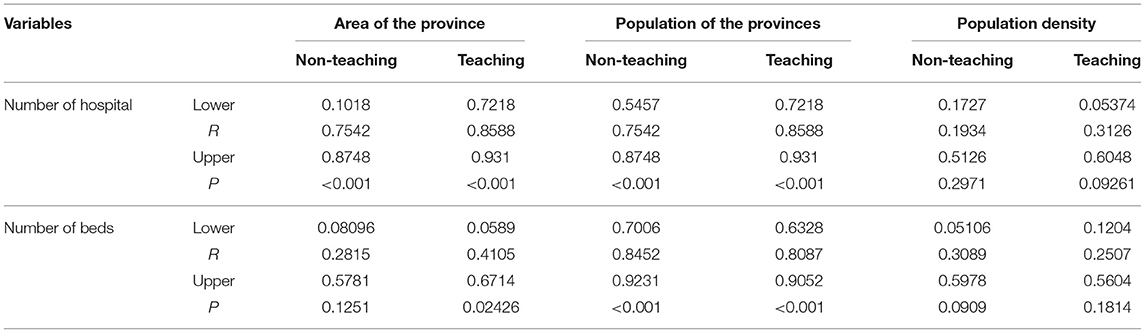
Table 6. The relationship between number of hospitals/number of beds with contextual factors.
Based on findings, the mean of beds in Medical and Non- teaching hospitals is 88 (SD = 55), which is lower than beds in Medical and teaching hospitals (242 ± 149). The input and output variables in Medical and teaching hospitals are higher than in Medical and Non-teaching hospitals (Table 2).
According to the data collected from 31 provinces, the average number of beds in non-teaching hospitals was higher than in teaching hospitals. However, this difference was not statistically significant (p = 0.083). Also, 75% of the provinces have between 4 and 8 Medical and Non-teaching hospitals and 5–16 Medical and teaching hospitals (Table 3).
Efficiency Score
On average, the efficiency score in non-teaching hospitals in 31 provinces was 0.67, and for teaching hospitals was 0.54. Results showed that the efficiency of non-teaching hospitals is significantly higher than that of teaching hospitals. In addition, it can be said that 75% of the non-teaching hospitals in the provinces have an efficiency score between 0.64 and 0.70. While the efficiency score for 75% of teaching hospitals is between 0.51 and 0.63 (Table 3).
The Relationship Between Efficiency Score and Contextual Variables
According to the findings, there is no significant relationship between the efficiency score and the number of hospitals in any of the teaching and non-teaching hospitals in the provinces (p = 0.1 and 0.15, respectively). But it can be said that there is a significant relationship between efficiency score and bed number between provinces (p = 0.01, p = 0.02). Also, there is a significant relationship between efficiency score and population density of provinces (p = 0.02, p = 0.003) (Table 5).
According to the findings, the relationship between the number of hospitals and the population of the province is significant and positive. Also, generally, it can be said that the provinces with higher populations have more hospitals. According to the results, it can be said that the relationship between the number of hospitals and the population density of the province is positive. In addition, the intensity of the relationship between the number of hospitals and population density is higher for teaching hospitals (Table 6).
According to Spearman's correlation test, the relationship between the number of beds and the area of the province in both types of teaching and non-teaching hospitals is positive. Although this relationship is not significant in Non-teaching hospitals (p = 0.125), it is significant in teaching hospitals (Table 6).
According to Spearman's correlation test, the relationship between the number of beds and the population of the province is positive and significant. These results can be seen in the distribution charts. With these results, it cannot be claimed that population growth has increased the number of beds, but simply states that most provinces with more populations have more beds (Table 6).
Given the estimated value of the Spearman correlation, it can be said that the relationship between the number of beds and the population density of the province is positive. In addition, the relationship between the number of beds and the population density is higher for teaching hospitals.
Discussion
The objective of this study was to measure hospital efficiency and to examine the effects of contextual factors on hospital efficiency in Iran at national and sub-national levels. At the macro level, controlling some contextual factors of provinces was beyond the managerial level. To identify managerial inefficiency, which is important to resource allocation, the effects of these factors must be accounted for comparing organizations (18). This is especially true in Iran because there are several different territories with regards to demographic, economic, social, and environmental aspects.
The first result of this study showed that the median score of efficiency was 0.67 and 0.54 in non-teaching hospitals and teaching hospitals, respectively. The result showed that the efficiency of non-teaching hospitals is significantly higher than teaching hospitals. Whether a hospital is specialized or general or teaching or non-teaching plays an important role in the economic performance of them to create different motivations for economic practice (19). Therefore, these variables have been a noteworthy interest of researchers for a long time, and several types of research have been studied on these issues (20–23).
A recent study calculated and analyzed the efficiency of all public hospitals in Spain in 2017 (24) and reported that the average efficiency score was 0.736. The study compared similar hospitals with each other. In our study, we used more output variables to enhance the reliability of the analysis. A systematic review showed that 90% of studies used the DEA method to measure the efficiency of hospitals in Iran, and the calculated score ranged from 0.7 to 0.9 (25).
A similar study in China also used the DEA method (26). They used the number of beds as the input variable and the hospitalization days, the number of visits, and the number of surgical operations as the most-used output variables for measuring efficiency. A Chinese study measured the efficiency of government hospitals to examine the impact of the country-wide development plan of 2009 on the efficiency of a sample of 114 hospitals. They used similar input and output variables to our study and calculated the average efficiency score of 0.748, while the significant potential for improving the technical efficiency of the hospitals was reported (27).
Another study used similar input and output indicators to examine the efficiency of health services centers in Indonesia. They used Pabón-Lasso model. Forty percent of hospitals and 33% of health centers were located in the high-performing sector of the Pabón-Lasso model (28).
Another study used 10 variables to measure the efficiency of Turkish hospitals in 2015 and found that only 17% of the total 1,103 hospitals were efficient (29). A similar study in Turkey that examined the efficiency of 1,079 hospitals reported that the government hospitals affiliated with the Turkish Ministry of Health were more efficient than the private hospitals (30).
There is no significant relationship between the efficiency score and the number of hospitals in any of the teaching and non-teaching hospitals. Teaching activities are an important cost-driving factor and hospitals that have a broader range of specialization are relatively more costly (31).
Despite this, there was no significant relationship between the efficiency score and the number of hospitals in any of the teaching and medical hospitals while there was a significant relationship between efficiency score and number of beds. Some studies reported consistent evidence of economies of scale for hospitals with 200–300 beds. Inefficiency can be expected to occur more in hospitals with below 200 beds and above 600 beds. Nevertheless, economies of scale depended upon the category of the hospitals in addition to the number of beds and volume of output (25, 32–34). Another study showed that more than three and <5 beds per 1,000 population significantly influenced the efficiency score (35). Also, the results of another study showed that the size, type, and ownership of hospitals had an effect on the degree of their technical efficiency (36). Policymakers and hospital managers should consider the appropriate number of beds for the hospital as it prevents wastage of resources. It seems that the reason for the inefficiency of most hospitals is the lack of adequate allocation of beds according to geographical conditions. Choosing the optimal amount of beds for a hospital is the first step to improving the efficiency and productivity of hospitals.
Results showed that there was a significant relationship between efficiency score, population density, and the overall population of the province. Some studies have shown that the density of population and bed density significantly influenced the efficiency score (35). Also, the relationship between the number of hospitals and the population density of the province was positive.
The relationship between the number of beds and the area of the province in both types of teaching and non-teaching hospitals was positive. It seems the area of the province and population density determine the location for making a hospital and it can increase the input and resources of the hospital such as patient, money, and another resource improving the efficiency of hospitals.
Conclusions
There is no one unique intervention that can be adopted by different hospitals to improve hospital efficiency. Multiple factors influence the efficiency of hospitals. To address hospital inefficiency, multi-intervention packages focusing on the hospital and its context should be developed. It is necessary to pay attention to the contextual factors and organizational architecture before any cost contamination and efficiency improvement. It is suggested that the comprehensive hospital's efficiency indicators should be determined to more accurately evaluate the hospital's efficiency.
Data Availability Statement
The original contributions presented in the study are included in the article/supplementary material, further inquiries can be directed to the corresponding authors.
Author Contributions
AT, AO, and RM conceived the study and designed its method. EM and MK performed the computations and applied the model, with help from FH for revision of the analytical method. EM, HSh, and SN carried out the analytical experiment. AO and AT wrote the manuscript. All authors discussed the results, contributed to the final manuscript, contributed to the development and approved the final manuscript.
Conflict of Interest
The authors declare that the research was conducted in the absence of any commercial or financial relationships that could be construed as a potential conflict of interest.
Publisher's Note
All claims expressed in this article are solely those of the authors and do not necessarily represent those of their affiliated organizations, or those of the publisher, the editors and the reviewers. Any product that may be evaluated in this article, or claim that may be made by its manufacturer, is not guaranteed or endorsed by the publisher.
References
1. Ministry of Health and Medical Education of the Islamic Republic of Iran. The Map of the Development of Health System of the Islamic Republic of Iran Based on the Islamic-Iranian Model of Progress. Tehran: Ministry of Health and Medical Education of the Islamic Republic of Iran (2011). p. 15–25.
2. Khanjankhani K, Rafiei S, Ezzatabadi MR, Askari R, Abooee F, Shafii M. Evaluation and prioritization of service quality dimensions using Dematel and Topsis: A case study in Iran. Bali Med J. (2016) 5:118–23. doi: 10.15562/bmj.v5i2.233
3. Minges KE, Curtis J, Desai N, Wang Y, Masoudi FA, Messenger J, et al. performance and characteristics of hospitals participating in the American College of Cardiology Voluntary Public Reporting Program. J Am Coll Cardiol. (2018) 71:A498. doi: 10.1016/S0735-1097(18)31039-8
4. Kiani MM, Raei B, Asbagharani PA, Yousefi M, Rigi SAM, Salehi M, et al. Comparison of the technical efficiency of the hospital sector: Panel data analysis of the Iranian hospitals using parametric and non-parametric approaches. Bali Med J. (2018) 8:114–9. doi: 10.15562/bmj.v8i1.1242
5. Manyazewal T. Using the World Health Organization health system building blocks through survey of healthcare professionals to determine the performance of public healthcare facilities. Arch Public Health. (2017) 75:50. doi: 10.1186/s13690-017-0221-9
6. Pourreza A, Alipour V, Arabloo J, Bayati M, Ahadinezhad B. Health production and determinants of health systems performance in WHO Eastern Mediterranean Region. Eastern Mediterranean Health J. (2017) 23:368. doi: 10.26719/2017.23.5.368
7. Ersoy K, Kavuncubasi S, Ozcan YA, Harris II JM. Technical efficiencies of Turkish hospitals: DEA approach. J Med Syst. (1997) 21:67–74. doi: 10.1023/A:1022801222540
8. Kirigia JM, Emrouznejad A, Sambo LG. Measurement of technical efficiency of public hospitals in Kenya: using data envelopment analysis. J Med Syst. (2002) 26:39–45. doi: 10.1023/A:1013090804067
9. Ramanathan R. Operations assessment of hospitals in the Sultanate of Oman. Int J Oper Prod Manag. (2005) 25:39–54. doi: 10.1108/01443570510572231
10. Ghaderi H, Godarzi A, Gohary M. Determining of technical efficiency in Iran University of Medical Science's hospital by using DEA method: 2000-2004. J Health Admin. (2006) 9:31–8. doi: 10.4236/health.2014.69102
11. Mohammadi AM Mirghafouri S, Mirfakhr AS, Damaki A, Moumeni H. Evaluation of the relative efficiency of government hospitals in Yazd using DEA model (data envelopment analysis). J Shahid Sadoughi Univ Med Sci. (2009) 17:200–8. Available online at: https://www.sid.ir/en/Journal/JournalList.aspx?ID=3672
12. Azad E, Ketabi S, Soltani I, Bagherzade M. Analysis of efficiency and resource allocation at different wards in Shariati hospital, Isfahan, Iran, using data envelopment analysis. Health Inf Manag. (2012) 8:938–47.
13. Phung M-T, Cheng C-P, Guo C, Kao C-Y. Mixed network DEA with shared resources: a case of measuring performance for banking industry. Oper Res Persp. (2020) 7:100173. doi: 10.1016/j.orp.2020.100173
14. Kao H-Y, Chan C-Y, Wu D-J. A multi-objective programming method for solving network DEA. Appl Soft Comput. (2014) 24:406–13. doi: 10.1016/j.asoc.2014.06.057
15. Kao C, Liu S-T. Cross efficiency measurement and decomposition in two basic network systems. Omega. (2019) 83:70–9. doi: 10.1016/j.omega.2018.02.004
16. Kao C. Efficiency decomposition in network data envelopment analysis with slacks-based measures. Omega. (2014) 45:1–6. doi: 10.1016/j.omega.2013.12.002
17. Rezapour A, Foroughi Z, Sadeghi NS, Faraji M, Mazdaki A, Asiabar AS, et al. Identification of the most appropriate variables for measuring the efficiency of Iranian public hospitals: using Delphi technique. J Educ Health Promot. (2019) 8:140. doi: 10.4103/jehp.jehp_402_18
18. Kontodimopoulos N, Papathanasiou ND, Tountas Y, Niakas D. Separating managerial inefficiency from influences of the operating environment: an application in dialysis. J Med Syst. (2010) 34:397–405. doi: 10.1007/s10916-009-9252-2
19. Barbetta GP, Turati G, Zago AM. Behavioral differences between public and private not-for-profit hospitals in the Italian National Health Service. Health Econ. (2007) 16:75–96. doi: 10.1002/hec.1143
20. Jehu-Appiah C, Sekidde S, Adjuik M, Akazili J, Almeida SD, Nyonator F, et al. Ownership and technical efficiency of hospitals: evidence from Ghana using data envelopment analysis. Cost Effect Res Alloc. (2014) 12:1–13. doi: 10.1186/1478-7547-12-9
21. Hollingsworth B, Wildman J. The efficiency of health production: re-estimating the WHO panel data using parametric and non-parametric approaches to provide additional information. Health Econ. (2003) 12:493–504. doi: 10.1002/hec.751
22. Chang H, Cheng M-A, Das S. Hospital ownership and operating efficiency: evidence from Taiwan. Eur J Oper Res. (2004) 159:513–27. doi: 10.1016/S0377-2217(03)00412-0
23. Hajialiafzali H, Moss J, Mahmood M. Efficiency measurement for hospitals owned by the Iranian social security organisation. J Med Syst. (2007) 31:166–72. doi: 10.1007/s10916-007-9051-6
24. Perez-Romero C, Ortega-Díaz MI, Ocana-Riola R, Martín-Martín JJ. Analysis of the technical efficiency of hospitals in the Spanish National Health Service. Gaceta Sanitaria. (2016) 31:108–15. doi: 10.1016/j.gaceta.2016.10.007
25. Kiadaliri AA, Jafari M, Gerdtham U-G. Frontier-based techniques in measuring hospital efficiency in Iran: a systematic review and meta-regression analysis. BMC Health Serv Res. (2013) 13:312. doi: 10.1186/1472-6963-13-312
26. Dong S, Zuo Y, Guo S, Li M, Liu X, Li H. Data envelopment analysis for relative efficiency measurement of Chinese hospitals: a systematic review. Res Health Sci. (2017) 2:79–103. doi: 10.22158/rhs.v2n2p79
27. Cheng Z, Tao H, Cai M, Lin H, Lin X, Shu Q, et al. Technical efficiency and productivity of Chinese county hospitals: an exploratory study in Henan province, China. BMJ Open. (2015) 5:e007267. doi: 10.1136/bmjopen-2014-007267
28. Hafidz F, Ensor T, Tubeuf S. Assessing health facility performance in Indonesia using the Pabón-Lasso model and unit cost analysis of health services. Int J Health Plann Manage. (2018) 33:e541–e56. doi: 10.1002/hpm.2497
29. Narci HÖ, Ozcan YA, Sahin I, Tarcan M, Narci M. An examination of competition and efficiency for hospital industry in Turkey. Health Care Manag Sci. (2015) 18:407–18. doi: 10.1007/s10729-014-9315-x
30. Yildiz MS, Heboyan V, Khan MM. Estimating technical efficiency of Turkish hospitals: implications for hospital reform initiatives. BMC Health Serv Res. (2018) 18:401. doi: 10.1186/s12913-018-3239-y
31. Giancotti M, Guglielmo A, Mauro M. Efficiency and optimal size of hospitals: results of a systematic search. PLoS ONE. (2017) 12:e0174533. doi: 10.1371/journal.pone.0174533
32. Weaver M, Deolalikar A. Economies of scale and scope in Vietnamese hospitals. Soc Sci Med. (2004) 59:199–208. doi: 10.1016/j.socscimed.2003.10.014
33. O'Donnell CJ, Nguyen K. An econometric approach to estimating support prices and measures of productivity change in public hospitals. J Product Anal. (2013) 40:323–35. doi: 10.1007/s11123-012-0312-0
34. Scott A, Parkin D. Investigating hospital efficiency in the new NHS: the role of the translog cost function. Health Econ. (1995) 4:467–78. doi: 10.1002/hec.4730040604
35. Ahmed S, Hasan MZ, MacLennan M, Dorin F, Ahmed MW, Hasan MM, et al. Measuring the efficiency of health systems in Asia: a data envelopment analysis. BMJ Open. (2019) 9:e022155. doi: 10.1136/bmjopen-2018-022155
Keywords: contextual factors, technical efficiency, DEA, public hospitals, inefficiency, health policy
Citation: Mohamadi E, Kiani MM, Olyaeemanesh A, Takian A, Majdzadeh R, Hosseinzadeh Lotfi F, Sharafi H, Sajadi HS, Goodarzi Z and Noori Hekmat S (2022) Two-Step Estimation of the Impact of Contextual Variables on Technical Efficiency of Hospitals: The Case Study of Public Hospitals in Iran. Front. Public Health 9:785489. doi: 10.3389/fpubh.2021.785489
Received: 29 September 2021; Accepted: 28 October 2021;
Published: 06 January 2022.
Edited by:
Mihajlo Jakovljevic, Hosei University, JapanReviewed by:
Alireza Amirteimoori, Islamic Azad University, Rasht Branch, IranMohammad Reza Mozaffari, Islamic Azad University of Shiraz, Iran
Copyright © 2022 Mohamadi, Kiani, Olyaeemanesh, Takian, Majdzadeh, Hosseinzadeh Lotfi, Sharafi, Sajadi, Goodarzi and Noori Hekmat. This is an open-access article distributed under the terms of the Creative Commons Attribution License (CC BY). The use, distribution or reproduction in other forums is permitted, provided the original author(s) and the copyright owner(s) are credited and that the original publication in this journal is cited, in accordance with accepted academic practice. No use, distribution or reproduction is permitted which does not comply with these terms.
*Correspondence: Alireza Olyaeemanesh, arolyaee@gmail.com; Amirhossein Takian, takian@tums.ac.ir