 Caleb Lyu
 Mirna Ponce Jewell2
 Lisa V. Smith
 Tony Kuo
- 1Children's Medical Services, Los Angeles County Department of Public Health, Los Angeles, CA, United States
- 2Division of Chronic Disease and Injury Prevention, Los Angeles County Department of Public Health, Los Angeles, CA, United States
- 3Office of Health Assessment and Epidemiology, Los Angeles County Department of Public Health, Los Angeles, CA, United States
- 4Department of Epidemiology, University of California, Los Angeles (UCLA), Jonathan and Karin Fielding School of Public Health, Los Angeles, CA, United States
- 5Department of Family Medicine, David Geffen School of Medicine at UCLA, Los Angeles, CA, United States
- 6Population Health Program, UCLA Clinical and Translational Science Institute, Los Angeles, CA, United States
Objective: To provide a baseline of various driving behaviors and to identify opportunities for prevention of distracted driving during the infancy of state laws that prohibited cellphone use while operating a motor vehicle, the 2010–2011 Distracted Driving Survey collected information on multiple distracted driving behaviors from lower-income clients of three designated, multi-purpose public health centers in Los Angeles County.
Methods: Descriptive and multivariable negative binomial regression analyses were performed to examine patterns of driving distractions using the Distracted Driving Survey dataset (n = 1,051).
Results: The most common distractions included talking to other passengers (n = 912, 86.8%); adjusting the radio, MP3, or cassette player (n = 873, 83.1%); and adjusting other car controls (n = 838, 79.7%). The median number of distinct distractions per survey participant was 11 (range: 0–32). Factors predicting the number of distinct distractions included being male [incidence rate ratio (IRR): 1.14; 95% confidence interval (CI): 1.06, 1.23], having a lower education (IRR: 0.73; 95% CI: 0.62, 0.84), and having more years of driving experience (IRR: 1.67; 95% CI: 1.33, 2.11). A variety of distractions, including cellphone use and texting, were predictive of increased motor vehicle crashes in the prior 12 months (p < 0.05).
Conclusions: Distracted driving beyond cellphone use and texting were common in the survey sample, suggesting a need for additional public education and more inclusive distracted driving laws that cover these other activity types.
Introduction
Distracted driving (DD) is a serious public health problem in the United States (U.S.), resulting in 3,166 and 599 deaths involving drivers and non-occupants, respectively, in 2017 (1). The estimated number of fatalities from distraction-affected crashes has fluctuated very little during the past 5 years−2,923 in 2013 to 2,935 in 2017. This public safety problem is exacerbated by the increasing sources of distraction behind the wheel, in part attributed to the ubiquity of in-vehicle information systems from emergent technologies (2).
In response to this burden of fatality as well as injury, U.S. government entities have begun to implement legislative as well as public education strategies to combat this issue. For example, during the past decade, a number of media campaigns have been launched to educate the public about DD, including the One Text or Call Could Wreck It All; U Drive. U Text. U Pay.; and GEICO's Stand Against Distracted Driving. Additionally, the month of April has now been designated as “Distracted Driving Awareness Month” by the National Safety Council.
While New York became the first state of the union to implement a law prohibiting all drivers from talking on a hand-held cellphone while driving (in 2001), the majority of cellphone and texting laws in other states were passed after 2008 (3). The state of Washington enacted the first law specifically banning all drivers from texting, effective January 1, 2008. Currently nearly all states except Arizona, Montana, and Missouri have texting bans that apply to all drivers (4). However, these cellphone use and texting laws are not uniformly enforced, often varying by state and by whether the statutes called for primary or secondary enforcement.
To date, the effectiveness of U.S. DD laws remains in question (3, 4). For example, distraction-affected crashes can be caused by various activity types other than cellphone use or texting. These non-cellphone or non-texting distractions may include eating or drinking, adjusting music/audio controls, and other interactions with passengers in the same vehicle (5). Little is currently known about these other activities that may represent significant distractions while driving, as few studies have described these distraction behaviors and their frequency within the context of motor vehicle crash risk.
The 2010–2011 Distracted Driving Survey (DDS) was conducted in part to address this gap in public health practice, during a time when DD legislation was still at its infancy (early implementation) in many jurisdictions, and at the federal level. The present study capitalizes on this timing and provides a snapshot of DD (within a historical context) in a sample of low socioeconomic status (SES) residents in Los Angeles County (LAC). The study analyzed the DDS dataset to assess and describe what these distractions were during this pivotal time when the California DD laws were being implemented. The study also examined factors which may have influenced drivers to engage in a variety of distractions while driving.
Methods
Study Design and Participants
The 2010–2011 DDS was a cross-sectional survey conducted using a rapid needs assessment approach that answered health assessment questions about driving distractions in a low SES population in LAC. The survey was administered by trained, bilingual Department of Public Health (DPH) staff to all eligible persons attending three designated LAC public health centers during October 4 to December 1, 2010. A systematic, serial sampling protocol was employed on pre-determined dates to screen for eligibility and recruit prospective participants until the first 350 were enrolled at each of the centers. To be eligible, all participants must meet the following criteria: (a) be a client of the health center on the day of recruitment (i.e., receiving services); (b) be at least 16 years of age; (c) be a driver of a motor vehicle; and (d) be able to complete the survey in English or Spanish. All participants provided verbal informed consent prior to enrollment in the survey. Eligible persons under 18 years of age were required to sign an assent form prior to being handed a survey questionnaire; however, the Institutional Review Board that reviewed this study did approve and offered a waiver option. A low-fat granola bar was given as an incentive to all participants who completed the survey. All survey protocols and instruments were reviewed and approved by the DPH Institutional Review Board prior to field implementation (IRB # 2010-09-295).
Measures and Procedures
The survey was a 4-page self-administered questionnaire developed in English and translated into Spanish by bilingual DPH staff; cultural and linguistic relevance were pretested prior to finalizing the instrument. The survey questionnaire was divided into three parts: (1) questions about socio-demographic characteristics; (2) questions about participants' driving experiences, including recent accident history in the past 12 months; and (3) questions about the distractions that participants engaged in while driving during the past 30 days.
To assess the frequency of engaging in specific distractions, participants were asked: “During the past 30 days, how often did you do this activity while you were driving a car or other vehicle?” Response categories to the question were fielded as: Never (0%), Rarely (1–10%), Sometimes (11–50%), Most of the time (51–99%), and Always (100%). These variables were dichotomized as “No” if the response was Never and “Yes” for all other affirmative responses. “Yes” categories were summed across a single participant to obtain the number of distinct distractions per survey participant, the primary dependent variable of interest.
Data Analyses
Frequency distributions of key variables were tabulated to inform subsequent analyses. Continuous variables were converted to categorical variables to reflect context and assist with interpretation of results. Age categories were derived from standard ranges used by the Centers for Disease Control and Prevention. Due to sparse data, Native American/Alaskan Native and Mixed/Multiethnic race/ethnicity categories were combined as “Other.” A negative binomial regression model was performed to assess predictors of the number of distinct distractions per survey participant, which is indicated when the dependent variable of interest is depicted as counts and there is overdispersion. Variables included in the model were gender, age, race/ethnicity, education level, health insurance status, years of driving experience, duration of daily non-work-related driving, and duration of one-way travel between home and work. Participants where duration of one-way travel between home and work was not applicable were excluded from the model. Observations with missing data were also excluded from the analyses. The primary measure of interest was the incidence rate ratio, which is the ratio of the mean number of distinct distractions per survey participant for an index group vs. the mean number of distinct distractions for a reference group. In a sub-analysis, binary logistic regression was used to examine the association between specific distractions and involvement in a motor vehicle crash as the driver in the past 12 months. Specifically, potential confounders (age, gender, and race/ethnicity) and explanatory DDS variables (e.g., illicit drug use while driving or reading electronic billboards) were entered simultaneously into the regression models, which generated adjusted odds ratios and 95% confidence intervals (CIs). All analyses were conducted using the SAS 9.4 statistical package (SAS Institute Inc., Cary, North Carolina).
Results
The DDS was completed by 1,051 participants, for a response rate of 95%. Socio-demographic characteristics and driving experiences of the survey participants are presented in Table 1. Most were 25–34 years of age (n = 355, 33.8%), of Hispanic/Latino race/ethnicity (n = 451, 42.9%), had at least some sort of college education (n = 633, 60.2%), and reported not having health insurance (n = 585, 55.7%). For the latter characteristic, the overall population in Los Angeles County, by comparison, contained a much lower percentage of uninsured persons (23.5%). The average number of years of experience driving a motor vehicle was 14.4 (Range: 1–61 years), and the average duration of daily non-work-related driving was 63.3 min (Range: 0–720 min). The average duration of one-way travel between home and work was 25.5 min (Range: 1–120 min) and 10.2% (n = 107) reported being involved in a motor vehicle crash in the past 12 months.
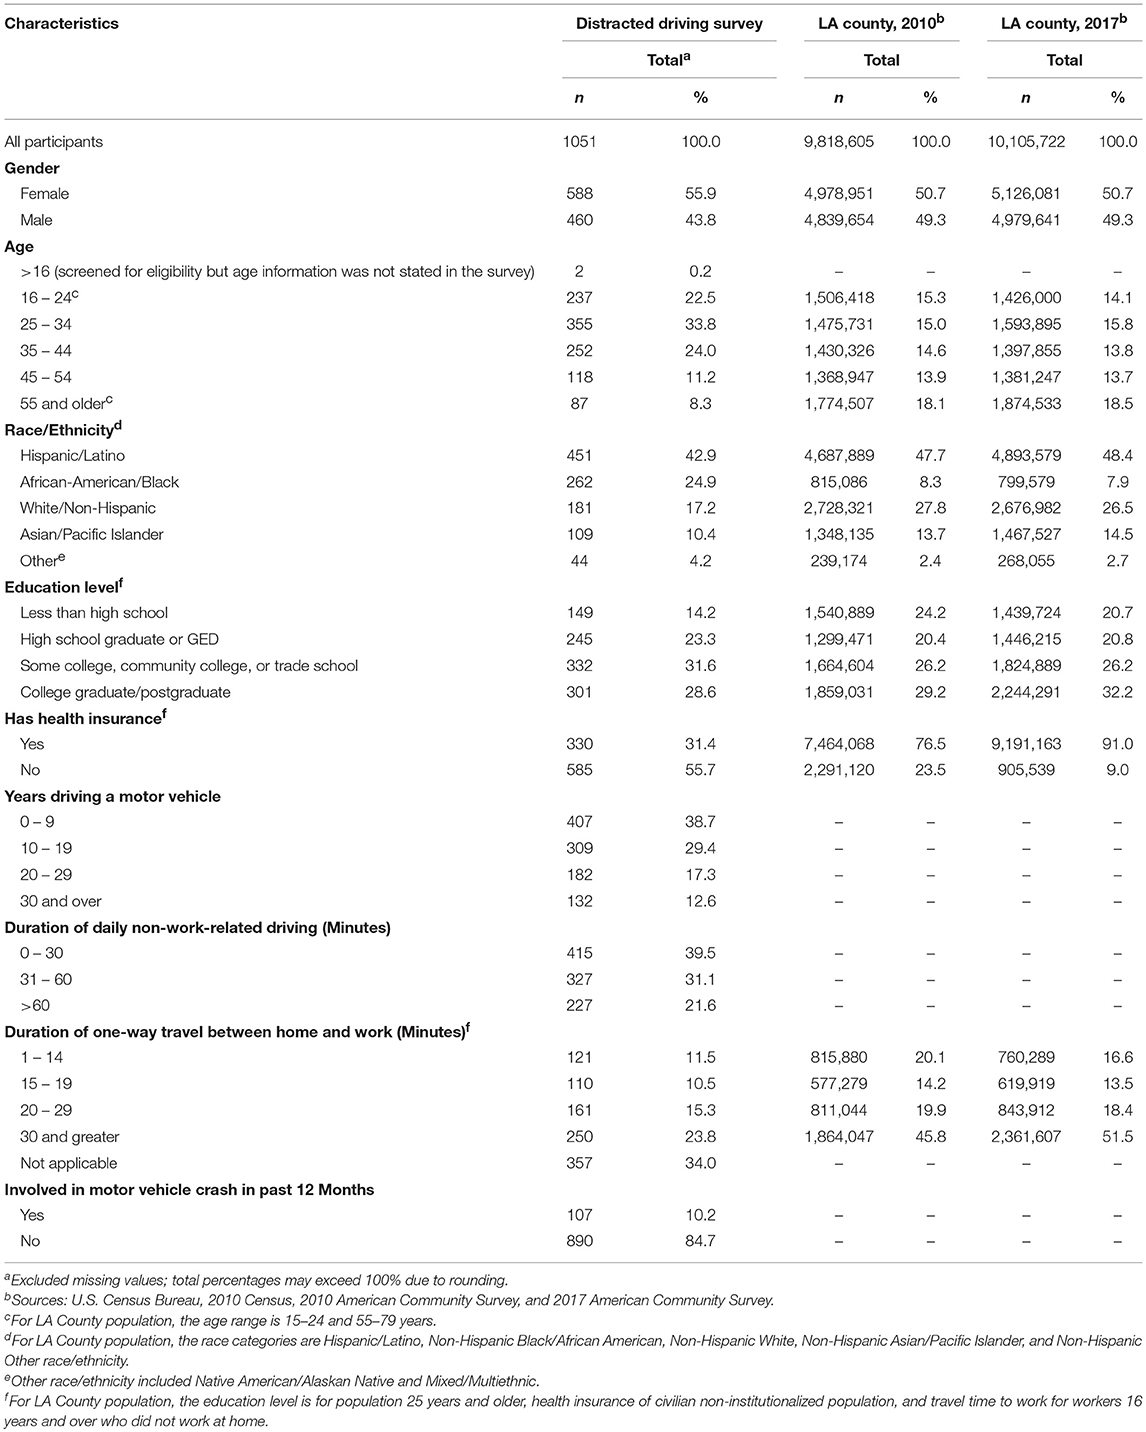
Table 1. Socio-demographic characteristics and driving experiences of participants from the 2010–2011 Distracted Driving Survey in Los Angeles County.
The median number of distinct distraction activities that participants engaged in during the past 30 days was 11 and ranged from 0 to 32 (skewness = 0.29; kurtosis = 0.13). The most common distraction was talking to other passengers (n = 912, 86.8%) (Table 2). Other common distractions included adjusting the radio, MP3, or cassette player (n = 873, 83.1%); adjusting the controls in the car including air conditioner, sunroof, mirrors, etc. (n = 838, 79.7%); eating or drinking (n = 817, 77.7%); and singing (n = 794, 75.5%).
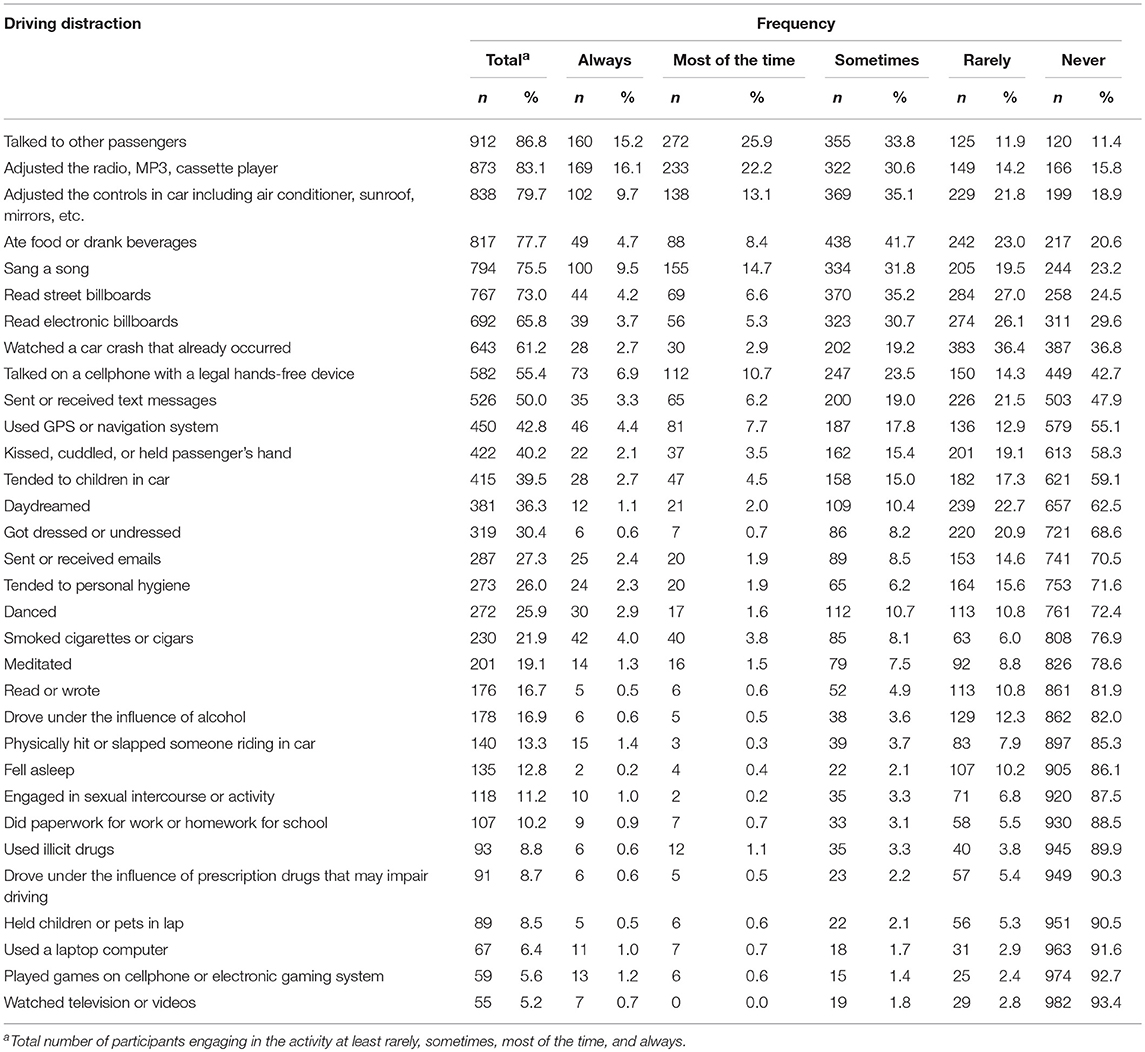
Table 2. Self-reported distractions in the past 30 days, 2010–2011 Distracted Driving Survey in Los Angeles County.
There were several characteristics of the study sample that predicted the number of distinct distractions per survey participant. Male participants, for example, were more likely to have a higher number of distinct distractions [incidence rate ratio (IRR) = 1.14, 95% confidence interval (CI) = 1.06, 1.23], as were those who had a higher number of years of driving experience (e.g., 30 years and over: IRR = 1.67, 95% CI = 1.33, 2.11) (Table 3). Those in older age categories were less likely to have engaged in distinct distractions, with the 55 and older group being the least likely to engage in a variety of distractions (IRR = 0.39, 95% CI = 0.30, 0.51). Those who had completed less than high school education (IRR = 0.73, 95% CI = 0.62, 0.84), high school or GED level of education (IRR = 0.72, 95% CI = 0.64, 0.80), and some college, community college, or trade school (IRR = 0.88, 95% CI = 0.80, 0.96) were also less likely to engage in a variety of distractions, as compared to those with college graduate/postgraduate education.
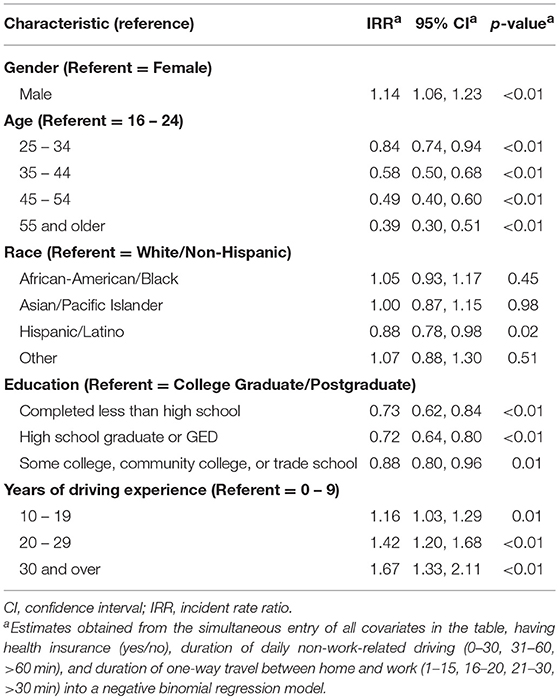
Table 3. Predictors of the number of distinct distractions while driving per survey participant in the past 30 days, 2010–2011 Distracted Driving Survey in Los Angeles County.
Although not the primary focus of the present study, a sub-analysis of the DDS found that there were many activities other than cellphone use or texting that were associated with being involved in a motor vehicle crash in the past 12 months (Table 4). Results from the binary logistic regression suggest that both common (highly prevalent) and rare activities were dangerous to participate in while driving. For example, only 8.8% of the participants used illicit drugs while driving but had 2.87 times the odds (adjusted) of being involved in a crash in the prior 12 months than those who did not (95% CI = 1.61, 5.12). In contrast, 65.8% of all participants reported reading electronic billboards. These participants had 1.82 times the odds (adjusted) of being involved in a crash as compared to those who did not (95% CI = 1.07, 3.11). Other activities with significant results (p < 0.05) in this analysis included physically hitting someone riding in the car, engaging in sexual intercourse, tending to personal hygiene, dancing, playing games on cell phone or other gaming device, using a handsfree device, watching a prior car crash, falling asleep, driving under the influence of prescription drugs that may impair driving, daydreaming, and driving under the influence of alcohol. Lastly, cellphone use while driving did not have the highest odds of being in a motor vehicle accident in the prior 12 months.
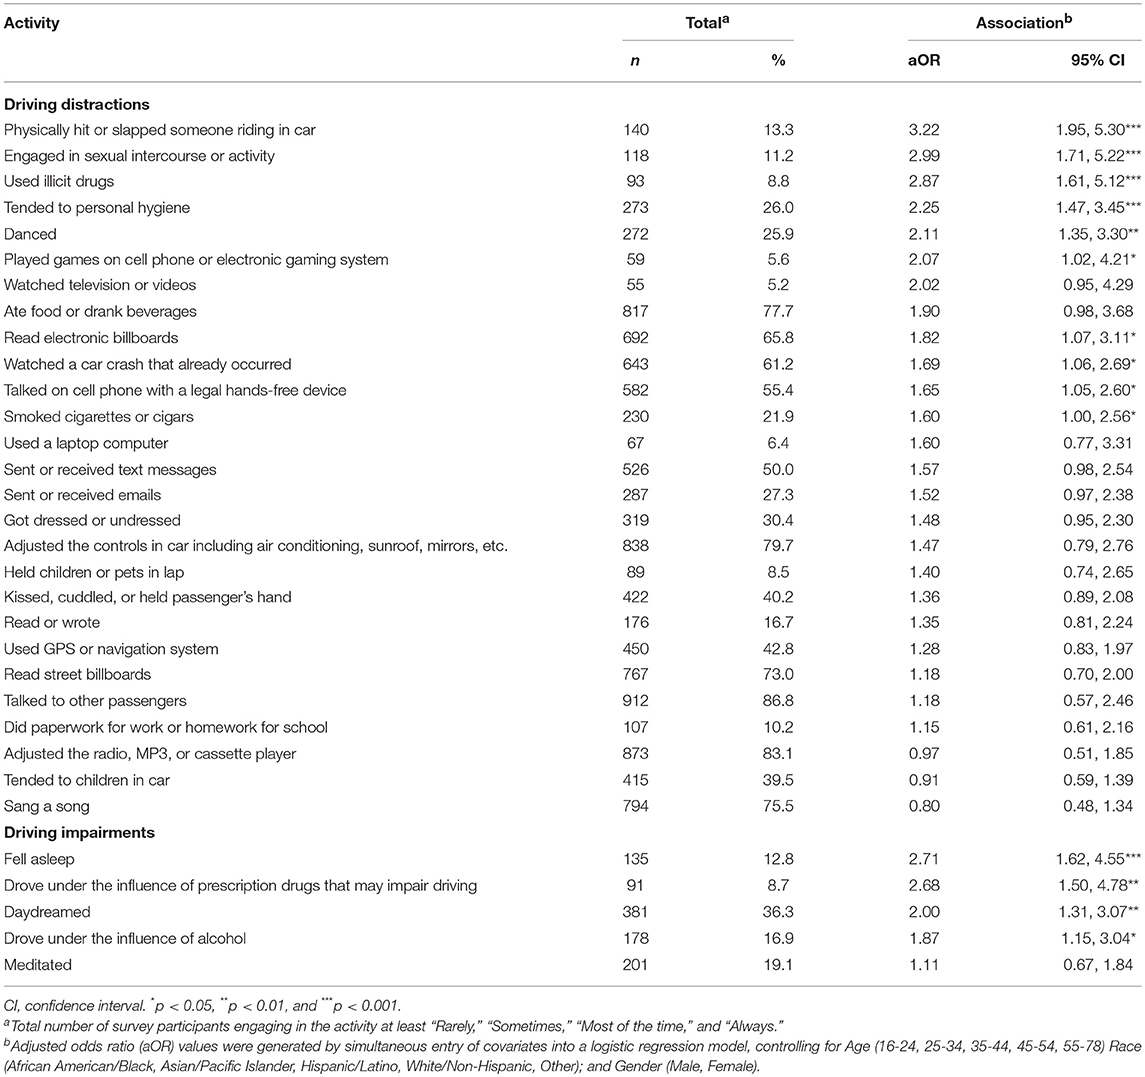
Table 4. Associations between self-reported distracted driving activities in the past 30 days and being involved in a car/motor vehicle crash in the past 12 months (n = 1,051); 2010–2011 Distracted Driving Survey in Los Angeles County.
Discussion
The DDS found that gender, age, education level, and years of driving experience predicted the number of distinct distractions among survey participants. Gender and age, in particular, are supported by prior research which has documented their association to DD (6). Likewise, higher education (e.g., Bachelor's degree or greater) has been shown by Hoff and colleagues to predict greater variety of DD behaviors (7); this is similar to what the DDS has reported for participants with a college education. Interestingly, among survey participants with a longer driving experience, the variety and frequency of driving distractions were higher than for those with a shorter driving experience. Although somewhat contradictory to McEvoy and co-workers' finding, which showed that drivers with a shorter driving experience were more likely to be engaged in DD at the time of a crash (8), the present result on this subject matter was not necessarily inconsistent with what is known about driving skills, as more experienced drivers may also be more adept at avoiding motor vehicle crashes despite engaging in more DD activities.
In general, driving distractions have been found to be associated with motor vehicle crashes. In a study analyzing the 100-Car Naturalistic Driving Study data, behaviors such as engaging in moderate and complex secondary tasks while driving, including looking at external objects, reading, and applying makeup, resulted in at least two to three times the odds of being involved in a near-crash/crash event (9). In the DDS sub-analysis, similar relationships between DD behaviors and crashes were observed.
Because the danger of DD can be debilitating and/or fatal, there is a need for additional public education and more inclusive DD laws that consider other distraction types beyond just cellphone use or texting. Existing DD legislation, for example, could be further refined to cover the total number and types of distractions that drivers may engage in. Only a few states - Connecticut, Maine, Oklahoma, and Utah - and the District of Columbia currently have language in their driving laws to address other forms of DD. Past policy efforts, such as seat belt laws and alcohol-impaired driving regulations, suggest that combining public education with strong regulation and enforcement of the laws can be quite effective for promoting safer driving conditions and for reducing crash deaths over time (10, 11).
Although the DDS was conducted in 2010, the survey offers an opportunity to provide a snapshot of driving behaviors among a lower SES population during the early stages of DD law implementation in California; the bans for cellphone use and texting were instituted in 2008 and 2009, respectively (California Vehicle Code, 2008. §23123; California Vehicle Code, 2009. §23123.5). Recent literature suggests that efforts to curb DD through texting bans and to reduce its negative consequences were associated with significant decreases in the incidence of emergency department visits that follow a collision (12).
The DDS provides added value to public health practice because its scope (i.e., asked about a multitude of driving distractions) is broader than most studies in the literature. That is, baseline information from the study can be used to design roadway (streetscape modifications) and driver interventions (public education and more inclusive DD laws) for decreasing motor vehicle-related fatalities and injuries in LAC. Such data, for instance, could be applied to aid program development in the Vision Zero initiative. This initiative's primary goal is to eliminate fatalities from motor vehicle-pedestrian/-bicyclist collisions, from present level to zero by 2035 (13).
The DDS also adds value because the data that it generated have immediate application in the public health center setting. Since the survey findings were about their clients, physicians and public health nurses are likely to be more motivated to counsel on this personal safety issue, much like they do for seat belt use during a clinic visit.
Limitations
In spite of its unique strengths (e.g., relevance to local public health practice and injury prevention), the DDS has several limitations. First, the data is almost 8 years old—i.e., study findings may not reflect current attitudes or behaviors. Nonetheless, the DDS data do offer a historical reference which can be used as comparison for impact evaluation of DD education campaigns and legislation and future research efforts on this topic. Second, the DDS sample may not be representative of the general population, but rather of the lower SES group that frequent public health centers. However, despite this limitation, findings from another study suggest that the prevalence of DD may be even greater among populations with higher SES, reflecting a greater need for intervention in these groups (14). There are also mixed results on income levels and its relationship to motor vehicle casualties in the literature, with some showing a higher fatality rate among those in lower income areas while others showing no association (15, 16). Third (and lastly), since the survey relied on self-reported data, a number of biases could have altered the interpretation of the results, including but not limited to recall and social desirability biases.
Conclusions
The present analysis of the DDS provides a unique narrative of a multitude of driving behaviors during the early implementation of DD legislation in California. It also provides a sample reference that future research can compare to. The survey findings highlight the heterogeneity of driving distractions beyond just cellphone use and texting—many individuals were talking, eating, grooming, and adjusting various car features while driving, to name a few of these activities. Differences in SES aside, DD is a preventable phenomenon that can affect more than the person participating in the activity. As such, it is a worthwhile public health intervention priority. Taken together with other literature, the DDS data suggest that revisiting current DD laws to broaden their scopes and educating the public through more robust media or public service announcement campaigns, are both worthy investments, and likely actions that should be taken to address this public health problem. The sheer variety of local DD activities as described by the DDS—a survey conducted during a time when DD laws were becoming more commonplace—have policy implications and practical applications for those interested in reducing DD morbidity and mortality in their jurisdictions, both in the U.S. and abroad.
Data Availability
Access to the datasets are available on request to the corresponding author and will be considered on a case by case basis.
Ethics Statement
All survey protocols and instruments were reviewed and approved by the DPH Institutional Review Board prior to field implementation (IRB # 2010-09-295). This is stated in the manuscript as well.
Author Contributions
CL led the analysis and writing of this article. LS and TK conceptualized the original study design. JC and MP supervised the data collection and management. All authors participated in the interpretation of the results, edited the manuscript for intellectual content and accuracy, and reviewed and approved this submission.
Funding
This project did not receive any specific grant from funding agencies in the public, commercial, or not-for-profit sectors.
Conflict of Interest Statement
The authors declare that the research was conducted in the absence of any commercial or financial relationships that could be construed as a potential conflict of interest.
Acknowledgments
The authors thank Ashley Stegall, Elizabeth Rubin, Ekaterina Gee, Nirvi Shah, and the clinic staff at the Division of Community Health Services in the Los Angeles County Department of Public Health for their assistance and logistical support of data collection during 2010.
References
1. National Center for Statistics and Analysis. Distracted Driving in Fatal Crashes, 2017. Traffic Safety Facts Research Note. DOT HS 812 700. Washington, DC: U.S. Department of Transportation, National Highway Traffic Safety Administration (2019).
2. Strayer DL, Cooper JM, McCarty MM, Getty DJ, Wheatley CL, Motzkus CJ, et al. Visual and Cognitive Demands of Using Apple's CarPlay, Google's Android Auto and Five Different OEM Infotainment Systems. Washington, DC: AAA Foundation for Traffic Safety (2018).
3. McCartt AT, Kidd DG, Teoh ER. Driver cellphone and texting bans in the United States: Evidence of effectiveness. Ann Adv Automotive Med. (2014) 58:99–114.
4. Insurance Institute for Highway Safety. Distracted Driving: Cellphones and Texting. (2018). Retrieved from: https://www.iihs.org/topics/distracteddriving#cellphone-laws (accessed June 25, 2018).
5. Stutts J, Feaganes J, Reinfurt D, Rodgman E, Hamlett C, Gish K, et al. Driver's exposure to distractions in their natural driving environment. Accid Anal Prev. (2005) 37:1093–101. doi: 10.1016/j.aap.2005.06.007
6. Tison J, Chaudhary N, Cosgrove L. National Phone Survey on Distracted Driving Attitudes and Behaviors. No. HS-811 555. Washington, DC: U.S. Department of Transportation, National Highway Traffic Safety Administration (2011).
7. Hoff J, Grell J, Lohrman N, Stehly C, Stoltzfus J, Wainwright G, et al. Distracted driving and implications for injury prevention in adults. J Trauma Nurs. (2013) 20:31–4. doi: 10.1097/JTN.0b013e318286616c
8. McEvoy SP, Stevenson MR, Woodward M. The prevalence of, and factors associated with, serious crashes involving a distracting activity. Accid Anal Prev. (2007) 39:475–82. doi: 10.1016/j.aap.2006.09.005
9. Klauer SG, Dingus TA, Neale VL, Sudweeks JD, Ramsey DJ. The Impact of Driver Inattention on Near-Crash/Crash Risk: An Analysis Using the 100-Car Naturalistic Driving Study Data. DOT HS 810 594. Springfield, VA: National Technical Information Services at the U.S. Department of Transportation, National Highway Traffic Safety Administration (2006).
10. Dinh-Zarr TB, Sleet DA, Shults RA, Zaza S, Elder RW, Nichols JL, et al. Task force on community preventive services. Reviews of evidence regarding interventions to increase the use of safety belts. Am J Prev Med. (2001) 21:48–65. doi: 10.1016/S0749-3797(01)00378-6
11. Shults RA, Elder RW, Sleet DA, Nichols JL, Alao MO, Carande-Kulis VG, et al. Task force on community preventive services. Reviews of evidence regarding interventions to reduce alcohol-impaired driving. Am J Prev Med. (2001) 21:66–88. doi: 10.1016/S0749-3797(01)00381-6
12. Ferdinand AO, Aftab A, Akinlotan MA. Texting-while-driving bans and motor vehicle crash–related emergency department visits in 16 US states: 2007–2014. Am J Public Health. (2019) 109:748–54. doi: 10.2105/AJPH.2019.304999
13. County of Los Angeles. Draft Vision Zero Los Angeles County - A Plan for Safer Streets, 2019 to 2024. (2019). Retrieved from: https://pw.lacounty.gov/visionzero/docs/LosAngelesCountyVZDraftActionPlan.pdf (accessed March 15, 2019).
14. Schroeder P, Wilbur M, Peña R. National Survey on Distracted Driving Attitudes and Behaviors – 2015. DOT HS 812 461. Washington, DC: U.S. Department of Transportation, National Highway Traffic Safety Administration (2018).
15. Melton SM, McGwin G, Abernathy JH, MacLennan P, Cross JM, Rue LW. Motor vehicle crash–related mortality is associated with prehospital and hospital-based resource availability. J Trauma. (2003) 54:273–9; discussion: 279. doi: 10.1097/01.TA.0000038506.54819.11
Keywords: distracted driving, distracted driving laws, low socioeconomic status residents, cellphone use, other distractions
Citation: Lyu C, Ponce Jewell M, Cloud J, Smith LV and Kuo T (2019) Driving Distractions Among Public Health Center Clients: A Look at Local Patterns During the Infancy of Distracted Driving Laws in California. Front. Public Health 7:207. doi: 10.3389/fpubh.2019.00207
Received: 20 April 2019; Accepted: 12 July 2019;
Published: 08 August 2019.
Edited by:
Allen C. Meadors, Independent Researcher, Arizona, United StatesReviewed by:
Timothy Lynn Taylor, Independent Researcher, North Carolina, United StatesBirute Strukcinskiene, Klaipėda University, Lithuania
Copyright © 2019 Lyu, Ponce Jewell, Cloud, Smith and Kuo. This is an open-access article distributed under the terms of the Creative Commons Attribution License (CC BY). The use, distribution or reproduction in other forums is permitted, provided the original author(s) and the copyright owner(s) are credited and that the original publication in this journal is cited, in accordance with accepted academic practice. No use, distribution or reproduction is permitted which does not comply with these terms.
*Correspondence: Tony Kuo, tkuo@ph.lacounty.gov