 Stjepan Curic1,2*
 Christina Andreou1,3
 Guido Nolte4
 Saskia Steinmann1
 Stephanie Thiebes1Nenad Polomac1
 Moritz Haaf1
 Jonas Rauh1
 Gregor Leicht1
 Christoph Mulert1,5
- 1Psychiatry Neuroimaging Branch, Department of Psychiatry and Psychotherapy, University Medical Center Hamburg-Eppendorf, Hamburg, Germany
- 2Institute for Sex Research, Sexual Medicine and Forensic Psychiatry, Center of Psychosocial Medicine, University Medical Center Hamburg-Eppendorf, Hamburg, Germany
- 3Translational Psychiatry Unit, Department of Psychiatry and Psychotherapy, University of Lübeck, Lübeck, Germany
- 4Department of Neurophysiology and Pathophysiology, University Medical Center Hamburg-Eppendorf, Hamburg, Germany
- 5Centre for Psychiatry and Psychotherapy, Justus Liebig University, Giessen, Germany
Disturbed functional connectivity is assumed to cause neurocognitive deficits in patients suffering from schizophrenia. A Glutamate N-methyl-D-aspartate receptor (NMDAR) dysfunction has been suggested as a possible mechanism underlying altered connectivity in schizophrenia, especially in the gamma- and theta-frequency range. The present study aimed to investigate the effects of the NMDAR-antagonist ketamine on resting-state power, functional connectivity, and schizophrenia-like psychopathological changes in healthy volunteers. In a placebo-controlled crossover design, 25 healthy subjects were recorded using resting-state 64-channel-electroencephalography (EEG) (eyes closed). The imaginary coherence-based Multivariate Interaction Measure (MIM) was used to measure gamma and theta connectivity across 80 cortical regions. The network-based statistic was applied to identify involved networks under ketamine. Psychopathology was assessed with the Positive and Negative Syndrome Scale (PANSS) and the 5-Dimensional Altered States of Consciousness Rating Scale (5D-ASC). Ketamine caused an increase in all PANSS (p < 0.001) as well as 5D-ASC scores (p < 0.01). Significant increases in resting-state gamma and theta power were observed under ketamine compared to placebo (p < 0.05). The source-space analysis revealed two distinct networks with an increased mean functional gamma- or theta-band connectivity during the ketamine session. The gamma-network consisted of midline regions, the cuneus, the precuneus, and the bilateral posterior cingulate cortices, while the theta-band network involved the Heschl gyrus, midline regions, the insula, and the middle cingulate cortex. The current source density (CSD) within the gamma-band correlated negatively with the PANSS negative symptom score, and the activity within the gamma-band network correlated negatively with the subjective changed meaning of percepts subscale of the 5D-ASC. These results are in line with resting-state patterns seen in people who have schizophrenia and argue for a crucial role of the glutamate system in mediating dysfunctional gamma- and theta-band-connectivity in schizophrenia. Resting-state networks could serve as biomarkers for the response to glutamatergic drugs or drug development efforts within the glutamate system.
Introduction
Synchronized neural oscillations are essential for cognition, perception, and consciousness (1). Both oscillations in the low (theta) and high (gamma) frequency range coordinate communication between brain regions (2). While gamma-band oscillations (GBO) are crucial for both local and large-scale neuronal synchronization (3), theta-band-oscillations (TBO) enable long-range synchronization (4). It is widely believed that a disturbed formation of functioning networks is responsible for the characteristic symptomatology of schizophrenia (5). While task-specific oscillation patterns both in the theta- (6) and gamma-band (7) have been shown to be pathological among patients with schizophrenia, there is a growing body of evidence highlighting the significance of spontaneous, “resting-state” oscillatory activity relevant for schizophrenia (8–10). EEG and MEG studies have observed deviations in resting-state (RS) -GBO and -TBO patterns across different stages of schizophrenia: increased RS-GBO among patients with schizophrenia (11, 12); increased RS-GBO in the first episode of schizophrenia (13); increased RS-TBO in chronic schizophrenia and patients at high risk (14–17). Even patients with schizophrenia-like epilepsy showed increased RS-TBO compared to nonpsychotic epilepsy patients (18). Measures of connectivity that represent oscillatory coupling seem to be altered in people suffering from schizophrenia [for a review of the disconnection hypothesis of schizophrenia see (19)]: Patients with schizophrenia show increased RS-gamma- (20) and RS-theta-networks (15, 21, 22).
Gamma and theta oscillogenesis involves the interaction of glutamatergic pyramidal cells and parvalbumin- (PV+) and somatostatin-expressing (SST+) gamma-aminobutyric acid (GABA-) releasing -interneurons (23–25). The glutamate N-methyl-D-aspartate receptors (NMDAR) on these interneurons are essential for the synchronized inhibition provided by the GABAergic interneurons to generate both GBO and TBO (26–28). These findings are supported by post-mortem studies that found a reduced number of PV+-interneurons in the frontal cortex of patients with schizophrenia (29) and a reduced number of SST+-interneurons in various cortical tissues (DLPFC, PFC, hippocampus) of patients with schizophrenia (30).
Experiments with ketamine, a glutamate N-methyl-D-aspartate receptor (NMDAR)-antagonist, helped to identify the critical role of the neurotransmitter glutamate in the pathogenesis of schizophrenia (31): When given to healthy subjects, ketamine induces schizophrenia-like positive, negative, and cognitive symptoms (32, 33) and neurophysiological changes resembling schizophrenia [reviewed in Haaf et al. (34)]. Translational scientific approaches in NMDAR hypofunction animal models of schizophrenia [reviewed in Lee and Zhou (35)] and in healthy humans receiving ketamine (34, 36) parallel findings of patients with schizophrenia both in respect to psychopathological and neurophysiological changes. The need for novel glutamatergic treatment options for schizophrenia was reinforced by these findings and the unsatisfactory effect of conventional D2-targeting antipsychotics on the symptomatology of schizophrenia, especially on negative symptoms (37). While some studies showed promising results, suboptimal outcomes in other studies called for more insight into biomarkers to optimize and individualize glutamatergic treatments (38, 39).
The resting-state activity is a potential biomarker that can help predict or monitor the response of negative symptoms to glutamatergic substances (40). Still, only a few studies have investigated the role of RS oscillations, functional connectivity, networks, and the association with clinical symptoms in the ketamine model of schizophrenia (41–43).
While animal studies influencing the NMDA-R are consistent with NMDA-R-modulation in humans with respect to GBO, paralleling these findings with schizophrenia patients remains challenging, as both increased and decreased RS-GBOs have been observed in patients [reviewed by Bianciardi and Uhlhaas (44)]. This emphasizes the need for further studies characterizing the spectral characteristics in both the ketamine-model of schizophrenia and patient populations.
Founded on the strong association between glutamatergic neurotransmission, the PV+- and SST+-interneurons' role in gamma- and theta-oscillogenesis, the NMDAR functioning, and the need for glutamatergic biomarkers, this study aims to establish a translational link between evidence from preclinical studies and findings from studies investigating patients with schizophrenia. We hypothesized (1) a ketamine-induced schizophrenia-like increase in RS-GBO and RS-TBO, and (2) increased connectivity in the gamma and theta frequency range, along with (3) the manifestation of schizophrenia-like symptoms, as well as (4) a specific association between the ketamine-induced resting-state alterations and the severity of ketamine-induced symptoms.
Materials and Methods
Participants
The Ethics Committee of the Medical Association Hamburg approved the study. Participants were recruited via notice board at the University Medical Center Hamburg-Eppendorf (UKE) and word of mouth and consisted mainly of medical students and employees. Twenty-eight healthy subjects were enrolled and gave written informed consent according to the latest version of the Declaration of Helsinki. Two participants discontinued participation shortly before the first session; one of the participants dropped out due to adverse effects (dissociation/headache/nausea). For the following data analysis, twenty-five subjects with a mean age of 25 years (SD = 2.6) were included (for sociodemographic characteristics at baseline please see Supplementary Table 3).
This investigation was part of a larger study investigating ketamine-related, task- and stimulus-related neurophysiological measures in the same sample (45–47).
Exclusion criteria were acute or past psychiatric illness, tested with the Mini International Neuropsychiatric Interview (48) and the Schizotypal Personality Questionnaire (SPQ) (49), and health conditions that represented a contraindication to the administration of ketamine, assessed through a semi-structured interview. Participants with close relatives who have schizophrenia were excluded from the study.
Psychometric Assessment
Before the first recording (baseline) and after both sessions (placebo/ketamine), an experienced psychiatrist conducted a psychopathological evaluation. The psychiatric symptomatology was assessed using the Positive and Negative Syndrome Scale (PANSS) (50) and the Altered State of Consciousness (5D-ASC) questionnaire (51). PANSS scores were evaluated using the five-factor model by van der Gaag et al. (52). The Altered State of Consciousness (5D-ASC) questionnaire assesses the subjective drug-effects and consists of 94 items representing key dimensions of altered states of consciousness. For this evaluation, the 11 subscales version, with improved homogeneity, compared to the original scale, was used (53).
Study Design
In a randomized, placebo-controlled crossover study design, a subanesthetic dose of S-ketamine hydrochloride (Ketanest® S–Pfizer) was administered by an Infusomat® perfusor syringe pump (B. Braun, Melsungen, Germany) in a 0.9% sodium chloride (NaCl) solution for a total length of up to 75 min. An initial bolus of 10 mg of S-Ketamine was administered over 5 min, followed by a maintenance infusion of 0.006 mg/kg/min. As ketamine plasma levels accumulate with continuous infusion (54), the infusion rate was reduced by 10% every 10 min. The same procedure was applied during the placebo (0.9% NaCl) condition. The unblinded anesthesiologist did not inform the subjects or rating psychiatrist about the condition; however, ketamine-effects may have led to unblinding. The resting-state EEG was measured at the beginning of the session. An anesthesiologist monitored heart rate, blood pressure, oxygen saturation, and vigilance during both sessions.
Resting State EEG Recording and Pre-processing
The EEG recording chamber was electrically shielded and sound-attenuated. The subjects were seated comfortably with their eyes closed while continuous EEG activity was recorded over 5–6 min. A 64-channels-EEG was recorded at a sampling rate of 1,000 Hz, with active electrodes mounted on an elastic cap (ActiCaps, Brain Products, Gilching, Germany) via the Brain Vision Recorder Software Version 1.10 (Brain Products, Gilching, Germany). Electrodes were positioned in an extended 10–20 system with the additional positions: AF7, AF3, AF4, AF8, F5, F1, F2, F6, F10, FT9, FT7, FC3, FC4, FT8, FT10, C5, C1, C2, C6, TP7, CPz, TP8, P5, P1, P2, P6, PO3, POz, and PO4. Eye movements were recorded by four EOG channels. Impedances were kept below 5 kΩ.
Offline preprocessing was carried out using the Brain Vision Analyzer (BVA) Version 2.1.0.327 (Brain Products, Gilching, Germany). After a Butterworth zero-phase band-pass filtering (0.1–100 Hz; 12 dB/octave), ocular and muscle artifacts were removed using an independent component analysis (ICA). The continuous EEG was segmented into epochs of 2,000 ms after re-referencing to the common average reference. A notch filter was applied to remove 50 Hz line noise.
For the scalp surface analysis, both the power and the current source density (CSD) were measured. The CSD was computed using the 4th order spherical spline interpolation and a maximal Degree of Legendre Polynomials of 10 (55). The EEG spectral analysis was based on a full-spectrum voltage Fast Fourier Transform (FFT) algorithm with a resolution of 0.5 Hz, which was used on the averaged data. The electrodes were grouped into different regions of laterality (left, right, middle) and region (frontal, temporo-central and posterior regions) for the pooled analysis. For precise electrode locations selected for electrode pools, please view the Supplementary Table 2. Mean values of the frequency-ranges (4–8 and 30–40 Hz) were computed for the scalp-level analysis. The spectra for both conditions were calculated with a grand average and a linear derivation.
Source space analyses were calculated in Matlab Version R2015a (Mathworks, Natick, USA) using custom-made scripts. Source-space localization analyses were computed using the exact low-resolution electromagnetic tomography (eLORETA) software (56). The center frequencies of the wavelet were set to 6 for the theta and 40 Hz for the gamma frequency range. Time-series were calculated for 80 source-space regions corresponding to the Automated Anatomical Labeling Atlas (40 for each hemisphere, see Supplementary Table 1 for the precise coordinates). Connectivity analyses were based on (80*79/2=) 3,160 pairs of sources. Zero-lag interactions from connectivity analyses were excluded, based on the concept that volume conduction occurs instantaneously, while true interactions occur at variable time delays (57). We used the Multivariate Interaction Measure (MIM) (58) for the connectivity analysis. This multivariate measure does not assume a fixed source direction at a given grid point and takes into account that the estimated activity at a given grid point reflects not only neural activation of that point but also of its vicinity.
Statistical Analyses
Statistical analyses were performed using IBM SPSS Statistics Version 27. 5D-ASC scores were compared by paired-sample t-tests. PANSS scores were analyzed by repeated measure analyses of variance (RM-ANOVA) with the session (baseline, placebo, and ketamine) as within-subject factors. Scalp-level-differences in power and CSD were assessed by RM-ANOVA for each frequency band separately, with condition (placebo, ketamine), region (anterior, temporal-central, posterior), and laterality (left, middle, right) as factors. If Mauchly's test of sphericity indicated that the assumption of sphericity was violated, the degrees of freedom were corrected using the Greenhouse-Geisser estimates of sphericity. A multivariate linear regression analysis with the differences between the placebo and ketamine resting-state scalp- or network-activity as dependent variables and the differences between the intensity of schizophrenia-like symptoms as predictors (5 PANSS factors or 11 5D-ASC factors) were used to assess associations. Post-hoc bivariate Pearson's correlation coefficients explored the relationship between psychopathological changes and neurophysiological measures. Bonferroni corrections were applied to adjust for multiple comparisons.
For the source-level analysis, we used the network-based statistic (NBS), which corresponds to an application of cluster-based thresholding of statistical parametric maps to the graph model (59, 60). The open-source toolbox NBS Connectome v1.2 (http://www.nitrc.org/projects/nbs, last accessed on Feb 19, 2021) was used for the analysis (please see Supplementary Material for details). When comparing networks, the significance level was set to 0.025 because effects were tested in both directions. In all other analyses, the significance level was set to α = 0.05. The strength of the significant network was calculated for each subject and both conditions.
Results
Psychopathological Symptoms
The RM-ANOVA showed significant effects of session (baseline, placebo, ketamine) on all subscales of the PANSS (positive symptoms: F(2,76) = 30.49, p < 0.001; negative symptoms: F(2,76) = 54.18, p < 0.001; disorganization symptoms: F(2,76) = 90.18, p < 0.001; excitement: F(2,76) = 38.80, p < 0.001; emotional distress: F(2,76) = 51.74, p < 0.001). All five factors were significantly increased after ketamine administration compared to placebo administration and baseline values according to post-hoc t-tests. There were no significant differences between the baseline and the placebo session (Figure 1). The paired-samples t-test showed significant increases (p < 0.01) in all 11 subscales of the 5D-ASC-questionnaire (Figure 2).
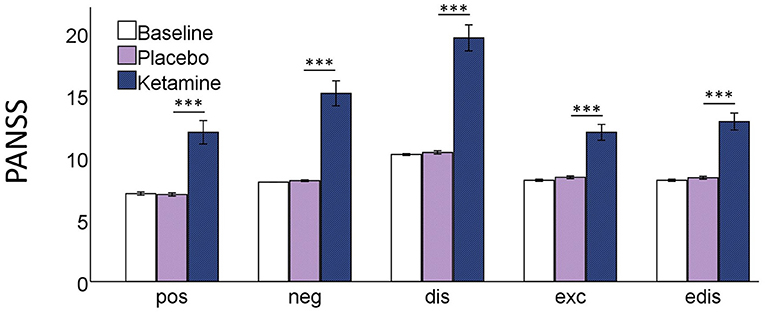
Figure 1. Bar charts of the mean values of the five PANSS subscales; pos positive symptoms, neg negative symptoms, dis disorganisation, exc excitement, edis emotional distress; with error bars representing ±1 standard errors of the mean (***p < 0.001).
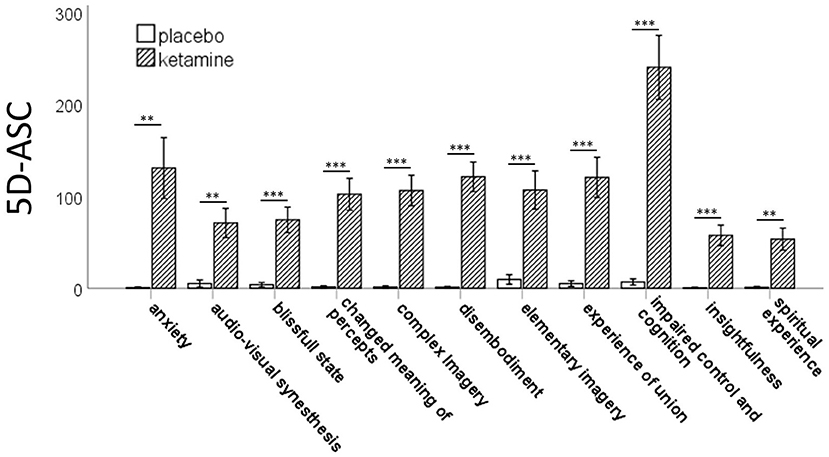
Figure 2. Bar charts of the mean values of the 11 subscales of the 5D-ASC-scale with error bars representing ±1 standard errors of the mean (**p < 0.01;***p < 0.001).
Ketamine-Induced Changes of Resting-State Oscillations
The mean power was plotted as a function of frequency for both the placebo and the ketamine condition (Figures 3A,B). The resting-state oscillatory power was elevated under the influence of ketamine for the frequency ranges of 4.5–8 Hz, 12–14 Hz, and above 22,5 Hz (>1 in Figure 3C).
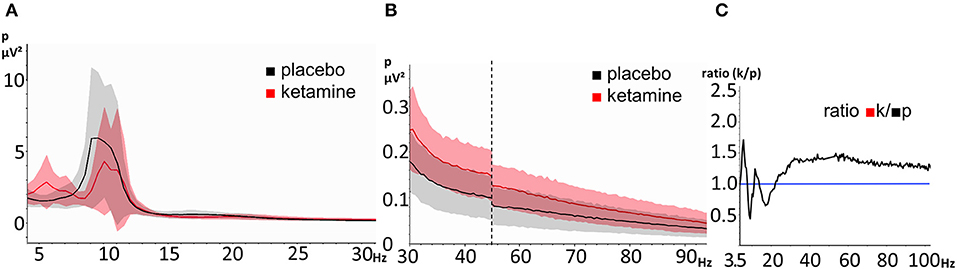
Figure 3. EEG resting-state power spectra during the ketamine and placebo condition. The shaded areas represent the standard deviation (red = ketamine, gray = placebo). (A) frequency-range 3,5 Hz- 30Hz, (B) frequency-range 30–100 Hz (the vertical dashed line indicates scale-break between 45 and 55 Hz) and (C) ratio of power between ketamine (numerator) and placebo (denominator) (range: 3.5–100 Hz). The horizontal line represents a ratio of 1.
Scalp-Level Resting-State EEG Analysis
An RM-ANOVA was performed in order to examine the interaction of the factors condition (ketamine, placebo), region on the scalp (frontal, temporo-central, occipital), and laterality (left, middle, right) regarding resting-state gamma- (30–40Hz) and theta-power (4–8Hz). There was a significant three-way interaction of condition x region x laterality on gamma-power, F(2.6,53.7) = 6.3, p = 0.002, ε = 0.64. The Bonferroni-corrected post-hoc paired sample t-tests showed a significant increase in resting-state gamma-power under the influence of ketamine in all regions, except for the frontal left and right region (see Table 1 and Figure 4A). The same approach for the theta-band (4–8 Hz) revealed a significant two-way interaction of condition x laterality on theta power F(1.2,24.7) = 43.9, p < 0.001, ε = 0.50. The Bonferroni-corrected post-hoc paired sample t-tests showed a significant increase in resting-state theta-power under the influence of ketamine in the middle regions (see Table 1 and Figure 4B).
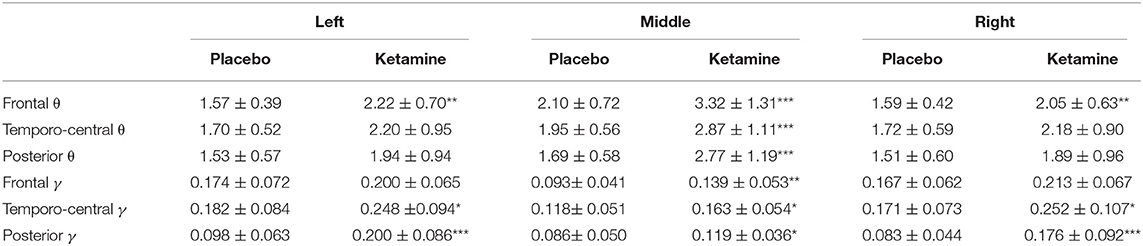
Table 1. Mean power (in μV2) (± SD) in the gamma γ (30–40Hz) and theta θ (4–8 Hz) frequency range for different regions, laterality and condition (***p < 0.001, **p < 0.01, *p < 0.05)].
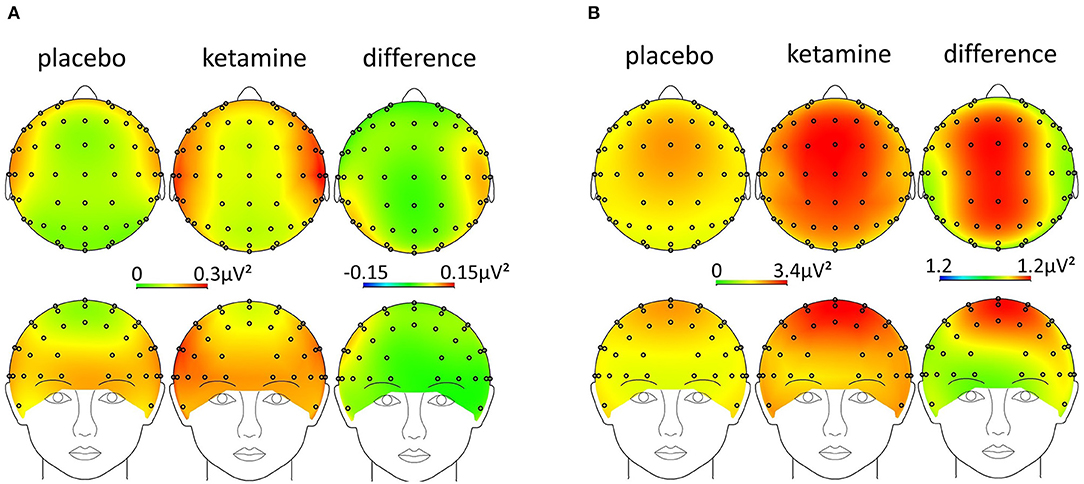
Figure 4. Scalp-topography [ketamine, placebo, and difference (ketamine-placebo)] in the (A) gamma- (30–40 Hz) and (B) theta-band (4–8 Hz).
For the reference-free current source density (CSD) in the gamma-band (30–40 Hz), the RM-ANOVA revealed a significant two-way interaction of condition x region F(2,47) = 4.1, p = 0.024. For the CSD in the theta-band (4–8 Hz), the RM-ANOVA revealed two significant two-way interactions of condition x region F(1.5,32.0) = 4.026, p = 0.0373, ε = 0.76 and condition x laterality F(2,42) = 3.5, p = 0.0381. The Bonferroni-corrected post-hoc paired sample t-tests showed a significant increase in resting-state gamma-CSD, though only in the posterior right region (see Table 2).
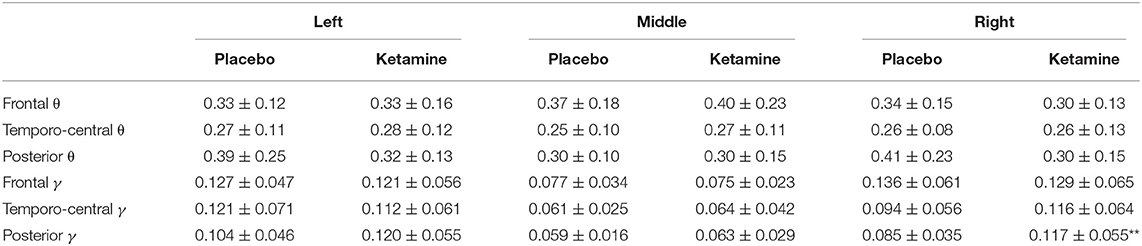
Table 2. Mean CSD (in μV/m2) (± SD) in the gamma γ (30–40Hz) and theta θ (4–8 Hz) frequency range for different regions, laterality and condition (**p < 0.01).
Source-Level Gamma-Band and Theta-Band Connectivity Changes
NBS revealed a network displaying increased connectivity in the gamma-band during ketamine administration compared to placebo with the imaginary coherence-based Multivariate Interaction Measure (MIM) being the measure of connectivity (threshold t = 3.2, corr. p = 0.0034). This network comprised 45 connections involving midline regions, the cuneus, the precuneus and the bilateral posterior cingulate cortex (Table 3, Figure 5A). NBS also revealed a network displaying increased MIM-connectivity in the theta-band during ketamine administration compared to placebo (threshold t = 4.8, corr. p < 0.0001). This network comprised 39 connections involving the Heschl gyrus and midline regions, the insula, and the middle cingulate cortex (Table 3, Figure 5B). Mean connectivity values within the networks mentioned above are displayed in Figure 6. There was a significant increase in the MIM-activity in both the respective gamma-network under the influence of ketamine (M = 0.0077, SD = 0.0054) compared to placebo (M = 0.00327, SD = 0.0012); t(21) = −6.194, p < 0.001; and in the theta-network under the influence of ketamine (M = 2.4, SD = 0.9) compared to placebo (M = 1.7, SD = 0.5), t(21) = −3.869, p < 0.001.
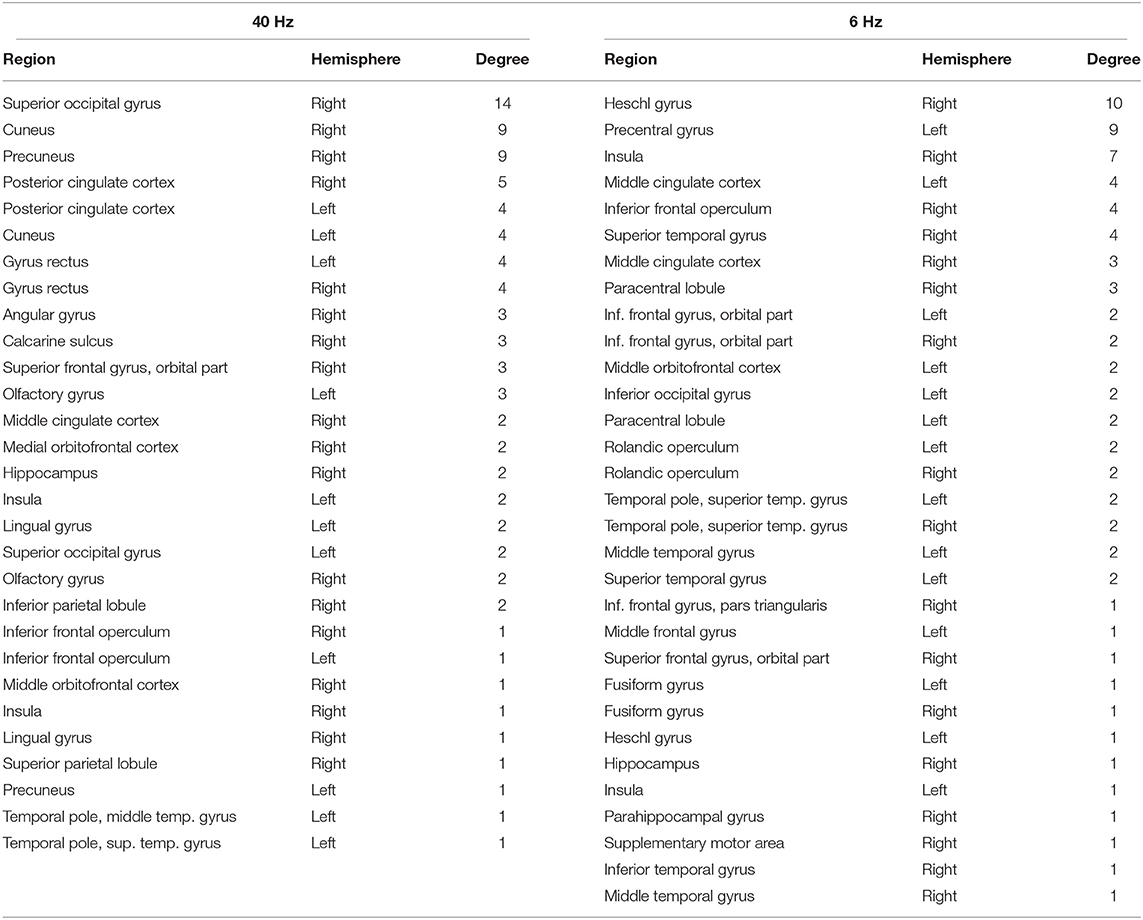
Table 3. Brain regions included in the networks of increased gamma and theta connectivity under the influence of ketamine compared to placebo condition, in the order of their degree (number of connections) within the network.
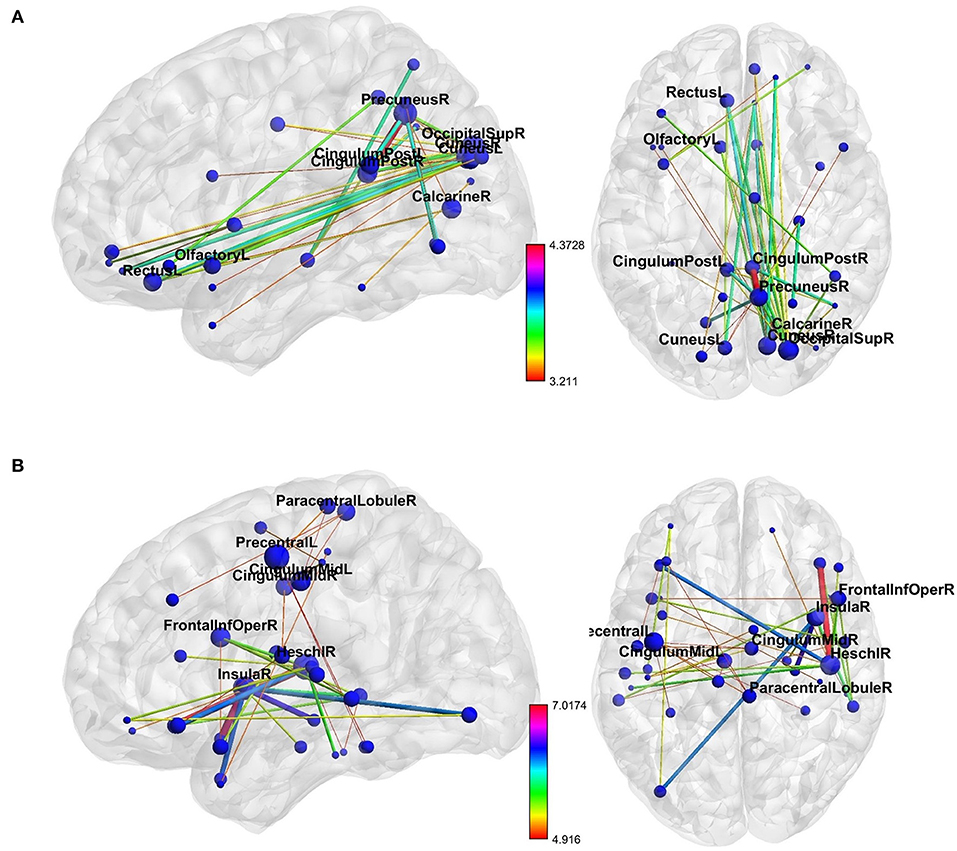
Figure 5. The networks of increased resting-state (A) gamma- and (B) theta-band connectivity during the ketamine compared to placebo administration. The size of each node represents its number of connections within the network (degree). The thickness and color of connections represent the t-value. Labels are provided for nodes with at least three connections. As shown in Table 3, these nodes are involved in more than 50% of total interactions within the theta-network and more than 70% of total interactions within the gamma-network. The figure was created using BrainNet Viewer (http://www.nitrc.org/projects/bnv/).
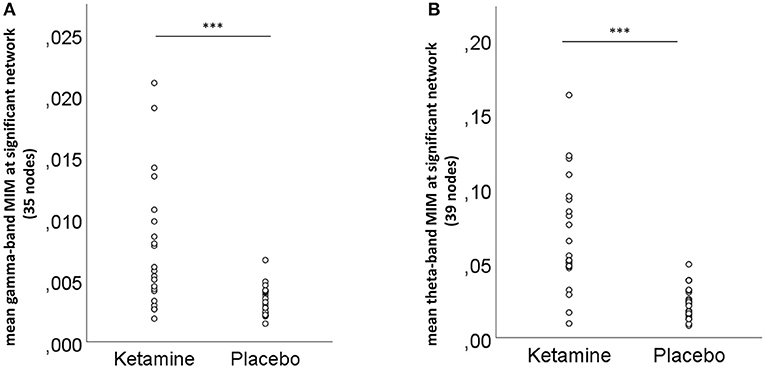
Figure 6. Mean (A) gamma- and (B) theta-band connectivity across the nodes of the significant networks for the ketamine and placebo condition, ***p < 0.001 (Bonferroni-corrected).
Association Between Neurophysiological Measures and Psychopathological Variables
The multiple linear regression analysis indicated that only the 5D-ASC changed meaning of percepts factor of the 5D-ASC under the influence of ketamine significantly predicted the mean activity within the significant gamma-band network [F(1,19) = 5.304; p = 0.037], while other factors were not significantly associated when controlling for the effect of all other symptoms. There was also a significant correlation between the changed meaning of percepts score and the mean network strength in the post-hoc bivariate correlation analysis (Pearson's r = −0.534; n = 21; p = 0.008) (Figure 7). Another multiple linear regression analysis revealed that the resting-state gamma-CSD under ketamine was a significant predictor of the PANSS negative factor when entering all 9 regions and all PANSS-subscales in the model. The model showed significant results for associations between the resting-state gamma-CSD in the middle temporal-central area, the frontal left and middle area, the left and middle temporo-central area, and the middle posterior area and PANSS negative symptoms score F(1,20) = 5.3–13.283, p ≤ 0.036. There were no significant associations between the other PANSS subscales and CSD-scores. A negative bivariate correlation between the PANSS negative symptoms score and the mean CSD was confirmed in 4 of the 6 regions from the previous analysis after correlation Bonferroni correction (see Figure 7). RS-TBO measures were not associated with schizophrenia-like symptoms.
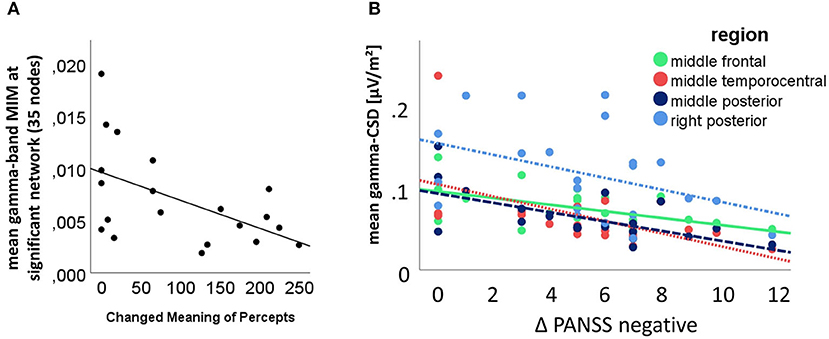
Figure 7. (A) Significant multivariate analysis of variance result, with the mean connectivity within the significant 45 connections involving gamma-network as dependent variable and the 5D-ASC changed meaning of percepts scale as predictor (bivariate Pearson's r = −0.534; n = 21; p = 0.008); (B) Correlation between the CSD in the significant regions as revealed by the multivariate analysis of variance results and post-hoc t-testing; the bivariate correlations between PANSS-negative factor increase and the middle frontal region (solid green line) (Pearson's r = −0.541; n = 22; p = 0.005), the middle temporo-central region (densely dotted red line) (Pearson's r = −0.562; n = 22; p = 0.003), the posterior middle region (dashed dark blue line) (Pearson's r = −0.627; n = 22; p = 0.001) and the right posterior region (dashdotted light blue line) (Pearson's r = −0.412; n = 22; p = 0.028) were Bonferroni corrected.
Discussion
In this placebo-controlled drug-challenge 64-channel-resting-state-EEG study with a crossover design, we showed that ketamine increases local resting-state synchrony (power and current source density) in the gamma- and theta-frequency range, as well as the long-range oscillatory coupling (connectivity) within frequency-specific networks. The gamma network consisted of occipital, midline, and frontal regions, while the theta network involved the Heschl gyrus, frontal and temporal regions. The current source density (CSD) in the gamma-band was negatively correlated with the PANSS negative factor increase under ketamine. The strength of the significant gamma-networks was associated with the decreased changed meaning of percepts self-rating scale of the 5D-ASC. Ketamine caused psychopathological changes similar to those seen in patients with schizophrenia, which was assessed by PANSS and the 5D-ASC. These results are in line with our hypothesis of a ketamine-induced schizophrenia-like alteration of behavior, perception, and resting-state oscillations due to dysfunction of the NMDAR. The findings argue for the proposed dysfunction of the glutamatergic system as a core pathophysiological mechanism of schizophrenia.
The observation of increased resting-state gamma-band oscillations (RS-GBO) under the influence of ketamine parallels observations made in patients with schizophrenia (11–13, 61). As elaborated in the introduction, the generation of GBO involves a neural microcircuit consisting of pyramidal cells, fast-spiking inhibitory GABA-releasing PV+-interneurons (23), and SST+-interneurons (28). The NMDA-receptors not only on the interneurons but also on the pyramidal cells seem to play an essential role in maintaining this circuitry involved in GBO-formation (62, 63). Our results support the importance of the glutamatergic neurotransmission as the underlying mechanism of disturbed GBO in schizophrenia. They are in line with observations of increased resting-state connectivity in the gamma-band in patients with schizophrenia (20, 64). Di Lorenzo et al. (64) observed significantly higher connectivity between right occipital-prefrontal, occipital-parieto-temporal, and occipital-cingulate ROI-pairs, while Andreou et al. found increased connectivity in bilateral frontal and insula regions and left temporal-midline regions. This study's connectivity patterns with an involvement of the right occipital and cingulate area parallel the findings from schizophrenia patients and are consistent with other RS-ketamine-studies, which found increased RS-GBO (42–44, 65). The gamma network involved areas relevant for auditory–spatial processing, working memory, attention and regions of the default mode network, which have been described to be affected in schizophrenia (66–69). Accordingly, the present results may link aberrant RS-gamma-band connectivity, glutamatergic deficits, and core clinical symptoms of schizophrenia.
The changed meaning of percepts factor of the 5D-ASC, which was negatively correlated with the RS-GBO-network, consisted of three items: 1. “Everyday things gained a special meaning.” 2. “Things around me had a new, strange meaning for me.” 3. “Objects around me engaged me emotionally much more than usual.” These items resemble the delusional mood, or “Wahnstimmung,” first described by Klaus Conrad in 1958 and Mishara (70), which is typically seen in the early stages of schizophrenia, before actual delusions or other positive symptoms evolve. Interestingly, Andreou et al. also showed a negative correlation between a resting-state gamma-network in patients with schizophrenia and positive/disorganization measured by the PANSS (20). Consistently, a resting-state ketamine-MEG-study showed a negative correlation between the source-power in the right hippocampus, which was also part of the network in this study, and positive symptoms (41). While these results resemble patients with a first-episode of schizophrenia, a comparison among different illness stages would be interesting. In a recent study, Grent-'t-Jong et al. (13) explored RS-GBOs in participants meeting clinical high-risk criteria, first-episode patients, and patients with chronic schizophrenia (13). Interestingly, in the chronic schizophrenia-group, PANSS-scores were correlated with a reduction of gamma-band power, especially in the gamma-band range between 30 and 46 Hz. This is also in line with our findings of a negative correlation between RS-CSD-GBO and negative symptoms. Grent-'t-Jong et al. (13) findings of a reduction of RS-power between a first-episode and chronic-schizophrenia emphases a higher consistency between the ketamine-model of schizophrenia and earlier stages of the disease.
Consistent with our results, increased resting-state theta-band oscillations (RS-TBO) in schizophrenia patients have been observed in most MEG and EEG studies (17). As some animal studies suggest, the underlying mechanism of the generation of TBO is believed to depend on glutamatergic neurotransmission via the NMDAR (71), which is supported by this study. Several studies also showed increased theta-band connectivity patterns in patients with schizophrenia (15, 22, 64). Andreou et al. observed increased connectivity in frontal, temporal, parietal, and midline areas using the same Multivariate Interaction Measure (MIM) utilized in this study, making the two studies highly comparable. Our study showed a substantial number of connections leading to the precentral left gyrus comparable to the study of Andreou et al. In contrast to medicated patients suffering from their first episode of schizophrenia, healthy subjects receiving ketamine had additional right hemisphere regions involved in the network. A possible explanation would be an influence of dopaminergic drugs on the networks in the schizophrenia studies or an emerging dysconnectivity throughout the disease. The number of resting-state studies exploring drug-naïve resting-state oscillatory patterns before and after therapy is still limited (72). Future studies with drug-naïve patients and studies within the ketamine model of schizophrenia could involve modulation by dopaminergic substances. The increase of theta-band connectivity in this study involved a distinct network comprising areas relevant for auditory processing (73), motor-function (74), representations of the self (75), areas relevant to language processing (76) and thought disorders (77), all of them highly relevant for schizophrenia.
As mentioned before, this study was part of a larger project with the same subjects. During the same session, subjects were examined not only with respect to resting-state oscillations, but also regarding other neurophysiological biomarkers of schizophrenia within the theta band (mismatch negativity [MMN]) (45), and gamma-band; both evoked GBO (47) and interhemispheric gamma-connectivity between auditory cortices (46). Interestingly the measures of GBO within the ketamine-model of schizophrenia showed diverse oscillatory patterns, strongly resembling schizophrenia patients: (1) the RS-GBO and TBO were elevated as shown in this study, (2) sensory-evoked gamma-band responses were reduced (47), (3) interhemispheric-coupling was increased (46) and (3) MMN, that reflects activity primarily within the theta (4–7Hz) frequency band (78), was reduced (46). These contrasting results do not only parallel characteristic findings seen in patients with schizophrenia (79–82) but are also reinforced by basic research studies. In an optogenetic mouse model, a light-activation of glutamate PV+-interneurons, resulted in both elevated resting-state GBO and reduced evoked gamma-oscillations (26). Taking all the above into account, the ketamine-model of schizophrenia can help to identify and develop potential biomarkers (treatment response prediction biomarkers and therapeutic monitoring biomarkers) that are connected to molecular targets for glutamatergic treatment options and to clinical symptoms (83).
This study both explored the scalp-CSD and the power, as both measures are reported frequently in schizophrenia studies. However, the CSD has several advantages and is suggested as a superior measure of RS-scalp analysis for several reasons (84). As a reference-free method, it avoids difficulties related to reference-dependent EEG measures, it has a sharper topography by reducing the negative impact of volume conduction and more closely represents underlying neuronal activity (85). In this study, scalp level gamma- and theta RS-power-changes have been observed in several regions, while CSD only revealed a significant activity change in the posterior right region. This might be due to the reduction of volume conduction. As only PANSS-negative symptoms were correlated with CSD-measures of scalp RS-gamma-activity, not with power changes, it can be reasoned that CSD-measures represent brain activity related to clinical symptoms of schizophrenia. We therefore strongly support the reporting of scalp-CSD.
A limitation of this study, like others, was that the ketamine-effects could have caused an unblinding. While controlling with NaCl has certain advantages on the EEG level, controlling with another drug with psychotomimetic actions could help overcome this bias in future studies. Using a dopaminergic drug as control could also help compare the glutamate and dopamine effects on the same neurophysiological measures. The issue of possible false-positive findings arising from the multiplicity of analyses used in this study had to be addressed. Accordingly, we used Bonferroni-corrected post-hoc t-tests after preselecting the data with RM-ANOVA or linear regression analysis and the non-parametric statistical method implemented in NBS to deal with the multiple comparisons problem on a graph.
The sample studied only consisted of highly educated male volunteers with a tight age range of 20–32 years. While the age of the participants is reasonable in view of the typical age of onset for schizophrenia (86), further studies should include female subjects.
On the scalp level, the statistical method used only showed robust effects. Other methods like the non-parametric statistical testing and cluster-based analysis approach could have revealed more subtle changes (87).
In conclusion, we report ketamine-induced increases of local resting-state synchrony within the gamma and theta band and increased long-range oscillatory coupling, measured by the imaginary coherence-based Multivariate Interaction Measure (MIM), in healthy subjects. In the source-space, network-based statistics identified two significant cortical networks within 80 predefined cortical regions. The gamma-network consisted of midline regions, the cuneus, the precuneus, and the bilateral posterior cingulate cortices, while the theta-band network involved the Heschl gyrus, midline regions, the insula, and the middle cingulate cortex. This study showed the relevance of local and network synchrony in the gamma-band for schizophrenia-like negative symptoms and delusional mood-like symptoms. The schizophrenia-like gamma- and theta-oscillatory fingerprints under the influence of ketamine, the crucial role of glutamatergic neurotransmission in the generation of gamma- and theta- oscillations, and its association with clinical symptoms, all strongly support the glutamate hypothesis of schizophrenia. This study establishes a link between preclinical studies and resting-state studies of patients suffering from schizophrenia. The results argue for an important role of glutamate for the balance in excitatory and inhibitory activity (E/I-balance) within local and long-range oscillatory patterns in the gamma and theta frequency range in schizophrenia. Those patterns could serve as a biomarker for the response of patients to glutamatergic drugs or help to test the eligibility for glutamatergic interventions. The ketamine model of schizophrenia provides a tool for testing the influence of glutamatergic or dopaminergic substances or stimulation settings like rTMS on brain networks and their influence on the clinical symptoms of schizophrenia.
Data Availability Statement
The datasets presented in this article are not readily available due to information that could compromise the privacy of research participants. Requests to access the datasets should be directed to s.curic@uke.de.
Ethics Statement
The study involved human participants and was reviewed and approved by Ethics Committee of the Medical Association Hamburg. The participants provided their written informed consent to participate in this study.
Author Contributions
SC, CM, GL, and CA designed the study and wrote the protocol. MH, ST, NP, SS, and JR managed literature searches and data acquisition. SC, CA, and GN conducted electroencephalographic and statistical analyses. SC and CA interpreted findings. SC wrote the first draft of the manuscript. All authors contributed to and have approved the final manuscript.
Funding
The work was funded by the Deutsche Forschungsgemeinschaft (DFG, German Research Foundation) - SFB 936 - Z1, C6 to GL and CM and SFB/TRR 135 project B7 to CM.
Conflict of Interest
The authors declare that the research was conducted in the absence of any commercial or financial relationships that could be construed as a potential conflict of interest.
Supplementary Material
The Supplementary Material for this article can be found online at: https://www.frontiersin.org/articles/10.3389/fpsyt.2021.671007/full#supplementary-material
References
1. Uhlhaas PJ, Singer W. Abnormal neural oscillations and synchrony in schizophrenia. Nat Rev Neurosci. (2010) 11:100–13. doi: 10.1038/nrn2774
2. Lisman JE, Jensen O. The θ-γ neural code. Neuron. (2013) 77:1002–16. doi: 10.1016/j.neuron.2013.03.007
3. Gandal MJ, Edgar JC, Klook K, Siegel SJ. Gamma synchrony: towards a translational biomarker for the treatment-resistant symptoms of schizophrenia. Neuropharmacology. (2012) 62:1504–18. doi: 10.1016/j.neuropharm.2011.02.007
4. von Stein A, Chiang C, Konig P. Top-down processing mediated by interareal synchronization. Proc Natl Acad Sci USA. (2000) 97:14748–53. doi: 10.1073/pnas.97.26.14748
5. Uhlhaas PJ, Singer W. High-frequency oscillations and the neurobiology of schizophrenia. Dialogues Clin Neurosci. (2013) 15:301–13. doi: 10.31887/DCNS.2013.15.3/puhlhaas
6. Leicht G, Andreou C, Nafe T, Nägele F, Rauh J, Curic S, et al. Alterations of oscillatory neuronal activity during reward processing in schizophrenia. J Psychiatr Res. (2020) 129:80–7. doi: 10.1016/j.jpsychires.2020.05.031
7. Leicht G, Andreou C, Polomac N, Lanig C, Schöttle D, Lambert M, et al. Reduced auditory evoked gamma band response and cognitive processing deficits in first episode schizophrenia. World J Biol Psychiatry. (2015) 16:387–97. doi: 10.3109/15622975.2015.1017605
8. Friston K. A theory of cortical responses. Philos Trans R Soc B Biol Sci. (2005) 360:815–36. doi: 10.1098/rstb.2005.1622
9. Engel AK, Gerloff C, Hilgetag CC, Nolte G. Intrinsic coupling modes: multiscale interactions in ongoing brain activity. Neuron. (2013) 80:867–86. doi: 10.1016/j.neuron.2013.09.038
10. Li S, Hu N, Zhang W, Tao B, Dai J, Gong Y, et al. Dysconnectivity of multiple brain networks in schizophrenia: a meta-analysis of resting-state functional connectivity. Front Psychiatry. (2019) 10:482. doi: 10.3389/fpsyt.2019.00482
11. Baradits M, Kakuszi B, Bálint S, Fullajtár M, Mód L, Bitter I, et al. Alterations in resting-state gamma activity in patients with schizophrenia: a high-density eEG study. Eur Arch Psychiatry Clin Neurosci. (2019) 269:429–37. doi: 10.1007/s00406-018-0889-z
12. Yadav S, Haque Nizamie S, Das B, Das J, Tikka SK. Resting state quantitative electroencephalogram gamma power spectra in patients with first episode psychosis: an observational study. Asian J Psychiatr. (2021) 57:102550. doi: 10.1016/j.ajp.2021.102550
13. Grent-'t-Jong T, Gross J, Goense J, Wibral M, Gajwani R, Gumley AI, et al. Resting-state gamma-band power alterations in schizophrenia reveal E/I-balance abnormalities across illness-stages. eLife. (2018) 7:e37799. doi: 10.7554/eLife.37799.017
14. Hanslmayr S, Backes H, Straub S, Popov T, Langguth B, Hajak G, et al. Enhanced resting-state oscillations in schizophrenia are associated with decreased synchronization during inattentional blindness. Hum Brain Mapp. (2013) 34:2266–75. doi: 10.1002/hbm.22064
15. Andreou C, Leicht G, Nolte G, Polomac N, Moritz S, Karow A, et al. Resting-state theta-band connectivity and verbal memory in schizophrenia and in the high-risk state. Schizophr Res. (2015) 161:299–307. doi: 10.1016/j.schres.2014.12.018
16. Alamian G, Hincapié AS, Pascarella A, Thiery T, Combrisson E, Saive AL, et al. Measuring alterations in oscillatory brain networks in schizophrenia with resting-state MEG: state-of-the-art and methodological challenges. Clin Neurophysiol. (2017) 128:1719–36. doi: 10.1016/j.clinph.2017.06.246
17. Newson JJ, Thiagarajan TC. EEG frequency bands in psychiatric disorders: a review of resting state studies. Front Hum Neurosci. (2018) 12:521. doi: 10.3389/fnhum.2018.00521
18. Canuet L, Ishii R, Pascual-Marqui RD, Iwase M, Kurimoto R, Aoki Y, et al. Resting-state EEG source localization and functional connectivity in schizophrenia-like psychosis of epilepsy. PLoS ONE. (2011) 6:e27863. doi: 10.1371/journal.pone.0027863
19. Friston K, Brown HR, Siemerkus J, Stephan KE. The dysconnection hypothesis 2016. Schizophr Res. (2016) 176:83–94. doi: 10.1016/j.schres.2016.07.014
20. Andreou C, Nolte G, Leicht G, Polomac N, Hanganu-Opatz IL, Lambert M, et al. Increased resting-state gamma-band connectivity in first-episode schizophrenia. Schizophr Bull. (2015) 41:930–9. doi: 10.1093/schbul/sbu121
21. Kim S, Kim Y-W, Shim M, Jin MJ, Im C-H, Lee S-H. Altered cortical functional networks in patients with schizophrenia and bipolar disorder: a resting-state electroencephalographic study. Front Psychiatry. (2020) 11:661. doi: 10.3389/fpsyt.2020.00661
22. Umesh DS, Tikka SK, Goyal N, Nizamie SH, Sinha VK. Resting state theta band source distribution and functional connectivity in remitted schizophrenia. Neurosci Lett. (2016) 630:199–202. doi: 10.1016/j.neulet.2016.07.055
23. Sohal VS, Zhang F, Yizhar O, Deisseroth K. Parvalbumin neurons and gamma rhythms enhance cortical circuit performance. Nature. (2009) 459:698–702. doi: 10.1038/nature07991
24. Chung H, Park K, Jang HJ, Kohl MM, Kwag J. Dissociation of somatostatin and parvalbumin interneurons circuit dysfunctions underlying hippocampal theta and gamma oscillations impaired by amyloid β oligomers in vivo. Brain Struct Funct. (2020) 225:935–54. doi: 10.1007/s00429-020-02044-3
25. Park K, Lee J, Jang HJ, Richards BA, Kohl MM, Kwag J. Optogenetic activation of parvalbumin and somatostatin interneurons selectively restores theta-nested gamma oscillations and oscillation-induced spike timing-dependent long-term potentiation impaired by amyloid β oligomers. BMC Biol. (2020) 18:1–20. doi: 10.1186/s12915-019-0732-7
26. Carlen M, Meletis K, Siegle JH, Cardin JA, Futai K, Vierling-Claassen D, et al. A critical role for NMDA receptors in parvalbumin interneurons for gamma rhythm induction and behavior. Mol Psychiatry. (2012) 17:537–48. doi: 10.1038/mp.2011.31
27. Alherz F, Alherz M, Almusawi H. NMDAR hypofunction and somatostatin-expressing GABAergic interneurons and receptors: a newly identified correlation and its effects in schizophrenia. Schizophr Res Cogn. (2017) 8:1–6. doi: 10.1016/j.scog.2017.02.001
28. Antonoudiou P, Tan YL, Kontou G, Upton AL, Mann EO. Parvalbumin and somatostatin interneurons contribute to the generation of hippocampal gamma oscillations. J Neurosci. (2020) 40:7668–87. doi: 10.1523/JNEUROSCI.0261-20.2020
29. Kaar SJ, Angelescu I, Marques TR, Howes OD. Pre-frontal parvalbumin interneurons in schizophrenia: a meta-analysis of post-mortem studies. J Neural Transm. (2019) 126:1637–51. doi: 10.1007/s00702-019-02080-2
30. Van Derveer AB, Bastos G, Ferrell AD, Gallimore CG, Greene ML, Holmes JT, et al. (2020). A role for somatostatin-positive interneurons in neuro-oscillatory and information processing deficits in schizophrenia. Schizophr Bull. doi: 10.1093/schbul/sbaa184. [Epub ahead of print].
31. Kocsis B, Brown RE, McCarley RW, Hajos M. Impact of ketamine on neuronal network dynamics: translational modeling of schizophrenia-relevant deficits. CNS Neurosci Therap. (2013) 19:437–47. doi: 10.1111/cns.12081
32. Javitt DC, Zukin SR. Recent advances in the phencyclidine model of schizophrenia. Am J Psychiatry. (1991) 148:1301–8. doi: 10.1176/ajp.148.10.1301
33. Krystal JH, Karper LP, Seibyl JP, Freeman GK, Delaney R, Bremner JD, et al. Subanesthetic effects of the noncompetitive NMDA antagonist, ketamine, in humans. Psychotomimetic, perceptual, cognitive, neuroendocrine responses. Arch Gen Psychiatry. (1994) 51:199–214. doi: 10.1001/archpsyc.1994.03950030035004
34. Haaf M, Leicht G, Curic S, Mulert C. Glutamatergic deficits in schizophrenia - biomarkers and pharmacological interventions within the ketamine model. Curr Pharm Biotechnol. (2018) 19:293–307. doi: 10.2174/1389201019666180620112528
35. Lee G, Zhou Y. NMDAR hypofunction animal models of schizophrenia. Front Mol Neurosci. (2019) 12:185. doi: 10.3389/fnmol.2019.00185
36. Frohlich J, Van Horn. J. D. Reviewing the ketamine model for schizophrenia. J Psychopharmacol. (2014) 28:287–302. doi: 10.1177/0269881113512909
37. Millan MJ, Fone K, Steckler T, Horan WP. Negative symptoms of schizophrenia: clinical characteristics, pathophysiological substrates, experimental models and prospects for improved treatment. Eur Neuropsychopharmacol. (2014) 24:645–92. doi: 10.1016/j.euroneuro.2014.03.008
38. Zink M, Correll CU. Glutamatergic agents for schizophrenia: current evidence and perspectives. Expert Rev Clin Pharmacol. (2015) 8:335–52. doi: 10.1586/17512433.2015.1040393
39. Zhand N, Attwood DG, Harvey PD. Glutamate modulators for treatment of schizophrenia. Personalized Med Psychiatry. (2019) 15:1–12. doi: 10.1016/j.pmip.2019.02.001
40. Hudgens-Haney ME, Clementz BA, Ivleva EI, Keshavan MS, Pearlson GD, Gershon ES, et al. Cognitive impairment and diminished neural responses constitute a biomarker signature of negative symptoms in psychosis. Schizophr Bull. (2020) 46:1269–81. doi: 10.1093/schbul/sbaa001
41. Rivolta D, Heidegger T, Scheller B, Sauer A, Schaum M, Birkner K, et al. Ketamine dysregulates the amplitude and connectivity of high-frequency oscillations in cortical–subcortical networks in humans: evidence from resting-state magnetoencephalography-recordings. Schizophr Bull. (2015) 41:1105–14. doi: 10.1093/schbul/sbv051
42. de la Salle S, Choueiry J, Shah D, Bowers H, McIntosh J, Ilivitsky V, et al. Effects of ketamine on resting-state EEG activity and their relationship to perceptual/dissociative symptoms in healthy humans. Front Pharmacol. (2016) 7:348. doi: 10.3389/fphar.2016.00348
43. de la Salle S, Choueiry J, Shah D, Bowers H, McIntosh J, Ilivitsky V, et al. Resting-state functional EEG connectivity in salience and default mode networks and their relationship to dissociative symptoms during NMDA receptor antagonism. Pharmacol Biochem Behav. (2021) 201:173092. doi: 10.1016/j.pbb.2020.173092
44. Bianciardi B, Uhlhaas PJ. (2021). Do NMDA-R antagonists re-create patterns of spontaneous gamma-band activity in schizophrenia? A systematic review and perspective. Neurosci Biobehav Rev. 124:308–23. doi: 10.1016/j.neubiorev.2021.02.005
45. Thiebes S, Leicht G, Curic S, Steinmann S, Polomac N, Andreou C, et al. Glutamatergic deficit and schizophrenia-like negative symptoms: new evidence from ketamine-induced mismatch negativity alterations in healthy male humans. J Psychiatry Neurosci. (2017) 42:273–283. doi: 10.1503/jpn.160187
46. Thiebes S, Steinmann S, Curic S, Polomac N, Andreou C, Eichler IC, et al. Alterations in interhemispheric gamma-band connectivity are related to the emergence of auditory verbal hallucinations in healthy subjects during NMDA-receptor blockade. Neuropsychopharmacology. (2018) 43:1608–15. doi: 10.1038/s41386-018-0014-z
47. Curic S, Leicht G, Thiebes S, Andreou C, Polomac N, Eichler IC, et al. Reduced auditory evoked gamma-band response and schizophrenia-like clinical symptoms under subanesthetic ketamine. Neuropsychopharmacology. (2019) 44:1239–46. doi: 10.1038/s41386-019-0328-5
48. Sheehan DV, Lecrubier Y, Sheehan KH, Amorim P, Janavs J, Weiller E, et al. The mini-International neuropsychiatric interview (M.I.N.I.): the development and validation of a structured diagnostic psychiatric interview for DSM-IV and ICD-10. J Clin Psychiatry. (1998) 59(Suppl. 20):22–33.
49. Raine A. The SPQ: a scale for the assessment of schizotypal personality based on DSM-III-R criteria. Schizophr Bull. (1991) 17:555–64. doi: 10.1093/schbul/17.4.555
50. Kay SR, Fiszbein A, Opler LA. The positive and negative syndrome scale (PANSS) for schizophrenia. Schizophr Bull. (1987) 13:261–76. doi: 10.1093/schbul/13.2.261
51. Dittrich A. The standardized psychometric assessment of altered states of consciousness (ASCs) in humans. Pharmacopsychiatry. (1998) 31(Suppl. 2):80–4. doi: 10.1055/s-2007-979351
52. van der Gaag M, Hoffman T, Remijsen M, Hijman R, de Haan L, van Meijel B, et al. The five-factor model of the positive and negative syndrome scale II: a ten-fold cross-validation of a revised model. Schizophr Res. (2006) 85:280–7. doi: 10.1016/j.schres.2006.03.021
53. Studerus E, Gamma A, Vollenweider FX. Psychometric evaluation of the altered states of consciousness rating scale (OAV). PLoS ONE. (2010) 5:e12412. doi: 10.1371/journal.pone.0012412
54. Feng N, Vollenweider FX, Minder EI, Rentsch K, Grampp T, Vonderschmitt DJ. Development of a gas chromatography-mass spectrometry method for determination of ketamine in plasma and its application to human samples. Therap Drug Monitor. (1995) 17:95–100.
55. Perrin F, Pernier J, Bertrand O, Echallier JF. Spherical splines for scalp potential and current density mapping. Electroencephalogr Clin Neurophysiol. (1989) 72:184–7. doi: 10.1016/0013-4694(89)90180-6
56. Pascual-Marqui RD, Lehmann D, Koukkou M, Kochi K, Anderer P, Saletu B, et al. Assessing interactions in the brain with exact low-resolution electromagnetic tomography. Philos Trans A Math Phys Eng Sci. (2011) 369:3768–84. doi: 10.1098/rsta.2011.0081
57. Nolte G, Bai O, Wheaton L, Mari Z, Vorbach S, Hallett M. Identifying true brain interaction from EEG data using the imaginary part of coherency. Clin Neurophysiol. (2004) 115:2292–307. doi: 10.1016/j.clinph.2004.04.029
58. Ewald A, Marzetti L, Zappasodi F, Meinecke FC, Nolte G. Estimating true brain connectivity from EEG/MEG data invariant to linear and static transformations in sensor space. Neuroimage. (2012) 60:476–88. doi: 10.1016/j.neuroimage.2011.11.084
59. Nichols TE, Holmes AP. Nonparametric permutation tests for functional neuroimaging: a primer with examples. Hum Brain Mapp. (2002) 15:1–25. doi: 10.1002/hbm.1058
60. Zalesky A, Fornito A, Bullmore ET. Network-based statistic: identifying differences in brain networks. Neuroimage. (2010) 53:1197–207. doi: 10.1016/j.neuroimage.2010.06.041
61. Koshiyama D, Miyakoshi M, Tanaka-Koshiyama K, Joshi YB, Molina JL, Sprock J, et al. Neurophysiologic characterization of resting state connectivity abnormalities in schizophrenia patients. Front Psychiatry. (2020) 11:608154. doi: 10.3389/fpsyt.2020.608154
62. Tatard-Leitman VM, Jutzeler CR, Suh J, Saunders JA, Billingslea EN, Morita S, et al. Pyramidal cell selective ablation of N-methyl-D-aspartate receptor 1 causes increase in cellular and network excitability. Biol Psychiatry. (2015) 77:556–68. doi: 10.1016/j.biopsych.2014.06.026
63. Bitzenhofer SH, Pöpplau JA, Hanganu-Opatz I. Gamma activity accelerates during prefrontal development. eLife. (2020) 9:e56795. doi: 10.7554/eLife.56795.sa2
64. Di Lorenzo G, Daverio A, Ferrentino F, Santarnecchi E, Ciabattini F, Monaco L, et al. Altered resting-state EEG source functional connectivity in schizophrenia: the effect of illness duration. Front Hum Neurosci. (2015) 9:234. doi: 10.3389/fnhum.2015.00234
65. Zacharias N, Musso F, Müller F, Lammers F, Saleh A, London M, et al. Ketamine effects on default mode network activity and vigilance: a randomized, placebo-controlled crossover simultaneous fMRI/EEG study. Hum Brain Mapp. (2020) 41:107–19. doi: 10.1002/hbm.24791
66. Collignon O, Vandewalle G, Voss P, Albouy G, Charbonneau G, Lassonde M, et al. Functional specialization for auditory–spatial processing in the occipital cortex of congenitally blind humans. Proc Natl Acad Sci USA. (2011) 108:4435–40. doi: 10.1073/pnas.1013928108
67. Seghier ML. The angular gyrus: multiple functions and multiple subdivisions. Neuroscientist. (2013) 19:43–61. doi: 10.1177/1073858412440596
68. Leech R, Sharp DJ. The role of the posterior cingulate cortex in cognition and disease. Brain. (2014) 137(Pt 1):12–32. doi: 10.1093/brain/awt162
69. Van Snellenberg JX, Girgis RR, Horga G, van de Giessen E, Slifstein M, Ojeil N, et al. Mechanisms of working memory impairment in schizophrenia. Biol Psychiatry. (2016) 80:617–26. doi: 10.1016/j.biopsych.2016.02.017
70. Mishara AL. Klaus conrad (1905–1961): delusional mood, psychosis, beginning schizophrenia. Schizophr Bull. (2010) 36:9–13. doi: 10.1093/schbul/sbp144
71. Gu Z, Alexander GM, Dudek SM, Yakel JL. Hippocampus and entorhinal cortex recruit cholinergic and NMDA receptors separately to generate hippocampal theta oscillations. Cell Rep. (2017) 21:3585–95. doi: 10.1016/j.celrep.2017.11.080
72. Mackintosh AJ, de Bock R, Lim Z, Trulley VN, Schmidt A, Borgwardt S, et al. Psychotic disorders, dopaminergic agents and EEG/MEG resting-state functional connectivity: a systematic review. Neurosci Biobehav Rev. (2021) 120:354–71. doi: 10.1016/j.neubiorev.2020.10.021
73. Hare SM, Adhikari BM, Du X, Garcia L, Bruce H, Kochunov P, et al. Local versus long-range connectivity patterns of auditory disturbance in schizophrenia. Schizophr Res. (2021) 228:262–70. doi: 10.1016/j.schres.2020.11.052
74. Zarei M. Precentral gyrus abnormal connectivity in male and female patients with schizophrenia. Neuroimmunol Neuroinflammation. (2018) 5:13. doi: 10.20517/2347-8659.2018.02
75. Wylie KP, Tregellas JR. The role of the insula in schizophrenia. Schizophr Res. (2010) 123:93–104. doi: 10.1016/j.schres.2010.08.027
76. Schremm A, Novén M, Horne M, Söderström P, van Westen D, Roll M. Cortical thickness of planum temporale and pars opercularis in native language tone processing. Brain Lang. (2018) 176:42–7. doi: 10.1016/j.bandl.2017.12.001
77. Rajarethinam RP, DeQuardo JR, Nalepa R, Tandon R. Superior temporal gyrus in schizophrenia: a volumetric magnetic resonance imaging study. Schizophr Res. (2000) 41:303–12. doi: 10.1016/S0920-9964(99)00083-3
78. Javitt DC, Lee M, Kantrowitz JT, Martinez A. Mismatch negativity as a biomarker of theta band oscillatory dysfunction in schizophrenia. Schizophr Res. (2018) 191:51–60. doi: 10.1016/j.schres.2017.06.023
79. Leicht G, Kirsch V, Giegling I, Karch S, Hantschk I, Möller HJ, et al. Reduced early auditory evoked gamma-band response in patients with schizophrenia. Biol Psychiatry. (2010) 67:224–31. doi: 10.1016/j.biopsych.2009.07.033
80. Mulert C, Kirsch V, Pascual-Marqui R, McCarley RW, Spencer KM. Long-range synchrony of γ oscillations and auditory hallucination symptoms in schizophrenia. Int J Psychophysiol. (2011) 79:55–63. doi: 10.1016/j.ijpsycho.2010.08.004
81. Steinmann S, Leicht G, Mulert C. The interhemispheric miscommunication theory of auditory verbal hallucinations in schizophrenia. Int J Psychophysiol. (2019) 145:83–90. doi: 10.1016/j.ijpsycho.2019.02.002
82. Koshiyama D, Miyakoshi M, Thomas ML, Joshi YB, Molina JL, Tanaka-Koshiyama K, et al. Unique contributions of sensory discrimination and gamma synchronization deficits to cognitive, clinical, and psychosocial functional impairments in schizophrenia. Schizophr Res. (2021) 228:280–7. doi: 10.1016/j.schres.2020.12.042
83. Kraguljac NV, McDonald WM, Widge AS, Rodriguez CI, Tohen M, Nemeroff CB. Neuroimaging biomarkers in schizophrenia. Am J Psychiatry. (2021) appi.ajp.2020.2. doi: 10.1176/appi.ajp.2020.20030340. [Epub ahead of print].
84. Babiloni C, Barry RJ, Başar E, Blinowska KJ, Cichocki A, Drinkenburg WHIM, et al. International Federation of Clinical Neurophysiology (IFCN) - EEG research workgroup: recommendations on frequency and topographic analysis of resting state EEG rhythms. Part 1: applications in clinical research studies. Clin Neurophysiol. (2020) 131:285–307. doi: 10.1016/j.clinph.2019.06.234
85. Kayser J, Tenke CE. On the benefits of using surface Laplacian (current source density) methodology in electrophysiology. Int J Psychophysiol. (2015) 97:171.
86. Neill E, Tan EJ, Toh WL, Selvendra A, Morgan VA, Rossell SL, et al. Examining which factors influence age of onset in males and females with schizophrenia. Schizophr Res. (2020) 223:265–70. doi: 10.1016/j.schres.2020.08.011
Keywords: resting state, gamma-band oscillations, theta-band oscillations, functional connectivity, ketamine model of schizophrenia, glutamate hypothesis, negative-symptoms
Citation: Curic S, Andreou C, Nolte G, Steinmann S, Thiebes S, Polomac N, Haaf M, Rauh J, Leicht G and Mulert C (2021) Ketamine Alters Functional Gamma and Theta Resting-State Connectivity in Healthy Humans: Implications for Schizophrenia Treatment Targeting the Glutamate System. Front. Psychiatry 12:671007. doi: 10.3389/fpsyt.2021.671007
Received: 22 February 2021; Accepted: 07 May 2021;
Published: 10 June 2021.
Edited by:
Peter Uhlhaas, University of Glasgow, United KingdomReviewed by:
Sebastian Walther, University of Bern, SwitzerlandDavide Rivolta, University of Bari Aldo Moro, Italy
Peter Liddle, University of Nottingham, United Kingdom
Copyright © 2021 Curic, Andreou, Nolte, Steinmann, Thiebes, Polomac, Haaf, Rauh, Leicht and Mulert. This is an open-access article distributed under the terms of the Creative Commons Attribution License (CC BY). The use, distribution or reproduction in other forums is permitted, provided the original author(s) and the copyright owner(s) are credited and that the original publication in this journal is cited, in accordance with accepted academic practice. No use, distribution or reproduction is permitted which does not comply with these terms.
*Correspondence: Stjepan Curic, s.curic@uke.de