 Zebin Fan1,2,3†
 Jie Yang1,2,3†
 Can Zeng1,2,3Chang Xi1,2,3Guowei Wu1,2,3Shuixia Guo4
 Zhimin Xue1,2,3
 Zhening Liu1,2,3
 Haojuan Tao1,2,3*
- 1Department of Psychiatry, The Second Xiangya Hospital, Central South University, Changsha, China
- 2National Clinical Research Center for Mental Disorders, Changsha, China
- 3National Technology Institute on Mental Disorders, Changsha, China
- 4Mathematics and Computer Science College, Hunan Normal University, Changsha, China
Background: Previous studies suggested bipolar disorder caused an aberrant alteration in the insular, putamen, and left superior frontal gyrus, which are the main components of the hate circuit. However, the relationship between the hate circuit and the pathophysiologic substrate underlying different phases of bipolar disorder remain unclear. In this study, we aimed to identify group differences of resting-state functional connectivity within the hate circuit in healthy controls (HCs) and bipolar patients in different mood states.
Methods: Resting-state functional magnetic resonance imaging of the brain were acquired from 54 HCs and 81 patients with bipolar disorder including 20 with bipolar mania (BM), 35 with bipolar depression (BD), and 26 with bipolar euthymia (BE). We selected bilateral insula (L.INS and R.INS), bilateral putamen (L.PUT and R.PUT), and left superior frontal gyrus (L.SFGd) as seed regions, and conducted the seed-based functional connectivity analysis to identify group differences of connectivity strength within the hate circuit. Spearman correlations were performed to evaluate the relationship between the hate circuit and manic/depressive symptoms.
Results: Significant group differences of connectivity strength within the hate circuit were found in links of the R.INS-L.SFGd, R.PUT-L.SFGd, and L.INS- R.PUT after false discovery rate was corrected. The BM group showed an opposite hate circuit pattern to BD, BE, and HCs. The BD group showed decreased hate circuit connectivity in the L.INS-R.PUT compared with the BE group. No significant difference was detected among BD, BE, and HCs. Furthermore, functional connectivity of the R.INS-L.SFGd and R.PUT-L.SFGd were positively correlated with manic symptoms, while the L.INS- R.PUT was negatively correlated with depressive symptoms.
Conclusions: Our preliminary findings suggest that altered functional connectivity of the hate circuit in different mood phases may be related to state markers and underpin the neuropathological basis of bipolar disorder.
Introduction
Bipolar disorder is a severe mental disorder with a high risk for suicide-related events (1) and has become a leading cause of global disease burden. Bipolar disorder is characterized by mood instability with alternating periods of depression (bipolar depression, BD), (hypo) mania (bipolar mania, BM), and euthymic mood states (bipolar euthymia, BE) (2) and is associated with brain functional dysconnectivity (3). Many findings from structural and functional magnetic resonance imaging (fMRI) studies in bipolar patients have indicated abnormalities in the frontal-limbic pathway, which is responsible for emotional regulation and cognitive control (4–10), However, to date, the pathophysiologic substrate underlying different phases of bipolar disorder remain underexplored (11, 12).
Several studies have concurrently focused on the distinctions of brain function across different mood states in bipolar disorder and found some state-related changes in BM and BD and trait-related neural abnormalities in BE (3, 10, 13–21). Specifically, functional imaging showed hypometabolism within the frontal cortex occurring in depression, while hypermetabolism in mania was observed (21, 22). During cognitive or emotional tasks, the reduced activation in the prefrontal cortex may suggest a trait abnormality across all mood states. Furthermore, the direction of signal changes in the prefrontal gyrus and the subcortical brain regions involving the insula, putamen, and other subcortical areas may be associated with specific acute mood states (10, 18–20). Notably, Hummer TA and colleagues explored brain activation in bipolar disorder across the three different mood phases in an fMRI study using emotional response inhibition tasks, and they found distinct trait- and state-related neural abnormalities mainly associated with the superior frontal gyrus, insula, and putamen in bipolar disorder (10). We noted that the location of the abnormally activated brain regions in the above studies almost overlapped with the main components of the so-called ‘hate circuit’, which is activated when individuals view people who they hate (23).
Hate is one of the intense basic human emotions and plays an important role in psychological behavior and human evolution (24); its core feeling of disgust has been implicated in a wide range of psychological and psychiatric conditions (25–30). Of particular note is that an abundance of research has suggested that hate is critically associated with depressive symptoms (29, 30). More intriguingly, in our previous study, uncoupling of the ‘hate circuit’ was detected in both first-episode and longer-term depressive patients (31). The depressive phase of bipolar disorder is broadly similar to unipolar depression in clinical manifestation, which often obscures the diagnostic distinction. This might hint at the overlap in the neuropathology of depression (32). Furthermore, mania and depression are clinically polar opposites of mood. Thus, it is valuable for us to consider whether the hate circuit is also uncoupled in BD. If so, will the functional connectivity within the hate circuit be enhanced in BM with contrary symptoms to depression? However, to our knowledge, the hate circuit has not been studied in bipolar disorder. Thus, it could be instructive to examine the connectivity pattern of the hate circuit in the different mood states for clues into the trait-related and state-related mark of bipolar disorder, and therefore provide assistance for finding a promising novel biomarker of diagnosis and possible clinical intervention.
In this study, we explored the functional connectivity of the hate circuit underlying different phases of bipolar disorder. Considering the opposing polar of mood and cognitive and psychomotor symptoms in the different bipolar phases, it is possible to hypothesize that functional connectivity of the hate circuit may be different between BM and BE. To test this hypothesis, seed-based analysis in resting-state fMRI was adopted to examine correlations in spontaneous fluctuations among regions of interest (ROIs) in patients with bipolar disorder across different mood states and HCs. Resting-state fMRI is a non-invasive technique that occurrs in the absence of any explicit task or stimulus which can provide measures of tonic functional connectivity in neural circuits of interest and avoid some limitations of the task-related fMRI (33–35). We chose the bilateral insula (i.e., L.INS and R.INS), bilateral putamen (i.e., L.PUT and R.PUT), and left superior frontal gyrus (dorsolateral part; L. SFGd) as ROIs according to the main abnormal connectivity in depression of our prior study (31). Then, group differences of the functional connectivity strength within the hate circuit were detected using a one-way analysis of covariance (ANCOVA). Finally, the relationship between depressive/manic symptoms and the altered functional connectivity strength were calculated by Spearman correlation.
Materials and Methods
All study procedures were approved by the medical ethics committee of the Second Xiangya Hospital, Central South University. Prior to obtaining consent, the capacity to provide informed consent for all potential participants was ascertained by two licensed psychiatrists. After explaining the study procedures, informed written consent was obtained from all participants. All study procedures were conducted in strict accordance with the Declaration of Helsinki.
Study Sample
In this study, a total of 91 patients with bipolar disorder and 54 HCs were recruited from the inpatient or outpatient department of the Second Xiangya Hospital, Central South University. To minimize the effects of age on brain function and to ensure adequate understanding and expressive capacity, only right-handed Han Chinese aged 18 to 45 years who had at least 9 years of formal education were recruited.
Considering the possible heterogeneity of bipolar disorder type I and bipolar disorder type II (36, 37), only patients with bipolar disorder type I were included in our present study. Patients diagnosed with bipolar disorder type I (bipolar depression, bipolar mania, or euthymic bipolar disorder) were assessed face to face by two experienced psychiatrists using the Structured Clinical Interview for DSM-IV Axis I Disorders, Patient Edition (SCID-I/P) (38). Depressive and manic symptoms were assessed face to face by a psychiatrist using the 17-item version of the Hamilton Depression Rating Scale (HDRS17) (39) and the Young Mania Rating Scale (YMRS), respectively (40). In our present study the YMRS and HDRS17 were completed by an experienced psychiatrist based on the structured interview guide. The scores were based on patients’ self-reports combined with clinician’s observations in the past week. For patients with BD, the HDRS17 total score should be at least 17 and YMRS total score should be less than 6; for patients with BM, the YMRS score was above 12 and the HDRS17 score less than 8; for patients with BE, the HDRS17 score should be no more than 8 and the YMRS score should be less than 6.
HCs were evaluated face to face by a psychiatrist using the Structured Clinical Interview for DSM-IV, Non-Patient Edition (SCID-I/NP) (41). All HCs had no lifetime history of any psychiatric disorders and no first-degree relatives with a history of psychiatric disorders, and the HCs group was age and gender-matched with all three patient groups.
Participants were excluded if they had any of the following: (1) History of neurological diseases or other serious physical diseases; (2) History of electroconvulsive therapy; (3) History of drugs, alcohol, and other psychoactive substance abuse; (4) Comorbidities with other Axis I or Axis II disorders; (5) Any contraindications for MRI; and (6) Had drunk alcohol or taken benzodiazepines within 24 hours prior to the interview and fMRI scanning.
fMRI Data Acquisition and Preprocessing
Imaging data were collected using a 3.0 Tesla Philips Gyrosan Achieva (Amsterdam, The Netherlands) scanner. Participants were explicitly instructed to lie quietly with their eyes closed and stay still in the scanner. Participants were requested to clear their minds to the best of their ability without falling asleep (resting state). A gradient-echo echo-planar imaging (EPI) sequence was used with the following parameters: Repeat time =2000ms, Echo time=30ms, Field of view (FOV) =240mm×240mm, Flip Angle = 90°, Matrix = 64×64, Voxel size =3mm×3mm×3mm, axial slice= 36, slice thickness= 4mm, scanning interval = 0mm, 250 time points. The total scan time was 500s for each participant.
Before fMRI data preprocessing, the first ten volumes were removed to allow for magnetization equilibrium and the subjects’ adaptation to the environment (42). Resting-state fMRI data preprocessing was conducted by DPABI (43). The remaining 240 functional scans were first corrected for within-scan acquisition time differences between slices and realigned to the middle volume to correct for inter-scan movements. All participants in this study had less than 3 mm maximum displacement in x, y, or z and less than 3° of angular rotation about each axis. Then the functional scans were spatially normalized to the standard template (Montreal Neurological Institute), resampled to the voxel size of 3×3×3 mm3, and smoothed with a Gaussian kernel of 4×4×4 mm3 full-width at half maximum. Subsequently, the BOLD signal of each voxel was firstly detrended to abandon linear trends and then passed through a band-pass filter (0.01-0.08 Hz) to reduce low-frequency drift and high-frequency physiological noise. Finally, nuisance covariates, including head motion parameters, global mean signals, white matter signals, and cerebrospinal fluid signals, were regressed out from the BOLD signals. In line with our prior studies (44, 45), we controlled for head motion first through regression of six head motion parameters plus their temporal first derivatives. We also used scrubbing by removing outlier volumes, defined as frame-wise displacement (FD) of more than 0.5 mm from the previous frame or global mean intensity of more than 2 SDs. If more than 48 volumes were scrubbed (ie, >20% of the acquired volumes), we excluded these subjects from subsequent analysis. Ten patients were excluded because of excessive head movement during fMRI scanning. Therefore, there were eighty-one patients involved in the present research analysis with 20 BM patients, 35 BD patients, and 26 BE patients. Details of current psychotropic medication are provided in Supplementary Table S1.
Definition of Seed Regions and Functional Connectivity
We selected the five seed regions (L.SFGd, L.INS, R.INS, L.PUT, and R.PUT) as ROIs based on the reasons mentioned in the introduction. In the present study, ROIs were generated from an automated anatomical labeling (AAL) template which was employed to segment the brain into 90 regions of interest in previous studies (31, 46).
For each ROI, the BOLD time series of the voxels within it was averaged to generate the reference time series for this region. For each subject and each ROI, a functional connectivity correlation matrix was produced by computing the correlation coefficients between the reference time series of one ROI and it from every other ROI. Therefore, a 5×5 symmetric connection matrix and ten links between all pairs of ROIs were obtained for each participant. Functional connectivity correlation coefficients were converted to z values using Fisher’s r-to-z transform (z-FC) to improve the normality. Therefore, each z-FC represented the strength of the functional connectivity in every pair of ROIs.
Statistical Analysis
All the general demographic and clinical assessment data and z-FC values were fed into the Statistic Package for Social Science (SPSS) 22.0 (SPSS, Inc., Chicago, IL). First, one-way ANOVA was performed to compare the group differences in age, education, duration of illness, HDRS17 total score, and YMRS total score. A Chi-square test was used to compare the gender difference among the four groups. We then performed a one-way analysis of covariance (ANCOVA, two-tailed) comparing zFC values for all ROI pairs in the 5×5 matrix for the four groups (BM, BD, BE, and HC). Next, we corrected the resulting p-values for multiple comparisons using a false discovery rate (FDR) correction to control Type I errors at the threshold with p < 0.05. Post-Hoc testing for differences between individual groups was performed using the least significant difference (LSD) test. Finally, Spearman correlation analysis was used to evaluate the relationship between the altered functional connectivity and the HDRS17 total score and YMRS total score.
Results
Demographic and Clinical Characteristics
Demographic information and clinical characteristics were summarized in Table 1. There were no significant differences in age (ANOVA, F = 0.610, p = 0.610) or gender (χ2 = 1.262, p=0.738). The patient groups were matched with duration of illness (ANOVA, F = 1.475, p = 0.235) and Chlorpromazine equivalents (ANOVA, F = 3.045, p = 0.053). However, the BM group had a lower education level than the BD, BE, and HCs group (ANOVA, F = 3.150, p = 0.027; LSD, p<0.05). The BD group had a significantly higher HDRS17 score than BM and BE groups, while the BM group had a higher YMRS score than the BD and BE groups. Detailed results of Post-hoc LSD tests in education level, HDRS17 score, and YMRS score were also provided in Table 1.
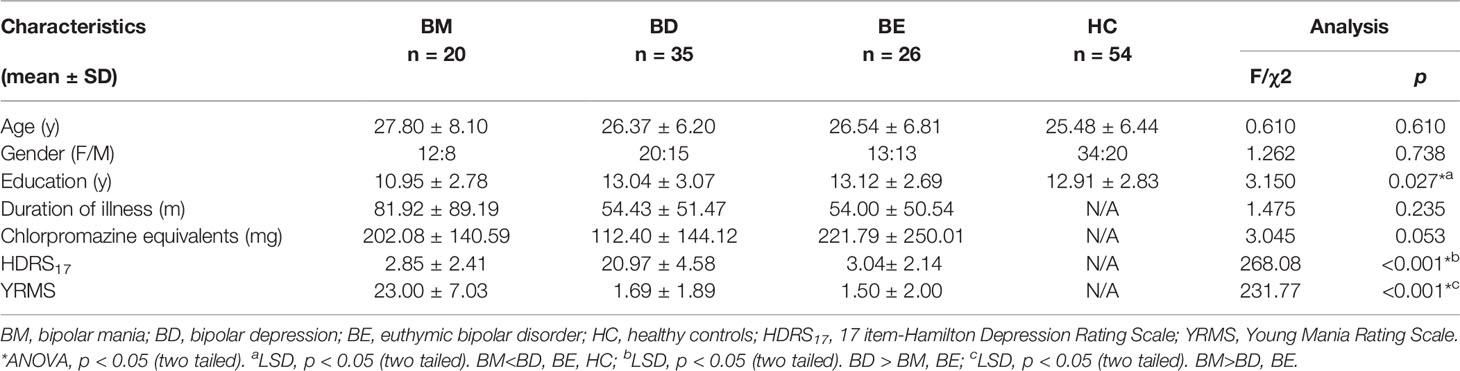
Table 1 Demographic and clinical profiles of patients with BM, BD, BE, and HC.
Abnormal Functional Connectivity in Hate Circuit
The mean value of each functional connection in the four groups were shown in Table 2. A trend of higher mean values of the functional connectivity strength within the hate circuit was shown in the BM group while a lower trend was shown in the BD group relative to the HCs group. The mean value of the functional connectivity strength within the hate circuit in the BE group was comparable to that of the HCs group (see Table 2 and Figure 1).
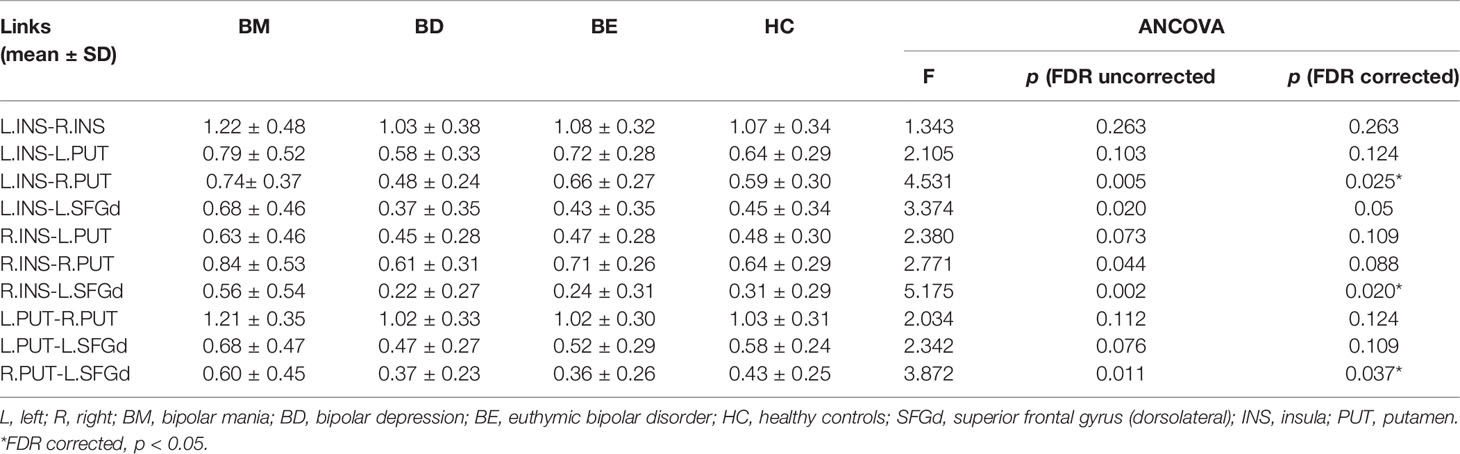
Table 2 Mean value of functional connectivity in each group and the group difference analysis.
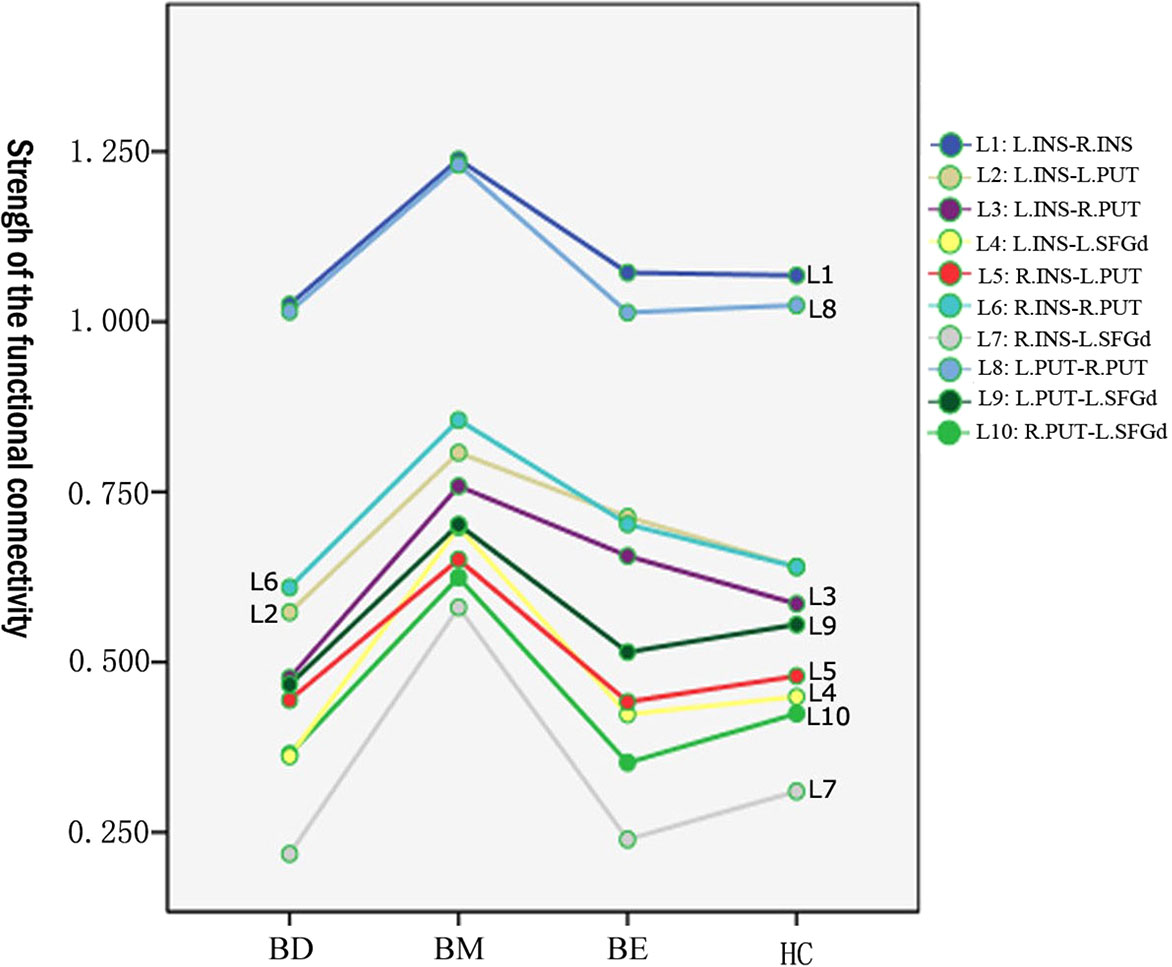
Figure 1 Means value of the functional connectivity strength of each link in the hate circuit in BM, BD, BE, and HC groups. BD, bipolar depression; BM, bipolar mania; BE, euthymic bipolar disorder; HC, healthy controls.
After adjusting for education level and FDR correction, significant group differences of functional connectivity strength were found in L.INS-R.PUT (p=0.005; FDR corrected p=0.025), R.INS-L.SFGd (p=0.002; FDR corrected p=0.02), and R.PUT-L.SFGd (p=0.011; FDR corrected p=0.037) (see Table 2). A significant trend of group differences was shown in L.INS-L.SFGd (p=0.02; FDR corrected p=0.05).
Post-hoc LSD showed that the functional connectivity strength of the R.INS-L.SFGd and R.PUT- L.SFGd in the BM group were significantly higher than that in the BD, BE, and HCs groups. However, there were no significant differences in the functional connection values of the R.INS-L.SFGd and R.PUT- L.SFGd among BD, BE, and HCs. Moreover, the functional connectivity of the L.INS-R.PUT in the BD group was significantly lower than that in BM and BE groups, while in the BM group it was higher than HCs. No significant difference in the functional connectivity strength of L.INS-R.PUT was detected between BM and BE or among BD, BE, and HCs (see Table 3 and Figure 2).
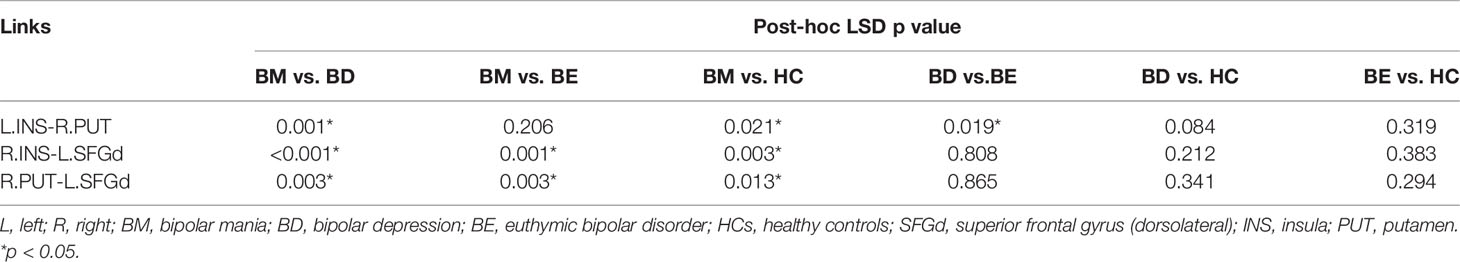
Table 3 Between-group differences of the significant changed links in the hate circuit (p-values for LSD post-hoc testing).
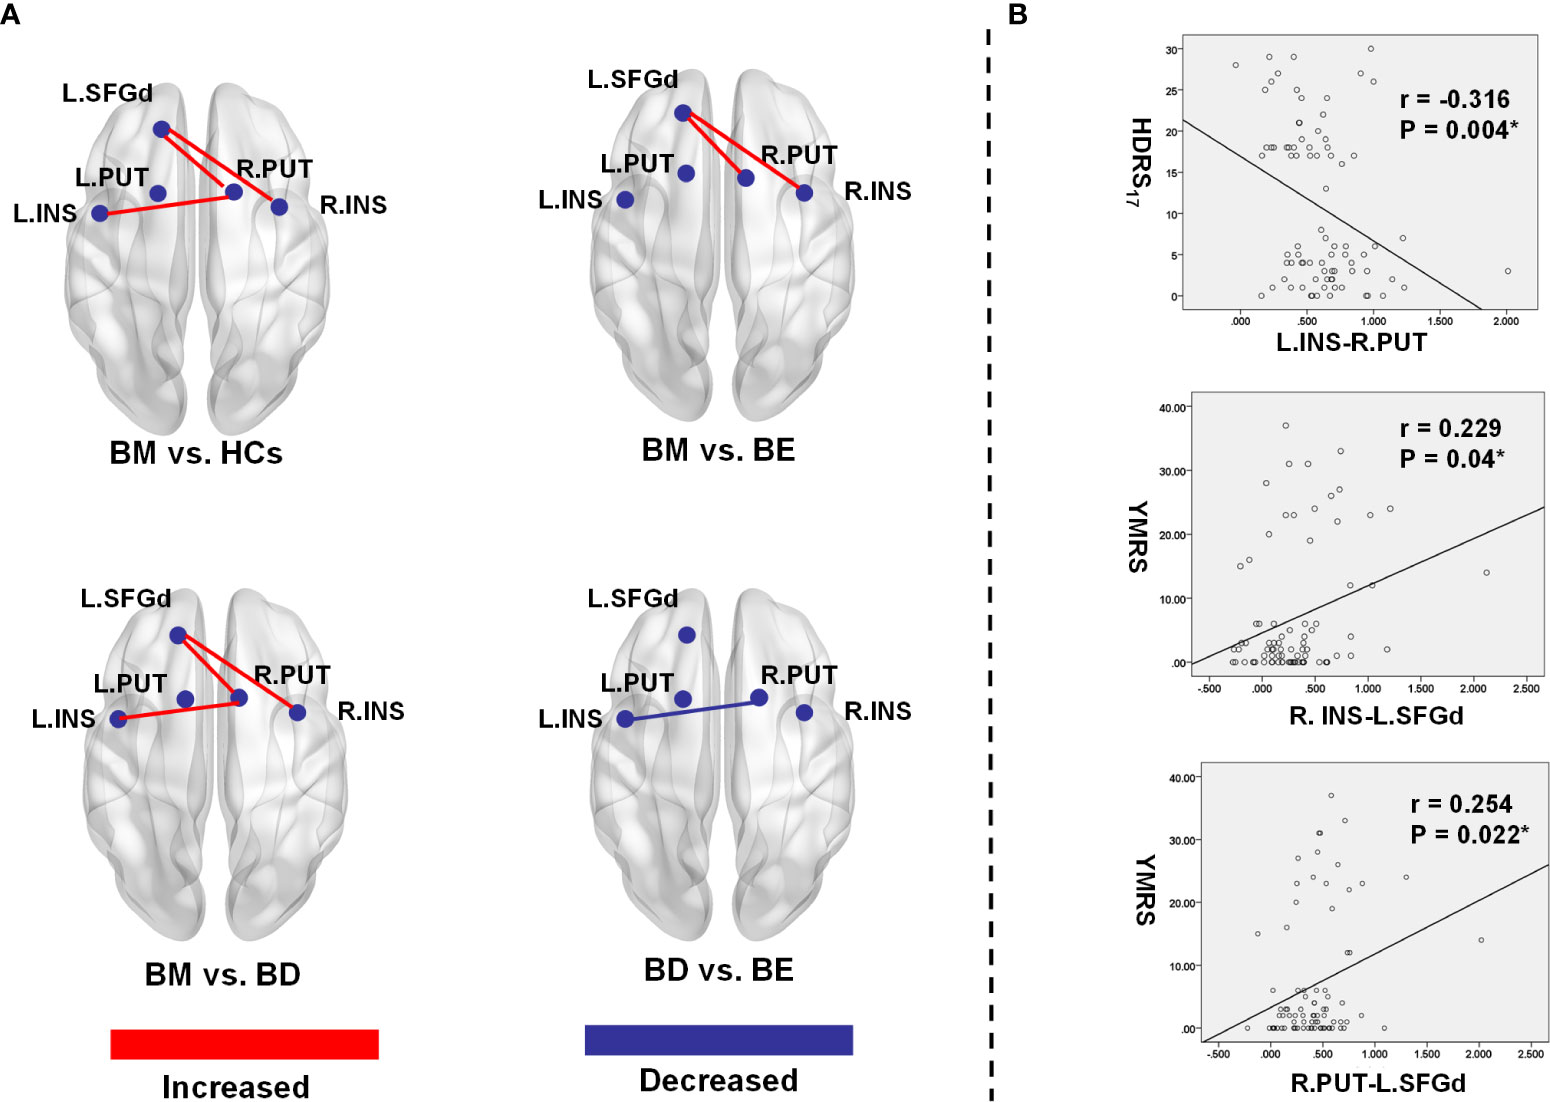
Figure 2 Significant group differences of functional connectivity strength in the hate circuit. (A) The spatial location of the altered functional connectivity in the hate circuit; (B) The correlation between the altered functional connectivity and clinical symptoms. L, left; R, right; BM, bipolar mania; BD, bipolar depression; BE, euthymic bipolar disorder; HCs, healthy controls; SFGd, superior frontal gyrus (dorsal); INS, insula right PUT, putamen; HDRS17, 17 item-Hamilton Depression Rating Scale; YRMS, Young Mania Rating Scale.
Correlations Between Abnormal Functional Connectivity and Clinical Variables
In our present study, a significant positive Spearman correlation was found between the YMRS score and the functional connectivity of the R.INS-L.SFGd (r=0.229, p=0.04) and R.PUT-L.SFGd (r=0.254, p=0.022), while a significant negative correlation was detected between the HDRS17 score and functional connectivity strength of L.INS-R.PUT (r=-0.316, p=0.004) (please see Table 4 and Figure 2).
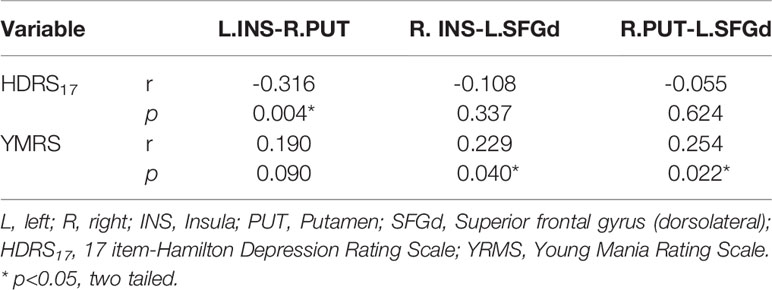
Table 4 Spearman correlation analysis between clinical symptoms and the functional connectivity of each significant different link in the hate circuit among the four groups (p<0.05, two tailed).
Discussion
In the present study, we found that the functional connectivity pattern of the hate circuit showed significant discrepancies in different mood phases of bipolar disorder. Specifically, the ordinal ranking of the R.INS-L.SFGd, R.PUT-L.SFGd, and L.INS-R.PUT strengths were: BM>HCs ≈ BE>BD. Functional connectivity strengths of the R.INS-L.SFGd, R.PUT-L.SFGd, and L.INS-R.PUT were significantly increased in BM compared with BD, BE, and HCs, whereas the opposite connectivity pattern was observed in BD compared with BM and BE. Additionally, the connectivity pattern of the hate circuit in BE was similar to HCs. Furthermore, connectivity strengths of the R.INS-L.SFGd and R.PUT-L.SFGd positively correlated with scores of the manic symptoms while those of the L.INS-R.PUT negatively correlated with scores of depressive symptoms.
In our present study, the functional connectivity pattern of the hate circuit was capable of distinguishing the BM from BD, BE, and HCs, and could also distinguish the BD from BE. The diverse functional connectivity pattern of the hate circuit in different mood phases suggested state-related markers of bipolar disorder. The relationships between the connectivity strength of R.INS-L.SFGd, R.PUT-L.SFGd, and manic symptoms and relationship between L.INS-R.PUT and depressive symptoms were further supported by our significant correlation findings. Increased functional connectivity of the R.INS-L.SFGd and R.PUT-L.SFGd were positively correlated with the YMRS score while decreased functional connectivity of the L.INS-R.PUT was negatively correlated with the HDRS17. These findings suggested that mania and depression were associated closely with the hate circuit.
Moreover, the altered functional connectivity in the insula, putamen, and lateral prefrontal gyrus in BM patients provides neuropathological evidence for the impaired emotional regulation and cognitive control in bipolar disorder. In anatomy, the insula cortex reciprocally connects with the frontal lobe and projects to parts of the brain that involve the putamen (47). In terms of brain function, the lateral superior frontal gyrus plays a critical role in mental manipulation and information monitoring (48, 49). The insula is recognized as an integration hub implicated in cognitive, emotional, motor, and somatosensory activity (50–52) and the right putamen is considered to be closely associated with motor control, reinforcement learning, and semantic processes. Therefore, this neural pathway was considered to be responsible for emotional regulation and cognitive control (48, 49). Moreover, higher activation in the right insula, right putamen, and left lateral prefrontal cortex had been found in BD and BM patients during the response to inhibiting sad faces compared with HCs (10). Both mania and depression patients showed reduced dorsolateral prefrontal activation during an N-back working memory task, although this may improve partially in euthymia (53).
Accordingly, we postulated that the hate circuit may play a critical role in the pathophysiologic substrate of mania and depression. It was proposed that the uncoupling hate circuit in depression might impair cognitive control over feelings of hate toward the self or others during social interactions. This could result in improper feelings of hate and therefore increase uncontrolled self-loathing and withdrawal from social interactions (31). Considering the opposite symptoms in depression and mania, we conjectured that increased functional connectivity in hate circuit could also undermine the emotional regulation of hate during social interactions and may later lead to the reversed symptoms of depression (manic episode) such as euphoria, pathological narcissism, impulsivity, and overactive social interactions. Taken together, our findings not only support the association between decreased connectivity of the hate circuit with depression but also add new evidence that supports the links between hate circuit and mania.
The opposite functional connectivity patterns in BM and BD found in our study are in line with a growing body of neuroimaging literature, although abnormal connectivity may locate in different circuits. For example, right amygdala-hippocampal connectivity was increased in BM but decreased in BD (54). BM patients showed contrasting variability patterns in the default mode network (DMN) and sensorimotor networks (SMN) balance to BD patients (55). The contrasting functional connectivity pattern of different neural circuits in bipolar disorder may reflect the “spatiotemporal psychopathology” that was proposed by Northoff G (56) and suggests dynamic instabilities of large-scale brain networks in bipolar disorder (57). Notably, Altinay et al. found BD patients showed increased connectivity between the left dorsal caudal putamen and right superior temporal gyrus extending to the insula compared with both BM and HCs using seed-based analysis to measure differences in resting-state functional connectivity of six striatal sub-regions (58). However, in our study, no significantly different functional connectivity between the left putamen and right insula were found. Brady RO Jr and colleagues used unbiased whole-brain analyses to measure spontaneous brain activity in patients with bipolar disorder in mania and euthymia, and they found that within the dorsal attention network, the mania group demonstrated hyper-connectivity while the bipolar euthymia group showed hypo-connectivity compared with HCs. When the bilateral frontal lobe was selected as an ROI, the results still corresponded to the findings of whole-brain analyses (14). Thus, further studies investigating cognitive testing and emotional processing during MRI scanning and performing large-scale brain network analysis are needed to ascertain the role different neural circuits play and how they interact with each other in the psychopathology of medication-free bipolar disorders.
We found decreased functional connectivity of the L.INS-R.PUT in BD patients compared to BE patients and a decreased tendency of functional connectivity strength within the hate circuit in BD patients relative to HCs. However, contrary to our hypothesis, a significant functional connectivity difference of the hate circuit was not detected in BD compared with HCs. Although in line with some studies that found no significant different brain activation in BD compared with HCs (19), the majority of resting-state functional magnetic resonance imaging studies had reported altered fronto-limbic functional connectivity in major depressive disorder or BD patient groups compared HCs (54, 59, 60). Altinay MI and colleagues found that the BD patients demonstrated increased functional connectivity between the left putamen and frontal gyrus, as well as increased connectivity of the right putamen with the right superior temporal gyrus extending into the insula compared with HCs (58). Kandilarova S and colleagues found significantly reduced effective connectivity of the anterior insula to the middle frontal gyrus in the depressive group compared to the healthy subjects (59). Decreased functional connectivity between the dorsolateral prefrontal cortex and insula was also found in subjects with subthreshold depression compared to healthy controls (61). However, sample heterogeneity, different analytical methods, and medication effects may have contributed to the inconsistent findings. As for our negative findings, another probability is that decreased functional connectivity in the hate circuit might appear only in unipolar depression but not in bipolar depression. If confirmed in a larger sample size, then the functional connectivity pattern of the hate circuit could be a potential diagnostic biomarker for unipolar depression and bipolar depression. However, further studies with a relatively large sample size are needed to verify our assumption.
Consistent with our hypotheses, the connectivity pattern of the hate circuit in BE patients was not different from that of HCs in the current study. Our results are in line with many previous studies that showed negative findings using whole-brain independent component analysis (ICA), seed-based analysis, or other topographical patterns analysis to explore resting-state functional connectivity in patients during periods of euthymia (55, 62, 63). For instance, the absence of hyper- or hypo-connectivity in the default mode network, frontoparietal network, and salience network had been demonstrated in euthymic bipolar patients in resting-state functional connectivity studies (62). Patients in the euthymic phase did not show any significant differences in the Slow5 fractional SD DMN/SMN ratio compared with HCs (55). Moreover, Syan SK and colleagues used the dorsolateral prefrontal cortex (dlPFC) as a primary ROI in euthymic women but no aberrant functional connectivity was detected between dlPFC and the insula or putamen, although there was increased resting-state functional connectivity between the dlPFC and the brainstem (63). Furthermore, these studies suggested that medication may have treatment effects on normalizing the dysfunctional neural circuit, since patients were relieved from the acute disease phase after a period of antipsychotic medication. The normalization of brain networks in patients during the euthymia phase may inform the neurobiology and compensatory brain mechanisms maintaining clinical remission (62). However, findings from seed-based analysis studies remain inconsistent. Aberrant resting-state functional connectivity with the prefrontal cortex, amygdala, cingulate cortex, and somatosensory cortex were reported in studies using seed-based analysis in patients during euthymic phase compared with HCs. The resting-state functional connectivity changes in the euthymic phase may reflect the trait-based pathophysiology of bipolar disorder (62, 64).
The present study has several limitations. First, this is a cross-sectional study which can only observe the current time measurements of the brain’s functional connectivity. The bipolar patients were not longitudinal follow-up subjects across mood states. Second, almost all patients were taking medication(s) at the time of the scan, so the potential effects of medication in the present study must be considered. Third, relatively small samples may limit statistical power, especially the small sample size in the BM group. Finally, although the seed-based analysis adopted in this study is a hypothesis-driven approach that can directly answer a direct question, it may disregard the richness of information available within the statistical relationships between multiple data points and, furthermore, the selecting of seed may bias connectivity findings towards specific, smaller neural circuits rather than large-scale brain networks (65). Thus, any generalizations about the findings need to be performed with caution. Further longitudinal studies with larger samples of medication-free subjects will be necessary to verify the altered functional connectivity patterns of the hate circuit across different mood phases at the large-scale brain network level.
Conclusions
In summary, we explored group differences of resting-state functional connectivity within the hate circuit in HCs and patients with bipolar mania, bipolar depression, and bipolar euthymia using seed-based functional connectivity analysis. We found that the functional connectivity strength within the hate circuit was distinctive in different mood phases of bipolar disorder. Patients with BM showed increased hate circuit compared with all other groups, while patients with BD showed decreased hate circuit compared with BM and BE. Additionally, patients with BE had a similar connectivity pattern of the hate circuit to HCs. Furthermore, the severity of manic and depressive symptoms was significantly correlated with connectivity strength of the hate circuit. We speculated that increased hate circuit might be underlying the neuropathology of BM while decreased hate circuit might be underlying the neuropathology of BD. The altered functional connectivity of the hate circuit in different mood phases might be state-related markers of bipolar disorder. Our findings may shed a novel light on the neuropathology of bipolar disorder. If confirmed in a larger sample size, it may carry important implications for the understanding of a potential switching mechanism of different mood states and provide new targets for treatment.
Data Availability Statement
The datasets presented in this article are not readily available because ethical restrictions. Requests to access the datasets should be directed to Data are available upon reasonable request to ZL, zningl@163.com.
Ethics Statement
The studies involving human participants were reviewed and approved by Medical Ethics committee of the second Xiangya Hospital, Central South University. The patients/participants provided their written informed consent to participate in this study.
Author Contributions
Data collection: ZF, CZ, GW, CX. Methodology: JY, ZF, HT. Writing (original draft preparation): ZF, Writing (review and editing): ZF, JY, CZ, CX, GW, SG, ZX, ZL, HT. Project administration: HT, ZL. All authors contributed to the article and approved the submitted version.
Funding
This study was supported by the National Natural Science Foundation of China (grant numbers 81301161, 81701325, 82071506, 81801353 and 81671335), the China Precision Medicine Initiative (grant number 2016YFC0906300), and the Natural Science Foundation of Hunan Province, China (grant numbers 2019JJ50848).
Conflict of Interest
The authors declare that the research was conducted in the absence of any commercial or financial relationships that could be construed as a potential conflict of interest.
Supplementary Material
The Supplementary Material for this article can be found online at: https://www.frontiersin.org/articles/10.3389/fpsyt.2020.556126/full#supplementary-material
References
1. Pompili M, Shrivastava A, Serafini G, Innamorati M, Milelli M, Erbuto D, et al. Bereavement after the suicide of a significant other. Indian J Psychiatry (2013) 55(3):256–63. doi: 10.4103/0019-5545.117145
2. Grande I, Berk M, Birmaher B, Vieta E. Bipolar disorder. Lancet (2016) 387(10027):1561–72. doi: 10.1016/S0140-6736(15)00241-X
3. Doucet GE, Bassett DS, Yao N, Glahn DC, Frangou S. The Role of Intrinsic Brain Functional Connectivity in Vulnerability and Resilience to Bipolar Disorder. Am J Psychiatry (2017) 174(12):1214–22. doi: 10.1176/appi.ajp.2017.17010095
4. Morris RW, Sparks A, Mitchell PB, Weickert CS, Green MJ. Lack of cortico-limbic coupling in bipolar disorder and schizophrenia during emotion regulation. Transl Psychiatry (2012) 2:e90. doi: 10.1038/tp.2012.16
5. Strakowski SM, Adler CM, Almeida J, Altshuler LL, Blumberg HP, Chang KD, et al. The functional neuroanatomy of bipolar disorder: a consensus model. Bipolar Disord (2012) 14(4):313–25. doi: 10.1111/j.1399-5618.2012.01022.x
6. Tang LR, Liu CH, Jing B, Ma X, Li HY, Zhang Y, et al. Voxel-based morphometry study of the insular cortex in bipolar depression. Psychiatry Res (2014) 224(2):89–95. doi: 10.1016/j.pscychresns.2014.08.004
7. Cerullo MA, Adler CM, Delbello MP, Strakowski SM. The functional neuroanatomy of bipolar disorder. Int Rev Psychiatry (2009) 21(4):314–22. doi: 10.1080/09540260902962107
8. Phillips ML, Drevets WC, Rauch SL, Lane R. Neurobiology of emotion perception II: Implications for major psychiatric disorders. Biol Psychiatry (2003) 54(5):515–28. doi: 10.1016/s0006-3223(03)00171-9
9. Guo WB, Liu F, Xiao CQ, Zhang ZK, Liu JR, Yu MY, et al. Decreased insular connectivity in drug-naive major depressive disorder at rest. J Affect Disord (2015) 179:31–7. doi: 10.1016/j.jad.2015.03.028
10. Hummer TA, Hulvershorn LA, Karne HS, Gunn AD, Wang Y, Anand A. Emotional response inhibition in bipolar disorder: a functional magnetic resonance imaging study of trait- and state-related abnormalities. Biol Psychiatry (2013) 73(2):136–43. doi: 10.1016/j.biopsych.2012.06.036
11. Phillips ML, Swartz HA. A critical appraisal of neuroimaging studies of bipolar disorder: toward a new conceptualization of underlying neural circuitry and a road map for future research. Am J Psychiatry (2014) 171(8):829–43. doi: 10.1176/appi.ajp.2014.13081008
12. Harrison PJ, Geddes JR, Tunbridge EM. The Emerging Neurobiology of Bipolar Disorder. Trends Neurosci (2018) 41(1):18–30. doi: 10.1016/j.tins.2017.10.006
13. Brady RO Jr., Masters GA, Mathew IT, Margolis A, Cohen BM, Ongur D, et al. State dependent cortico-amygdala circuit dysfunction in bipolar disorder. J Affect Disord (2016) 201:79–87. doi: 10.1016/j.jad.2016.04.052
14. Brady RO Jr., Tandon N, Masters GA, Margolis A, Cohen BM, Keshavan M, et al. Differential brain network activity across mood states in bipolar disorder. J Affect Disord (2017) 207:367–76. doi: 10.1016/j.jad.2016.09.041
15. Brady RO Jr., Margolis A, Masters GA, Keshavan M, Ongur D. Bipolar mood state reflected in cortico-amygdala resting state connectivity: A cohort and longitudinal study. J Affect Disord (2017) 217:205–9. doi: 10.1016/j.jad.2017.03.043
16. Zhou Q, Womer FY, Kong L, Wu F, Jiang X, Zhou Y, et al. Trait-Related Cortical-Subcortical Dissociation in Bipolar Disorder: Analysis of Network Degree Centrality. J Clin Psychiatry (2017) 78(5):584–91. doi: 10.4088/JCP.15m10091
17. Brady RO Jr., Cooper A, Jensen JE, Tandon N, Cohen B, Renshaw P, et al. A longitudinal pilot proton MRS investigation of the manic and euthymic states of bipolar disorder. Transl Psychiatry (2012) 2:e160. doi: 10.1038/tp.2012.84
18. Blumberg HP, Leung HC, Skudlarski P, Lacadie CM, Fredericks CA, Harris BC, et al. A functional magnetic resonance imaging study of bipolar disorder: state- and trait-related dysfunction in ventral prefrontal cortices. Arch Gen Psychiatry (2003) 60(6):601–9. doi: 10.1001/archpsyc.60.6.601
19. Van der Schot A, Kahn R, Ramsey N, Nolen W, Vink M. Trait and state dependent functional impairments in bipolar disorder. Psychiatry Res (2010) 184(3):135–42. doi: 10.1016/j.pscychresns.2010.07.009
20. Townsend J, Bookheimer SY, Foland-Ross LC, Sugar CA, Altshuler LL. fMRI abnormalities in dorsolateral prefrontal cortex during a working memory task in manic, euthymic and depressed bipolar subjects. Psychiatry Res (2010) 182(1):22–9. doi: 10.1016/j.pscychresns.2009.11.010
21. Drevets WC, Price JL, Simpson JR Jr., Todd RD, Reich T, Vannier M, et al. Subgenual prefrontal cortex abnormalities in mood disorders. Nature (1997) 386(6627):824–7. doi: 10.1038/386824a0
22. Baxter LR Jr., Phelps ME, Mazziotta JC, Schwartz JM, Gerner RH, Selin CE, et al. Cerebral metabolic rates for glucose in mood disorders. Studies with positron emission tomography and fluorodeoxyglucose F 18. Arch Gen Psychiatry (1985) 42(5):441–7. doi: 10.1001/archpsyc.1985.01790280019002
23. Zeki S, Romaya JP. Neural correlates of hate. PloS One (2008) 3(10):e3556. doi: 10.1371/journal.pone.0003556
25. Turnell AI, Fassnacht DB, Batterham PJ, Calear AL, Kyrios M. The Self-Hate Scale: Development and validation of a brief measure and its relationship to suicidal ideation. J Affect Disord (2019) 245:779–87. doi: 10.1016/j.jad.2018.11.047
26. Phillips ML, Young AW, Senior C, Brammer M, Andrew C, Calder AJ, et al. A specific neural substrate for perceiving facial expressions of disgust. Nature (1997) 389(6650):495–8. doi: 10.1038/39051
27. McNally RJ. Disgust has arrived. J Anxiety Disord (2002) 16(5):561–6. doi: 10.1016/S0887-6185(02)00174-3
28. Olatunji BO, McKay D. Disgust and psychiatric illness: have we remembered? Br J Psychiatry (2007) 190:457–9. doi: 10.1192/bjp.bp.106.032631
29. Overton PG MF, Taggart HS, Bagshaw GL, Simpson J. Self-disgust mediates the relationship between dysfunctional cognitions and depressive symptomatology. Emotion (2008) 8(3):379–85. doi: 10.1037/1528-3542.8.3.379
30. Surguladze SA, El-Hage W, Dalgleish T, Radua J, Gohier B, Phillips ML. Depression is associated with increased sensitivity to signals of disgust: A functional magnetic resonance imaging study. J Psychiatr Res (2010) 44(14):894–902. doi: 10.1016/j.jpsychires.2010.02.010
31. Tao H, Guo S, Ge T, Kendrick KM, Xue Z, Liu Z, et al. Depression uncouples brain hate circuit. Mol Psychiatr (2013) 18(1):101–11. doi: 10.1038/mp.2011.127
32. Wang Y, Zhong SM, Jia YB, Zhou ZF, Wang B, Pan JY, et al. Interhemispheric resting state functional connectivity abnormalities in unipolar depression and bipolar depression. Bipolar Disord (2015) 17(5):486–95. doi: 10.1111/bdi.12315
33. Smitha KA, Akhil Raja K, Arun KM, Rajesh PG, Thomas B, Kapilamoorthy TR, et al. Resting state fMRI: A review on methods in resting state connectivity analysis and resting state networks. Neuroradiol J (2017) 30(4):305–17. doi: 10.1177/1971400917697342
34. Stoyanov D, Kandilarova S, Borgwardt S, Stieglitz RD, Hugdahl K, Kostianev S. Psychopathology Assessment Methods Revisited: On Translational Cross-Validation of Clinical Self-Evaluation Scale and fMRI. Front Psychiatry (2018) 9:21. doi: 10.3389/fpsyt.2018.00021
35. Kandilarova S, Stoyanov D, Popivanov ID, Kostianev S. Application of functional magnetic resonance imaging in psychiatric clinical evaluation: Controversies and avenues. J Eval Clin Pract (2018) 24(4):807–14. doi: 10.1111/jep.12906
36. Ha TH, Ha K, Kim JH, Choi JE. Regional brain gray matter abnormalities in patients with bipolar II disorder: a comparison study with bipolar I patients and healthy controls. Neurosci Lett (2009) 456(1):44–8. doi: 10.1016/j.neulet.2009.03.077
37. Ha TH, Her JY, Kim JH, Chang JS, Cho HS, Ha K. Similarities and differences of white matter connectivity and water diffusivity in bipolar I and II disorder. Neurosci Lett (2011) 505(2):150–4. doi: 10.1016/j.neulet.2011.10.009
38. Maffei C, Fossati A, Agostoni I, Barraco A, Bagnato M, Deborah D, et al. Interrater reliability and internal consistency of the structured clinical interview for DSM-IV axis II personality disorders (SCID-II), version 2.0. J Pers Disord (1997) 11(3):279–84. doi: 10.1521/pedi.1997.11.3.279
39. Hamilton M. A rating scale for depression. J Neurol Neurosurg Psychiatry (1960) 23:56–62. doi: 10.1136/jnnp.23.1.56
40. Young RC, Biggs JT, Ziegler VE, Meyer DA. A rating scale for mania: reliability, validity and sensitivity. Br J Psychiatry (1978) 133:429–35. doi: 10.1192/bjp.133.5.429
41. First RS M, Gibbon M, Willian JBW. Structured Clinical Interview for DSM IV Axis I disorders—Research version—Non-Patient Edition (SCID-I/NP). New York: Biometrics Research, New York State Psychiatric Institute (2002).
42. Bandettini PA, Jesmanowicz A, Van Kylen J, Birn RM, Hyde JS. Functional MRI of brain activation induced by scanner acoustic noise. Magn Reson Med (1998) 39(3):410–6. doi: 10.1002/mrm.1910390311
43. Yan CG, Wang XD, Zuo XN, Zang YF. DPABI: Data Processing & Analysis for (Resting-State) Brain Imaging. Neuroinformatics (2016) 14(3):339–51. doi: 10.1007/s12021-016-9299-4
44. Yang J, Pu W, Ouyang X, Tao H, Chen X, Huang X, et al. Abnormal Connectivity Within Anterior Cortical Midline Structures in Bipolar Disorder: Evidence From Integrated MRI and Functional MRI. Front Psychiatry (2019) 10:788. doi: 10.3389/fpsyt.2019.00788
45. Yang J, Ouyang X, Tao H, Pu W, Fan Z, Zeng C, et al. Connectomic signatures of working memory deficits in depression, mania, and euthymic states of bipolar disorder. J Affect Disord (2020) 274:190–8. doi: 10.1016/j.jad.2020.05.058
46. Tzourio-Mazoyer N, Landeau B, Papathanassiou D, Crivello F, Etard O, Delcroix N, et al. Automated anatomical labeling of activations in SPM using a macroscopic anatomical parcellation of the MNI MRI single-subject brain. Neuroimage (2002) 15(1):273–89. doi: 10.1006/nimg.2001.0978
48. du Boisgueheneuc F, Levy R, Volle E, Seassau M, Duffau H, Kinkingnehun S, et al. Functions of the left superior frontal gyrus in humans: a lesion study. Brain (2006) 129(Pt 12):3315–28. doi: 10.1093/brain/awl244
49. Phillips ML, Ladouceur CD, Drevets WC. A neural model of voluntary and automatic emotion regulation: implications for understanding the pathophysiology and neurodevelopment of bipolar disorder. Mol Psychiatry (2008) 13(9):829, 33–57. doi: 10.1038/mp.2008.65
50. Craig AD. How do you feel–now? The anterior insula and human awareness. Nat Rev Neurosci (2009) 10(1):59–70. doi: 10.1038/nrn2555
51. Cloutman LL, Binney RJ, Drakesmith M, Parker GJ, Lambon Ralph MA. The variation of function across the human insula mirrors its patterns of structural connectivity: evidence from in vivo probabilistic tractography. Neuroimage (2012) 59(4):3514–21. doi: 10.1016/j.neuroimage.2011.11.016
52. Nieuwenhuys R. The insular cortex: a review. Prog Brain Res (2012) 195:123–63. doi: 10.1016/B978-0-444-53860-4.00007-6
53. Pomarol-Clotet E, Alonso-Lana S, Moro N, Sarro S, Bonnin MC, Goikolea JM, et al. Brain functional changes across the different phases of bipolar disorder. Br J Psychiatry (2015) 206(2):136–44. doi: 10.1192/bjp.bp.114.152033
54. Li M, Huang C, Deng W, Ma X, Han Y, Wang Q, et al. Contrasting and convergent patterns of amygdala connectivity in mania and depression: a resting-state study. J Affect Disord (2015) 173:53–8. doi: 10.1016/j.jad.2014.10.044
55. Martino M, Magioncalda P, Huang Z, Conio B, Piaggio N, Duncan NW, et al. Contrasting variability patterns in the default mode and sensorimotor networks balance in bipolar depression and mania. Proc Natl Acad Sci U.S.A. (2016) 113(17):4824–9. doi: 10.1073/pnas.1517558113
56. Northoff G. Spatiotemporal Psychopathology II: How does a psychopathology of the brain’s resting state look like? Spatiotemporal approach and the history of psychopathology. J Affect Disord (2016) 190:867–79. doi: 10.1016/j.jad.2015.05.008
57. Alistair Perry GR, Philip B, Mitchell MB. Connectomics of bipolar disorder: a critical review, and evidence for dynamic instabilities within interoceptive networks. Mol Psychiatr (2018) 2019(24):1296–318. doi: 10.1038/s41380-018-0267-2
58. Altinay MI, Hulvershorn LA, Karne H, Beall EB, Anand A. Differential Resting-State Functional Connectivity of Striatal Subregions in Bipolar Depression and Hypomania. Brain Connect (2016) 6(3):255–65. doi: 10.1089/brain.2015.0396
59. Kandilarova S, Stoyanov D, Kostianev S, Specht K. Altered Resting State Effective Connectivity of Anterior Insula in Depression. Front Psychiatry (2018) 9:83. doi: 10.3389/fpsyt.2018.00083
60. Liu C, Pu WD, Wu GW, Zhao J, Xue ZM. Abnormal resting-state cerebral-limbic functional connectivity in bipolar depression and unipolar depression. BMC Neurosci (2019) 20:ARTN 30. doi: 10.1186/s12868-019-0508-6
61. Hwang NE JW, Yang XQ, Zhang WY, Chen J, Yang XY, Hu LJ, et al. Subthreshold depression is associated with impaired resting-state functional connectivity of the cognitive control network. Trans Psychiatry (2015) 5(11):e683. doi: 10.1038/tp.2015.174
62. Syan SK, Smith M, Frey BN, Remtulla R, Kapczinski F, Hall GBC, et al. Resting-state functional connectivity in individuals with bipolar disorder during clinical remission: a systematic review. J Psychiatry Neurosci (2018) 43(5):170175. doi: 10.1503/jpn.170175
63. Syan SK, Minuzzi L, Smith M, Allega OR, Hall GB, Frey BN. Resting state functional connectivity in women with bipolar disorder during clinical remission. Bipolar Disord (2017) 19(2):97–106. doi: 10.1111/bdi.12469
64. Minuzzi L, Syan SK, Smith M, Hall A, Hall GB, Frey BN. Structural and functional changes in the somatosensory cortex in euthymic females with bipolar disorder. Aust N Z J Psychiatry (2018) 52(11):1075–83. doi: 10.1177/0004867417746001
Keywords: bipolar disorder, mood states, hate circuit, resting-state fMRI, functional connectivity
Citation: Fan Z, Yang J, Zeng C, Xi C, Wu G, Guo S, Xue Z, Liu Z and Tao H (2020) Bipolar Mood State Reflected in Functional Connectivity of the Hate Circuit: A Resting-State Functional Magnetic Resonance Imaging Study. Front. Psychiatry 11:556126. doi: 10.3389/fpsyt.2020.556126
Received: 27 April 2020; Accepted: 28 August 2020;
Published: 27 October 2020.
Edited by:
Quanying Liu, California Institute of Technology, United StatesReviewed by:
Drozdstoy Stoyanov Stovanov, Plovdiv Medical University, BulgariaGianluca Serafini, San Martino Hospital (IRCCS), Italy
Copyright © 2020 Fan, Yang, Zeng, Xi, Wu, Guo, Xue, Liu and Tao. This is an open-access article distributed under the terms of the Creative Commons Attribution License (CC BY). The use, distribution or reproduction in other forums is permitted, provided the original author(s) and the copyright owner(s) are credited and that the original publication in this journal is cited, in accordance with accepted academic practice. No use, distribution or reproduction is permitted which does not comply with these terms.
*Correspondence: Haojuan Tao, taohaojuan@csu.edu.cn
†These authors have contributed equally to this work