 Franz Pauls
 Monika Daseking
- 1Department of Clinical Psychology, Helmut-Schmidt-University/University of the Federal Armed Forces, Hamburg, Germany
- 2Department of Educational Psychology, Helmut-Schmidt-University/University of the Federal Armed Forces, Hamburg, Germany
With the exception of a recently published study and the analyses provided in the test manual, structural validity is mostly uninvestigated for the German version of the Wechsler Intelligence Scale for Children - Fifth Edition (WISC-V). Therefore, the main aim of the present study was to examine the latent structure of the 10 WISC-V primary subtests on a bifurcated extended population-representative German standardization sample (N=1,646) by conducting both exploratory (EFA; n=823) and confirmatory (CFA; n=823) factor analyses on the original data. Since no more than one salient subtest loading could be found on the Fluid Reasoning (FR) factor in EFA, results indicated a four-factor rather than a five-factor model solution when the extraction of more than two suggested factors was forced. Likewise, a bifactor model with four group factors was found to be slightly superior in CFA. Variance estimation from both EFA and CFA revealed that the general factor dominantly accounted for most of the subtest variance and construct reliability estimates further supported interpretability of the Full Scale Intelligence Quotient (FSIQ). In both EFA and CFA, most group factors explained rather small proportions of common subtest variance and produced low construct replicability estimates, suggesting that the WISC-V primary indexes were of lower interpretive value and should be evaluated with caution. Clinical interpretation should thus be primarily based on the FSIQ and include a comprehensive analysis of the cognitive profile derived from the WISC-V primary indexes rather than analyses of each single primary index.
Introduction
The Wechsler scales are among the most frequently used diagnostic instruments worldwide for assessing a variety of cognitive abilities across different age groups. Following a long tradition, the Wechsler Intelligence Scale for Children - Fifth Edition. (WISC-V; Wechsler, 2014a) is a complex test battery for measuring intellectual performances of children and adolescents aged between 6 and 16years. Its conceptualization and development were mainly inspired by the theoretical ideas of Cattell, Horn, and Carroll, often referred to as the Cattell-Horn-Carroll model (McGrew, 2009; Schneider and McGrew, 2012). Representing a major revision of the WISC-IV (Wechsler, 2003), the WISC-V incorporates several significant changes. As one major modification, the WISC-V now redefines the four factors of the WISC-IV into a new second-order five-factor structure including the primary indexes Verbal Comprehension Index (VCI), Visual Spatial Index (VSI), Fluid Reasoning Index (FRI), Working Memory Index (WMI), and Processing Speed Index (PSI). Each of these indexes is derived using two out of 10 primary subtests. Moreover, VSI and FRI replaced the former WISC-IV primary index Perceptual Reasoning Index (PRI) as part of the new second-order five-factor structure of the WISC-V. This conceptual framework finally describes the Full Scale Intelligence Quotient (FSIQ) as an estimate of the general intellectual ability that is composed of five cognitive subdomains.
In order to examine the validity of the factor structure on an empirical basis, the test publishers conducted confirmatory factor analyses (CFA) and compared alternative factor structures to identify a theoretically sound model that accounted for the standardization data. CFA results provided in the test manual indicate that most of the five-factor model solutions were superior in terms of their model fit when compared to four-factor model solutions. Based on goodness-of-fit statistics, the second-order five-factor model was preferred and selected by the test publishers to best represent the WISC-V test structure (see Wechsler, 2014b, for a detailed description). Despite some attempts to support validity of the five-factor structure both in normative (e.g., Keith et al., 2006) and clinical samples (e.g., Weiss et al., 2013), however, there is still an ongoing debate on whether the WISC-V subtest performances are best described by a four- or a five-factor structure (Dombrowski et al., 2018). Recent studies indicated that the WISC-V factor structure might be best represented by four first-order factors (Canivez et al., 2016), whereas a five-factor structure could neither be satisfyingly replicated for the Canadian (Watkins et al., 2017), the French (Lecerf and Canivez, 2018), nor the Spanish WISC-V (Fenollar-Cortés and Watkins, 2018). In a recent report, McGill et al. (2020) have highlighted some methodological limitations related to several WISC-V standardization procedures.
In the light of these findings, the five-factor structure of the WISC-V has been called into question by some researchers (e.g., Beaujean, 2016; Canivez et al., 2018). Since shortly after the WISC-V was first published in the United States, the structural validation procedures reported in the test manual (Wechsler, 2014b) have been criticized as problematic (Beaujean, 2016; Canivez et al., 2017; Dombrowski et al., 2018). Besides failures in fully disclosing details about the CFA methods being used and the retention of FR as a redundant factor, one of the most frequently mentioned issues referred to failures in considering rival bifactor models when comparing alternative model solutions (Beaujean, 2015). Rather than specifying a higher-order factor as a superordinate general factor (g) that is only associated with and fully mediated by the lower-order factors, bifactor models describe g and the group factors at the same level of inference, featuring independent associations with the subtest indicators (Reise, 2012; Canivez, 2016). Another point of criticism relates to the fact that neither information about the sources of decomposed variances nor adequate estimates of model-based reliability are provided in the WISC-V test manual. However, estimating the proportions of decomposed variance can be crucial for determining how much interpretative emphasis one should place upon the factors included in the model under examination.
Since no results of exploratory factor analyses (EFA) are reported in the WISC-V test manual, these have additionally been conducted either on the overall standardization sample (Dombrowski et al., 2015; Canivez et al., 2016) or on specific age groups (Dombrowski et al., 2018). The according studies found support for four rather than five first-order factors, thus resembling the former WISC-IV factor structure. Comparable results have also been reported in studies conducting hierarchical or bifactor EFA and CFA on the Canadian (Watkins et al., 2017), French (Lecerf and Canivez, 2018), United Kingdom (Canivez et al., 2018), or Spanish versions of the WISC-V (Fenollar-Cortés and Watkins, 2018). Moreover, it could be shown that substantial proportions of subtest variance were due to g, whereas the group factors accounted for considerably smaller proportions of variance (Dombrowski et al., 2018). It was concluded that the FSIQ might be sufficiently well measured by the WISC-V subtests, whereas model-based reliability might be too weak for the WISC-V primary indexes to be meaningfully interpretable (Canivez et al., 2016; Rodriguez et al., 2016).
Even though analyses of the United States, Canadian, French, United Kingdom, and Spanish standardization data have already focused on the structural validity of the WISC-V, evidence is still needed to clarify which factor structure could best represent the German adaptation of the WISC-V. Apart from collecting and analyzing data from the German population, further significant changes were implemented as compared with the United States version of the WISC-V. These changes included the translation and adaptation of the entire set of verbal items, the exclusion of some complementary scores, and several modifications to verbal contents (see Wechsler, 2017a, for a detailed description). In a recently published study, Canivez et al. (2021) were the first to analyze the structural validity of the 15 WISC-V primary and secondary subtests based on the correlation matrix of the German standardization sample (N=1,087). Their aim was to compare their EFA and CFA results with the model solution provided in the test manual and those models proposed for other versions of the WISC-V. Additionally, the authors compared bifactor model and higher-order model solutions as rival explanations and provided detailed information about all sources of decomposed factor variance and the according model-based reliability coefficients. In line with the aforementioned studies on standardization and clinical samples of international WISC-V versions, findings of Canivez et al. (2021) again supported a four-factor model rather than the five-factor model solution that was proposed by the test publishers. Furthermore, their CFA results additionally suggested a bifactor model with four group factors to be the best structural representation of the German WISC-V. The authors concluded that clinical interpretations are meaningful and therefore permissible regarding the FSIQ as a reliable estimate of the general factor. Due to the insufficient unique proportion of true score variance that is provided by each group factor as well as their weak model-based reliability, however, they also pointed out that drawing inferences from most of the primary index scores beyond the FSIQ (except for PSI) might result in misinterpretations.
Providing further insights into the structural validity of the German WISC-V are an indispensable requirement when it comes to evaluating the interpretability of test scores (AERA, APA, and NCME, 2014). In general, researchers as well as clinicians may only then rely on results of technically sound instruments with demonstrated validity for the population under evaluation (Evers et al., 2013). In order to make a substantial contribution to this field of research, the present study examined the latent factor structure of the 10 WISC-V primary subtests on an extended German standardization sample following both the EFA and the CFA approach. These approaches are also emphasized by the ITC Guidelines for Translating and Adapting Tests [International Test Commission (ITC) (2017)] as part of gold-standard test validation procedures. Both the EFA and CFA include the comparison between hierarchical and bifactor models as well as the examination of decomposed variance sources and model-based reliability. The present analyses can also be regarded as an extension of those conducted by Canivez et al. (2021) on the German WISC-V due to the following differences between both studies. First, Canivez et al. included all 15 WISC-V primary and secondary subtests in their analyses, whereas the present analyses are based on the 10 WISC-V primary subtests only. Given that primary subtests are more frequently administered in clinical practice, findings on the structural validity of the German WISC-V as well as the arising practical implications regarding the primary subtests might be of greater value for clinicians. Furthermore, the present EFA and CFA are conducted on the extended population-representative German standardization sample (N=1,646) and based on the original raw data, whereas all factor analyses reported by Canivez et al. were exclusively based on the correlation matrix of the original German standardization sample (N=1,087). Since the authors claimed that only little precision should be lost when using correlations that are rounded to two decimal places, results of the present analyses that are based on the raw data could then be used to support or refute this assertion. In due consideration of these differences, a replication of the results reported by Canivez et al. in the present study would at least speak to the robustness of the findings on the factor structure of the German WISC-V. Finally, results should then facilitate the evaluation of the German WISC-V test scores and the interpretive guidelines emphasized by the test publisher.
Materials and Methods
Participants and Sample Characteristics
For conducting EFA and CFA in the present study, data of a total of 1,646 children and adolescents (846 males; 800 females) aged between 6 and 16years were selected from an extended dataset of the nationally representative German WISC-V standardization sample. A detailed description of the standardization procedures is provided in the German WISC-V test manual (Wechsler, 2017b). The original standardization sample was obtained following stratified proportional sampling in order to match the recent German census for significant demographic variables including gender, age, parental education, type of school, and migration background. The total sample was bifurcated into separate EFA (n=823) and CFA (n=823) samples to match for gender, age, parental education, and migration background. Demographic characteristics of both samples are presented in Table 1.
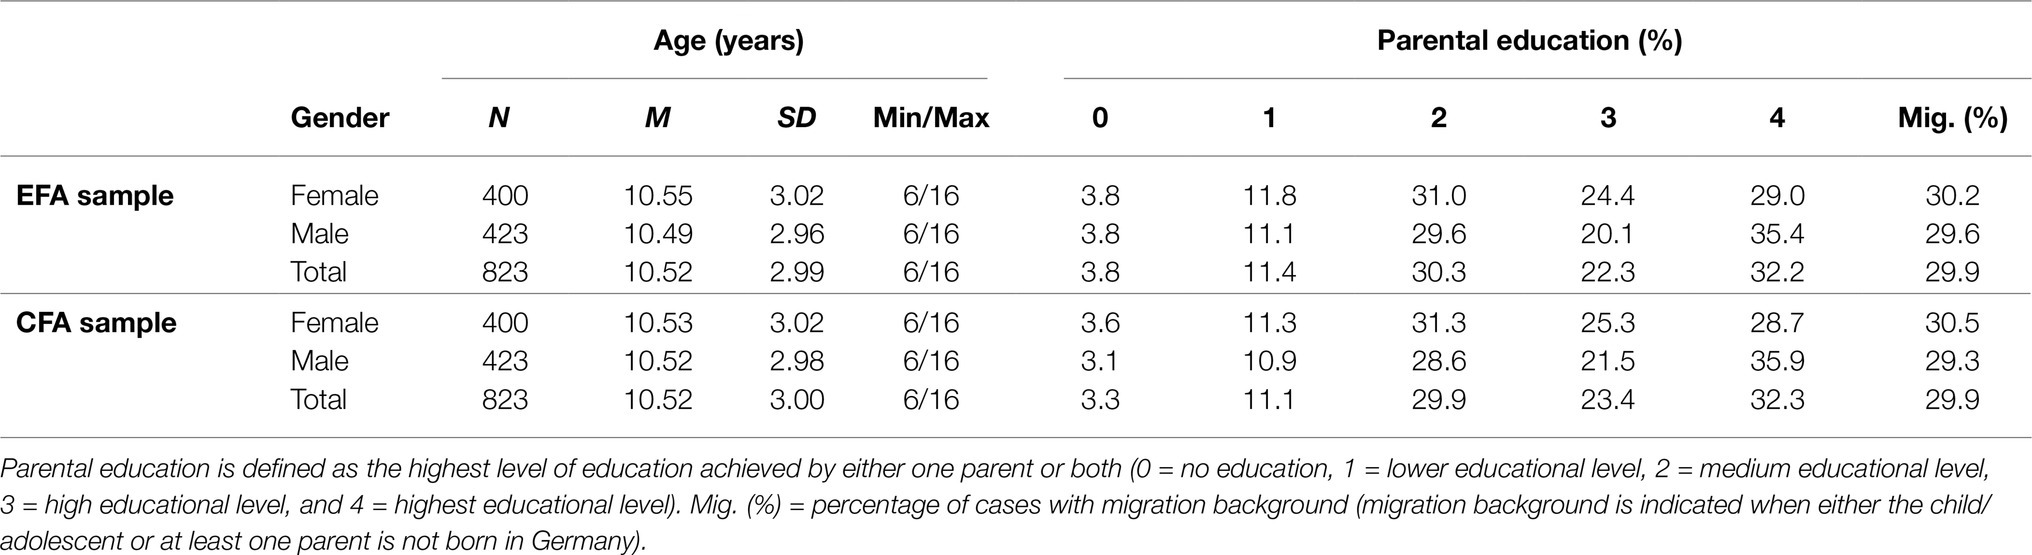
Table 1. Demographic characteristics of the exploratory factor analyses (EFA) and confirmatory factor analyses (CFA) samples according to gender, age, parental education, and migration background.
Matching quality was evaluated using Mann-Whitney and Kruskal-Wallis test statistics for non-parametric data. Besides equal gender distributions across the EFA and CFA samples, test statistics also indicated similar age distributions across both samples (U=338,241.00, z=−0.044, p=0.965). The EFA and CFA samples did not feature any significant differences in parental education (χ2 (1, N=1,646)=1.232, p=0.267), and the proportions of cases with migration background were the same for both samples. Univariate skewness and kurtosis estimation indicated no salient deviations from normal distributions for all subtest scores. When compared with the critical kurtosis value (kurtc.r.), Mardia’s kurtosis estimates revealed multivariate non-normality for both the EFA sample (kurt=9.73>kurtc.r.=9.01) and the CFA sample (kurt=7.27>kurtc.r.=6.73). Test statistics also suggested that there were no significant mean differences in subtest scores between both samples, ranging from t=−0.20, p=0.84 (MR) to t=1.29, p=0.20 (CD). Since mean subtest scores and standard deviations appeared not to differ substantially from the expected population parameters, the EFA and CFA samples can be regarded as population-representative according to the stratification variables.
Instrument and Measures
The German WISC-V was adapted from the original United States version (WISC-V US) based on a standardization kit that provides the basic framework for all European WISC-V versions. Like all Wechsler intelligence scales, the German WISC-V represents a comprehensive test of intelligence and provides a total of 15 subtests in its administration and scoring framework. Among those, there are 10 primary subtests including Block Design (BD), Similarities (SI), Matrix Reasoning (MR), Digit Span (DS), Coding (CD), Vocabulary (VC), Figure Weights (FW), Visual Puzzles (VP), Picture Span (PS), and Symbol Search (SS) from which seven primary subtests (BD, SI, MR, DS, CD, VC, and FW) are used to derive the FSIQ. Along with VP, PS, and SS, the scaled scores (M=10, SD=3) of all 10 primary subtests are required for calculating the five primary index scores for VCI, VSI, FRI, WMI, and PSI. Like the FSIQ, these index scores are defined by standard scores on the IQ scale (M=100, SD=15). All primary subtests of the German WISC-V feature good to excellent internal consistency coefficients, with Cronbach’s alpha ranging from 0.81 to 0.93.
Data Analyses
Exploratory factor analyses (EFA) and confirmatory factor analyses (CFA) in the present study were based on the subtest covariance matrices of the bifurcated extended German WISC-V standardization sample. One covariance matrix was analyzed by conducting principal axis analyses on the EFA sample in order to assess the WISC-V factor structure using SPSS 25 and the other was subjected to CFA for model comparisons using AMOS 25.
Exploratory Approach
To initially determine the number of factors to be extracted and retained in EFA, multiple criteria were examined to overcome the limitations of each single one. These criteria included Kaiser’s criterion of eigenvalues > 1, Cattell’s scree test, the standard error of scree (SEscree), Horn’s parallel analysis (HPA), Glorfeld’s modified parallel analysis (GPA), and the analysis of minimum average partials (MAP). While some criteria estimation algorithms were already implemented in SPSS 25, others had to be additionally computed with open source software. Scree analysis of standard errors was performed using the SEscree program (Watkins, 2007) and random eigenvalues for HPA were produced using 100 iterations to provide stable eigenvalue estimates with the Monte Carlo PCA for Parallel Analysis software (Watkins, 2000). The CIeigenvalue program (Watkins, 2011) was used to calculate the 95% confidence intervals for eigenvalues that were then utilized for the GPA criterion. Since most extraction techniques tend to suggest the retention of only a few number of factors when there is a predominant general factor involved (Crawford et al., 2010), more complex factor solutions were also included in the analyses by forcing a predetermined number of factors to be extracted. These factor solutions were specified on a theoretical basis and evaluated in terms of their interpretability. Finally, principal axis analyses were used to examine the covariance matrix of the EFA sample and the retained factors were subjected to promax rotation for an oblique factor solution with κ=4 (Gorsuch, 1983) to allow for acceptably small correlations among factors. Following the recommendations made by Canivez and Watkins (2010), factors were required to have at least two salient subtest loadings (λ≥0.30) to be considered tenable.
Given that subtest scores reflect combinations of higher- and lower-order factors within the hierarchical WISC-V scoring framework, variance of the second-order factor had to be extracted first to residualize variance proportions from the first-order factors (Dombrowski et al., 2018). This way, relative variance apportionment could be examined separately for the first- and second-order factors. Estimating the unique variance proportions then allowed determining how good subtest indicators were represented by their respective factors. The Schmidt and Leiman procedure (SL procedure; Schmid and Leiman, 1957) has proven useful in accomplishing such a variance residualization and has already been applied in EFA studies on the WISC-V (Dombrowski et al., 2015, 2018; Canivez, 2016; Lecerf and Canivez, 2018). The SL procedure was applied to the hypothesized higher-order factor solutions (four-factor and five-factor EFA models) for comparison purposes and was conducted using the MacOrtho program (Watkins, 2004).
Confirmatory Approach
Different factor structures including both hierarchical and bifactor models were examined by conducting CFA on the 10 WISC-V primary subtests. The scale of latent variables was identified by fixing one loading of each factor to one (Keith, 2015). Subtest scaled scores (M=10, SD=3) were used after being initially checked for normality. As a rule of thumb, maximum likelihood (ML) estimation was considered adequate for data with an absolute value < 2 for skewness and an absolute value < 7 for kurtosis (West et al., 1995). Although the examination of univariate skewness and kurtosis did not reveal excessive deviation from normality for each single subtest score, however, Mardia’s multivariate kurtosis estimate indicated a salient leptokurtic distribution of subtest scores (kurt=7.27>kurtc.r.=6.73). Since a significant departure from multivariate normality in ML estimation might lead to inflated χ2 test statistics and could thus result in an incorrect rejection of reasonable model solutions, the Bollen-Stine bootstrapping procedure was used to obtain adjusted p values for the likelihood ratio χ2 test statistics. As recommended by Nevitt and Hancock (2001), bootstrapping with 2,000 bootstrap samples should then sufficiently correct for any biasing impact that multivariate non-normality might have on the assessment of model fit (see Bollen and Long, 1993, for an overview). Finally, a total of five competing CFA models were specified according to those that have already been examined by the test publishers, starting with the least complex model that comprised the 10 WISC-V primary subtests loading only on one unidimensional g-factor (M1). All subsequent models with more than one first-order factor included g as the second-order factor. In addition to the latter, the second model (M2) comprised the two first-order factors Verbal (V) and Performance (P). In the third model (M3), the hierarchical structure was extended by Verbal (V), Performance (P), and Processing Speed (PS) as the first-order factors. The fourth model (M4) was composed of the four first-order factors Verbal Comprehension (VC), Perceptual Reasoning (PR), Working Memory (WM), and Processing Speed (PS), which have already been described for the WISC-IV (Wechsler, 2009). Finally, the WISC-V second-order five-factor model structure, including Verbal Comprehension (VC), Visual-Spatial (VS), Fluid Reasoning (FS), Working Memory (WM), and Processing Speed (PS), was specified by the fifth model (M5). CFA models with four- and five first-order factors were examined using both hierarchical (M4 and M5) and bifactor (M6 and M7) variants.
As with other versions of the WISC-V, some latent factors are underidentified in the five- and four-factor models because they provide only two subtest indicators. In line with other studies on this topic (e.g., Canivez et al., 2017; Watkins et al., 2017), identification of latent factor scales in CFA higher-order models was accomplished by setting one loading on each first-order factor and one loading on the second-order factor to one (see, Brown, 2015, for an overview). Additionally, all regression weights of error terms were set to one. In specifying latent factors with two subtest indicators in CFA bifactor models, the path coefficients on their group factors were constrained to equality prior to estimation to ensure identification (see, Little et al., 1999, for an overview).
A set of different model fit indexes was additionally analyzed for each single CFA model to improve evaluation. Due to the oversensitivity of χ2 for large sample sizes (Kline, 2016), the root mean square error of approximation (RMSEA) was jointly examined as an absolute fit index. RMSEA values of less than or equal to 0.01 indicate an excellent fit, a value of 0.05 corresponds to a good fit, and an RMSEA value of 0.10 should be used as an indicator for a poor fit (MacCallum et al., 1996). Following Chen’s (2007) recommendations, a considerable change in RMSEA values (ΔRMSEA>0.015) should also be taken into account when comparing the relative fit of competing CFA models. Additional relative fit indexes used were the comparative fit index (CFI) and the Tucker-Lewis index (TLI), where in both cases values above 0.95 correspond to a good fit (Hu and Bentler, 1999). Given that there are no universally accepted criteria for evaluating the overall model fit (McDonald, 2010), combinations of different heuristics were applied defining CFI and TLI≥0.90 along with RMSEA≤0.08 as a criterion for acceptable model fit and CFI and TLI≥0.95 in combination with RMSEA≤0.06 as a criterion for good model fit (Hu and Bentler, 1999). Finally, the Akaike information criterion (AIC) was used as an information-theoretic fit index to compare competing CFA models, with lower values indicating a better fit (Kaplan, 2000). Confirmatory factor analyses models were considered superior only if they indicated an adequate to good model fit and a substantially better fit (ΔCFI>0.01, ΔRMSEA>0.015, ∆AIC>10) than competing models (Chen, 2007).
Since Cronbach’s alpha is a limited reliability coefficient for multifactorial models (Yang and Green, 2011; Dunn et al., 2014), omega-hierarchical (ωH) and omega-hierarchical subscale (ωHS) were additionally estimated to provide meaningful model-based reliability coefficients (Reise, 2012; Rodriguez et al., 2016; Watkins, 2017). The ωH coefficient represents an estimate for the general factor reliability independent of the group factor variances, whereas ωHS indicates the reliability of each group factor that is adjusted for all other group and general factor variances (Brunner et al., 2012). Therefore, ωHS may control for that proportion of reliability attributable to the general factor and is useful for judging the informative value of each single first-order factor score. Robust ωHS coefficient could thus indicate that most of the reliable index variance are rather independent of the FSIQ, so that individual cognitive functioning may be meaningfully interpreted on the index level. On the contrary, low values of ωHS would suggest that most of the reliable variance of the indexes are attributable to the FSIQ. This might then compromise the interpretability of index scores as unambiguous indicators of specific cognitive domains (Rodriguez et al., 2016). For ωH and ωHS, it has been recommended that values near 0.75 should be preferred and values should not be less than 0.50 (Reise et al., 2013). Omega coefficients were supplemented by the construct replicability coefficient H to evaluate how adequate the latent variables were represented by their related indicators (Hancock and Mueller, 2001). H values should not be less than 0.70 in order to ensure a high quality of indicators and replicability of latent variables. The Omega program (Watkins, 2013) was used to obtain all omega coefficients, H coefficients, and other sources of variance (see Zinbarg et al., 2006; Brunner et al., 2012, for an overview).
Results
Exploratory Approach
The KMO test statistic indicated an adequate sampling as its value of 0.88 exceeded the minimum criterion of 0.60 (Kaiser, 1974). Since Bartlett’s test of sphericity indicated that the correlation matrix diverged significantly from the identity matrix (χ2 (45)=3,079.938, p<0.001) and initial communality estimates ranged from 0.300 to 0.550 prior to extraction, the covariance matrix was considered appropriate for conducting EFA.
Factor Extraction
Cattell’s scree test suggested two factors to be extracted as the scree plot revealed two factors that met Kaiser’s criterion of eigenvalues > 1, for which the SEscree also indicated nontrivial standard errors of estimation. Two factors with eigenvalues significantly greater than randomly generated eigenvalues were also identified in GPA, HPA, and MAP, thus supporting the retention of two factors in total. Since it has been recommended for principal axis analysis to better over-extract than under-extract (Wood et al., 1996), traditionally promoted Wechsler model structures were also considered by additionally forcing the extraction of three, four, and five factors in EFA. Five factors were extracted at first to examine the WISC-V factor structure that has been proposed by the test publishers. Alternative model solutions were then sequentially examined for adequacy in descending order by the number of factors from four to two factors.
EFA Model Solutions
Five-Factor Model Solution (Oblique)
As presented in Table 2, the extraction of five factors produced one factor with only one salient factor pattern coefficient. According to Kaufman’s criteria (1994), a weak g-loading indicated only a poor association between CD and a general factor (Sg=0.488). While each of four subtest pairs, including SI and VC (Verbal Comprehension), BD and VP (Visual Spatial), DS and PS (Working Memory), and CD and SS (Processing Speed), saliently loaded on a corresponding common factor, MR and FW appeared to share insufficient common variance to constitute a single factor for Fluid Reasoning. FW completely failed to provide a salient loading on any factor and the very high factor pattern coefficient for MR (P=0.921) further supported the redundancy of a separate factor for Fluid Reasoning. Given that no reasonable factor could be found for Fluid Reasoning, the five-factor model was judged inadequate due to over-extraction.
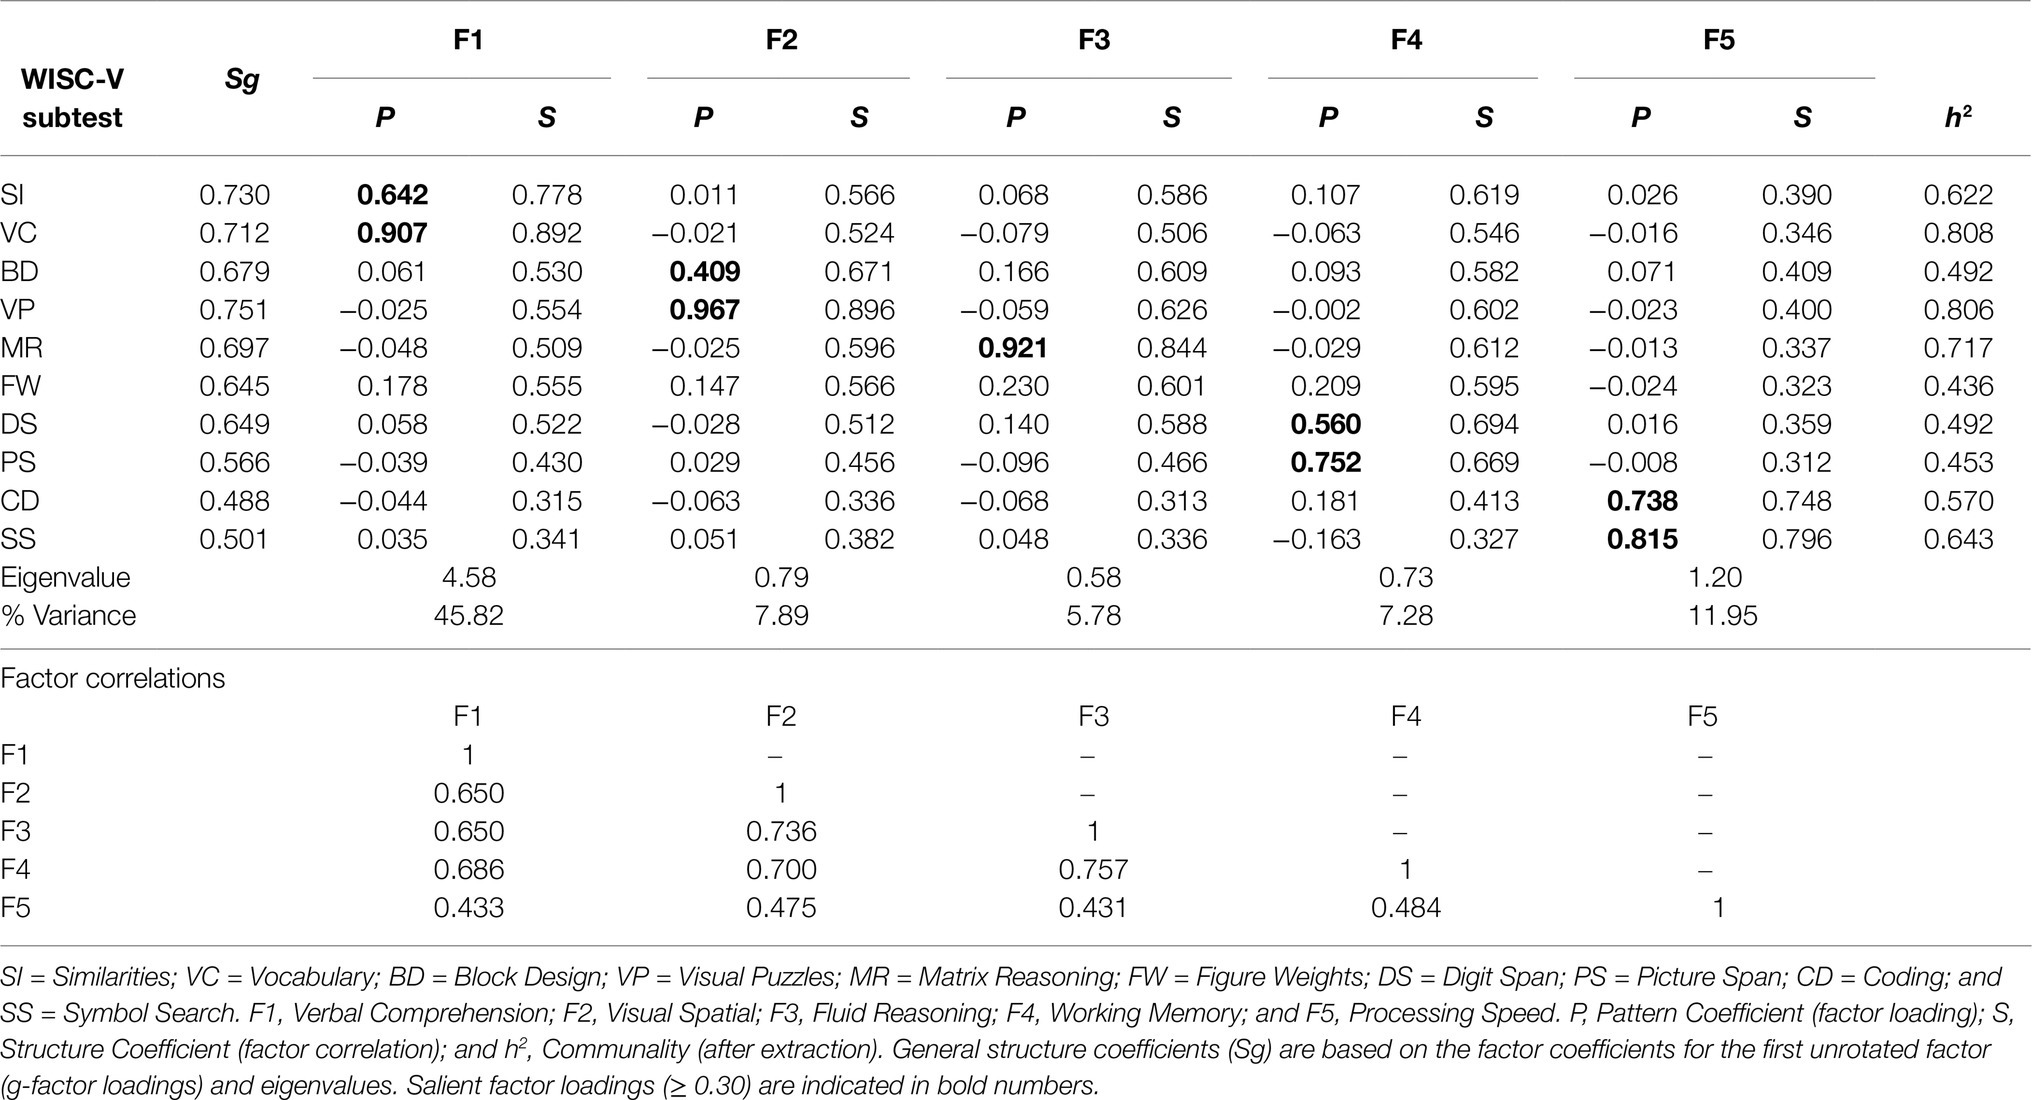
Table 2. Exploratory factor analysis of the 10 WISC-V primary substests: Five-factor model solution (oblique) with promax rotation for the EFA sample (n=823).
Four-Factor Model Solution (Oblique)
When extracting four WISC-V factors, g-loadings ranged from Sg=0.495 (SS) to Sg=0.736 (SI) and were, except for SS, within the fair to good range based on Kaufman’s criteria. As Table 3 illustrates, the four-factor model solution provided stable and well-defined factors with theoretically consistent factor patterns. Thus, robust factor pattern coefficients were found for Verbal Comprehension, including SI (P=0.624) and VC (P=0.948) and for Perceptual Reasoning, including BD (P=0.692), VP (P=0.805), MR (P=0.461), and FW (P=0.328). This was also the case for Working Memory, including reasonable pattern coefficients for DS (P=0.686) and PS (P=0.581), as well as for Processing Speed with strong pattern coefficients for CD (P=0.813) and SS (P=0.710). Since none of the subtests featured salient loadings on more than one factor, simple structure could be established for this model solution.
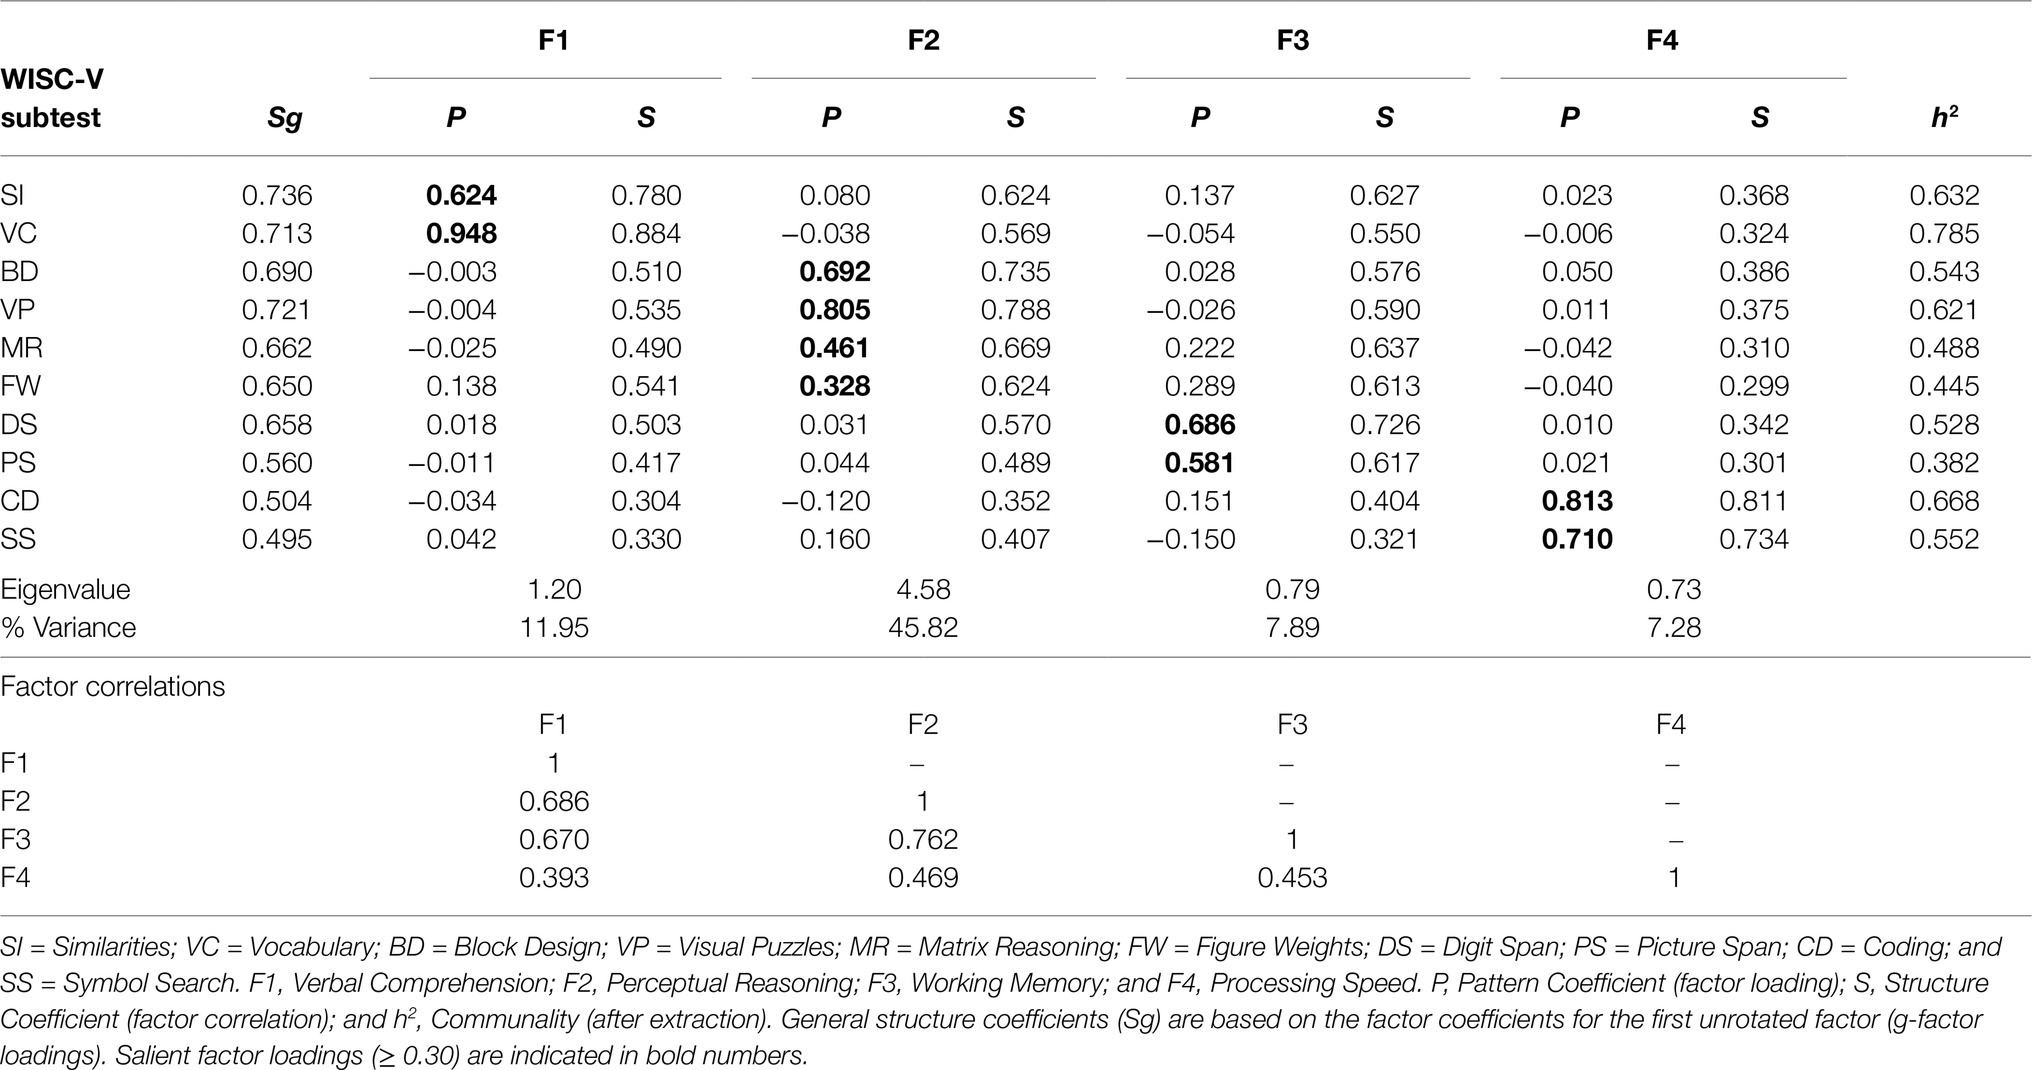
Table 3. Exploratory factor analysis of the 10 WISC-V primary subtests: four-factor model solution (oblique) with promax rotation for the EFA sample (n=823).
Three- and Two-Factor Model Solutions (Oblique)
EFA results for the model solutions with three and two extracted factors are presented in Table 4. The factors for Perceptual Reasoning and Working Memory from the four-factor model solution merged into one factor labeled as Performance (P), while Verbal Comprehension and Processing Speed remained intact in the three-factor model. For the sake of theoretical consistency, Verbal Comprehension was relabeled as Verbal and there were no salient cross-loadings on multiple factors among the subtests in the three-factor model solution. The latter also applied to the two-factor model solution, in which only Processing Speed remained distinct and intact. Eight out of ten subtests appeared to load on another single factor, which was labeled as General Intelligence (g) due to its complexity, and the patterns of subtest associations in both models clearly indicated a conflation of theoretically meaningful constructs. Since this is an already well-known phenomenon of under-extraction in EFA, the three- and two-factor model solutions were both considered inadequate.
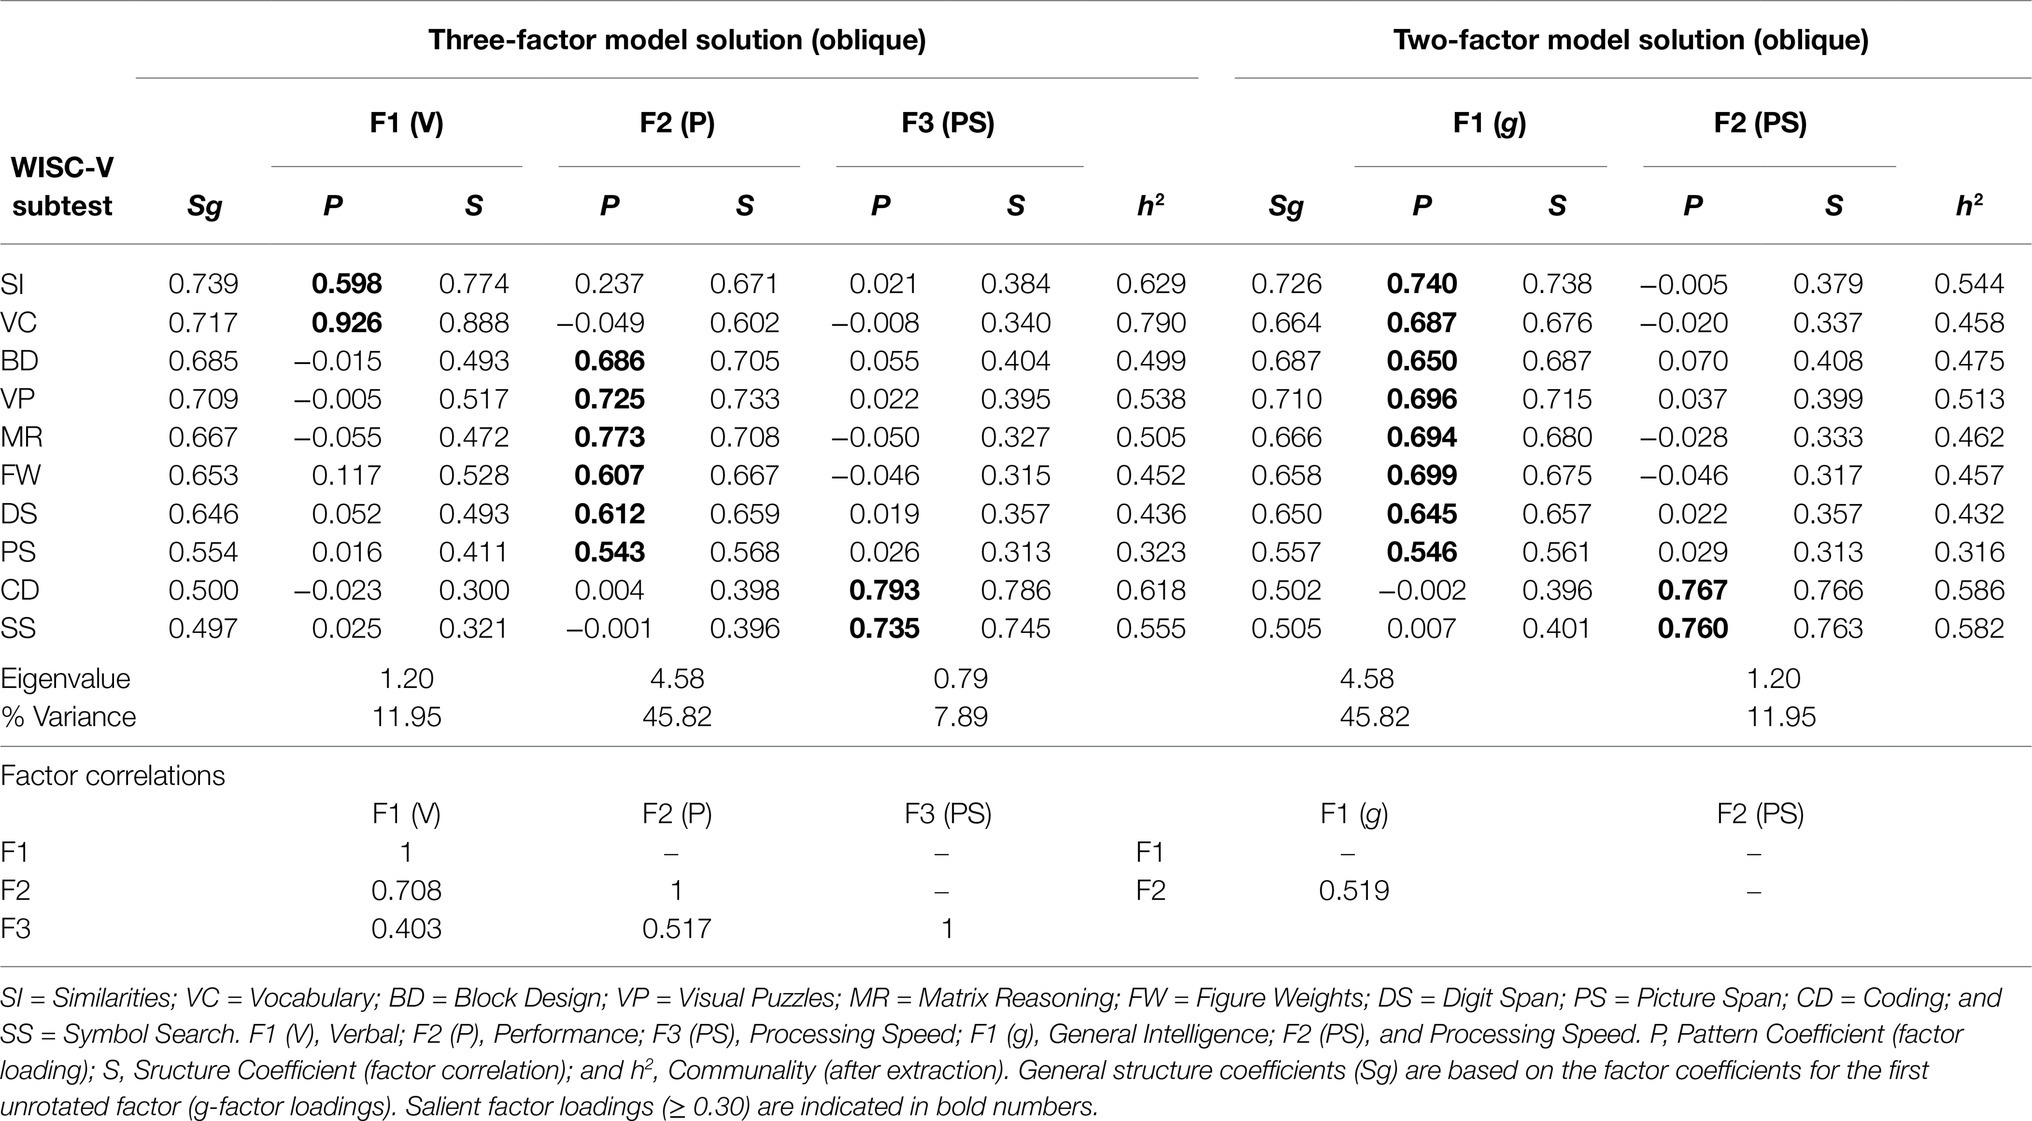
Table 4. Exploratory factor analysis of the 10 WISC-V primary subtests: three- and two-factor model solutions (oblique) with promax rotation for the EFA sample (n=823).
Higher-Order Four-Factor Model Solutions (SL Orthogonalized)
According to the present results, the four-factor model solution appeared to be the most reasonable and appropriate among all EFA models examined. Therefore, it was subjected to higher-order EFA and orthogonalized using the SL procedure. As displayed in Table 5, all 10 subtests were exclusively associated with their theoretically suggested factors as proposed for the WISC-IV. When analyzing the sources of variance, g appeared to account for 29.9% of the total variance and 56.5% of the common variance. It also explained between 19.4% (PS) and 39.6% (SI) of the individual subtest variance. A total of 53% of the subtest score variances could be explained by g and group factors combined, leaving 47% unique or error variance unexplained. Among all subtests, FW accounted for the smallest proportion of common variance (29.4%), thus being mostly influenced by unique variance (70.6%).
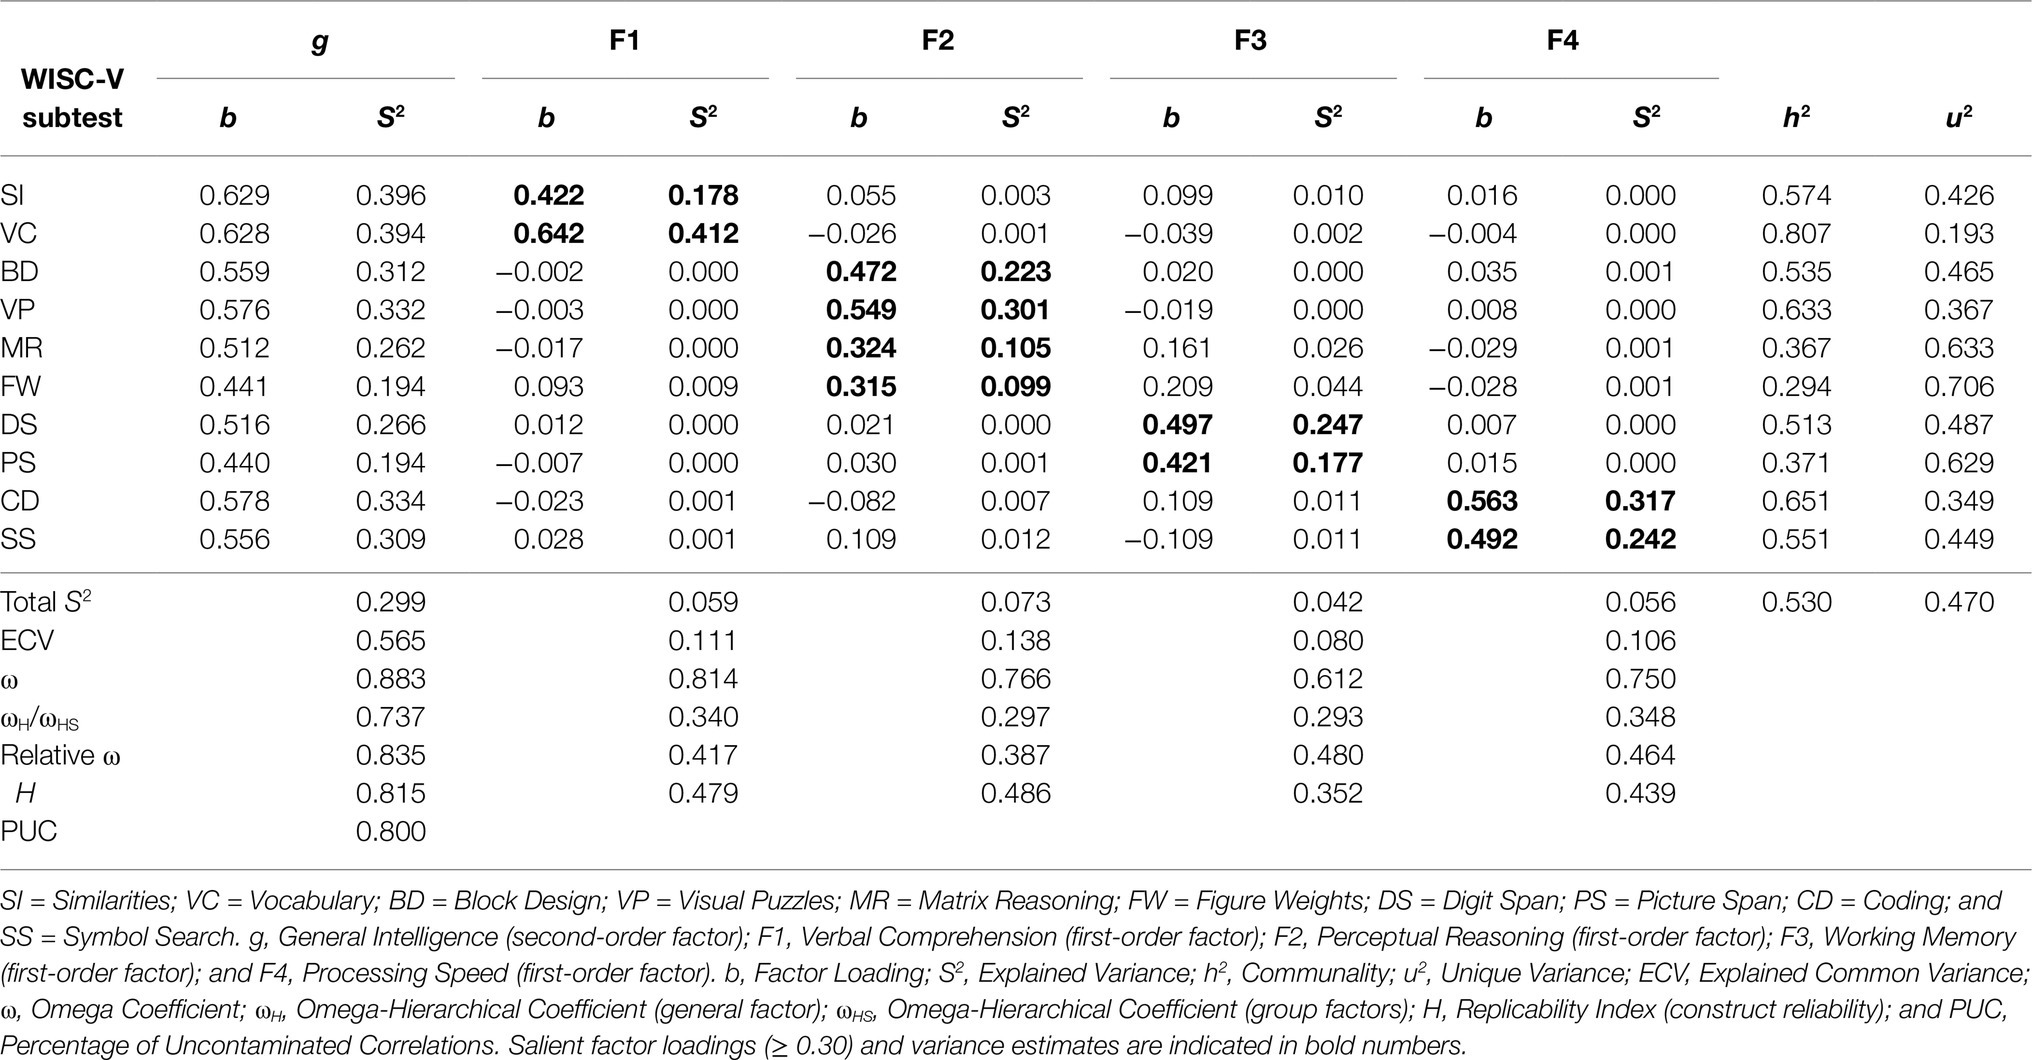
Table 5. Sources of variance in the 10 WISC-V primary subtests for the EFA sample (n=823) according to a SL-orthogonalized higher-order factor model with four first-order factors.
While the ωH coefficient value of 0.737 indicated that the second-order factor (g) was precisely measured and barely influenced by variances in other factors, all ωHS coefficient values for the first-order factors, ranging from ωHS=0.293 (WM) to ωHS=0.348 (PS), fell below the required minimum criterion of ωHS=0.500 (Reise et al., 2013). Thus, model-based reliability coefficients suggest that an overall measure, such as the FSIQ, could appear reliable for scale interpretation, whereas unit-weighted composite scores based on the four indexes might contain too little true score variance for meaningful interpretation. This was also supported by the construct replicability coefficients. While the H coefficient value for the second-order factor (H=0.815) indicated that g was well defined by the subtest indicators, all H coefficient values for the first-order factors, ranging from H=0.352 (WM) to H=0.486 (PR), failed to meet the required minimum criterion of H=0.700 (Hancock and Mueller, 2001; Rodriguez et al., 2016). Given that the first-order factors appeared to be insufficiently defined by their associated subtest indicators, the WISC-V primary subtests cannot be suggested to produce consistent scores on the four indexes across measurements.
Confirmatory Approach
Results of the confirmatory factor analyses (CFA) based on maximum likelihood estimation and the according model fit statistics are presented in Table 6. As indicated by the fit indexes, the unidimensional g-factor model (M1) and the second-order two-factor model (M2) were found to inadequately represent the empirical data. This was due to unacceptably low CFI and TLI values (< 0.90) as well as too high RMSEA values (> 0.08) for the minimum fit criteria. However, CFI and TLI values (> 0.90) as well as RMSEA values (< 0.08) indicated at least acceptable fit for the second-order three-factor model (M3). The second-order four-factor model (M4) and the second-order five-factor model (M5) both appeared to represent well-fitting CFA models to the data (CFI>0.95; TLI>0.95; RMSEA<0.06). When comparing the fit of both models with M3, M4 (ΔCFI=0.033, ΔRMSEA=0.036, ΔAIC=101.765) and M5 (ΔCFI=0.039, ΔRMSEA=0.047, ΔAIC=118.458) were found to be superior. Only with respect to the difference in AIC, M5 fitted the data slightly better than M4 (ΔAIC=16.693). Likewise, the bifactor model with four group factors (M6) and the bifactor model with five group factors (M7) were found to be well-fitting models as well. When comparing both higher-order models with the corresponding bifactor models, the bifactor model with four group factors (M6) turned out to slightly surpass the second-order four-factor model (M4) but only according to the lower AIC (ΔAIC=16.905). Due to its local underidentification, the second-order five-factor model (M5) was mathematically equivalent to the corresponding bifactor model (M7), thus featuring the same fit statistics.
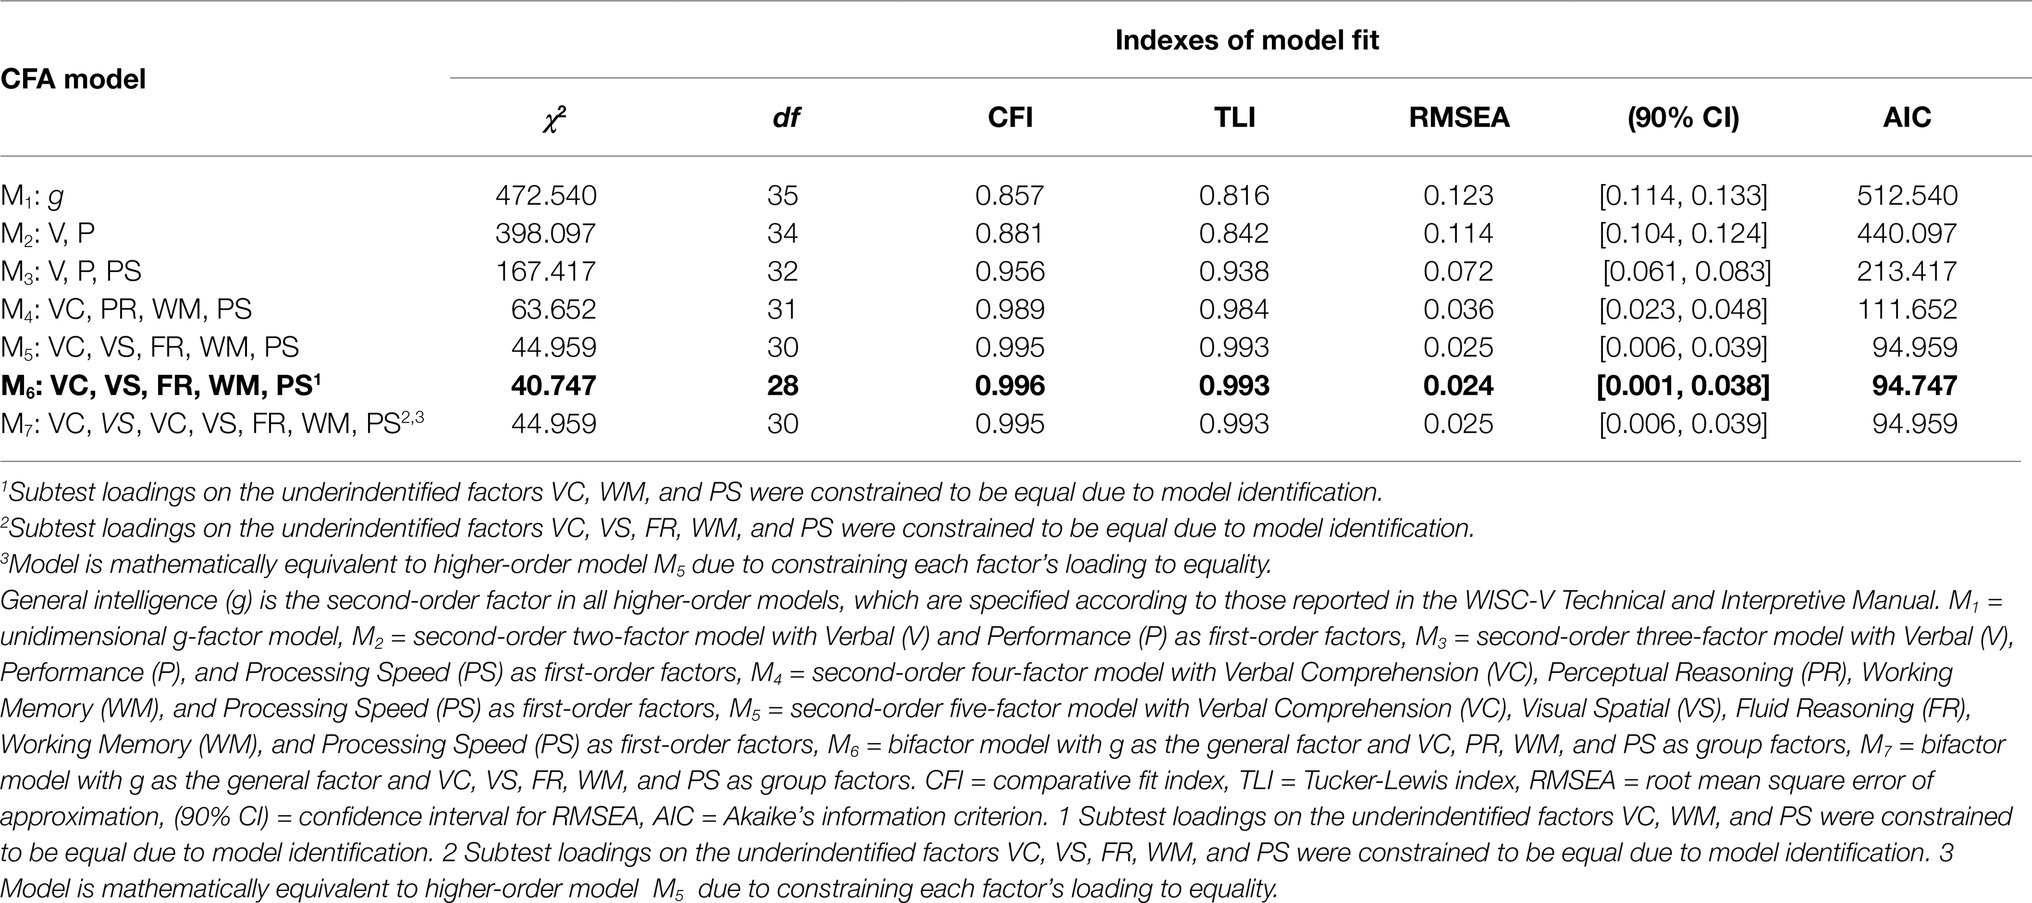
Table 6. Maximum likelihood estimation and model fit statistics based on the 10 WISC-V primary subtests for the CFA sample (n=823).
Even though the bifactor model with four group factors (M6) provided the most favorable fit statistics, there was no meaningful difference in CFI, TLI, RMSEA, and AIC values between M6 and the two models including five factors (M5 and M7). However, it should be noted that M6 was the only CFA model that featured an acceptable fit to the data according to its likelihood ratio χ2 statistic with adjusted p values (χ2=40.747, df=28, p=0.06). Finally, the bifactor model with four group factors (M6) was considered the best fitting model in the present CFA when taking all goodness-of-fit indexes into account.
Figure 1 shows the second-order five-factor model (M5) that has been proposed by the test publishers and Figure 2 shows the bifactor model with four group factors (M6) that appeared to be the best fitting model in the present CFA.
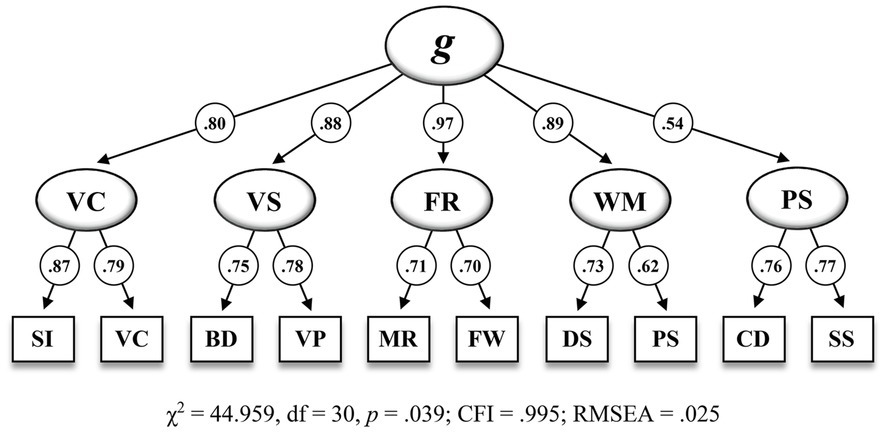
Figure 1. Second-order five-factor model including standardized estimations for the CFA sample (n = 823) on the 10 WISC-V primary subtests (M6 in Table 6). SI = Similarities, VC = Vocabulary, BD = Block Design, VP = Visual Puzzles, MR = Matrix Reasoning, FW = Figure Weights, DS = Digit Span, PS = Picture Span, CD = Coding, SS = Symbol Search. g, = General Intelligence, VC = Verbal Comprehension, VS = Visual Spatial, FR = Fluid Reasoning, WM = Working Memory, PS = Processing Speed. All standardized parameter estimates are significant at p<0.001.
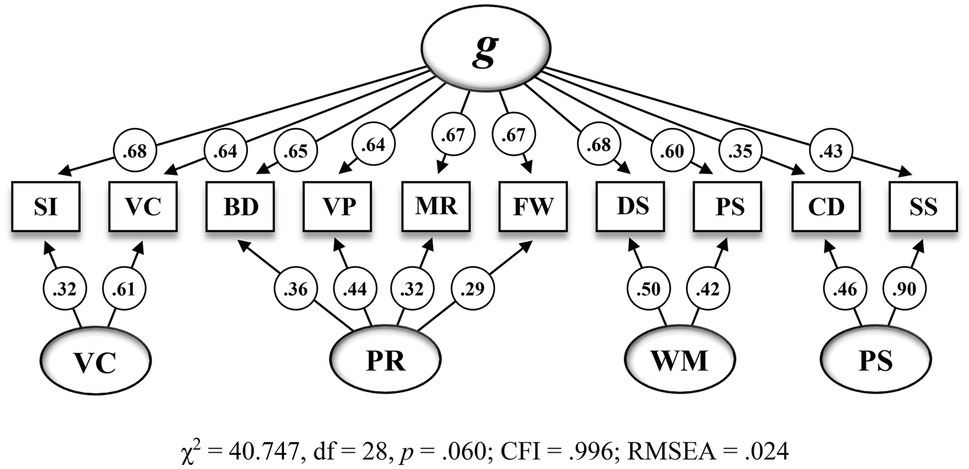
Figure 2. Bifactor model with four group factors including standardized estimations for the CFA sample (n=823) on the 10 WISC-V primary subtests (M6 in Table 6). SI = Similarities, VC = Vocabulary, BD = Block Design, VP = Visual Puzzles, MR = Matrix Reasoning, FW = Figure Weights, DS = Digit Span, PS = Picture Span, CD = Coding, SS = Symbol Search. g = General Intelligence, VC = Verbal Comprehension, PR = Perceptual Reasoning, WM = Working Memory. All standardized parameter estimates are significant at p<0.05.
As shown in Table 7, all subtest indicators featured significant and reasonable loadings on g and on their related group factors in M6. However, decomposed variance estimates further indicated that smaller proportions of explained common variance (ECV), ranging from ECV=0.069 (WM) to ECV=0.164 (PS), were uniquely associated with the group factors than those associated with g. Conclusively, about 60.7% of the explained common variance in the subtest indicators appeared to be uniquely attributable to g. Consistent with the ECV estimates, the analysis of model-based reliability revealed rather small ωHS coefficient values for the group factors, ranging from ωHS=0.187 (PR) to ωHS=0.589 (PS), when compared to the ωH coefficient value of 0.794 for g. While g turned out to be precisely measured by the subtest indicators, most of the ωHS coefficient values for the group factors were below the required minimum criterion of ωHS=0.500 (Reise et al., 2013). As in the case of the higher-order four-factor EFA model, unit-weighted composite scores for three out of four indexes might therefore produce too little true score variance to fully recommend interpretation.
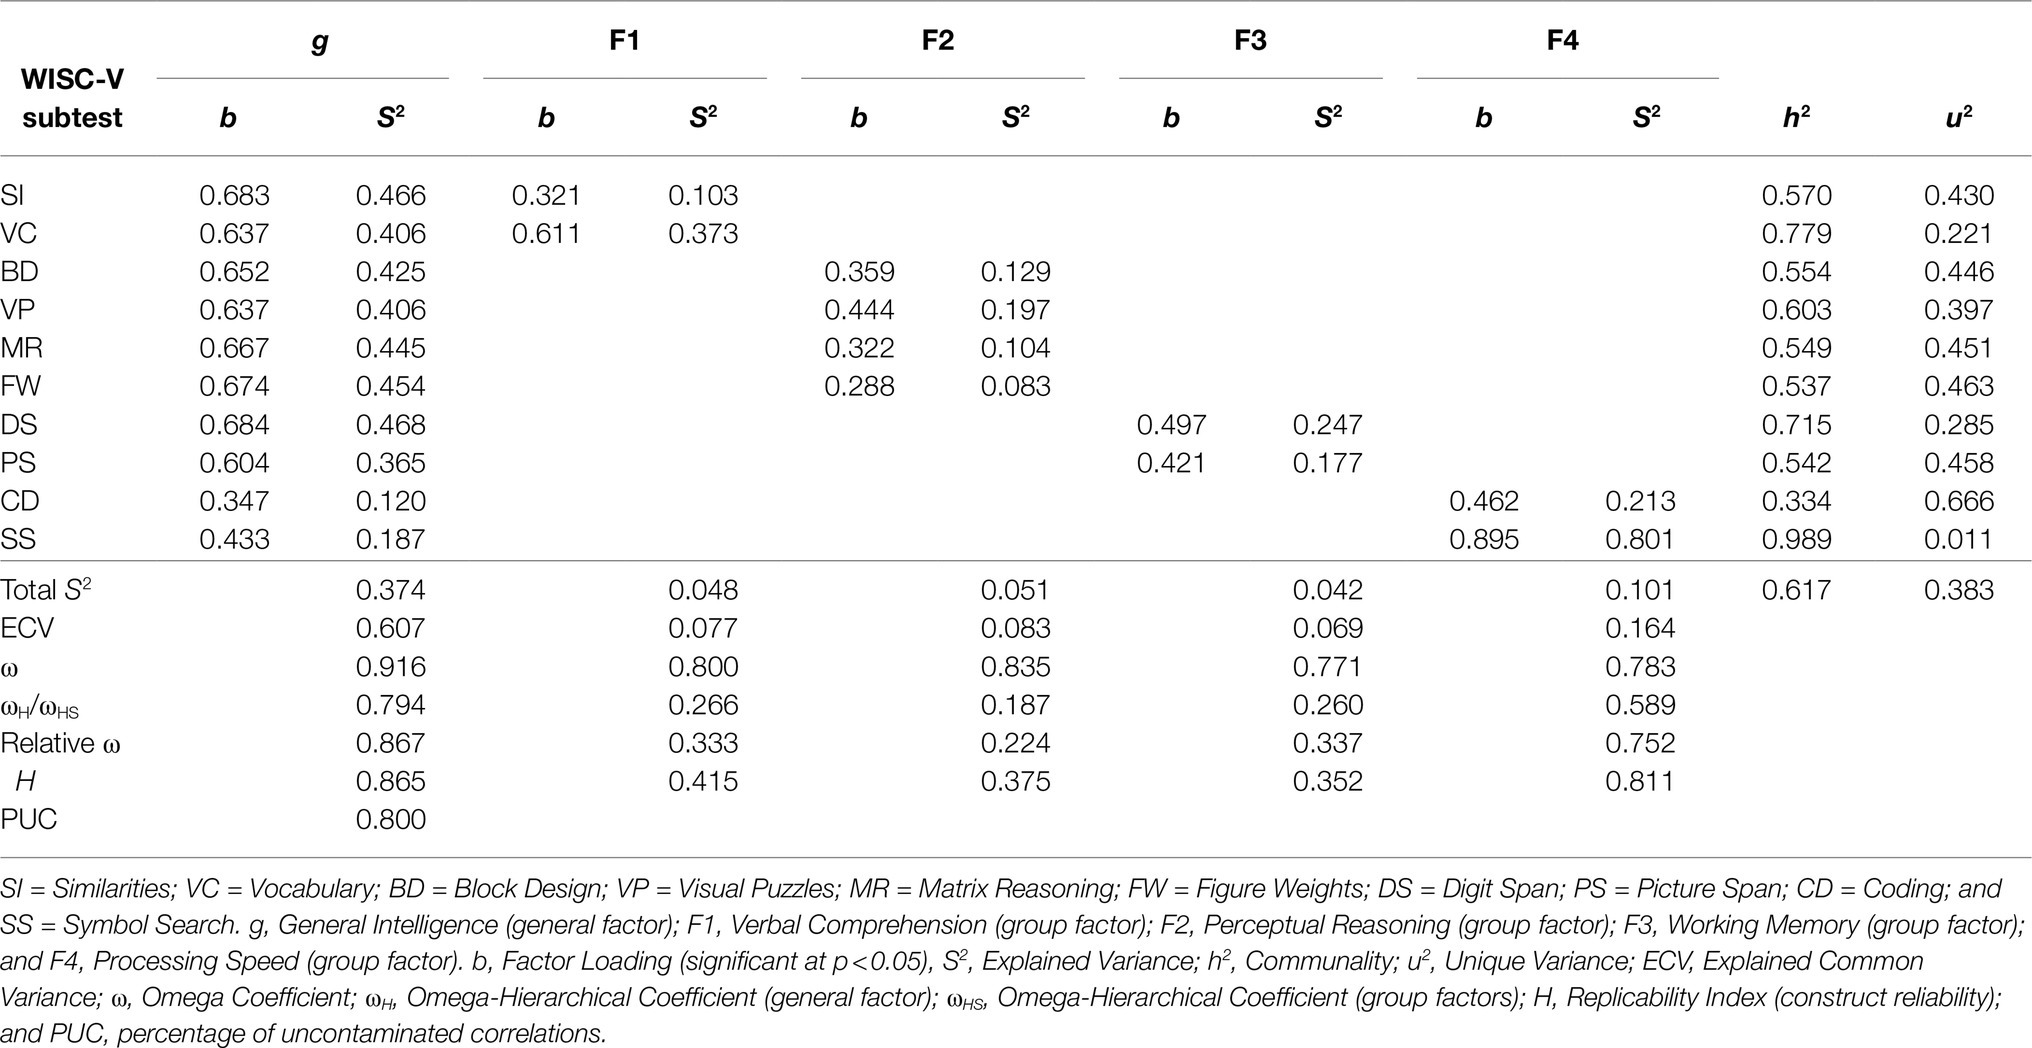
Table 7. Sources of variance in the 10 WISC-V primary subtests for the CFA sample (n=823) according to a bifactor model with four group factors (M6).
While the construct replicability coefficient H in Table 7 suggested that g was well defined by the 10 subtest indicators, H coefficient values for the other factors, ranging from 0.352 (WM) to 0.811 (PS), indicated that three out of four group factors were not adequately defined by their subtest indicators. This means that, with the exception of PSI, eight out of 10 WISC-V primary subtests would not produce consistent scores on their related indexes VCI, PRI, and WMI across measurements.
Discussion
The overall factor structure of the WISC-V has been a subject of controversial debate to this very day. Even though the test publishers claimed support for the second-order five-factor model based on CFA analyses, this model could not be fully replicated in a variety of different standardization samples (e.g., Canivez et al., 2017; Watkins et al., 2017; Fenollar-Cortés and Watkins, 2018; Lecerf and Canivez, 2018). Therefore, the major aim of the present study was to determine structural validity of the German WISC-V. Since CFA results provided in the test manual have been frequently criticized by researchers, different factor analytical procedures were conducted on the large extended and bifurcated German standardization sample.
In line with the results reported by Canivez et al. (2021), EFA failed to replicate five valid factors for the 10 primary subtests of the German WISC-V, thus suggesting psychometric inappropriateness of the second-order five-factor model. When forced to extract more than one factor, EFA results suggested a four-factor model rather than a five-factor model, particularly because the Fluid Reasoning (FR) factor failed to provide more than one salient subtest indicator. Visual spatial (VS) and Fluid Reasoning (FR) were not found to emerge as distinct factors, as their related subtest indicators shared variance with only one single factor similar to Perseptual Reasoning (PR) in the WISC-IV framework. Moreover, hierarchical EFA with the SL orthogonalization indicated superiority of the second-order factor over the first-order factors, as g accounted for between 4 and 7 times as much common subtest variance as any single first-order factor and more common subtest variance than all four first-order factors combined. Model-based reliability estimates for the first-order factors appeared to be low in value when compared to the reliability coefficient for the second-order factor. Since construct replicability estimates were also found to be unacceptably low for each of the first-order factors, the according WISC-V indexes may be considered limited in measuring unique cognitive dimensions (Brunner et al., 2012; Reise, 2012; Rodriguez et al., 2016). Since Canivez et al. reported similar findings when analyzing the entire set of 15 primary and secondary subtests of the German WISC-V, the present EFA and CFA results can be considered as meaningful and robust.
Consistent with the EFA results, a four-factor structure was judged as being the best fitting model in CFA. While the second-order and bifactor five-factor model solutions both provided acceptable fit to the data, fit indexes tended to slightly favor four factors within a bifactor structure. This was also supported by the subtest indicators, each of which was for the most part saliently loading on just one associated group factor and thus achieving the preferable simple structure. As with the SL-orthogonalized EFA model, the assessment of variance sources again indicated the dominance of g on the one hand and the limited unique measurement of the first-order factors on the other hand. While about 7% (WM) to 16% (PS) of the common subtest variance could be explained by the according first-order factors, g accounted for nearly 61% of the common subtest variance. In particular, g accounted for between three and eight times as much common subtest variance as any single first-order factor and about 1.5 times as much common variance as all four first-order factors combined. Consistent with the findings of Canivez et al. (2021), the present EFA and CFA results were not surprising as it has previously been reported that the greatest proportions of common variance are associated with the second-order factor and smaller proportions of common variance are apportioned to the first-order factors (Canivez et al., 2016, 2017; Watkins et al., 2017; Fenollar-Cortés and Watkins, 2018; Lecerf and Canivez, 2018). When analyzing model-based reliability and construct replicability according to the bifactor four-factor model, CFA results were consistent with what was already indicated by EFA. In both analyses, model-based reliability and construct replicability coefficients for g turned out to be satisfactory, thus suggesting a confident individual interpretation of an overall measure, such as the FSIQ. Except for PS, however, reliability and replicability coefficients for the group or first-order factors appeared to be too low to suggest that the according unique cognitive dimensions are sufficiently well represented by the WISC-V primary indexes. Similar results have not only been found for the German WISC-V as described earlier (Canivez et al., 2021) but had already been observed in studies focusing on international versions of the WISC-IV (Watkins, 2010; Canivez, 2014; Canivez et al., 2017) and on other Wechsler scales as well (Canivez and Watkins, 2010; Golay and Lecerf, 2011; Watkins and Beaujean, 2014). Even though results of the present study indicated meaningful interpretation of an overall measure for g, this is only true if the corresponding composite score is based on all 10 primary subtests. Given that the FSIQ is calculated using only seven out of 10 primary subtest scores in all versions of the WISC-V, this measure could likely under- or over-estimate true levels of general intellectual ability. Therefore, psychometric appropriateness and interpretability of g cannot be equally guaranteed for or at least not fully transferred to the FSIQ.
Furthermore, the present findings do not only provide substantial support for the results recently reported by Canivez et al. (2021), they also underline the need of comparing hierarchical and non-hierarchical model structures when analyzing the structural validity of the WISC-V. In hierarchical models of intelligence, the second-order factor is only indirectly connected to the subtest indicators as the first-order factors are suggested to fully mediate these associations. In bifactor models, by contrast, the general factor and the group factors both directly influence the subtest indicators at the same level of inference (Gignac, 2008). Consequently, direct subtest associations are easier to interpret as general and specific subtest influences can be simultaneously examined. However, there are still varying perspectives on which of the two model solutions are the most appropriate representation of intelligence (e.g., Brunner et al., 2012; Gignac and Watkins, 2013; Beaujean, 2015; Frisby and Beaujean, 2015; Reynolds and Keith, 2017). While some researchers suggested that bifactor models in general benefit from statistical biases related to unmodeled complexity (Murray and Johnson, 2013) and unique constraints within hierarchical model solutions (Mansolf and Reise, 2017), others have not found such biases exclusively favoring bifactor models Canivez et al., 2017. Even though Canivez et al. (2018) claimed that post-hoc model modifications with a lack of conceptual grounding (e.g., cross-loadings and correlated error terms) are often added by researchers preferring hierarchical model solutions to only improve model fit, such post-hoc model modifications are not restricted to analyses of hierarchical models only. Bifactor models may as well over-estimate loadings on a higher-order factor while under-estimating variance accounted for lower-order factors (Markon, 2019). While general intelligence is an important and theoretically valid construct, different analytical approaches should be considered to provide a variety of perspectives on the underlying cognitive subdomains as well (Decker et al., 2020). Since the WISC-V provides a scoring framework for specific index score comparisons, researchers and clinicians must be certain of how well the WISC-V primary indexes represent unique cognitive domains. According to a large body of empirical evidence, bifactor models are often emphasized to be the better choice when it comes to determining and interpreting the relative contribution of each single WISC-V index score independent of g (Murray and Johnson, 2013). However, Decker et al. (2020) also pointed out that studies on structural validity using bifactor models or SL procedures might be at least methodologically biased in favor of a presumed and dominant general factor of intelligence. Clinical recommendations for cognitive test interpretation should at least consider these methodological limitations.
In summary, the second-order five-factor model structure that is provided in the WISC-V test manual could not be fully supported by the present EFA and CFA on the extended German WISC-V standardization sample. The absence of two salient indicators for FR in EFA along with slightly worse fit indexes in CFA indicated that dividing VS and FR into distinct factors could be considered inadequate due to over-factoring. Since it could also be shown that only small proportions of true score variance were explained by the first-order factors, interpreting single index scores beyond the FSIQ could likely result in over-interpreting or misinterpreting the true levels of specific cognitive abilities. Consequently, researchers and clinicians should be cautious when interpreting the WISC-V primary index scores individually. Regardless of whether a four- or five-factor structure is considered for the German WISC-V, group factors reflecting the primary indexes do not account for a sufficient proportion of variance to warrant confident interpretation of single index scores. Although the present findings clearly indicate that different levels of specific intellectual domains are not adequately represented by their corresponding WISC-V primary index scores, it has to be noted, however, that the WISC-V was originally designed to measure multiple dimensions underlying a general factor of intelligence. Since Decker et al. (2020) do not recommend to reduce diagnostic decision making to a single test score, clinical case reports should thus include comprehensive analyses that might be at least supplemented by additional clinical information derived from the WISC-V primary indexes. Instead of over-interpreting each single WISC-V primary index score as a valid composite score, these index scores should rather be regarded as pseudocomposite scores representing specific combinations of the underlying primary subtests. If necessary, comparing those pseudocomposite scores as well as performances on the subtest level relative to each other may at best provide additional information about specific cognitive strengths and weaknesses within an individual.
Finally, it has to be noted that the present study only focused on the structural validity of the German WISC-V but did not clarify further questions pertaining to construct validity. Even though Pauls et al. (2019) already examined measurement invariance across gender, for instance, structural validity of the German WISC-V has neither been examined in clinical samples nor in groups with extreme levels of intelligence. Since profoundly gifted individuals are not sufficiently represented in the standardization sample of the German WISC-V, for example, they could feature meaningful cognitive patterns different from those previously described. Therefore, future research should focus on testing the validity of the German WISC-V factor structure on a variety of clinical samples. In order to solve the overall validity disagreements regarding whether hierarchical or bifactor models best describe the structure of intellectual abilities, however, research should go beyond the mere comparison of statistical measures in favor of more theoretical approaches providing an explanatory basis for cognitive constructs in general (Keith and Reynolds, 2018). Research focusing on the integration of psychometrically sound models with neurocognitive outcomes based on brain networks could thus enhance the understanding of the complex nature of human intelligence.
Data Availability Statement
All rights for the raw data are reserved by the publisher of the WISC-V. Other data supporting the conclusions of this article will be made available by the authors with prior permission.
Ethics Statement
Ethical review and approval were granted by the responsible school authorities and province school boards in accordance with the local legislation and institutional requirements. Written informed consent to participate in this study was provided by the participants’ legal guardian/next of kin.
Author Contributions
FP has contributed to data collection, data analysis and interpretation, manuscript preparation, and drafting of the article. MD has contributed to the conception and design of work, data collection, and critical revision of the manuscript. All authors contributed to the article and approved the submitted version.
Funding
The study was conducted without any funding. The open access publication fees were funded by the library of the Helmut-Schmidt-University/University of the Federal Armed Forces Hamburg.
Conflict of Interest
The authors declare that the research was conducted in the absence of any commercial or financial relationships that could be construed as a potential conflict of interest.
Publisher’s Note
All claims expressed in this article are solely those of the authors and do not necessarily represent those of their affiliated organizations, or those of the publisher, the editors and the reviewers. Any product that may be evaluated in this article, or claim that may be made by its manufacturer, is not guaranteed or endorsed by the publisher.
References
AERA, APA, and NCME. (2014). Standards for Educational and Psychological Testing. Washington, DC: American Educational Research Association.
Beaujean, A. A. (2015). John Carroll’s views on intelligence: bi-factor vs. higher-order models. J. Intelligence 3, 121–136. doi: 10.3390/jintelligence3040121
Beaujean, A. A. (2016). Reproducing the Wechsler Intelligence Scale for Children - Fifth Edition: J. Psychoeduc. Assess. 34, 404–408. doi: 10.1177/0734282916642679
Brown, T. A. (2015). Confirmatory Factor Analysis for Applied Research. 2nd Edn. New York, NY: Guilford.
Brunner, M., Nagy, G., and Wilhelm, O. (2012). A tutorial on hierarchically structured constructs. J. Pers. 80, 796–846. doi: 10.1111/j.1467-6494.2011.00749.x
Canivez, G. L. (2014). Construct validity of the WISC-IV with a referred sample: direct vs. indirect structures. Sch. Psychol. Q. 29, 38–51. doi: 10.1037/spq0000032
Canivez, G. L. (2016). “Bifactor modeling in construct validation of multifactored tests: implications for unterstanding multidimensional constructs and test interpretation,” in Principles and Methods of Test Construction: Standards and Recent Advancements. eds. K. Schweizer and C. DiStefano (Göttingen: Hogrefe), 247–271.
Canivez, G. L., Grieder, S., and Buenger, A. (2021). Construct validity of the German Wechsler Intelligence Scale for Children - Fifth Edition: exploratory and confirmatory factor analyses of the 15 primary and secondary subtests. Assessment 28, 327–352. doi: 10.1177/1073191120936330
Canivez, G. L., and Watkins, M. W. (2010). Investigation of the factor structure of the Wechsler adult intelligence scale - fourth edition (WAIS-IV): exploratory and higher order factor analyses. Psychol. Assess. 22, 827–836. doi: 10.1037/a0020429
Canivez, G. L., Watkins, M. W., and Dombrowski, S. C. (2016). Factor structure of the Wechsler Intelligence Scale for Children - Fifth Edition: exploratory factor analyses with the 16 primary and secondary subtests. Psychol. Assess. 28, 975–986. doi: 10.1037/pas0000238
Canivez, G. L., Watkins, M. W., and Dombrowski, S. C. (2017). Structural validity of the Wechsler Intelligence Scale for Children - Fifth Edition: confirmatory factor analyses with the 16 primary and secondary subtests. Psychol. Assess. 29, 458–472. doi: 10.1037/pas0000358
Canivez, G. L., Watkins, M. W., Good, R., James, K., and James, T. (2017). Construct validity of the Wechsler intelligence scale for children-fourth UK edition with a referred Irish sample: Wechsler and Cattell-horn-Carroll model comparisons with 15 subtests. Br. J. Educ. Psychol. 87, 383–407. doi: 10.1111/bjep.12155
Canivez, G. L., Watkins, M. W., and McGill, R. J. (2018). Construct validity of the Wechsler Intelligence Scale for Children - Fifth UK Edition: exploratory and confirmatory factor analyses of the 16 primary and secondary subtests. Br. J. Educ. Psychol. 89, 195–224. doi: 10.1111/bjep.12230
Chen, F. F. (2007). Sensitivity of goodness of fit indexes to lack of measurement invariance. Struct. Equ. Model. 14, 464–504. doi: 10.1080/10705510701301834
Crawford, A. V., Green, S. B., Levy, R., Lo, W.-J., Scott, L., Svetina, D., et al. (2010). Evaluation of parallel analysis methods for determining the number of factors. Educ. Psychol. Meas. 70, 885–901. doi: 10.1177/0013164410379332
Decker, S. L., Bridges, R. M., Luedke, J. C., and Eason, M. J. (2020). Dimensional evolution of cognitive measures: methodological confounds and theoretical concerns. J. Psychoeduc. Assess. 39, 3–27. doi: 10.1177/0734282920940879
Dombrowski, S. C., Canivez, G. L., and Watkins, M. W. (2018). Factor structure of the 10 WISC-V primary subtests across four standardization age groups. Contemp. Sch. Psychol. 22, 90–104. doi: 10.1007/s40688-017-0125-2
Dombrowski, S. C., Canivez, G. L., Watkins, M. W., and Beaujean, A. A. (2015). Exploratory bifactor analysis of the Wechsler Intelligence Scale for Children - Fifth Edition with the 16 primary and secondary subtests. Intelligence 53, 194–201. doi: 10.1016/j.intell.2015.10.009
Dunn, T. J., Baguley, T., and Brunsden, V. (2014). From alpha to omega: a practical solution to the pervasive problem of internal consistency estimation. Br. J. Psychol. 105, 399–412. doi: 10.1111/bjop.12046
Evers, A., Hagemeister, C., Høstmaelingen, A., Lindley, P., Muñiz, J., and Sjöberg, A. (2013). EFPA Review Model for the Description and Evaluation of Psychological and Educational Tests. Brussels, Belgium: European Federation of Psychologists’ Associations.
Fenollar-Cortés, J., and Watkins, M. W. (2018). Construct validity of the Spanish version of the Wechsler Intelligence Scale for Children - Fifth Edition (WISC-VSpain). Int. J. Sch. Educ. Psychol. 7, 150–164. doi: 10.1080/21683603.2017.1414006
Frisby, C. L., and Beaujean, A. A. (2015). Testing Spearman’s hypotheses using a bi-factor model with WAIS–IV/WMS–IV standardization data. Intelligence 51, 79–97. doi: 10.1016/j.intell.2015.04.007
Gignac, G. E. (2008). Higher-order models versus direct hierarchical models: g as a superordinate or breadth factor? Psychol. Sci. Q. 50, 21–43.
Gignac, G. E., and Watkins, M. W. (2013). Bifactor modeling and the estimation of model-based reliability in the WAIS-IV. Multivar. Behav. Res. 48, 639–662. doi: 10.1080/00273171.2013.804398
Golay, P., and Lecerf, T. (2011). Orthogonal higher order structure and confirmatory factor analysis of the French Wechsler adult intelligence scale (WAIS–III). Psychol. Assess. 23, 143–152. doi: 10.1037/a0021230
Hancock, G. R., and Mueller, R. O. (2001). “Rethinking construct reliability within latent variable systems,” in Structural Equation Modeling: Present and Future. eds. R. Cudeck, S. Toit Du, and D. Sorbom (Lincolnwood, IL: Scientific Software International), 195–216.
Hu, L., and Bentler, P. M. (1999). Cutoff criteria for fit indexes in covariance structure analysis: conventional criteria versus new alternatives. Struct. Equ. Model. 6, 1–55. doi: 10.1080/10705519909540118
International Test Commission (ITC) (2017). The ITC guidelines for translating and adapting tests 2nd Edn. Version 2.4. Available at: https://www.intestcom.org (Accessed April 11, 2021).
Kaiser, H. F. (1974). An index of factorial simplicity. Psychometrika 39, 31–36. doi: 10.1007/BF02291575
Kaplan, D. (2000). Structural Equation Modeling: Foundations and Extensions. Thousand Oaks, CA: Sage.
Keith, T. Z. (2015). Multiple Regression and beyond: An Introduction to Multiple Regression and Structure Equation Modeling. 2nd Edn. NY: Routledge.
Keith, T. Z., Fine, J. G., Taub, G. E., Reynolds, M. R., and Kanzler, J. H. (2006). Higher order, multisample, confirmatory factor analysis of the Wechsler intelligence scale for children-fourth edition: what does it measure? Sch. Psychol. Rev. 35, 108–127. doi: 10.1080/02796015.2006.12088005
Keith, T. Z., and Reynolds, M. R. (2018). “Using confirmatory factor analysis to aid in understanding the constructs measured by intelligence tests,” in Contemporary Intellectual Assessment: Theories, Tests, and Issues. 4th Edn. eds. D. P. Flanagan and P. L. Harrison (New York: Guilford), 853–900.
Kline, R. B. (2016). Principles and Practice of Structural Equation Modeling. 4rd Edn. New York, NY: Guilford.
Lecerf, T., and Canivez, G. L. (2018). Complementary exploratory and confirmatory factor analyses of the French WISC-V: analyses based on the standardization sample. Psychol. Assess. 30, 793–808. doi: 10.1037/pas0000526
Little, T. D., Lindenberger, U., and Nesselroade, J. R. (1999). On selecting indicators formultivariate measurement and modeling with latent variables: when “good” indicators are bad and “bad” indicators are good. Psychol. Methods 4, 192–211. doi: 10.1037/1082-989X.4.2.192
MacCallum, R. C., Browne, M. W., and Sugawara, H. M. (1996). Power analysis and determination of sample size for covariance structure modeling. Psychol. Methods 1, 130–149. doi: 10.1037/1082-989X.1.2.130
Mansolf, M., and Reise, S. P. (2017). When and why the second-order and bifactor models are distinguishable. Intelligence 61, 120–129. doi: 10.1016/j.intell.2017.01.012
Markon, K. E. (2019). Bifactor and hierarchical models: specification, inference, and interpretation. Annu. Rev. Clin. Psychol. 15, 51–69. doi: 10.1146/annurev-clinpsy-050718-095522
McDonald, R. P. (2010). Structural models and the art of approximation. Perspect. Psychol. Sci. 5, 675–686. doi: 10.1177/1745691610388766
McGill, R. J., Ward, T. J., and Canivez, G. L. (2020). Use of translated and adapted versions of the WISC-V: caveat emptor. Sch. Psychol. Int. 41, 276–294. doi: 10.1177/0143034320903790
McGrew, J. (2009). CHC theory and the human cognitive abilities project: standing on the shoulders of the giants of psychometric intelligence research. Intelligence 37, 1–10. doi: 10.1016/j.intell.2008.08.004
Murray, A. L., and Johnson, W. (2013). The limitations of model fit in comparing bi-factor versus higher-order models of human cognitive ability structure. Intelligence 41, 407–422. doi: 10.1016/j.intell.2013.06.004
Nevitt, J., and Hancock, G. R. (2001). Performance of bootstrapping approaches to model test statistics and parameter standard error estimation in structural equation modeling. Struct. Equ. Model. 8, 353–377. doi: 10.1207/S15328007SEM0803_2
Pauls, F., Daseking, M., and Petermann, F. (2019). Measurement invariance across gender on the second-order five-factor model of the German Wechsler Intelligence Scale for Children - Fifth Edition. Assessment. doi: 10.1177/1073191119847762
Reise, S. P. (2012). The rediscovery of bifactor measurement models. Multivar. Behav. Res. 47, 667–696. doi: 10.1080/00273171.2012.715555
Reise, S. P., Bonifay, W. E., and Haviland, M. G. (2013). Scoring and modeling psychological measures in the presence of multidimensionality. J. Pers. Assess. 95, 129–140. doi: 10.1080/00223891.2012.725437
Reynolds, M. R., and Keith, T. Z. (2017). Multi-group and hierarchical confirmatory factor analysis of the Wechsler Intelligence Scale for Children - Fifth Edition: what does it measure? Intelligence 62, 31–47. doi: 10.1016/j.intell.2017.02.005
Rodriguez, A., Reise, S. P., and Haviland, M. G. (2016). Evaluating bifactor models: calculating and interpreting statistical indices. Psychol. Methods 21, 137–150. doi: 10.1037/met0000045
Schmid, J., and Leiman, J. M. (1957). The development of hierarchical factor solutions. Psychometrika 22, 53–61. doi: 10.1007/BF02289209
Schneider, W. J., and McGrew, K. S. (2012). “The Cattell-horn-Carroll model of intelligence” in Contemporary Intellectual Assessment: Theories, Tests, and Issues. 3rd Edn. eds. D. P. Flanagan and P. L. Harrison (New York: Guilford), 99–144.
Watkins, M. W. (2000). Monte Carlo PCA for Parallel Analysis [Computer Software]. State College, PA: Author.
Watkins, M. W. (2010). Structure of the Wechsler intelligence scale for children - fourth edition among a national sample of referred students. Psychol. Assess. 22, 782–787. doi: 10.1037/a0020043
Watkins, M. W. (2017). The reliability of multidimensional neuropsychological measures: From alpha to omega. Clin. Neuropsychol. 31, 1113–1126. doi: 10.1080/13854046.2017.1317364
Watkins, M. W., and Beaujean, A. A. (2014). Bifactor structure of the Wechsler preschool and primary scale of intelligence - fourth edition. Sch. Psychol. Q. 29, 52–63. doi: 10.1037/spq0000038
Watkins, M. W., Dombrowski, S. C., and Canivez, G. L. (2017). Reliability and factorial validity of the Canadian Wechsler Intelligence Scale for Children - Fifth Edition. Int. J. Sch. Educ. Psychol. 6, 252–265. doi: 10.1080/21683603.2017.1342580
Wechsler, D. (2003). Wechsler Intelligence Scale for Children. 4th Edn. San Antonio, TX: Psychological Corporation.
Wechsler, D. (2009). Wechsler Memory Scale – Fourth Edition. Manual. San Antonio, TX: Pearson Assessment.
Wechsler, D. (2014a). Wechsler Intelligence Scale for Children. 5th Edn. San Antonio, TX: NCS Pearson.
Wechsler, D. (2014b). Wechsler Intelligence Scale for Children - Fifth Edition technical and interpretive manual. San Antonio, TX: NCS Pearson.
Wechsler, D. (2017a). Wechsler Intelligence Scale for Children – Fifth Edition (WISC-V). Durchführungs- und Auswertungsmanual. Deutsche Fassung von F. Petermann Frankfurt a. M.: Pearson.
Wechsler, D. (2017b). Wechsler Intelligence Scale for Children – Fifth Edition (WISC-V). Technisches Manual. Deutsche Fassung von F. Petermann. Frankfurt a. M.: Pearson.
Weiss, L. G., Keith, T., Zhu, J., and Chen, H. (2013). WISC-IV and clinical validation of the four- and five-factor interpretative approaches. J. Psychoeduc. Assess. 31, 114–131. doi: 10.1177/0734282913478032
West, S. G., Finch, J. P., and Curran, P. J. (1995). “Structural equation models with nonnormal variables,” in Structural Equation Modeling: Concepts, Issues, and Applications. ed. R. H. Hoyle (Thousand Oaks, CA: Sage)
Wood, J. M., Tataryn, D. J., and Gorsuch, R. L. (1996). Effects of under- and over-extraction on principal axis factor analysis with varimax rotation. Psychol. Methods 1, 354–365. doi: 10.1037/1082-989X.1.4.354
Yang, Y., and Green, S. B. (2011). Coefficient alpha: a reliability coefficient for the 21st century? J. Psychoeduc. Assess. 29, 377–392. doi: 10.1177/0734282911406668
Keywords: intelligence assessment, structural validity, exploratory factor analysis, confirmatory factor analysis, clinical interpretability, German Wechsler Intelligence Scale for Children - Fifth Edition
Citation: Pauls F and Daseking M (2021) Revisiting the Factor Structure of the German WISC-V for Clinical Interpretability: An Exploratory and Confirmatory Approach on the 10 Primary Subtests. Front. Psychol. 12:710929. doi: 10.3389/fpsyg.2021.710929
Edited by:
Mengcheng Wang, Guangzhou University, ChinaReviewed by:
Javier Fenollar Cortés, Loyola University Andalusia, SpainKarl Schweizer, Goethe University Frankfurt, Germany
Copyright © 2021 Pauls and Daseking. This is an open-access article distributed under the terms of the Creative Commons Attribution License (CC BY). The use, distribution or reproduction in other forums is permitted, provided the original author(s) and the copyright owner(s) are credited and that the original publication in this journal is cited, in accordance with accepted academic practice. No use, distribution or reproduction is permitted which does not comply with these terms.
*Correspondence: Franz Pauls, paulsf@hsu-hh.de