 Daxun Wang
 Dongbo Tu
- School of Psychology, Jiangxi Normal University, Nanchang, China
Most existing instruments for depression are developed based on classical test theory, factor analysis, or sometimes, item response theory, and focus on the accurate measurement of the severity of depressive disorder. Nevertheless, they tend to be less useful in supporting the decision based on ICD-10 or DSM-5 because of the lack of detailed information for symptoms. To gain rich and valid information at the symptom level, this article developed a depression test under the framework of cognitive diagnosis models (CDMs), referred to as CDMs-D. A total of 1,181 individuals were finally recruited and their responses were used to examine the psychometric properties of CDMs-D. After excluding poor items for statistical reasons (e.g., low discrimination, poor model-fit or having DIF), 56 items were included in the CDMs-D. The CDMs-D measures all ten symptom criteria for depression defined in ICD-10 and covers five domains of depression defined by Gibbons et al. (2012). Comparing with the existing self-report measures (such as PHQ-9, SDS, CES-D and so on), a distinguishing feature of the CDMs-D is that it can provide both overall information about the severity of depressive disorder and the assessment information about specific symptoms, which could be useful for diagnostic and interventional purposes.
Introduction
Depression is one of the most common and prevalent psychological and behavioral disorders. By the year 2020, depression accounting for 5.7% of the total burden of the disease (Dennis et al., 2016) will be the second disease leading to disability and death with the exception of coronary heart disease according to the World Health Organization (Dennis and Hodnett, 2014). A number of self-report inventories have been developed to assess the severity of the depressive disorder, such as the Self-Rating Depression Scale (SDS; Zung, 1965), the Center for Epidemiologic Studies Depression Scale (CES-D; Radloff, 1977) and the Beck Depression Inventory (BDI; Beck et al., 1961).
Despite having sound psychometric properties and being widely used, they are also some rooms for improvement. For example, most existing self-report inventories are unidimensional and yield overall scores indicating the severity of the depressive disorder on a continuum. To determine whether it is a mild, moderate or severe depression, the scores are compared with some cutoffs. This procedure is straightforward, but it is not informative given that they cannot provide all symptom-level information of depression defined in the 10th revision of the International Classification of Diseases (ICD-10; World Health Organization [WHO], 2010) or the 5th edition of the Diagnostic and Statistical Manual of Mental Disorders (DSM-5; American Psychiatric Association [APA], 2013). However, these symptom-level information of depression are helpful for assessment, screening, monitoring and even intervention of depression. For example, as shown in Table 1, the ICD-10 groups the symptoms of depression into two sets: typical symptoms and common symptoms and its diagnostic thresholds are specified in terms of the number of symptoms required from each of the two sets. More specially, for the mild depressive episode, two typical symptoms and two common symptoms are required; for the moderate depressive episode, two typical symptoms and at least three common symptoms are required; for the severe depressive episode, all three typical symptoms are present and at least four common symptoms of severe intensity are required. As known, this type assess for depression is more informative than the score cutoffs of conventional inventories given that the patients with the same score may have very different symptoms which can provide more information for screening or treatment.
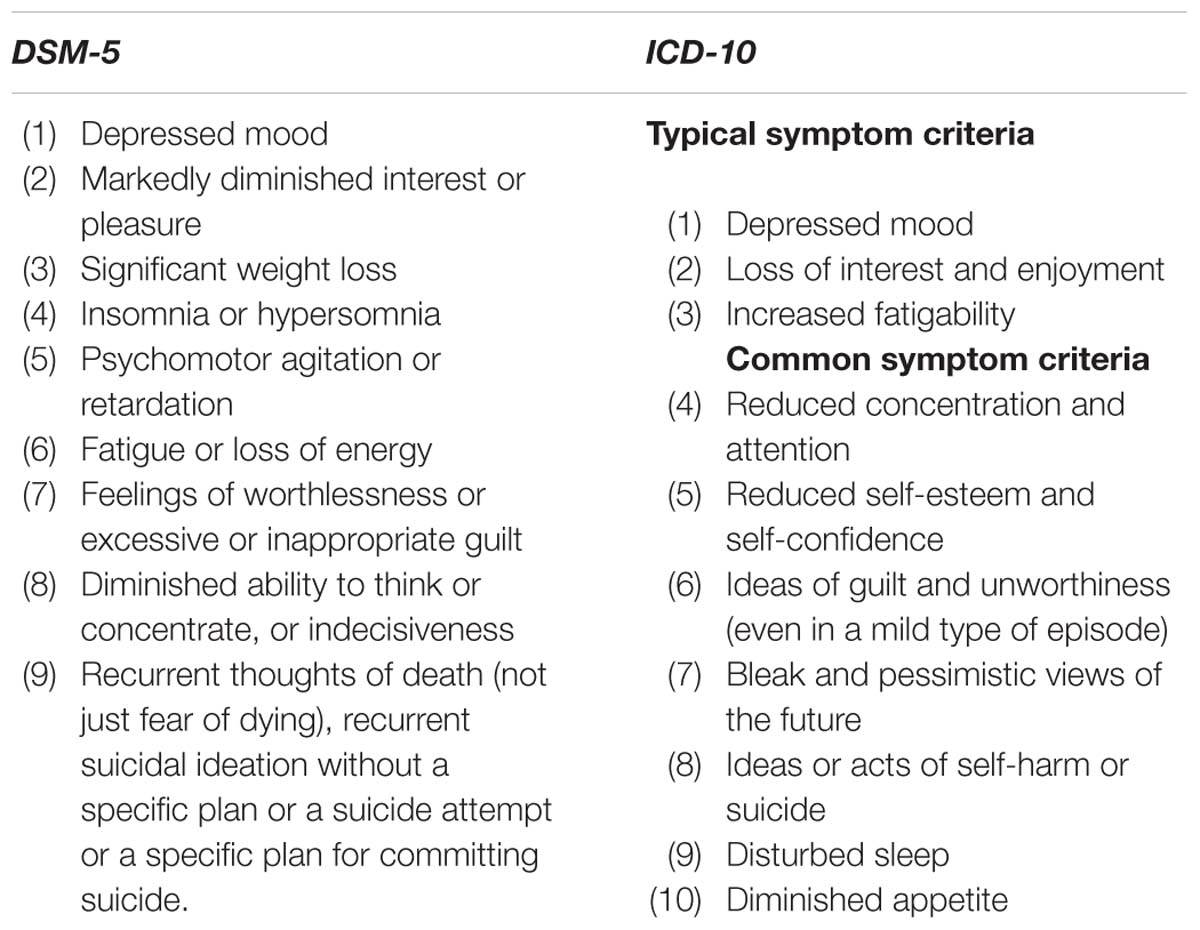
Table 1. Symptom criteria for depression defined in the DSM-5 and ICD-10.
Form a very different perspective, this study aims to develop a new measure of depression that is aligned with the ICD-10 to provide more information for the screening and monitoring of depression under the framework of cognitive diagnosis models (CDMs; see Rupp et al., 2010). Compared with the factor analysis technique or item response theory (IRT), the CDMs provide an alternative psychometric framework for test development, psychometric analyses, and score reporting. Although most of research on CDMs lies in the field of education measurement, researchers have been recently aware of their usefulness in psychological disorder assess for identifying individuals’ disorder or symptom profiles (e.g., Jaeger et al., 2006; Templin and Henson, 2006; de la Torre et al., 2017). Specifically, it is possible to infer about whether each of the symptom criteria has been satisfied or not from patients’ responses to items in an instrument. This information can be useful for screening (or intervening) depressive disorder or other psychological disorders based on the ICD-10 or DSM-5. In addition, compared with factor analysis, CDMs allow latent variables (i.e., symptom criteria) to interact when producing manifest item responses and thus are more flexible.
In specially, the goal of this study is twofold. First, this study develops a depression test under the framework of CDMs (CDMs-D) based on the ICD-10 under the CDMs framework, which may be used to assess, screen and monitor depression. Different from the existing self-report questionnaires for depression, the CDMs-D can assess how likely each of the symptom criteria of depression in the ICD-10 has been met for each patient, and estimate the probability of having mild, moderate and severe depressive episode using the ICD-10 diagnostic criteria. Second, this study aims to provide an illustration about how CDMs can be used to develop instruments, assess psychometric properties using the ICD-10 system. This could serve as an example for researchers willing to develop instruments for other psychological disorders using CDMs to provide patient outcomes consistent with ICD-10 or DSM-5 criteria.
Materials and Methods
Diagnosis System of Depression
Currently, two famous diagnosis systems of depression are ICD-10 and DSM-5, which are both commonly acceptable and used to guide the diagnosis of depression in clinical practice. There are eight common symptom criteria of depressive disorder in ICD-10 and DSM-5 (see Table 1). In this article, the symptom criteria for depression in the ICD-10 were used in that the ICD-10 distinguishes three types of depression (mild, moderate or severe/major depression) and thus could provide more information.
Cognitive Diagnosis Models
In the context of CDMs, 10 symptom criteria of depression in ICD-10 are treated as latent variables that need to be measured, each with two outcomes – 1 and 0, representing presence and absence, respectively. Based on individuals’ responses to items of the CDMs-D and the aforementioned item and symptom association matrix, CDMs estimate the symptom profile for each individual. For example, if the symptom profile for an individual is estimated to be (0,1,1,0,0,0,1,1,0,0), this individual is said to meet symptom criteria 2, 3, 7, and 8. In addition, CDMs can also estimate the probability of an individual meets each criterion.
An array of CDMs can be found in the literature (Rupp et al., 2010). In this study we adopt the generalized deterministic input, noisy, “and” gate (G-DINA; de la Torre, 2011) model framework because (1) it is one of the most general CDMs with many applications and (2) it is very flexible and subsumes many reduced CDMs. The G-DINA model, like most other CDMs, is a psychometric model specifying how individuals respond to each item given their symptom criteria. Take item “I feel worthless and ashamed” as an example, which measures (C5) “reduced self-esteem and self-confidence” and (C6) “ideas of guilt and unworthiness.”
Let α = (α1,α2) denote the profile of these two criteria. Based on the G-DINA model (de la Torre, 2011), the probability of endorsement on this item given the symptom profile α can be written by P(α) = ϕ0 + ϕ1α1 + ϕ2α2 + ϕ12α1α2. More specifically, for α = (0,0), where both symptoms are absent, the corresponding endorsement probability isP(0,0) = ϕ0; for α = (1,0), where symptom C5 is present but C6 is absent, the corresponding endorsement probability is P(1,0) = ϕ0 + ϕ1, where ϕ1 is the effect of symptom C5; for α = (0,1), where symptom C5 is absent but C6 is present, the corresponding endorsement probability is P(0,1) = ϕ0 + ϕ2, where ϕ2 is the effect of symptom C6; and for α = (1,1), where both symptoms are present, the corresponding endorsement probability is P(1,1) = ϕ0 + ϕ1 + ϕ2 + ϕ12, where ϕ12 is the interaction effect of symptoms C5 and C6.
Although the G-DINA model considers all possible interactions among measured symptom criteria, researchers may have some assumptions about how symptom criteria produce item responses. For example, the deterministic inputs, noisy “and” gate (DINA) model assumes that the endorsement probability will not increase unless all measured symptom criteria have been present. This model can be obtained, for the aforementioned example, by setting ϕ1 = ϕ2 = 0 such that P(0,0) = P(1,0) = P(0,1) = ϕ0 and P(1,1) = ϕ0 + ϕ12. In contrast, the deterministic inputs, noisy “or” gate (DINO; Templin and Henson, 2006) model assumes that a high endorsement probability is expected if any of the measured symptom criteria is present. This model can be obtained by setting ϕ1 = ϕ2 = −ϕ12 such that P(0,0) = ϕ0 and P(1,0) = P(0,1) = P(1,1) = ϕ0 + ϕ1. In addition, the addictive CDM (A-CDM; de la Torre, 2011), linear logistic model (LLM; Maris, 1999) and reduced reparameterized unified model (rRUM; Hartz et al., 2002) can be obtained by assuming all symptom criteria contribute independently and uniquely without interaction effects. For more details on these models, please refer to de la Torre (2011).
Development of Cognitive Diagnostic Test for Depression (CDMs-D)
The CDMs-D is designed to be a self-report instrument and the ultimate goal is to infer whether an individual has satisfied each of the symptom criteria of depression defined in the ICD-10 and the probability of having mild, moderate and severe depressive episode from his or her responses. The CDMs-D primitively included 89 items which were carefully chosen according to the depression symptom criteria in the ICD-10 from several self-rating inventories, including the Zung’s SDS, the CES-D (Radloff, 1977), the Patient Health Questionnaire (PHQ-9; Kroenke et al., 2001), the Hospital Anxiety Depression Scale (HADS), Carroll’s Depression Scale (CDS; Carroll et al., 1981), Minnesota Multiphasic Personality Inventory (MMPI; Hathaway and McKinley, 1942), the Brief Depression Scale (BDS; Koenig et al., 1992), the Geriatric Depression Scale (GDS), the Edinburgh postnatal depression Scale (EPDS; Cox et al., 1987) and the Adolescents Depression Emotion Self-assessment Scale (ADESC; Huang et al., 2004). The chosen 89 items measure all ten depression symptom criteria in ICD-10 and involve five domains of depression defined by Gibbons et al. (2012), namely, mood (14 items), cognition (30 items), behavior (21 items), somatic complaints (17 items) and ideas or acts of suicidality (7 items). Items were revised to refer to the previous 2-week period and to have consistent response categories. Each item measures at least one depression symptom criterion in ICD-10.
The way of an individual responding to an item can be reasonably assumed to be influenced by whether she/he has satisfied some symptom criteria. For example, an individual may agree with that “I feel worthless and ashamed” if she/he has “reduced self-esteem and self-confidence” (C5) or “ideas of guilt and unworthiness” (C6) and agree with that “I wish to be dead” if she has “ideas or acts of self-harm or suicide” (C8). To make inference as to whether individuals have satisfied each symptom criterion from their item responses, an item by symptom association matrix giving which symptom criteria may influence individuals’ item responses needs to be developed in advance. For CDMs-D, the item and symptom association matrix was constructed using the Delphi method with three experts (two psychotherapists with more than 5 years of clinical experience and one with 5-year research experience in the measurement of depression). Table 2 gives some exemplary items and their association with symptom criteria, where entry 1 indicates a symptom criterion is measured by the item and entry 0 indicates not. On average, each item measures 1.67 symptom criteria, and each criterion is measured by 14.9 items.
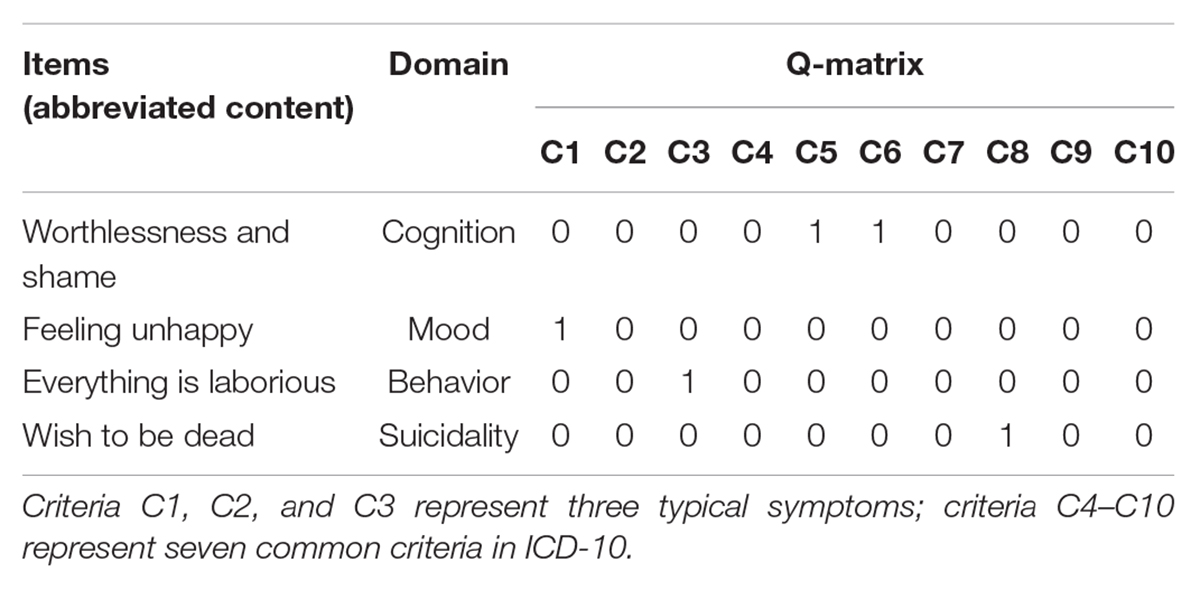
Table 2. Exemplary items in CDMs-D.
Participant Sample
Participants include healthy individuals and patients with depression. Depressive patients, who were being treated for depression, were recruited from eight health centers and hospitals in seven provinces/cities of China, whereas the healthy individuals were mainly from colleges and social groups. The selected seven provinces/cities distribute in east, south, west, and north area of China and covers mainly area of China. The final selection of both depressive patients and healthy individuals were recruited according to the following exclusion criteria: history of psychosis, schizoaffective disorder, or schizophrenia; organic neuropsychiatric syndrome, such as dementia and Parkinson disease; drug or alcohol dependence over the past 3 months, but not excluded patients with episodic abuse related to mood episodes. The study also had exclusion criteria to screen the healthy individuals: history of psychosis, schizoaffective disorder, or schizophrenia; any diagnosis or treatment for psychiatric illness over the past year. The study was approved by the medical ethics committees of participating health center and hospitals, and all participants were provided written informed consent.
A total of 1,286 samples were recruited, among which 92 samples had large missing data in the questionnaire and 13 samples met the exclusion criteria. After excluding the above 105 samples, the final selected participant sample was consisted of 1,181 individuals aged from 18 to 80 with mean = 31.8 (SD = 12.92) based on the above exclusion criteria for this study. The number of depressive patients and healthy individuals were 488 (41.3%) aged from 18 to 80 with mean = 36.8 (SD = 14.9), and 693 (58.7%) aged from 18 to 57 with mean = 28.36 (SD = 10.03), respectively.
The total sample was randomly split into two subsamples. One of the resulting two subsamples was half of the overall sample and used as a calibration sample (N1 = 591) to develop the CDMs-D. The other half sample was used as the cross validation sample (N2 = 590) to verify the CDMs-D and investigate the reliability and validity of CDMs-D. Detailed demographic information was documented in Table 3.
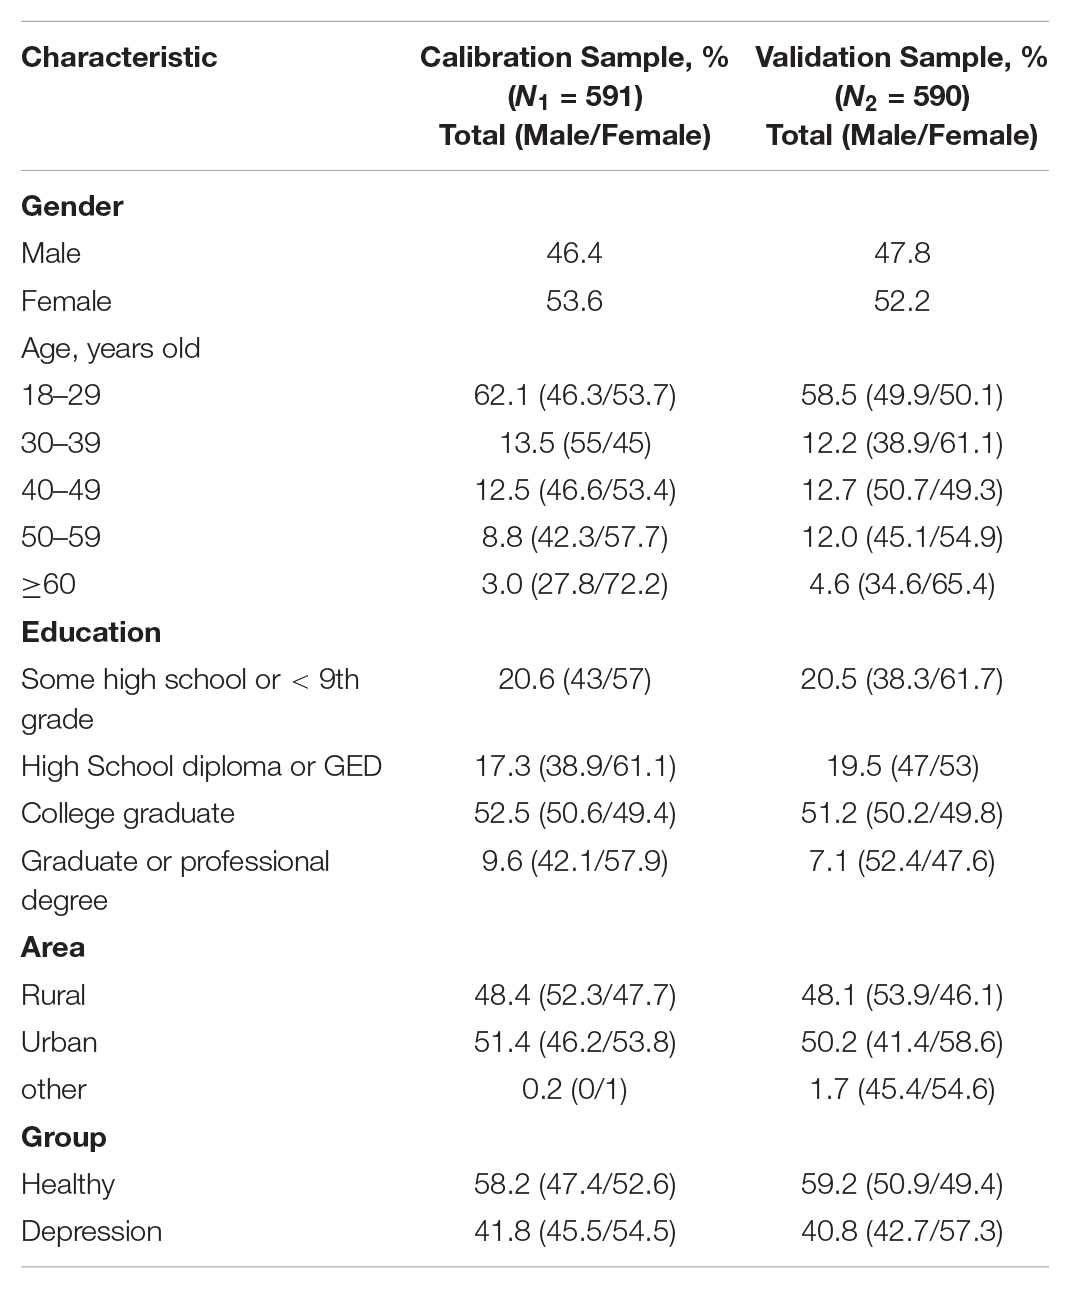
Table 3. Demographic characteristics of depressive disorder patients and healthy individuals.
Statistical Analysis
The calibration sample (N1 = 591) was used in this step to develop the CDMs-D.
Item Analysis
Selecting suitable CDM is deemed to be a critical procedure for making valid inferences. Although a number of CDMs are available, it’s not always clear which model should be chosen for a given data set. The Wald test (de la Torre, 2011; Ma et al., 2016) was proposed to evaluate whether the reduced CDM can be replaced by the saturated CDM without significant loss in model-fit (de la Torre, 2011), and the results of Ma et al. (2016) indicated that the chosen CDMs via the Wald test performed better than the saturated CDM in terms of estimation of person parameter. In this study five special or reduced CDMs were considered, which were the deterministic inputs, noisy “and” gate model (DINA; Junker and Sijtsma, 2001), the deterministic input, noisy “or” gate model (DINO; Templin and Henson, 2006), the addictive CDM (A-CDM; de la Torre, 2011), the linear logistic model (LLM; Maris, 1999) and the reduced reparameterized unified model (RRUM; Hartz et al., 2002). The Wald test was carried out for items measuring more than one criterion in that all CDMs are equivalent for single criterion items.
After choosing the suitable model for each item, the S-X2 item fit statistic (Orlando and Thissen, 2000) was used to assess the adequacy of item fit, followed by the detection of the differential item functioning (DIF) for different groups (e.g., female and male, rural and urban) using the Wald statistic (Hou et al., 2014). Then, the discrimination index (Disc) suggested by de la Torre (2008) was calculated to assess item quality. The above statistical analyses were conducted step by step.
In Step 1, the item fit analysis was carried out via S-X2 item fit statistic and items with poor fit (p-value of S-X2 less than 0.01) were deleted from the CDMs-D. In Step 2, for the remainder items in Step 1, DIF analysis was employed and items with DIF were excluded from the CDMs-D. In Step 3, for the remainder items in Step 2, we assessed item discrimination and items with low discrimination (Disc < 0.4) were deleted. That is to say, any item that had low discrimination (Disc < 0.4), had DIF or fitted to the data inadequately was removed from the CDMs-D. This procedure (three steps) was repeated until no item was deleted. The GDINA R package (Ma and de la Torre, 2016) and Custom-written code in R (R Core Team, 2016) were used for analyses.
Then the cross validation sample (N2 = 590) was used to re-analyze and validate the remained items selected by the calibration sample (N1 = 591). At this step the items that had low discrimination, DIF or poor item fit would be also deleted form the final CDT-T.
Reliability and Validity
The analysis of both the reliability and validity were carried out for the final CTD-D after above item analysis and item selection only with the cross validation sample (N2 = 590). Under the framework of cognitive diagnosis, the symptom-level classification consistency and accuracy indices (Cui et al., 2012; Templin and Bradshaw, 2013) based on CDMs were investigated for CDMs-D. Criterion-related and convergent validity were then assessed by the coefficients of correlation between the CDMs-D and the SDS and individual’s self-reported depression and the. Content validity was examined as well in terms of whether the CDMs-D measures all the depression symptoms defined in ICD-10 and covers all the domains of depression defined by Gibbons et al. (2012).
Depression Assessment
The posterior probability of satisfying symptom criterion k for individual i can be calculated as in
where P(αw|Xi) is the posterior probability of having symptom profile αw for individuali. Based on the posterior probability of satisfying each symptom criterion, we can calculate the probability of having each symptom criteria profile and the probability of being considered as mild, moderate or severe depression.
Results
Item Analysis of the CDMs-D
Using the aforementioned item analysis procedure, 31 items were deleted with the calibration sample (N1 = 591). Specifically, 20 of them had low discrimination index (Disc < 0.4), 5 were DIF items and 10 showed poor item-fit (p < 0.01). After that, the remained 58 items were analyzed with the cross validation sample (N1 = 590). Results showed that 56 items had high discrimination, good item-fit and no DIF except two items with low item fit. Therefore, the final CDMs-D had 56 items, which are given in Table 4. The CDMs-D measures all ten symptom criteria for depression defined in the ICD-10 and involves five domains of depression which are mood (7 items), cognition (23 items), behavior (10 items), somatic complaints (9 items) and ideas or acts of suicidality (7 items). The number of items measuring each symptom criteria varies from 4 to 22 with an average of 10.4. In addition, there are 17, 31, 7, and 1 item (s) measuring 1, 2, 3, and 4 symptom criteria respectively with an average of 1.85 symptom criteria per item.
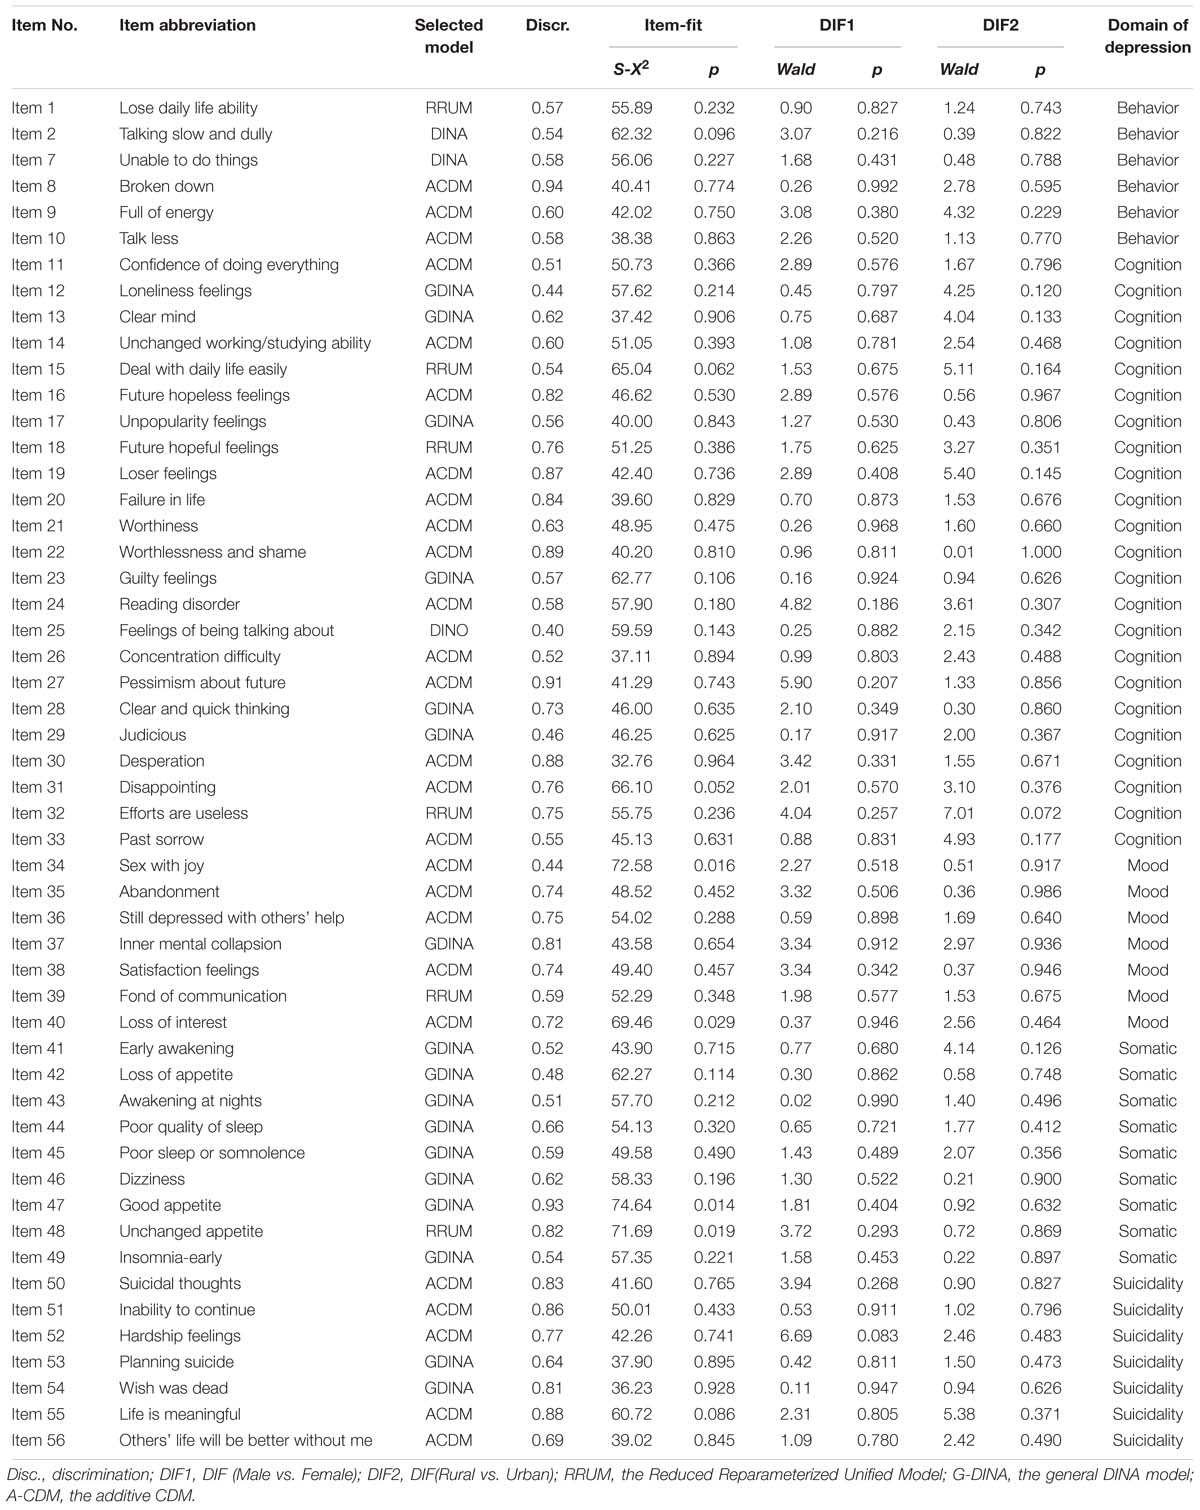
Table 4. Final items of the CDMs-D.
Reliability and Validity
Classification consistency refers to the extent to which participant classifications agree between two independent administrations, which is also called the reliability of classifications (Cui et al., 2012). As shown in Table 5, all attributes have classification consistency greater than 0.95 which suggests the CDMs-D has high reliability of classifications. In addition, classification accuracy refers to the extent to which the participants’ classifications agree with their true latent classes (Cui et al., 2012). Table 5 showed that the CDMs-D had high probability of classifying participants accurately based on their observed responses since all attributes have classification accuracy greater than 0.94.
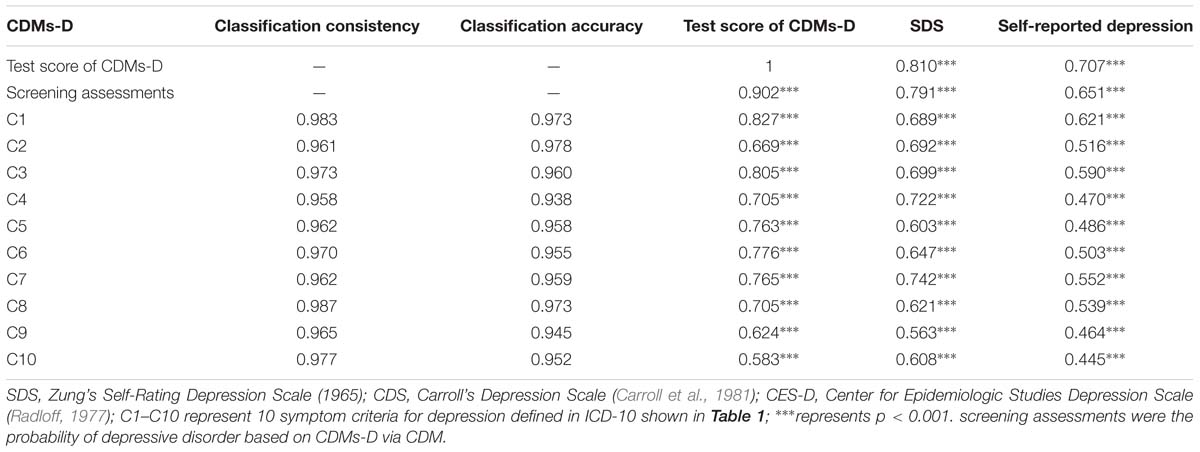
Table 5. The reliability and validity of the CDMs-D.
From Table 4, the CDMs-D measures all depression symptoms defined in ICD-10 and cover all five domains of depression defined by Gibbons et al. (2012), which implies that it has appropriate content validity. As for the criterion-related and convergent validity, the CDMs-D has a correlation of 0.707 (p < 0.001) and 0.810 (p < 0.001) with self-reported depression and SDS, respectively. The estimated probability of having mild, moderate or severe depression has a correlation of 0.791 (p < 0.001) and 0.651 (p < 0.001) with SDS and self-reported depression, respectively. Moreover, we calculated the coefficient of classification consistency between the CDMs-D and the structured clinical interview by psychotherapists via ICD-10, and results showed that there had a moderate coefficient of classification consistency with 0.463 (p < 0.001) between them. Figures 1, 2 show the 95% confidence intervals (CIs) for the mean CDMs-D score and the mean probability of having depressive disorder, respectively, for individuals with or without depression defined by the SDS or self-reported depression. Different groups have quite different mean CDMs-D scores and mean probabilities of depressive disorder, suggesting that the CDMs-D has the power to discriminate individuals with depression at different levels of severity.
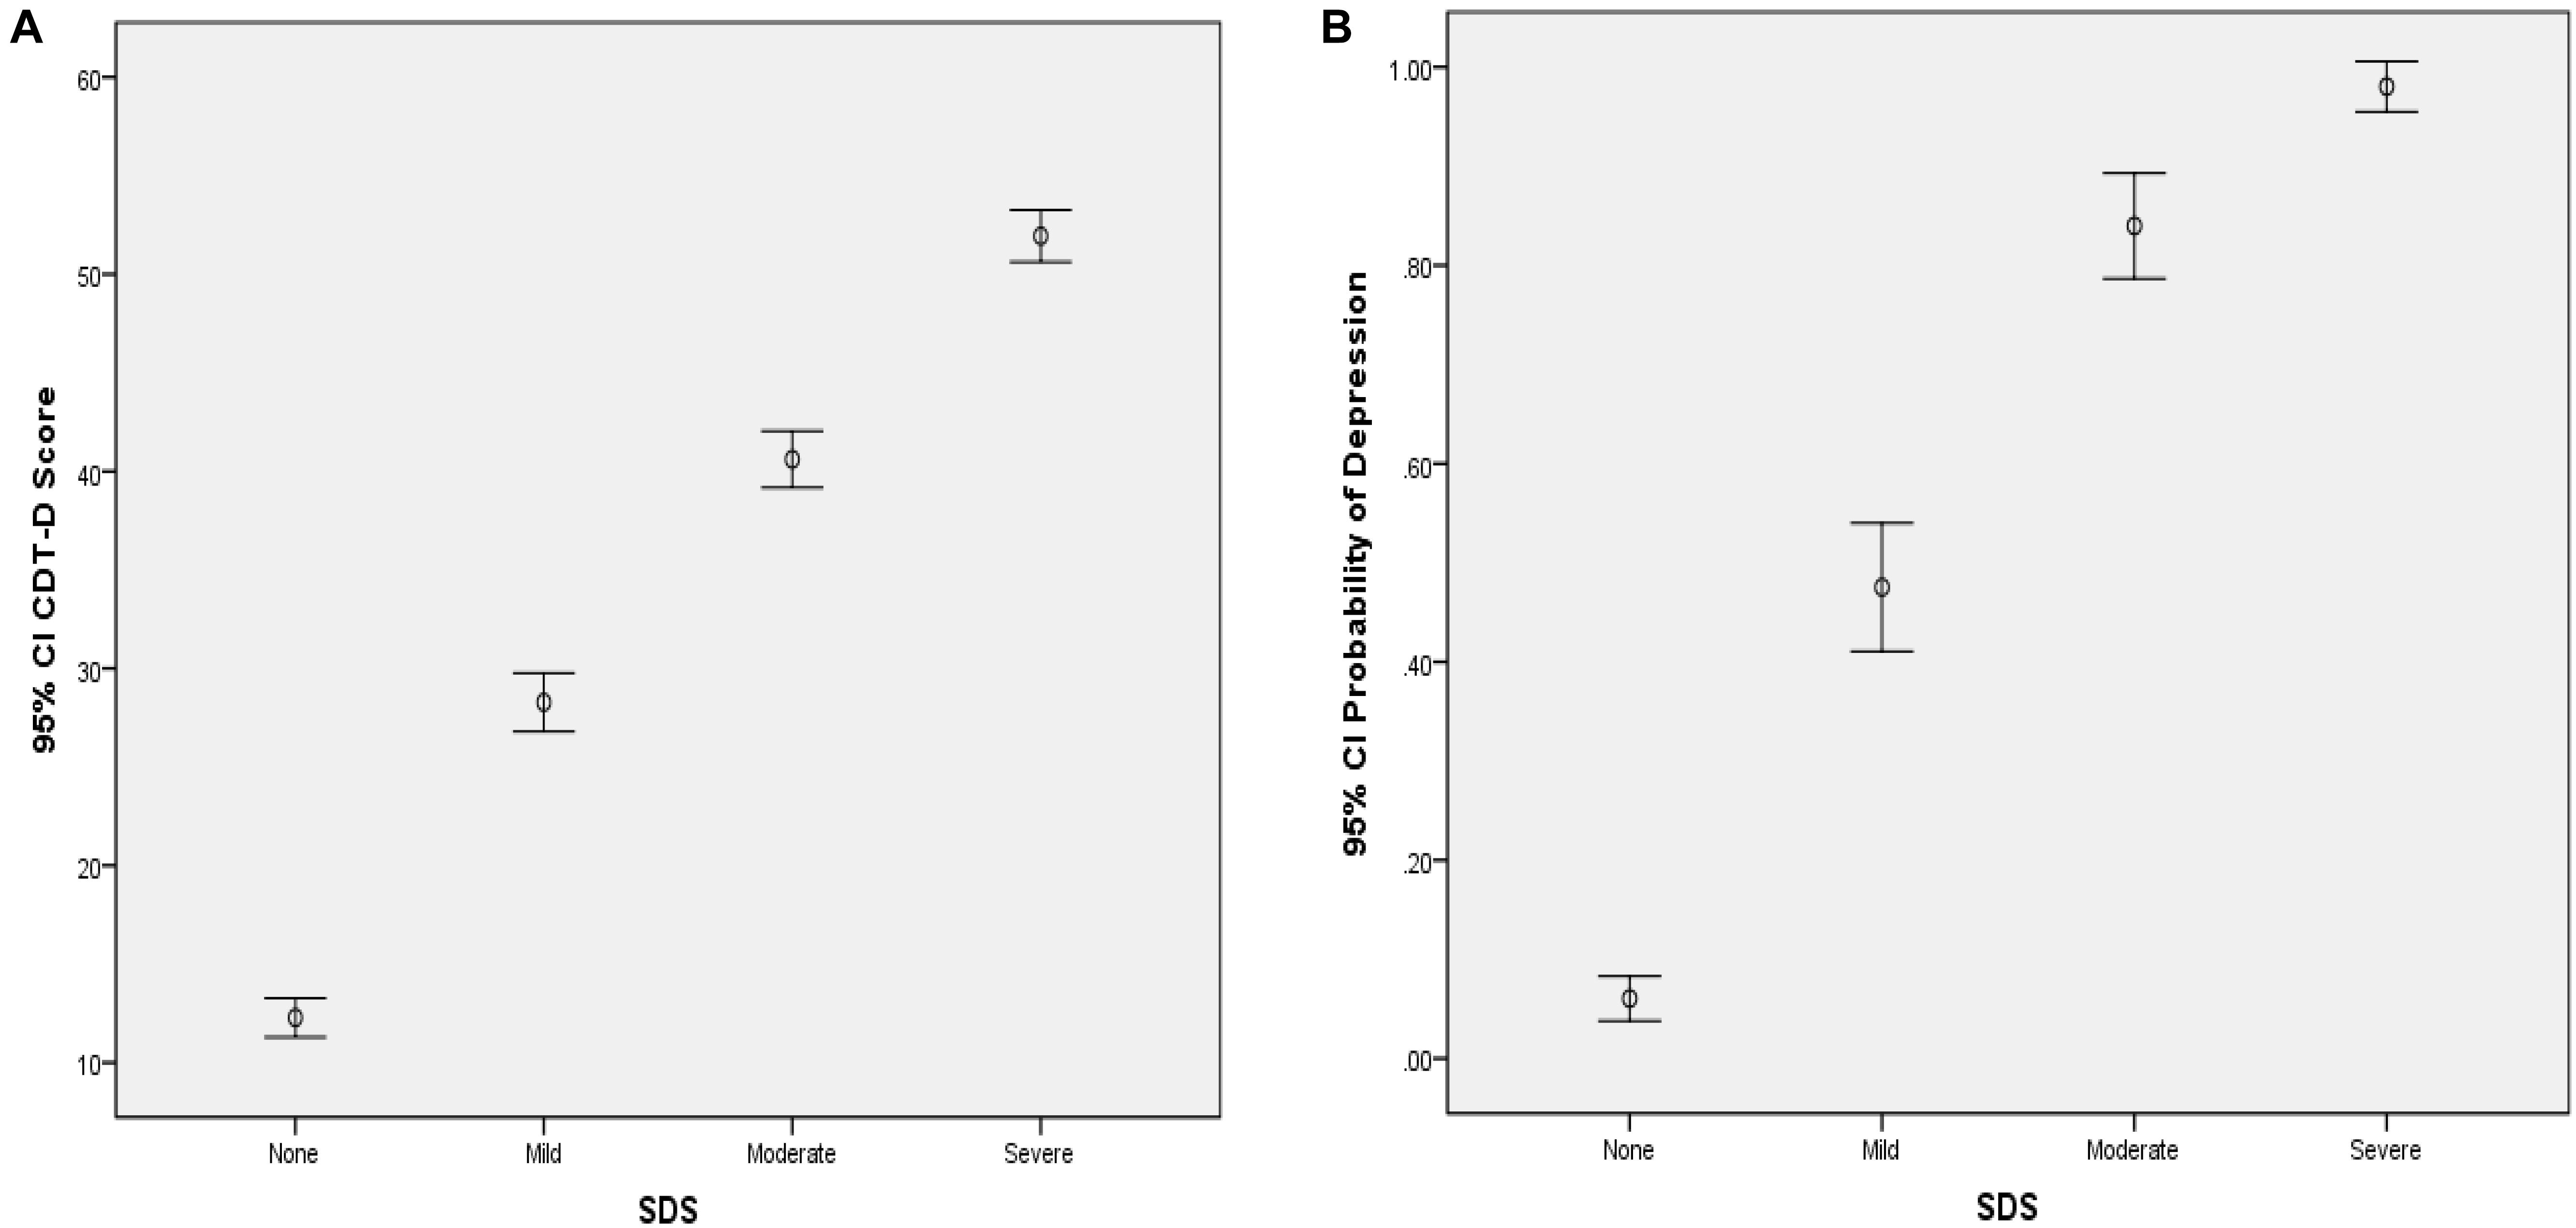
Figure 1. Error bar graph of the CDMs-D scores (A) and the probability of depressive disorder (B) for different groups via SDS. 95% CI, 95% confidence interval. The probability of depressive disorder (i.e., probability of mild, moderate and severe depression) was calculated based on the CDMs-D and the diagnostic criteria in ICD-10 via CDMs.
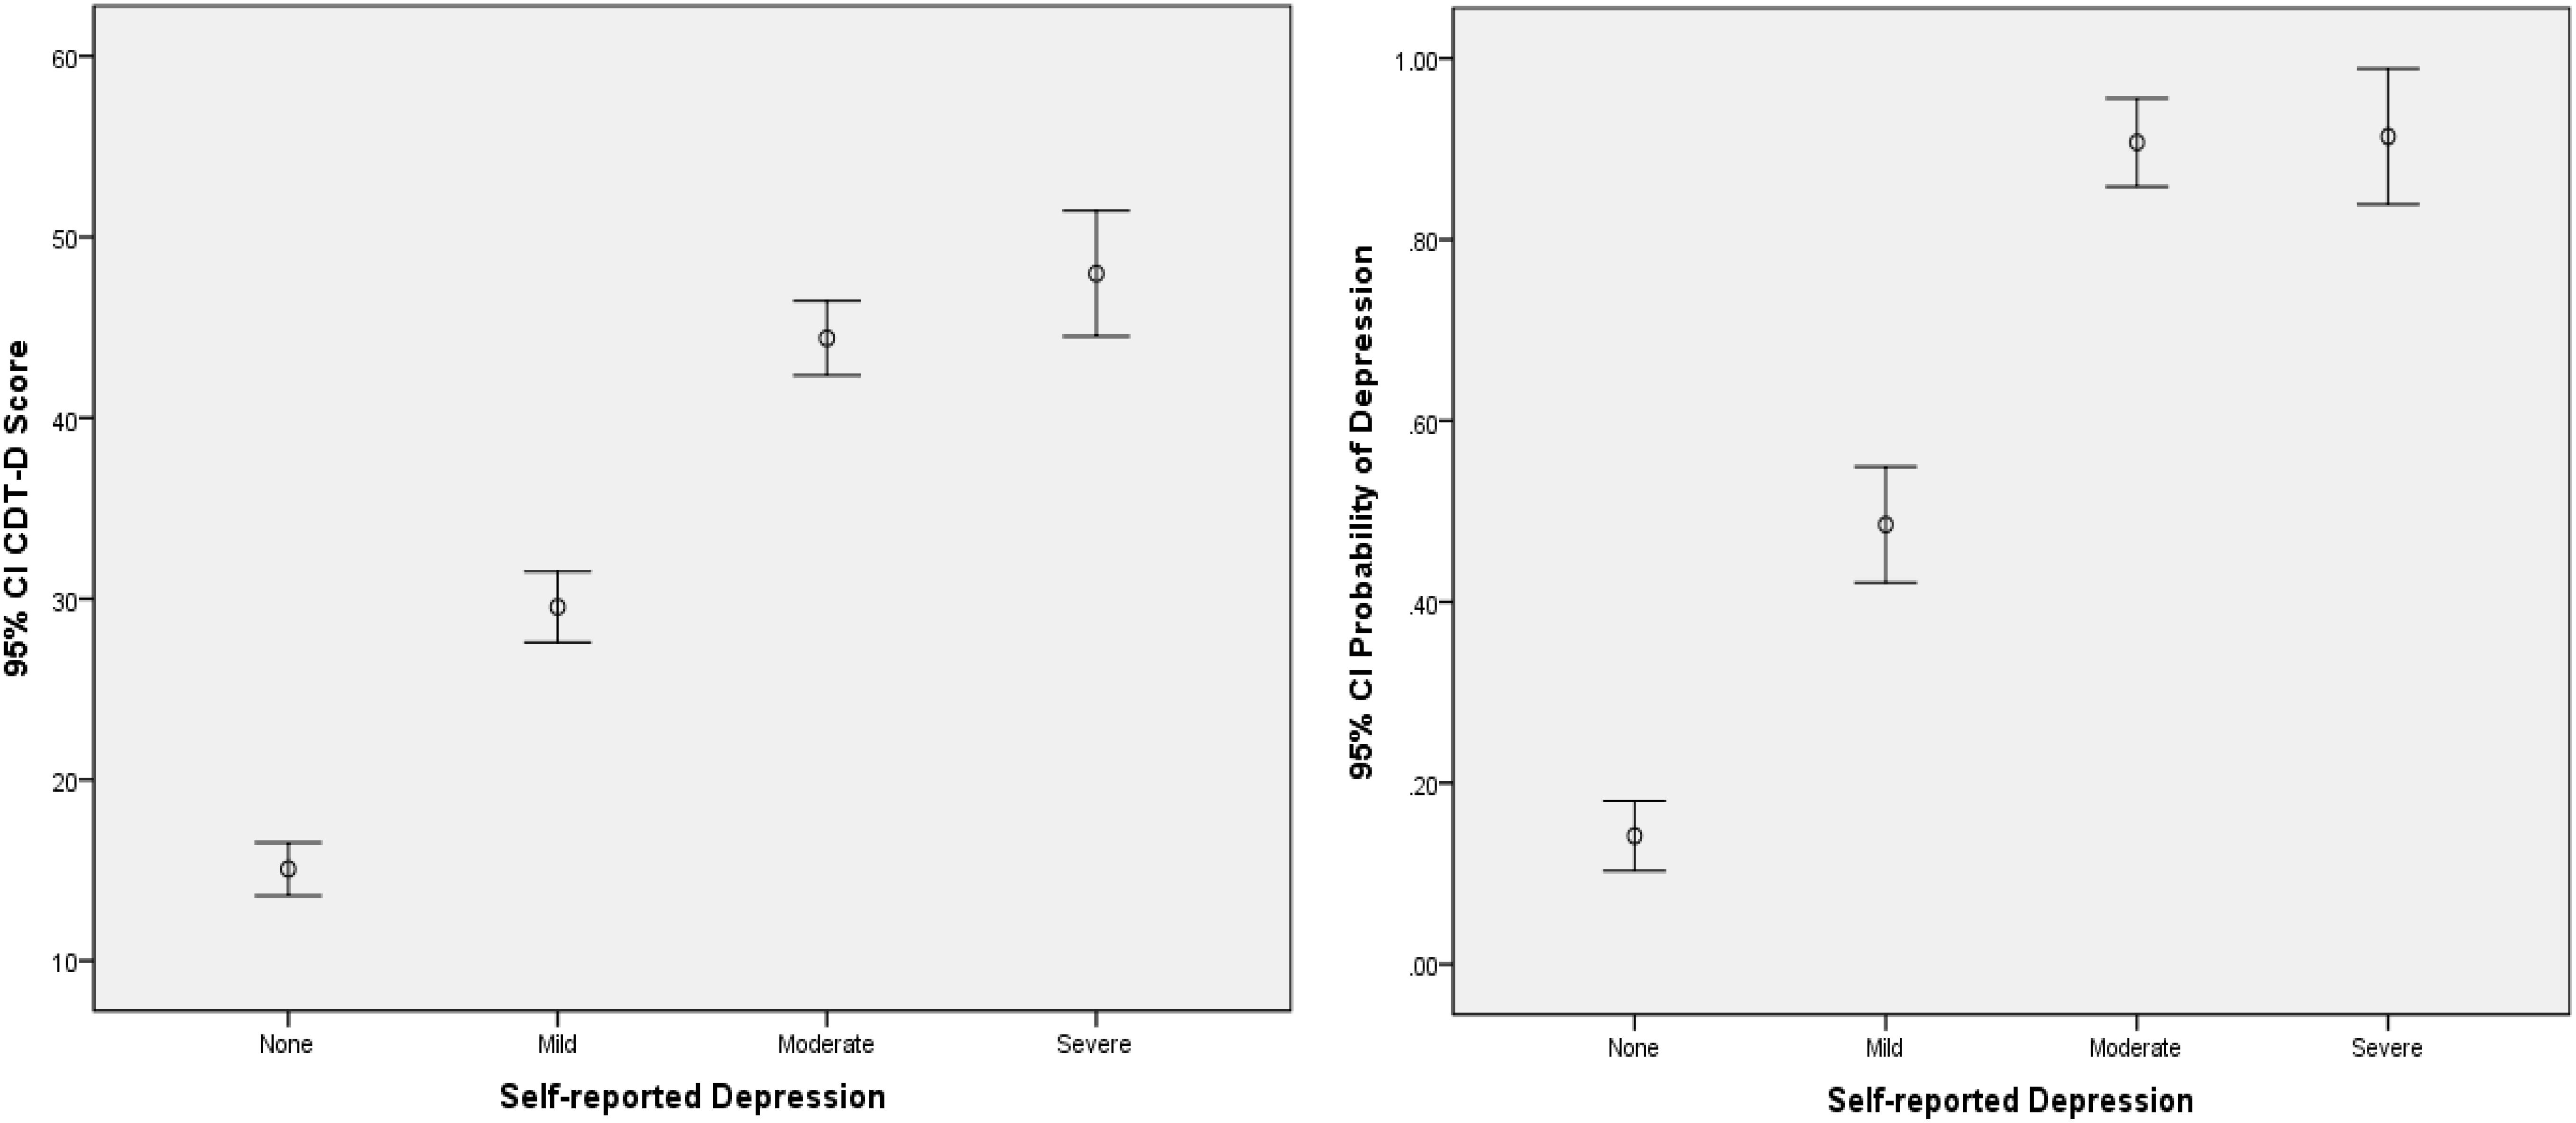
Figure 2. Error bar graph of the CDMs-D scores and the probability of depressive disorder for different groups via self-reported depression. 95% CI, 95% confidence interval. The probability of depressive disorder (i.e., probability of mild, moderate, and severe depression) was calculated based on the CDMs-D and the diagnostic criteria in ICD-10 via CDMs.
Screening Scores Reporting
Compared with existing instruments for depression, CDMs-D could provide unique screening information for each patient. For illustration, score reports for four individuals (three patients and one healthy individual) were displayed in Figure 3. Three patients were chosen in that: (1) they were classified as moderate depression by their psychotherapists; (2) they had the same SDS score and were defined as moderate depression via the criterion of SDS; (3) they reported that they usually had considerable difficulty in continuing with social, work or domestic activities. Figure 3 shows the posterior probability that each criterion has been satisfied for these individuals. Based on these probabilities, the chances of having mild, moderate or severe depression for each individual can be calculated.
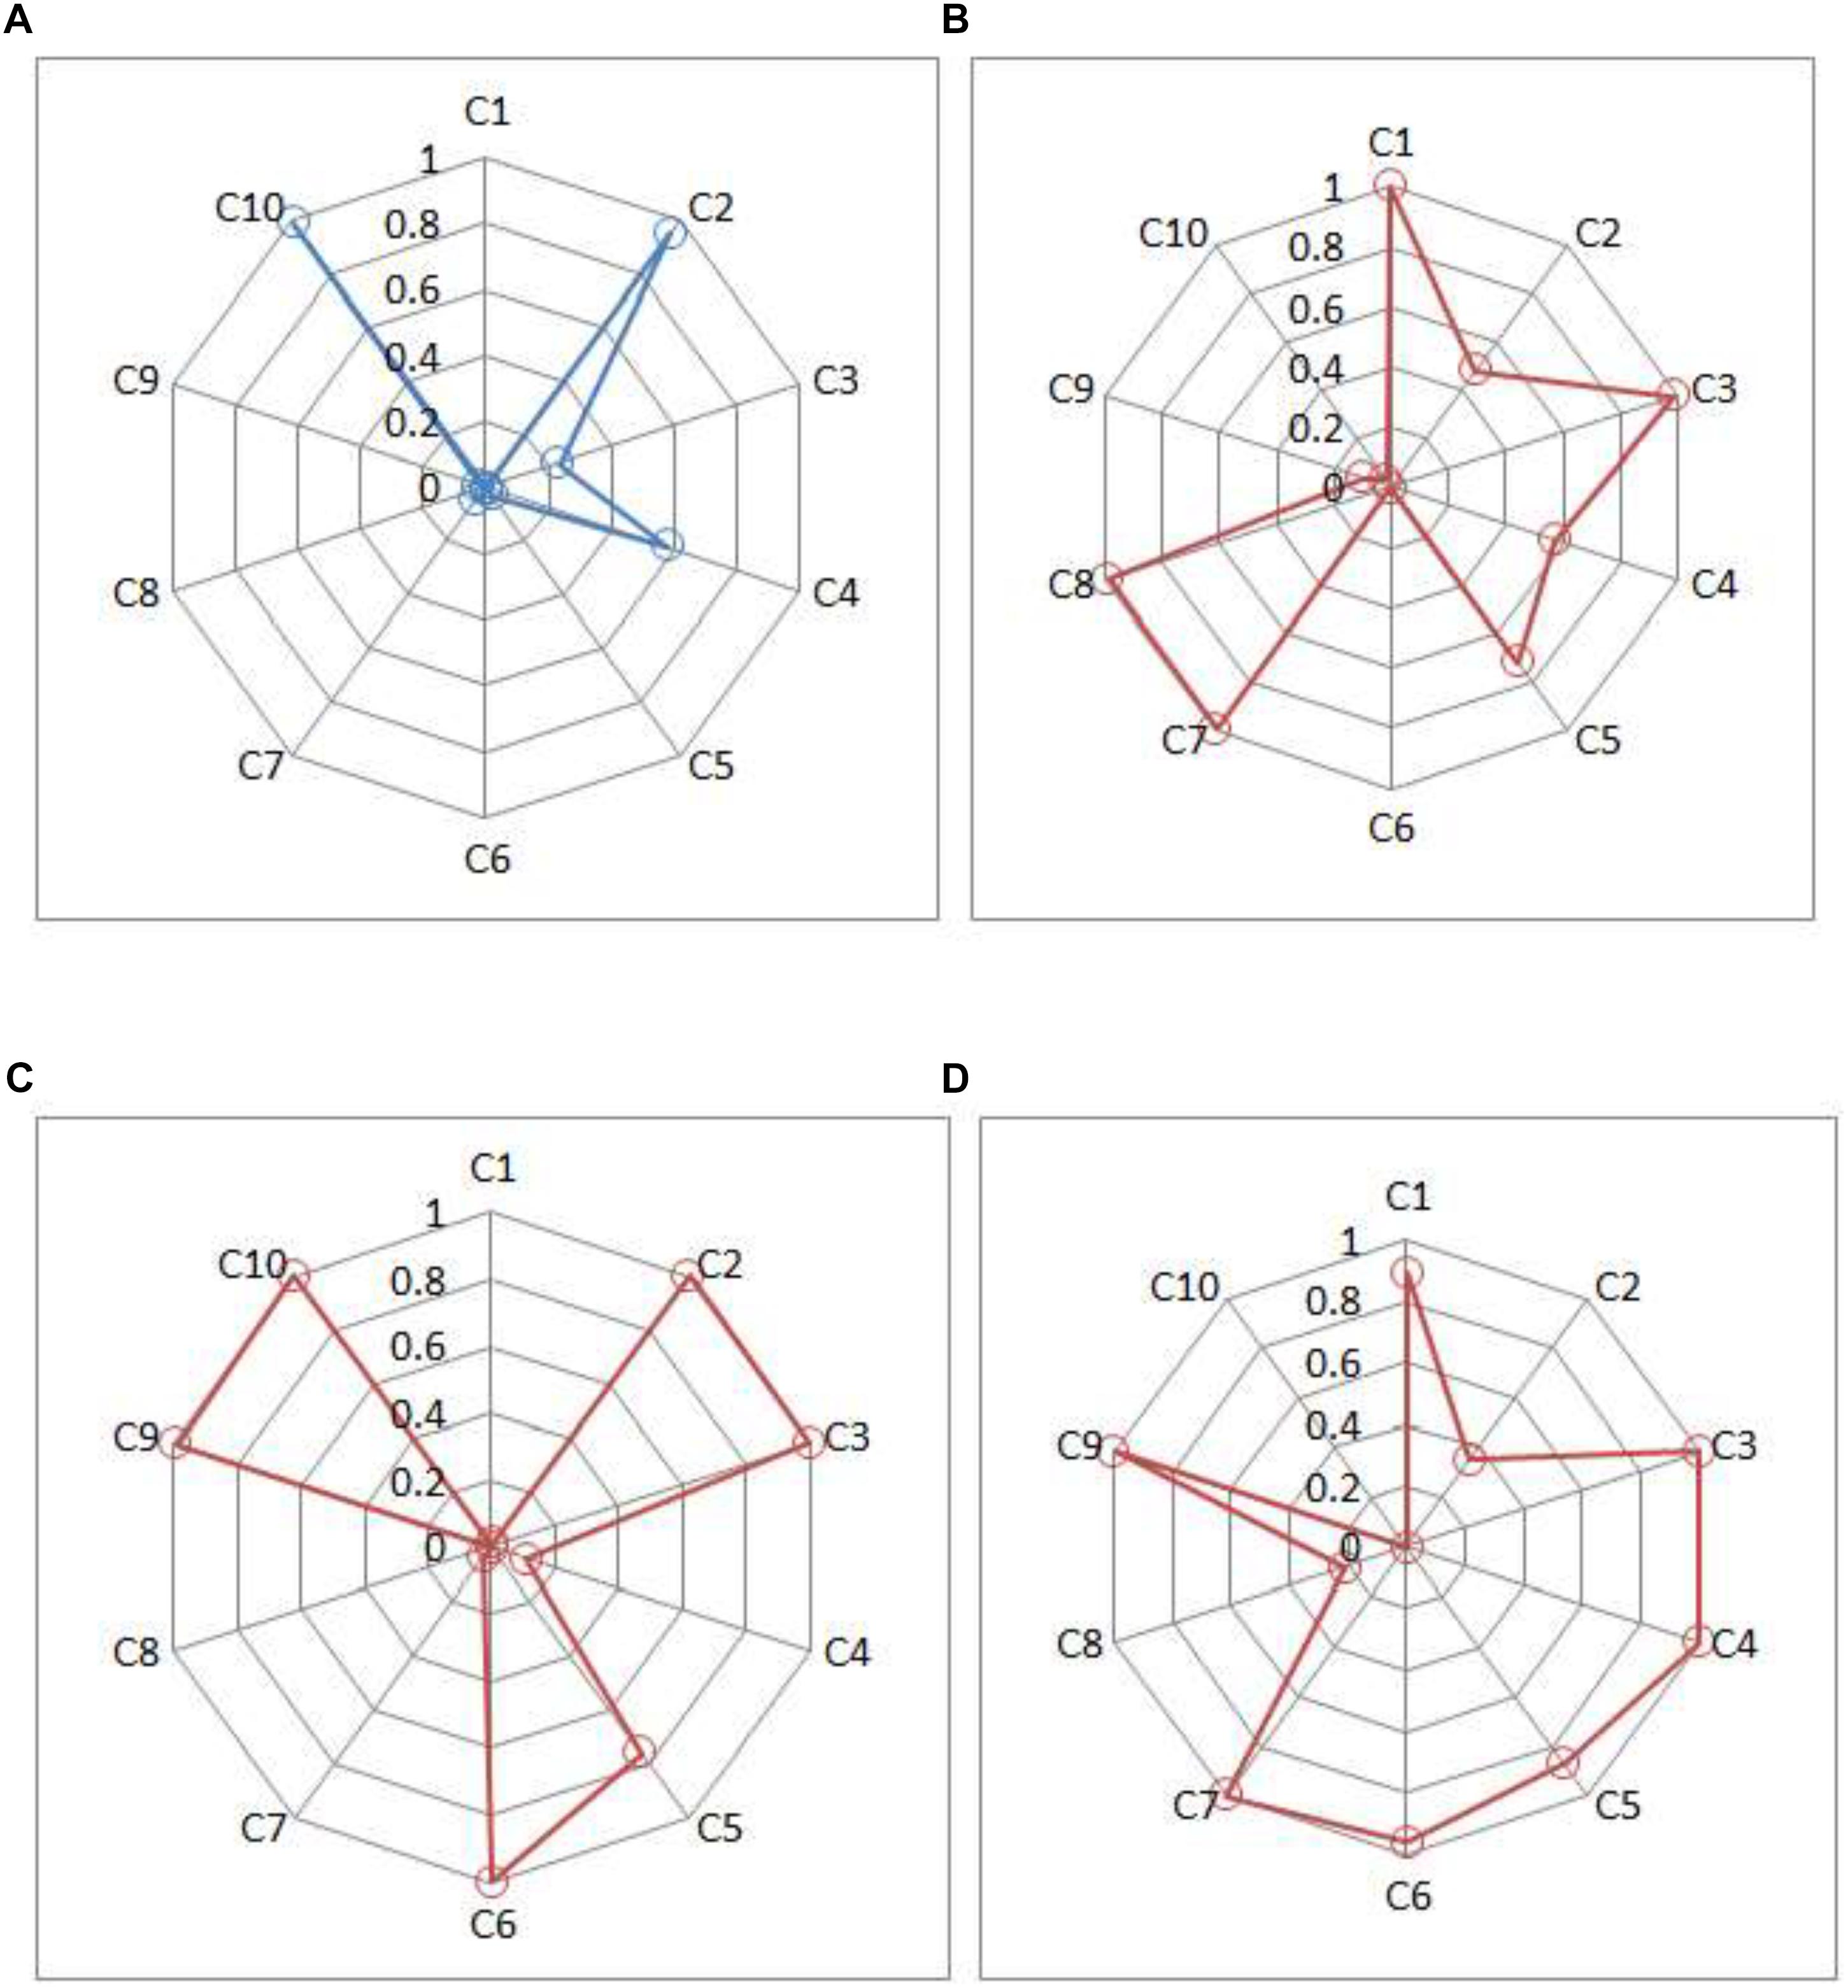
Figure 3. Symptom spectrum of depression for three patients and one healthy individual. (A) Individual A, (B) Patient B, (C) Patient C, and (D) Patient D. Criteria C1, C2, and C3 represent three typical symptoms; criteria C4–C10 represent seven common criteria in ICD-10 in Table 1.
Individual A (male, 25 years old and from rural) has very high posterior probabilities of satisfying the typical symptom C2 and the common symptoms C10. Based on ICD-10, the estimated probabilities of being normal, mild, moderate and severe depression are 0.81, 0.12, 0.06, and 0.01, respectively, which suggests that it is unlikely for him to have depressive disorder.
Patients B, C, and D are all classified as having moderate depressive disorder by the CDMs-D (with the estimated posterior probability of 0.99, 0.99, 0.63, respectively), which is consistent to the results of their psychotherapists and SDS. However, they differ in their symptom profiles. From Figure 3, Patient B (female, 23 years old and from rural) probably satisfies two typical symptoms (C1 and C3) and four common symptoms (C4, C5, C7, and C8); Patient C (male, 29 years old and from rural) probably satisfies two typical symptoms (C1 and C3) and four common symptoms (C5, C6, C9, and C10); and Patient D (male, 58 years old and from urban) probably satisfies two typical symptoms (C1 and C3) and five common symptoms (C4, C5, C6, C7, and C9). Additionally, it can be seen that Patient B has a very high posterior probability of having symptom C8 (ideas or acts of self-harm or suicide) but Patient C and Patient D have very low probabilities. The information of symptom spectrum of each individual as showed in Figure 3 give insight into tailoring individual-specific treatments for depression. For example, for Patient B, the targeted treatment should focus on decreasing the chance of having ideas or acts of self-harm or suicide, for Patient C the targeted treatment should aim to decrease the fatigability and improve the enjoyment, while for Patient D, helping her to establish a brief of bring future is very important for him.
Discussion and Conclusion
In this article, a new instrument for depression, the CDMs-D, is developed under the CDM framework based on ICD-10. This is the first study to measure the depressive disorder from the CDM perspective, though CDMs have been used as psychometric tools to analyze patient-reported outcomes, such as the pathological gambler in Templin and Henson (2006), neurocognitive functions in schizophrenia in Jaeger et al. (2006), internet addition in Tu et al. (2017) and the Millon Clinical Multiaxial Inventory-III in de la Torre et al. (2017). CDMs provide a set of psychometric tools to assess item properties, test reliability (Cui et al., 2012) and validity, and in this study, the CDMs-D with 56 items has been shown to have good reliability and validity. Comparing with the existing self-report measures (such as SDS, CES-D), one outstanding advantage of the new measure is that it measures all symptom criteria defined in the ICD-10 and can provide symptom level reports. In addition, the high correlation between the CDMs-D and SDS indicated that the general-level information of depression they provided were high consistent. However the CDMs-D can provide the additional symptom-level information of depression. This dues to that the CDMs have the unique feature that can provide rich information in terms of whether the participants have met each symptom and of estimating the probability of having mild, moderate, and severe depressive disorder. Such information tends to be superior to the decision made based on total scores from some existing questionnaire in that it is obtained according to the ICD-10.
The proposed measure also has some latent contributions for the specifically assessing/screening for ICD and DSM-based depression. For example, this proposed measure aims to screen and monitor ICD and DSM-based depression, therefore it may provide a beneficial supplement to a clinician, especially when the patients cannot clearly and directly report whether all the symptoms defined in DSM or ICD are present. Another latent contribution is that it may reduce the burden of a clinician when there are large subjects for screening or monitoring. Moreover, a patient can conveniently make a self-examination about ICD and DSM-based depression by using the CDMs-D. Finally, a clinician can use the information from the measure, the clinical interview and others together to make diagnosis.
It is the CDMs that make these inferences possible, but the CDMs need to be used with cautions. Unlike classical test theory, factor analysis and IRT models, CDMs typically assume that latent variables are binary (Rupp et al., 2010). Because of this assumption, CDMs lend themselves well to modeling symptoms for many disorders in psychiatry. However, it is reasonable to ask whether the symptoms are binary or not in nature. It should be noted that all psychometric models, including CDMs, are just approximations of the real world, and therefore, as long as the symptoms can be approximately treated as binary variables especially for the ICD and DSM-based assessment of depression, the inferences can be useful. Additionally, CDMs consider the complex interactions among latent binary variables (de la Torre, 2011; Templin and Bradshaw, 2014) (e.g., unobserved symptoms). This, on one hand, allows greater flexibility than most IRT models in modeling item responses; but, on the other hand, tends to make the model complex with, sometimes, too many parameters. This study considered simplifying the saturated CDM with all possible interactions to some reduced models with fewer parameters to obtain more stable parameter estimates. These analyses are important because, in general, a simpler model should be preferred to a complicated model if both fit data well.
Despite promising results, to unlock the potential of the CDMs, more research is needed. First, the current CDMs-D with 56 items is relatively long. It is important to consider a shorter version of CDMs-D to decrease patients’ test burden (Smiits et al., 2011). The computerized adaptive testing (CAT) may be an option to decrease the test length without a loss of measurement precision. Some research on combining CDM and CAT can be found in literature in the field of psychometrics (e.g., Cheng, 2009), but applications are lagging behind. Therefore, further research may empirical investigate how to amalgamate CDMs and CAT (CD-CAT; Cheng, 2009; Wang et al., 2011) to develop the CAT version of CDMs-D. Second, the outputs with probabilities of the proposed measure may be not familiar and accustomed for users. For example, this CDT-T may provide two types of probabilities: one is the probabilities of none depression, mild depression, moderate depression and severe depression, which add up to 100%; another is the probability of presence for each symptom. The former probabilities can be used as screening or monitoring while the latter probabilities can be used to investigate the symptoms characteristic for each patient. That is to say this measure can provide both general level and symptom level information. Third, this article considered the symptom criteria for depression defined in ICD-10, future research may explore whether it is appropriate to use the criteria defined in DSM-5. Fourth, future study should compare the CDMs-D and the structured interview protocols based on either the ICD-10 or the DSM-5. Fifth, except of results in CDMs-D, other evidences such as a structured clinical interview should also be taken full consideration to give a diagnosis of depression. Sixth, there are also some commonly used dimensional measures of depression that are not included in this article, therefore more measures should be considered for future study. Last, the selected CDMs in this study involve a large number of parameters. The sample used for test calibration may not be large enough and therefore, some statistical procedures such as the Wald test for model selection and DIF detection may be affected due to poorly estimated covariance matrix (Philipp et al., 2017). Larger sample should be considered to stabilize the parameter estimation.
Data Availability
The raw data supporting the conclusions of this manuscript will be made available by the authors, without undue reservation, to any qualified researcher.
Ethics Statement
This study was carried out in accordance with the recommendations of ethics committee of Center for Mental Health Education and Research of Jiangxi Normal University with written informed consent from all subjects. All subjects gave written informed consent in accordance with the Declaration of Helsinki. The protocol was approved by the ethics committee of Center for Mental Health Education and Research of Jiangxi Normal University.
Author Contributions
DW contributed to thesis writing and code writing. XG processed the data. YC performed to guide the data processing and code writing. DT contributed to guide the thesis writing and code writing.
Funding
This work was supported by the National Natural Science Foundation of China (31660278 and 31760288), and the graduate student innovation fund of Jiangxi Normal University (YC2018-B025).
Conflict of Interest Statement
The authors declare that the research was conducted in the absence of any commercial or financial relationships that could be construed as a potential conflict of interest.
References
American Psychiatric Association [APA] (2013). Diagnostic and Statistical Manual of Mental Disorders. 5th Edn. Arlington, VA: American Psychiatric Publishing.
Beck, A. T., Ward, C. H., Mendelson, M., Mock, J., and Erbaugh, J. (1961). An inventory for measuring depression. Arch. Gen. Psychiatry 4, 561–571. doi: 10.1001/archpsyc.1961.01710120031004
Carroll, B. J., Feinberg, M., Smouse, P. E., Rawson, S. G., and Greden, J. F. (1981). The Carroll rating scale for depression. I. Development, reliability and validation. Br. J. Psychiatry J. Men. Sci. 138, 194–200. doi: 10.1192/bjp.138.3.194
Cheng, Y. (2009). When cognitive diagnosis meets computerized adaptive testing: CD-CAT. Psychometrika 74, 619–632. doi: 10.1007/s11336-009-9123-2
R Core Team (2016). R: A Language and Environment for Statistical Computing. Vienna: R foundation for Statistical Computing.
Cox, J. L., Holden, J. M., and Sagovsky, R. (1987). Detection of postnatal depression. development of the 10-item Edinburgh postnatal depression scale. Br. J. Psychiatry J. Men. Sci. 150, 782. doi: 10.1192/bjp.150.6.782
Cui, Y., Gierl, M. J., and Chang, H. H. (2012). Estimating classification consistency and accuracy for cognitive diagnostic assessment. J. Educ. Meas. 49, 19–38. doi: 10.1111/j.1745-3984.2011.00158.x
de la Torre, J. (2008). An empirically based method of Q-matrix validation for the DINA model: development and applications. J. Educ. Meas. 45, 343–362. doi: 10.1111/j.1745-3984.2008.00069.x
de la Torre, J. (2011). The generalized DINA model framework. Psychometrika 76, 179–199. doi: 10.1007/s11336-011-9207-7
de la Torre, J., van der Ark, A., and Rossi, G. (2017). Analysis of clinical data form cognitive diagnosis modeling framework. Meas. Eval. Counsel. Dev. 1, 1–16.
Dennis, C. L., Brown, H. K., and Morrell, J. (2016). Interventions (Other Than Psychosocial, Psychological and Pharmacological) for Preventing Postpartum Depression. Hoboken, NJ: John Wiley & Sons, Ltd.
Dennis, C. L., and Hodnett, E. (2014). Psychosocial and psychological interventions for treating postpartum depression. Cochrane Database Syst. Rev. 89:92.
Gibbons, R. D., Weiss, D. J., Pilkonis, P. A., Frank, E., Moore, T., Kim, J. B., et al. (2012). Development of a computerized adaptive test for depression. Arch. Gen. Psychiatry 69, 1104–1112.
Hartz, S., Roussos, L., and Stout, W. (2002). A Bayesian Framework for the Unified Model for Assessing Cognitive Abilities: Blending Theory with Practicality. doctoral dissertation. Champaign: University of Illinois at Urbana.
Hathaway, S. R., and McKinley, J. C. (1942). A multiphasic personality schedule (Minnesota): III. The measurement of symptomatic depression. J. Psychol. 14, 73–84. doi: 10.1080/00223980.1942.9917111
Hou, L., de la Torre, J., and Nandakumar, R. (2014). Differential item functioning assessment in cognitive diagnostic modeling: application of the Wald test to investigate DIF in the DINA Model. J. Educ. Meas. 51, 98–125. doi: 10.1111/jedm.12036
Huang, G. Y., Zhang, B. S., Wu, Y. Y., Ye, Y. X., and Zhan, J. Z. (2004). Adolescent Depression Emotion Self-Assessment Scale. Taipei: Dong’s Foundation.
Jaeger, J., Tatsuoka, C., Berns, S. M., and Varadi, F. (2006). Distinguishing neurocognitive functions using partially ordered classification models. Schizophrenia Bull. 32, 679–691. doi: 10.1093/schbul/sbj038
Junker, B. M., and Sijtsma, K. (2001). Cognitive assessment models with few assumptions, and connections with nonparametric item response theory. Appl. Psychol. Meas. 25, 258–272. doi: 10.1177/01466210122032064
Koenig, H. G., Cohen, H. J., Blazer, D. G., Meador, K. G., and Westlund, R. (1992). A brief depression scale for use in the medically ill. Int. J. Psychiatry Med. 22:183.
Kroenke, K., Spitzer, R. L., and Williams, J. B. (2001). The PHQ-9: validity of a brief depression severity measure. J. Gen. Intern. Med. 16:606. doi: 10.1046/j.1525-1497.2001.016009606.x
Ma, W., and de la Torre, J. (2016). GDINA: The Generalized DINA model framework. R Package GDINA (version 0.9.9.8).
Ma, W., Iaconangelo, C., and de la Torre, J. (2016). Model similarity, model selection, and attribute classification. Appl. Psychol. Meas. 40, 200–217. doi: 10.1177/0146621615621717
Maris, E. (1999). Estimating multiple classification latent class models. Psychometrika 64, 187–212. doi: 10.1007/bf02294535
Orlando, M., and Thissen, D. (2000). Likelihood-based item-fit indices for dichotomous item response theory models. Appl. Psychol. Meas. 24, 50–64. doi: 10.1177/01466216000241003
Philipp, M., Strobl, C., de la Torre, J., and Zeileis, A. (2017). On the estimation of standard errors in cognitive diagnosis models. J. Educ. Behav. Stat. 43, 88–115. doi: 10.3102/1076998617719728
Radloff, L. S. (1977). The CES-D scale: a self-report depression scale for research in the general population. Appl. Psychol. Meas. 1, 385–401. doi: 10.1177/014662167700100306
Rupp, A. A., Templin, J. L., and Henson, R. A. (2010). Diagnostic Measurement: Theory, Methods, and Applications. New York, NY: The Gilford Press.
Smiits, N., Cuijpers, P., and van Straten, Q. (2011). Applying computerized adaptive testing to the CES-D scale: a simulation study. Psychiatry Res. 188, 147–155. doi: 10.1016/j.psychres.2010.12.001
Templin, J., and Bradshaw, L. (2014). Hierarchical diagnostic classification models: a family of models for estimating and testing attribute hierarchies. Psychometrika 79, 317–339. doi: 10.1007/s11336-013-9362-0
Templin, J. L., and Bradshaw, L. (2013). Measuring the reliability of diagnostic classification model examinee estimates. J. Class. 30, 251–275. doi: 10.1167/iovs.10-5468
Templin, J. L., and Henson, R. A. (2006). Measurement of psychological disorders using cognitive diagnosis models. Psychol. Methods 11, 287–305. doi: 10.1037/1082-989x.11.3.287
Tu, D. B., Gao, X. L., Wang, D. X., and Cai, Y. (2017). A new measurement of internet addiction using diagnostic classification models. Front. Psychol. 8:1–9. doi: 10.3389/fpsyg.2017.01768
Wang, C., Chang, H. H., and Huebner, A. (2011). Restrictive stochastic item selection methods in cognitive diagnostic computerized adaptive testing. J. Educ. Meas. 48, 255–273. doi: 10.1111/j.1745-3984.2011.00145.x
World Health Organization [WHO] (2010). The ICD-10 Classification of Mental and Behavioural Disorders: Clinical Descriptions and Diagnostic Guidelines. Geneva: World Health Organization.
Keywords: psychological measurement, cognitive diagnosis models, symptom criteria-level information, psychometrics, questionnaires, depression
Citation: Wang D, Gao X, Cai Y and Tu D (2019) Development of a New Instrument for Depression With Cognitive Diagnosis Models. Front. Psychol. 10:1306. doi: 10.3389/fpsyg.2019.01306
Received: 18 February 2019; Accepted: 20 May 2019;
Published: 04 June 2019.
Edited by:
Elisa Pedroli, Istituto Auxologico Italiano (IRCCS), ItalyReviewed by:
Klaas Wardenaar, University Medical Center Groningen, Netherlands>Roger Muñoz Navarro, University of Valencia, Spain
Copyright © 2019 Wang, Gao, Cai and Tu. This is an open-access article distributed under the terms of the Creative Commons Attribution License (CC BY). The use, distribution or reproduction in other forums is permitted, provided the original author(s) and the copyright owner(s) are credited and that the original publication in this journal is cited, in accordance with accepted academic practice. No use, distribution or reproduction is permitted which does not comply with these terms.
*Correspondence: Xuliang Gao, gaoxuliang881@qq.com; Yan Cai, cy19791233@aliyun.com; Dongbo Tu, tudongbo@aliyun.com